Embed Size (px)
Citation preview
Next release: 10 August 2018
April
Next release: 10 August 2018
Monthly Oil Statistics Date of publication: 12 July 2018
TABLE OF CONTENTS
Charts 1 Indigenous production of crude, NGL and feedstocks by OECD Region 3
2 Refinery gross output by OECD Region 4
3 OECD oil deliveries by main product group 4
Notes Estimated data 5
Country notes 5
Table 1 Total OECD: Crude oil, NGL and refinery feedstocks supply 7
Total OECD: Total products supply 7
Table 2 Indigenous production of crude oil, NGL and refinery feedstocks 8
Tables 3 Imports of crude oil, NGL and refinery feedstocks
3.1 Total OECD 9
3.2 OECD Americas 10
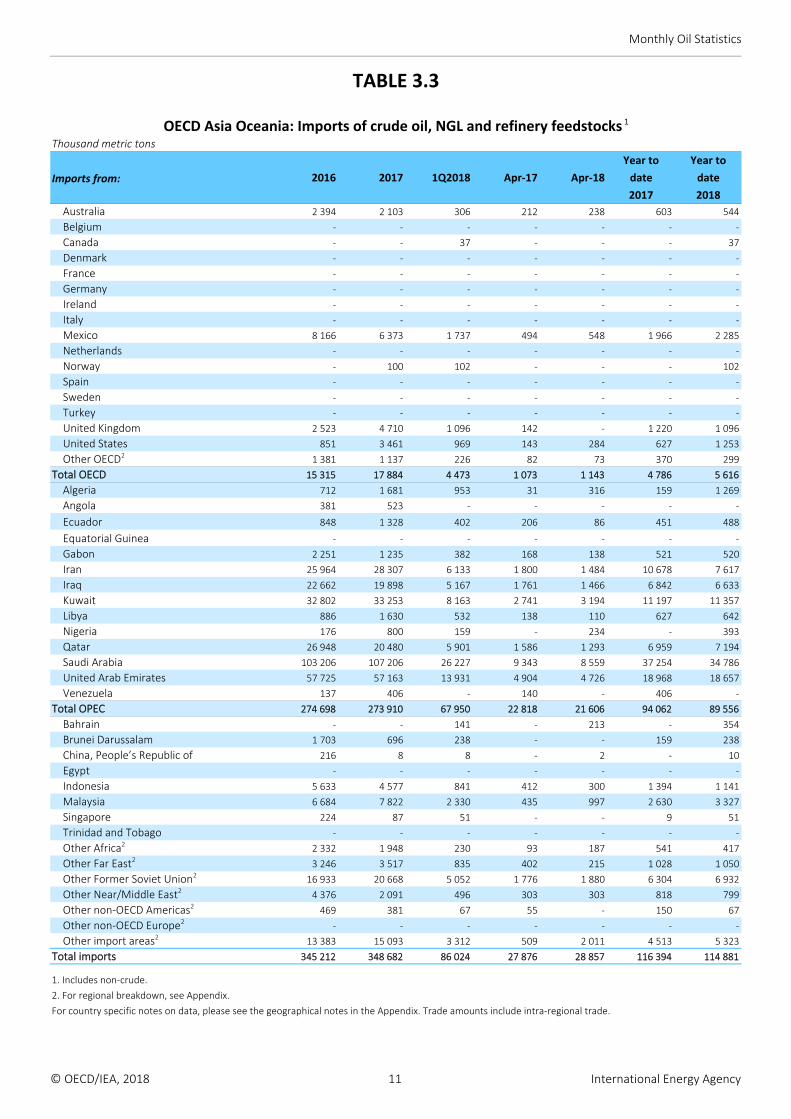
3.3 OECD Asia Oceania 11
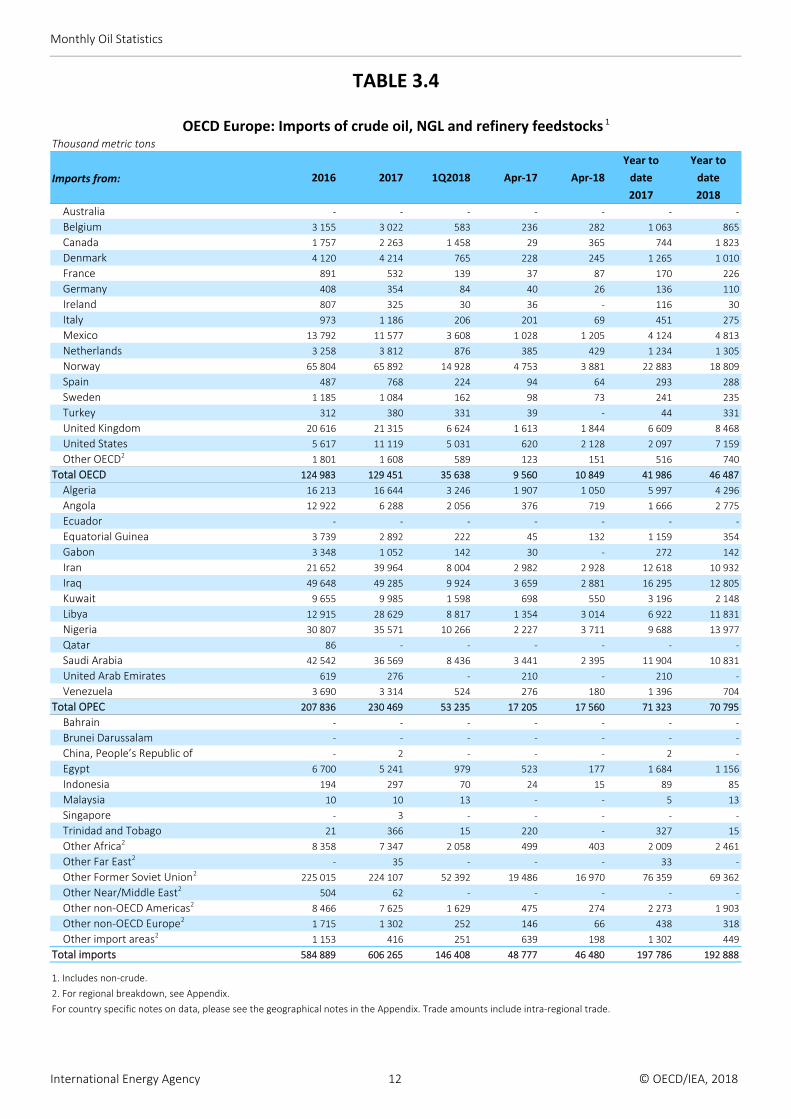
3.4 OECD Europe 12
Tables 4 Imports of total products
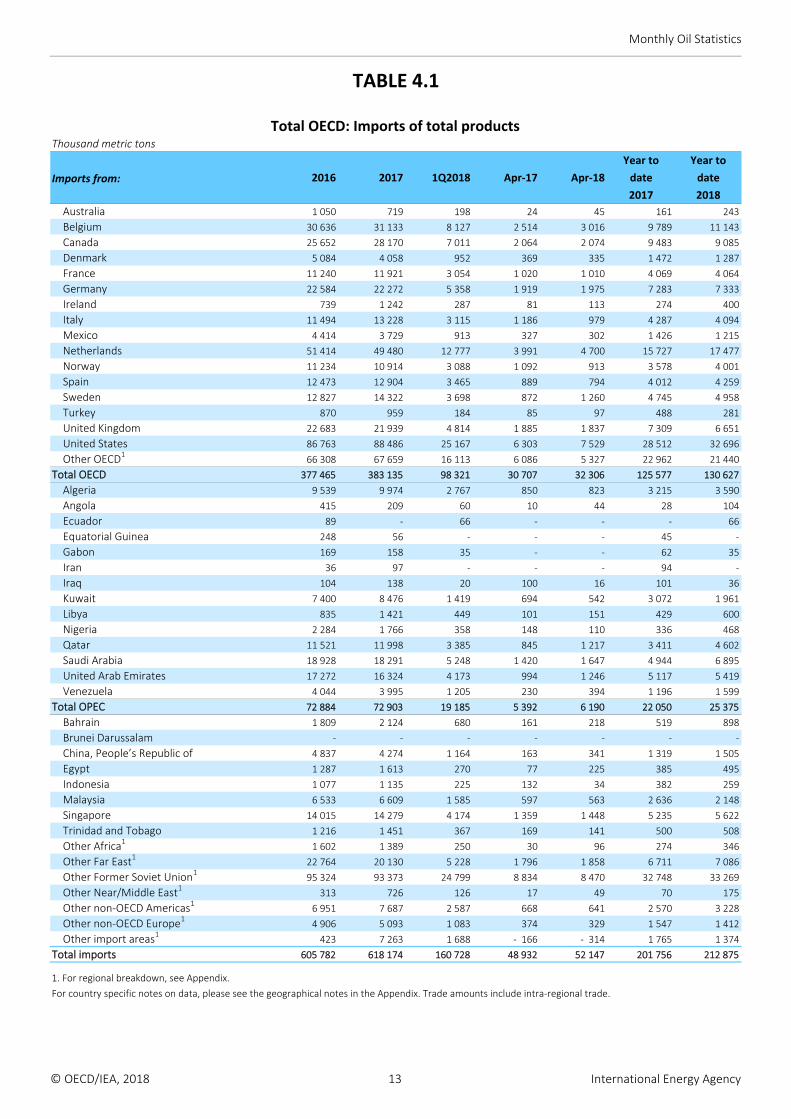
4.1 Total OECD 13
4.2 OECD Americas 14
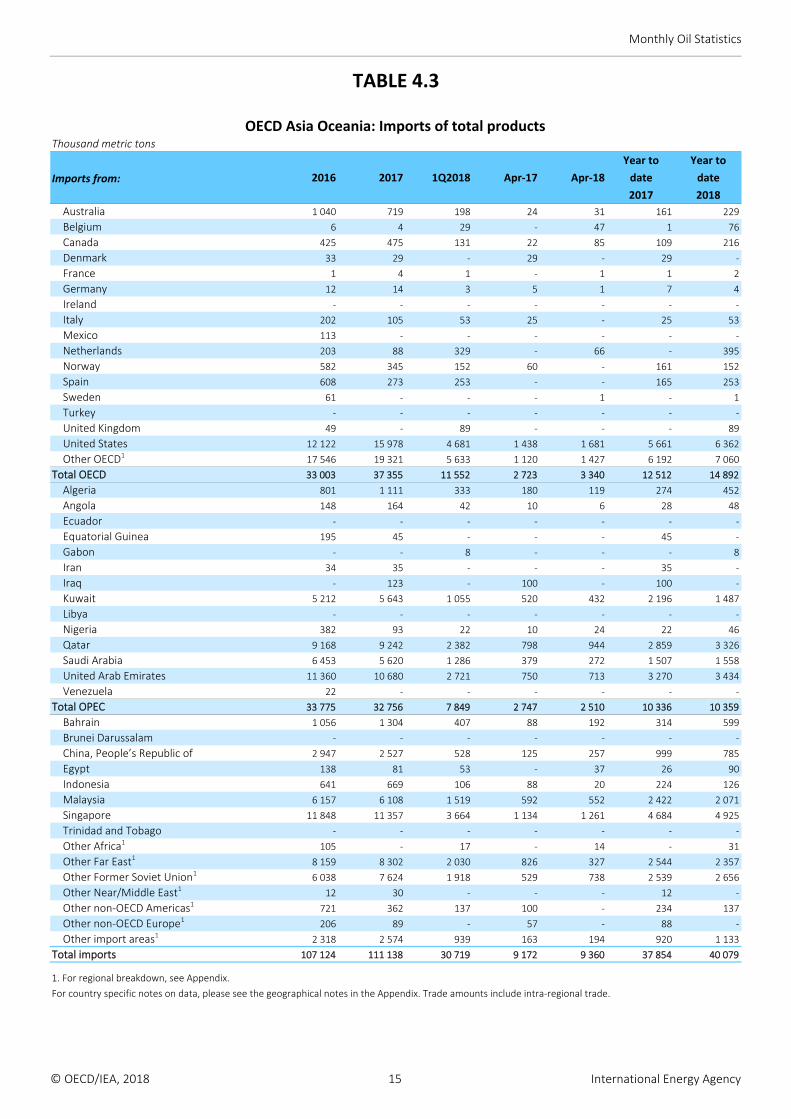
4.3 OECD Asia Oceania 15
4.4 OECD Europe 16
Table 5 Total OECD: Imports of total gasoline, middle distillates and residual fuel oil 17
Table 6 Total OECD: Exports of crude oil, NGL and refinery feedstocks 18
Total OECD: Exports of total products 18
Table 7 Refinery gross output in OECD Regions 19
Tables 8 Net deliveries
8.1 Regional summary 20
8.2 Australia ‐ Chile 21
8.3 Czech Republic ‐ France 22
8.4 Germany ‐ Ireland 23
8.5 Israel ‐ Luxembourg 24
8.6 Mexico ‐ Poland 25
8.7 Portugal ‐ Sweden 26
8.8 Switzerland ‐ United States 27
Tables 9 Closing stock levels on national territory
9.1 Total oil 28
9.2 Crude oil, NGL and refinery feedstocks 29
9.3 Total products 30
9.4 Total gasoline 31
9.5 Middle distillates 32
9.6 Residual fuel oil 33
Table 10 Stock changes for major product categories in April 2018 against March 2018 34
Appendix Geographical notes 36
International Energy Agency 2 © OECD/IEA, 2018
Monthly Oil Statistics
CHART 1
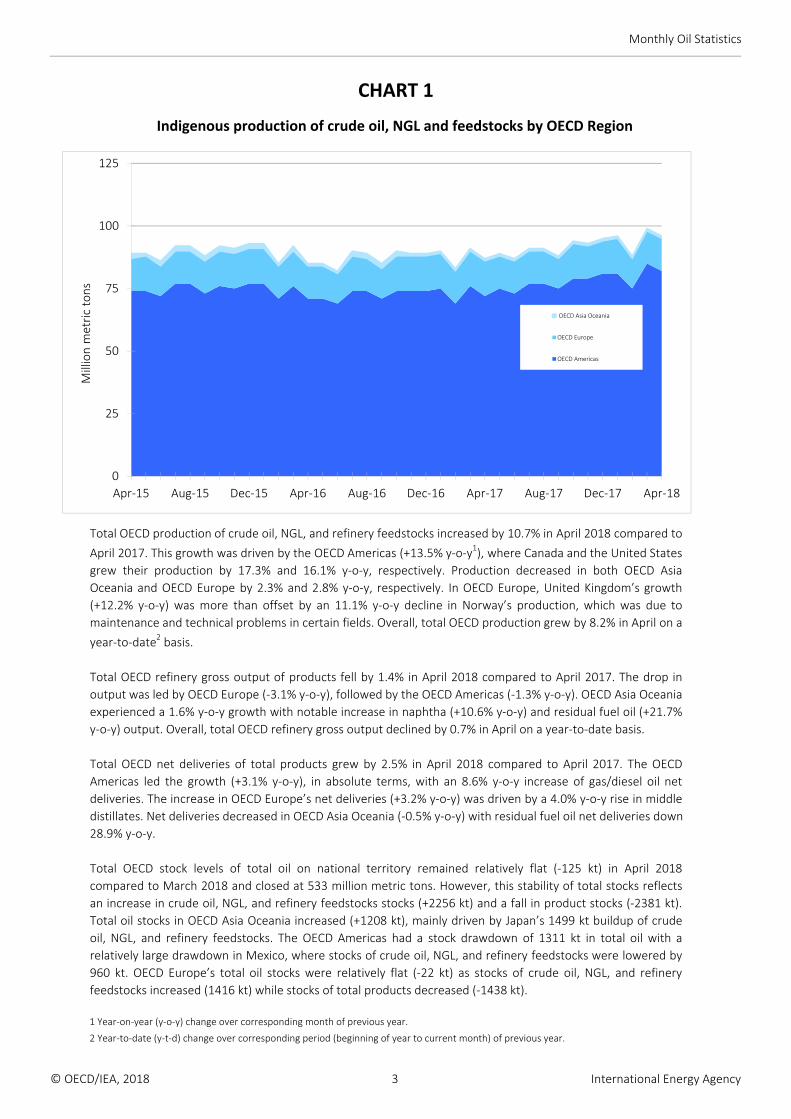
Indigenous production of crude oil, NGL and feedstocks by OECD Region
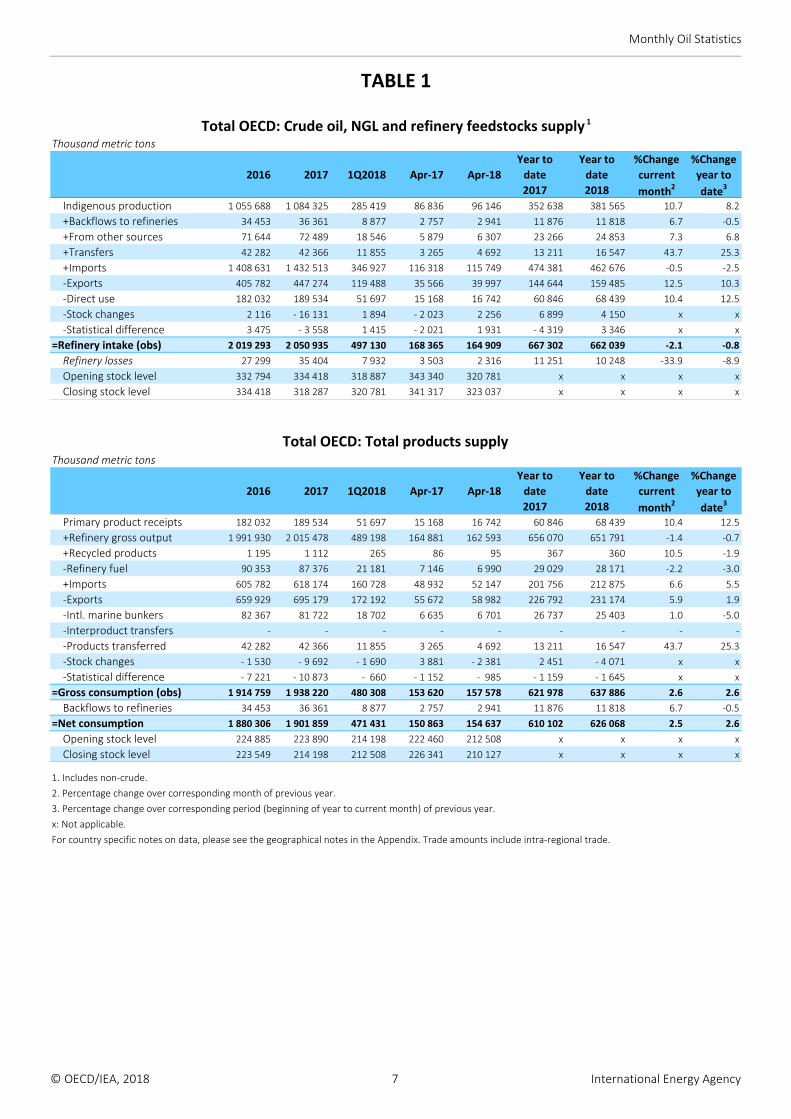
Total OECD production of crude oil, NGL, and refinery feedstocks increased by 10.7% in April 2018 compared to
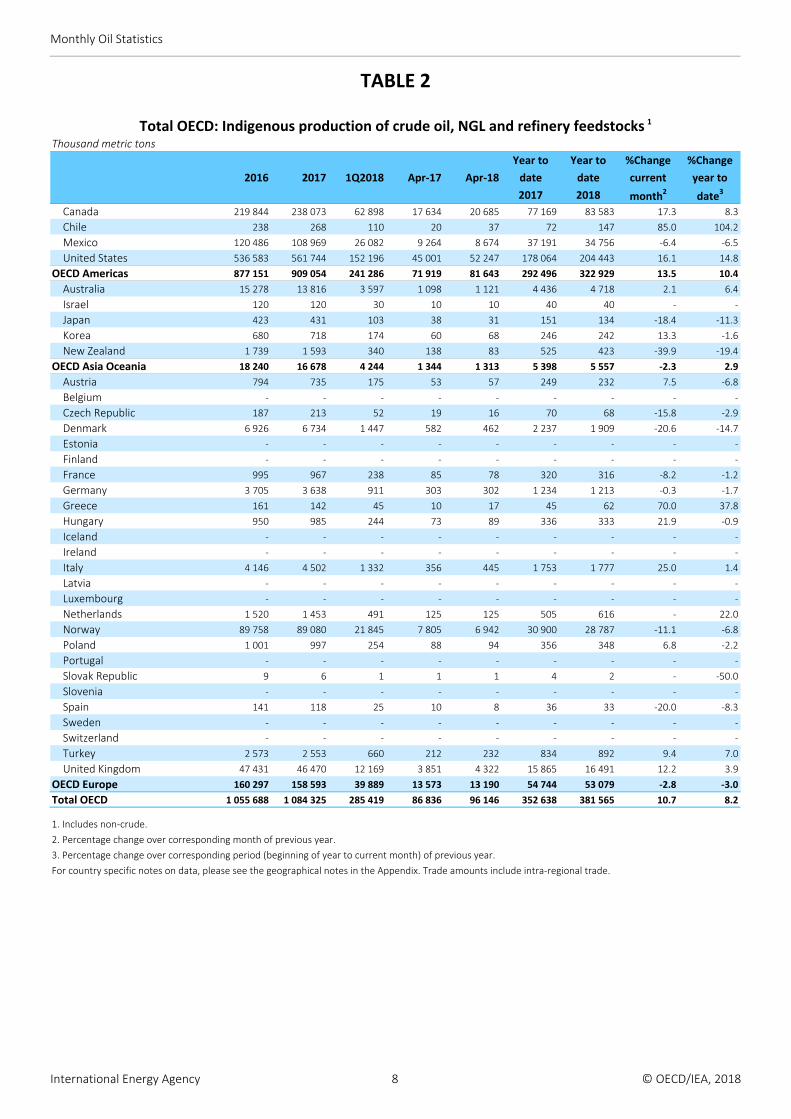
April 2017. This growth was driven by the OECD Americas (+13.5% y‐o‐y1), where Canada and the United States
grew their production by 17.3% and 16.1% y‐o‐y, respectively. Production decreased in both OECD Asia
Oceania and OECD Europe by 2.3% and 2.8% y‐o‐y, respectively. In OECD Europe, United Kingdom’s growth
(+12.2% y‐o‐y) was more than offset by an 11.1% y‐o‐y decline in Norway’s production, which was due to
maintenance and technical problems in certain fields. Overall, total OECD production grew by 8.2% in April on a
year‐to‐date2 basis.
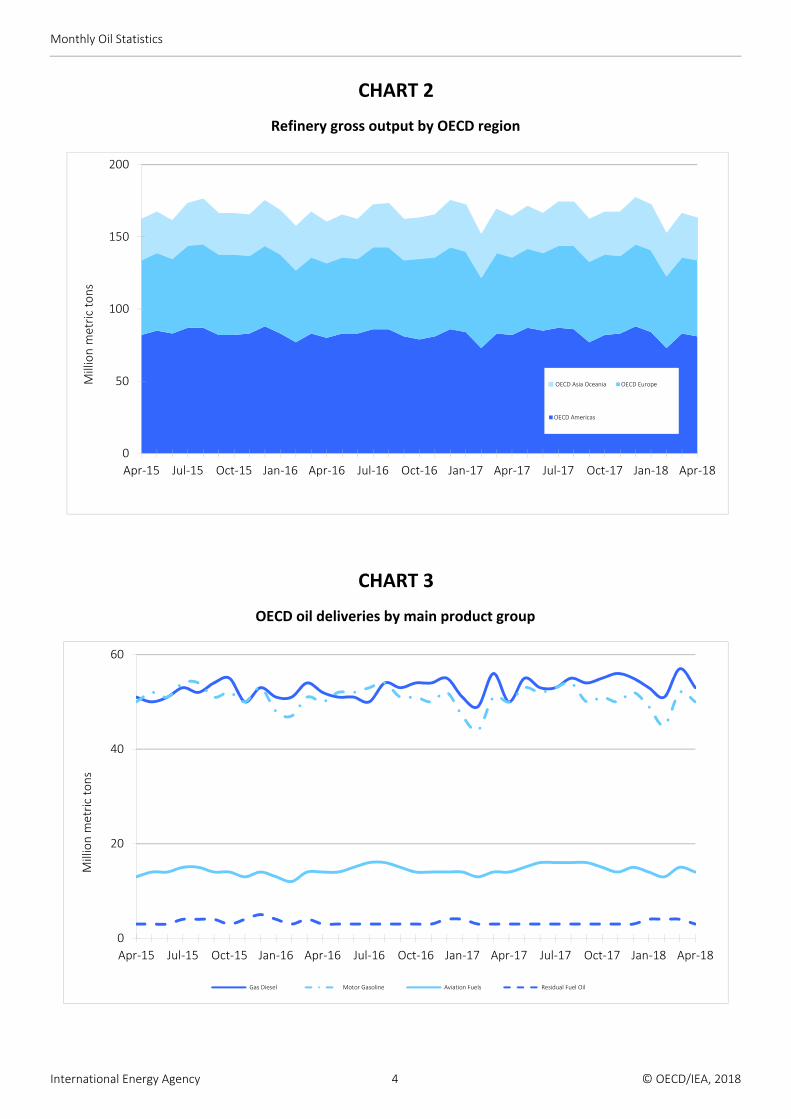
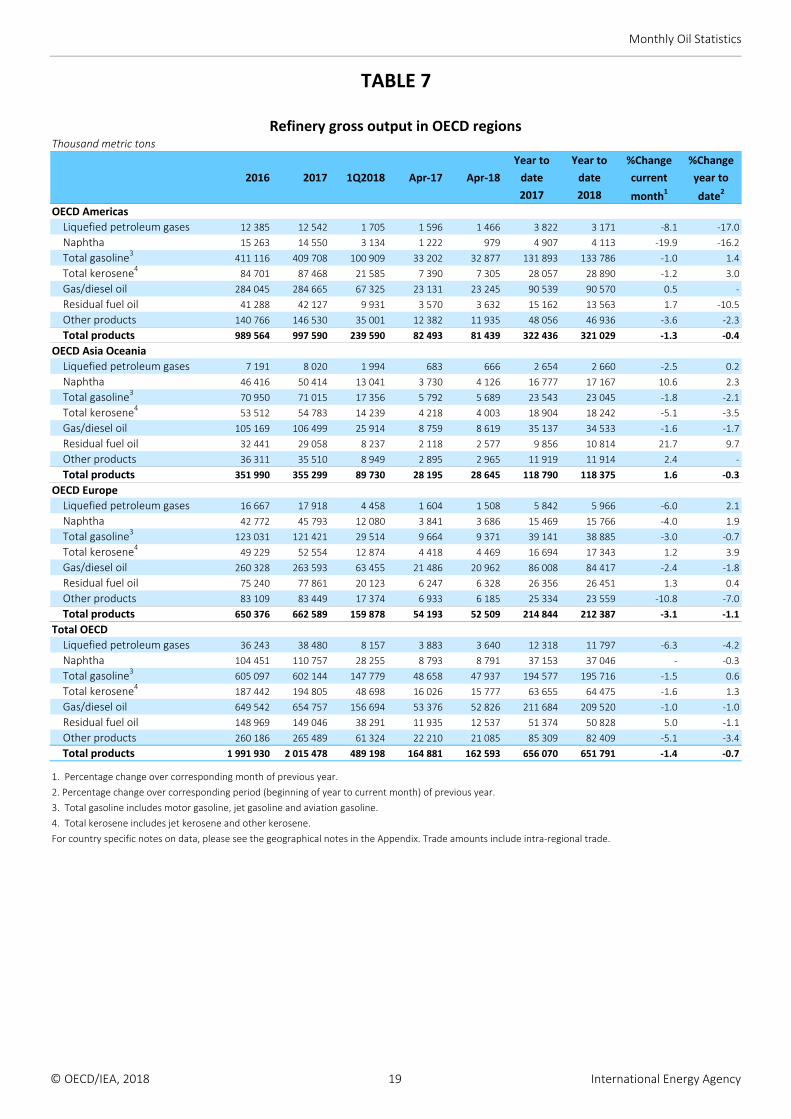
Total OECD refinery gross output of products fell by 1.4% in April 2018 compared to April 2017. The drop in
output was led by OECD Europe (‐3.1% y‐o‐y), followed by the OECD Americas (‐1.3% y‐o‐y). OECD Asia Oceania
experienced a 1.6% y‐o‐y growth with notable increase in naphtha (+10.6% y‐o‐y) and residual fuel oil (+21.7%
y‐o‐y) output. Overall, total OECD refinery gross output declined by 0.7% in April on a year‐to‐date basis.
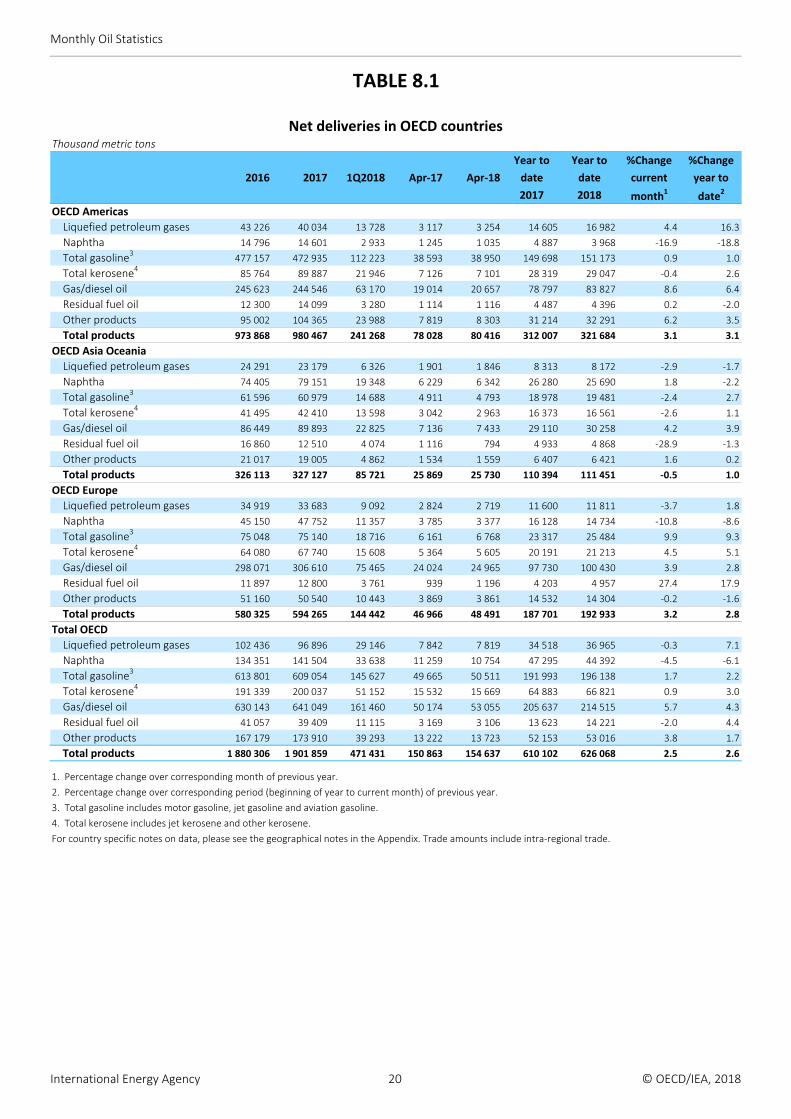
Total OECD net deliveries of total products grew by 2.5% in April 2018 compared to April 2017. The OECD
Americas led the growth (+3.1% y‐o‐y), in absolute terms, with an 8.6% y‐o‐y increase of gas/diesel oil net
deliveries. The increase in OECD Europe’s net deliveries (+3.2% y‐o‐y) was driven by a 4.0% y‐o‐y rise in middle
distillates. Net deliveries decreased in OECD Asia Oceania (‐0.5% y‐o‐y) with residual fuel oil net deliveries down
28.9% y‐o‐y.
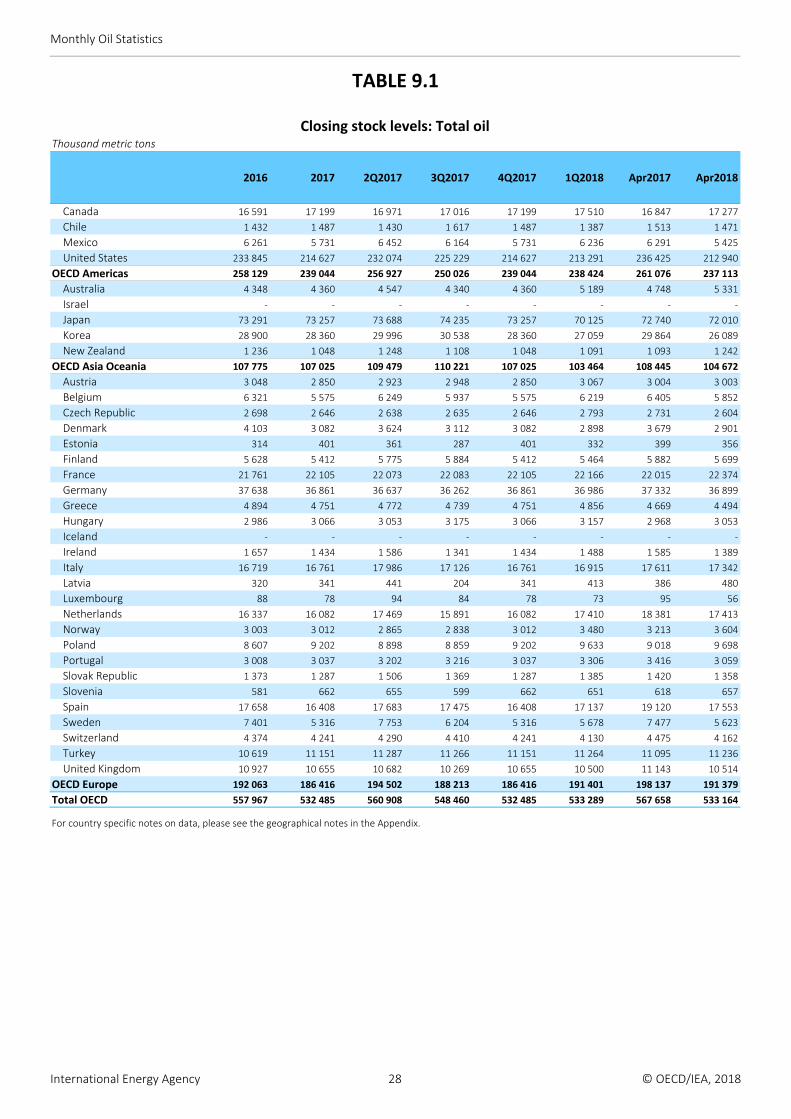
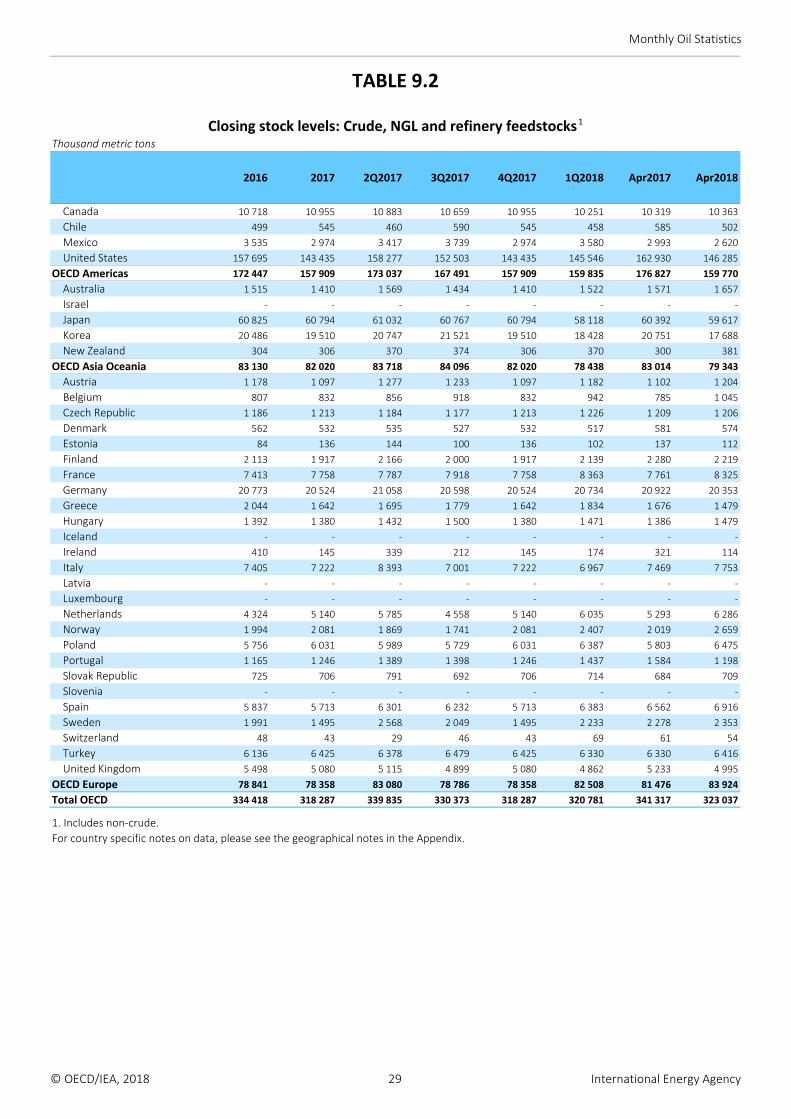
Total OECD stock levels of total oil on national territory remained relatively flat (‐125 kt) in April 2018
compared to March 2018 and closed at 533 million metric tons. However, this stability of total stocks reflects
an increase in crude oil, NGL, and refinery feedstocks stocks (+2256 kt) and a fall in product stocks (‐2381 kt).
Total oil stocks in OECD Asia Oceania increased (+1208 kt), mainly driven by Japan’s 1499 kt buildup of crude
oil, NGL, and refinery feedstocks. The OECD Americas had a stock drawdown of 1311 kt in total oil with a
relatively large drawdown in Mexico, where stocks of crude oil, NGL, and refinery feedstocks were lowered by
960 kt. OECD Europe’s total oil stocks were relatively flat (‐22 kt) as stocks of crude oil, NGL, and refinery
feedstocks increased (1416 kt) while stocks of total products decreased (‐1438 kt).
1 Year‐on‐year (y‐o‐y) change over corresponding month of previous year.
2 Year‐to‐date (y‐t‐d) change over corresponding period (beginning of year to current month) of previous year.
0
25
50
75
100
125
Apr‐15 Aug‐15 Dec‐15 Apr‐16 Aug‐16 Dec‐16 Apr‐17 Aug‐17 Dec‐17 Apr‐18
Million m
etric tons
OECD Asia Oceania
OECD Europe
OECD Americas
© OECD/IEA, 2018 3 International Energy Agency
Monthly Oil Statistics
CHART 2
Refinery gross output by OECD region
CHART 3
OECD oil deliveries by main product group
0
20
40
60
Apr‐15 Jul‐15 Oct‐15 Jan‐16 Apr‐16 Jul‐16 Oct‐16 Jan‐17 Apr‐17 Jul‐17 Oct‐17 Jan‐18 Apr‐18
Million m
etric tons
Gas Diesel Motor Gasoline Aviation Fuels Residual Fuel Oil
0
50
100
150
200
Apr‐15 Jul‐15 Oct‐15 Jan‐16 Apr‐16 Jul‐16 Oct‐16 Jan‐17 Apr‐17 Jul‐17 Oct‐17 Jan‐18 Apr‐18
Million m
etric tons
OECD Asia Oceania OECD Europe
OECD Americas
International Energy Agency 4 © OECD/IEA, 2018
Monthly Oil Statistics
NOTES
Please note that all IEA data are subject to the following Terms and Conditions found on the IEA’s website: http://www.iea.org/t&c/termsandconditions/
1) ESTIMATED DATA
Due to the absence of official data, the following data have been estimated:
Israel January 2010 to April 2018
2) COUNTRY NOTES
Australia Starting from January 2017 gas/diesel oil and motor gasoline closing stock data reflect the inclusion of new
companies in the Australian data collection system.
There is a break in series between December 2017 and January 2018 due to a change in reporting methods,
which involves new mandatory reporting for refineries and companies in the oil sector.
Austria Most recent data are the best estimates from the Austrian national administration, based on available
preliminary data. Data are usually finalised within three months following the first publication.
Canada Data for Canada are submitted by the Department of Natural Resources (Natural Resources Canada, or NRCan),
based on actual and preliminary data from Canada's national statistical agency (Statistics Canada) and various
other sources. In cases where data from these sources are unavailable, estimates are conducted by NRCan,
based on information available at the time, including alternative sources. Data are usually finalised within three
months of the first publication. An important source for any differences between data published by Statistics
Canada and data published by the IEA is data estimated by NRCan or the IEA Secretariat.
The Canadian Administration includes condensates and pentanes plus under crude oil.
France Following a methodological change in the French statistics coverage, data from January 2017 includes the
overseas departments (French Guiana, Guadeloupe, Martinique, Mayotte and Reunion).
Israel Information is based on data published by the Ministry of Energy and Water Resources as well as the Central
Bureau of Statistics.The statistical data for Israel are supplied by and under the responsibility of the relevant Israeli authorities. The
use of such data by the OECD is without prejudice to the status of the Golan Heights, East Jerusalem and Israeli
settlements in the West Bank under the terms of international law.The trade breakdown information is not available at this time.
The stocks level information is not available at this time. Revisions are pending.
Petroleum coke is included by Israeli Administration in the amounts of other petroleum products.
Mexico Star ng from January 2018, repor ng of LPG imports and deliveries is based on a more comprehensive
coverage of the market.
Netherlands As of December 2016, large amounts of fuel oil are reported under other products due to their chemical
properties.
Sweden There is a break in stocks for Refinery Feedstocks and Additives/Oxygenates between December 2017 and
January 2018 reflecting additional information collected by the Swedish administration.
Switzerland There is a break in stocks between December 2017 and January 2018 for refinery feedstocks, as more detailed
information of refinery activity is collected by the national administration.
© OECD/IEA, 2018 5 International Energy Agency
Monthly Oil Statistics
NOTES
United States The US Energy Information Administration (EIA) excludes crude oil lease stocks (crude oil stocks held at
producing sites) from industry stocks of crude oil.
International Energy Agency 6 © OECD/IEA, 2018
Monthly Oil Statistics
TABLE 1
Total OECD: Crude oil, NGL and refinery feedstocks supply 1
Thousand metric tons
Year to Year to %Change %Change
2016 2017 1Q2018 Apr‐17 Apr‐18 date date current year to
2017 2018 month2 date3
Indigenous production 1 055 688 1 084 325 285 419 86 836 96 146 352 638 381 565 10.7 8.2
+Backflows to refineries 34 453 36 361 8 877 2 757 2 941 11 876 11 818 6.7 ‐0.5
+From other sources 71 644 72 489 18 546 5 879 6 307 23 266 24 853 7.3 6.8
+Transfers 42 282 42 366 11 855 3 265 4 692 13 211 16 547 43.7 25.3
+Imports 1 408 631 1 432 513 346 927 116 318 115 749 474 381 462 676 ‐0.5 ‐2.5
‐Exports 405 782 447 274 119 488 35 566 39 997 144 644 159 485 12.5 10.3
‐Direct use 182 032 189 534 51 697 15 168 16 742 60 846 68 439 10.4 12.5
‐Stock changes 2 116 ‐ 16 131 1 894 ‐ 2 023 2 256 6 899 4 150 x x
‐Statistical difference 3 475 ‐ 3 558 1 415 ‐ 2 021 1 931 ‐ 4 319 3 346 x x
=Refinery intake (obs) 2 019 293 2 050 935 497 130 168 365 164 909 667 302 662 039 ‐2.1 ‐0.8
Refinery losses 27 299 35 404 7 932 3 503 2 316 11 251 10 248 ‐33.9 ‐8.9
Opening stock level 332 794 334 418 318 887 343 340 320 781 x x x x
Closing stock level 334 418 318 287 320 781 341 317 323 037 x x x x
Total OECD: Total products supplyThousand metric tons
Year to Year to %Change %Change
2016 2017 1Q2018 Apr‐17 Apr‐18 date date current year to
2017 2018 month2 date3
Primary product receipts 182 032 189 534 51 697 15 168 16 742 60 846 68 439 10.4 12.5
+Refinery gross output 1 991 930 2 015 478 489 198 164 881 162 593 656 070 651 791 ‐1.4 ‐0.7
+Recycled products 1 195 1 112 265 86 95 367 360 10.5 ‐1.9
‐Refinery fuel 90 353 87 376 21 181 7 146 6 990 29 029 28 171 ‐2.2 ‐3.0
+Imports 605 782 618 174 160 728 48 932 52 147 201 756 212 875 6.6 5.5
‐Exports 659 929 695 179 172 192 55 672 58 982 226 792 231 174 5.9 1.9
‐Intl. marine bunkers 82 367 81 722 18 702 6 635 6 701 26 737 25 403 1.0 ‐5.0
‐Interproduct transfers ‐ ‐ ‐ ‐ ‐ ‐ ‐ ‐ ‐
‐Products transferred 42 282 42 366 11 855 3 265 4 692 13 211 16 547 43.7 25.3
‐Stock changes ‐ 1 530 ‐ 9 692 ‐ 1 690 3 881 ‐ 2 381 2 451 ‐ 4 071 x x
‐Statistical difference ‐ 7 221 ‐ 10 873 ‐ 660 ‐ 1 152 ‐ 985 ‐ 1 159 ‐ 1 645 x x
=Gross consumption (obs) 1 914 759 1 938 220 480 308 153 620 157 578 621 978 637 886 2.6 2.6
Backflows to refineries 34 453 36 361 8 877 2 757 2 941 11 876 11 818 6.7 ‐0.5
=Net consumption 1 880 306 1 901 859 471 431 150 863 154 637 610 102 626 068 2.5 2.6
Opening stock level 224 885 223 890 214 198 222 460 212 508 x x x x
Closing stock level 223 549 214 198 212 508 226 341 210 127 x x x x
1. Includes non‐crude.
2. Percentage change over corresponding month of previous year.
3. Percentage change over corresponding period (beginning of year to current month) of previous year.
x: Not applicable.
For country specific notes on data, please see the geographical notes in the Appendix. Trade amounts include intra‐regional trade.
© OECD/IEA, 2018 7 International Energy Agency
Monthly Oil Statistics
TABLE 2
Total OECD: Indigenous production of crude oil, NGL and refinery feedstocks 1
Thousand metric tons
Year to Year to %Change %Change
2016 2017 1Q2018 Apr‐17 Apr‐18 date date current year to
2017 2018 month2 date3
Canada 219 844 238 073 62 898 17 634 20 685 77 169 83 583 17.3 8.3
Chile 238 268 110 20 37 72 147 85.0 104.2
Mexico 120 486 108 969 26 082 9 264 8 674 37 191 34 756 ‐6.4 ‐6.5
United States 536 583 561 744 152 196 45 001 52 247 178 064 204 443 16.1 14.8
OECD Americas 877 151 909 054 241 286 71 919 81 643 292 496 322 929 13.5 10.4
Australia 15 278 13 816 3 597 1 098 1 121 4 436 4 718 2.1 6.4
Israel 120 120 30 10 10 40 40 ‐ ‐
Japan 423 431 103 38 31 151 134 ‐18.4 ‐11.3
Korea 680 718 174 60 68 246 242 13.3 ‐1.6
New Zealand 1 739 1 593 340 138 83 525 423 ‐39.9 ‐19.4
OECD Asia Oceania 18 240 16 678 4 244 1 344 1 313 5 398 5 557 ‐2.3 2.9
Austria 794 735 175 53 57 249 232 7.5 ‐6.8
Belgium ‐ ‐ ‐ ‐ ‐ ‐ ‐ ‐ ‐
Czech Republic 187 213 52 19 16 70 68 ‐15.8 ‐2.9
Denmark 6 926 6 734 1 447 582 462 2 237 1 909 ‐20.6 ‐14.7
Estonia ‐ ‐ ‐ ‐ ‐ ‐ ‐ ‐ ‐
Finland ‐ ‐ ‐ ‐ ‐ ‐ ‐ ‐ ‐
France 995 967 238 85 78 320 316 ‐8.2 ‐1.2
Germany 3 705 3 638 911 303 302 1 234 1 213 ‐0.3 ‐1.7
Greece 161 142 45 10 17 45 62 70.0 37.8
Hungary 950 985 244 73 89 336 333 21.9 ‐0.9
Iceland ‐ ‐ ‐ ‐ ‐ ‐ ‐ ‐ ‐
Ireland ‐ ‐ ‐ ‐ ‐ ‐ ‐ ‐ ‐
Italy 4 146 4 502 1 332 356 445 1 753 1 777 25.0 1.4
Latvia ‐ ‐ ‐ ‐ ‐ ‐ ‐ ‐ ‐
Luxembourg ‐ ‐ ‐ ‐ ‐ ‐ ‐ ‐ ‐
Netherlands 1 520 1 453 491 125 125 505 616 ‐ 22.0
Norway 89 758 89 080 21 845 7 805 6 942 30 900 28 787 ‐11.1 ‐6.8
Poland 1 001 997 254 88 94 356 348 6.8 ‐2.2
Portugal ‐ ‐ ‐ ‐ ‐ ‐ ‐ ‐ ‐
Slovak Republic 9 6 1 1 1 4 2 ‐ ‐50.0
Slovenia ‐ ‐ ‐ ‐ ‐ ‐ ‐ ‐ ‐
Spain 141 118 25 10 8 36 33 ‐20.0 ‐8.3
Sweden ‐ ‐ ‐ ‐ ‐ ‐ ‐ ‐ ‐
Switzerland ‐ ‐ ‐ ‐ ‐ ‐ ‐ ‐ ‐
Turkey 2 573 2 553 660 212 232 834 892 9.4 7.0
United Kingdom 47 431 46 470 12 169 3 851 4 322 15 865 16 491 12.2 3.9
OECD Europe 160 297 158 593 39 889 13 573 13 190 54 744 53 079 ‐2.8 ‐3.0
Total OECD 1 055 688 1 084 325 285 419 86 836 96 146 352 638 381 565 10.7 8.2
1. Includes non‐crude.
2. Percentage change over corresponding month of previous year.
3. Percentage change over corresponding period (beginning of year to current month) of previous year.
For country specific notes on data, please see the geographical notes in the Appendix. Trade amounts include intra‐regional trade.
International Energy Agency 8 © OECD/IEA, 2018
Monthly Oil Statistics
TABLE 3.1
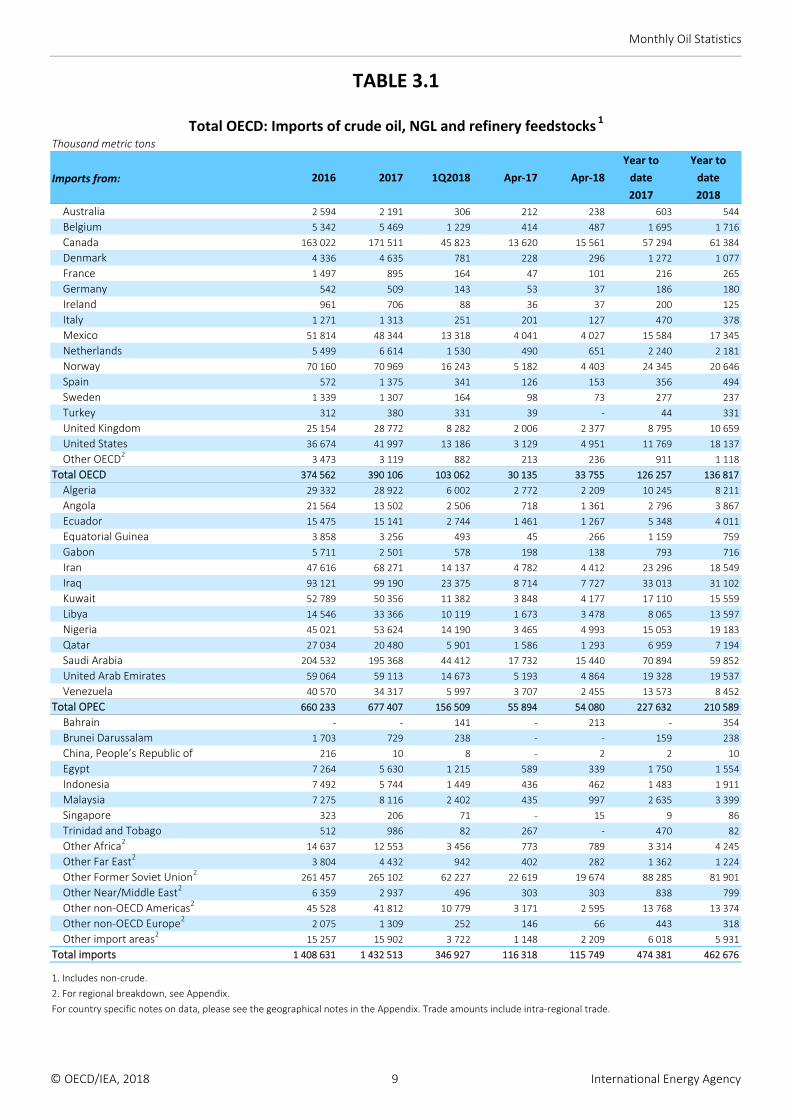
Total OECD: Imports of crude oil, NGL and refinery feedstocks 1
Thousand metric tons
Year to Year to
Imports from: 2016 2017 1Q2018 Apr‐17 Apr‐18 date date
2017 2018
Australia 2 594 2 191 306 212 238 603 544
Belgium 5 342 5 469 1 229 414 487 1 695 1 716
Canada 163 022 171 511 45 823 13 620 15 561 57 294 61 384
Denmark 4 336 4 635 781 228 296 1 272 1 077
France 1 497 895 164 47 101 216 265
Germany 542 509 143 53 37 186 180
Ireland 961 706 88 36 37 200 125
Italy 1 271 1 313 251 201 127 470 378
Mexico 51 814 48 344 13 318 4 041 4 027 15 584 17 345
Netherlands 5 499 6 614 1 530 490 651 2 240 2 181
Norway 70 160 70 969 16 243 5 182 4 403 24 345 20 646
Spain 572 1 375 341 126 153 356 494
Sweden 1 339 1 307 164 98 73 277 237
Turkey 312 380 331 39 ‐ 44 331
United Kingdom 25 154 28 772 8 282 2 006 2 377 8 795 10 659
United States 36 674 41 997 13 186 3 129 4 951 11 769 18 137
Other OECD2 3 473 3 119 882 213 236 911 1 118
Total OECD 374 562 390 106 103 062 30 135 33 755 126 257 136 817
Algeria 29 332 28 922 6 002 2 772 2 209 10 245 8 211
Angola 21 564 13 502 2 506 718 1 361 2 796 3 867
Ecuador 15 475 15 141 2 744 1 461 1 267 5 348 4 011
Equatorial Guinea 3 858 3 256 493 45 266 1 159 759
Gabon 5 711 2 501 578 198 138 793 716
Iran 47 616 68 271 14 137 4 782 4 412 23 296 18 549
Iraq 93 121 99 190 23 375 8 714 7 727 33 013 31 102
Kuwait 52 789 50 356 11 382 3 848 4 177 17 110 15 559
Libya 14 546 33 366 10 119 1 673 3 478 8 065 13 597
Nigeria 45 021 53 624 14 190 3 465 4 993 15 053 19 183
Qatar 27 034 20 480 5 901 1 586 1 293 6 959 7 194
Saudi Arabia 204 532 195 368 44 412 17 732 15 440 70 894 59 852
United Arab Emirates 59 064 59 113 14 673 5 193 4 864 19 328 19 537
Venezuela 40 570 34 317 5 997 3 707 2 455 13 573 8 452
Total OPEC 660 233 677 407 156 509 55 894 54 080 227 632 210 589
Bahrain ‐ ‐ 141 ‐ 213 ‐ 354
Brunei Darussalam 1 703 729 238 ‐ ‐ 159 238
China, People’s Republic of 216 10 8 ‐ 2 2 10
Egypt 7 264 5 630 1 215 589 339 1 750 1 554
Indonesia 7 492 5 744 1 449 436 462 1 483 1 911
Malaysia 7 275 8 116 2 402 435 997 2 635 3 399
Singapore 323 206 71 ‐ 15 9 86
Trinidad and Tobago 512 986 82 267 ‐ 470 82
Other Africa2 14 637 12 553 3 456 773 789 3 314 4 245
Other Far East2 3 804 4 432 942 402 282 1 362 1 224
Other Former Soviet Union2 261 457 265 102 62 227 22 619 19 674 88 285 81 901
Other Near/Middle East2 6 359 2 937 496 303 303 838 799
Other non‐OECD Americas2 45 528 41 812 10 779 3 171 2 595 13 768 13 374
Other non‐OECD Europe2 2 075 1 309 252 146 66 443 318
Other import areas2 15 257 15 902 3 722 1 148 2 209 6 018 5 931
Total imports 1 408 631 1 432 513 346 927 116 318 115 749 474 381 462 676
1. Includes non‐crude.
2. For regional breakdown, see Appendix.
For country specific notes on data, please see the geographical notes in the Appendix. Trade amounts include intra‐regional trade.
© OECD/IEA, 2018 9 International Energy Agency
Monthly Oil Statistics
TABLE 3.2
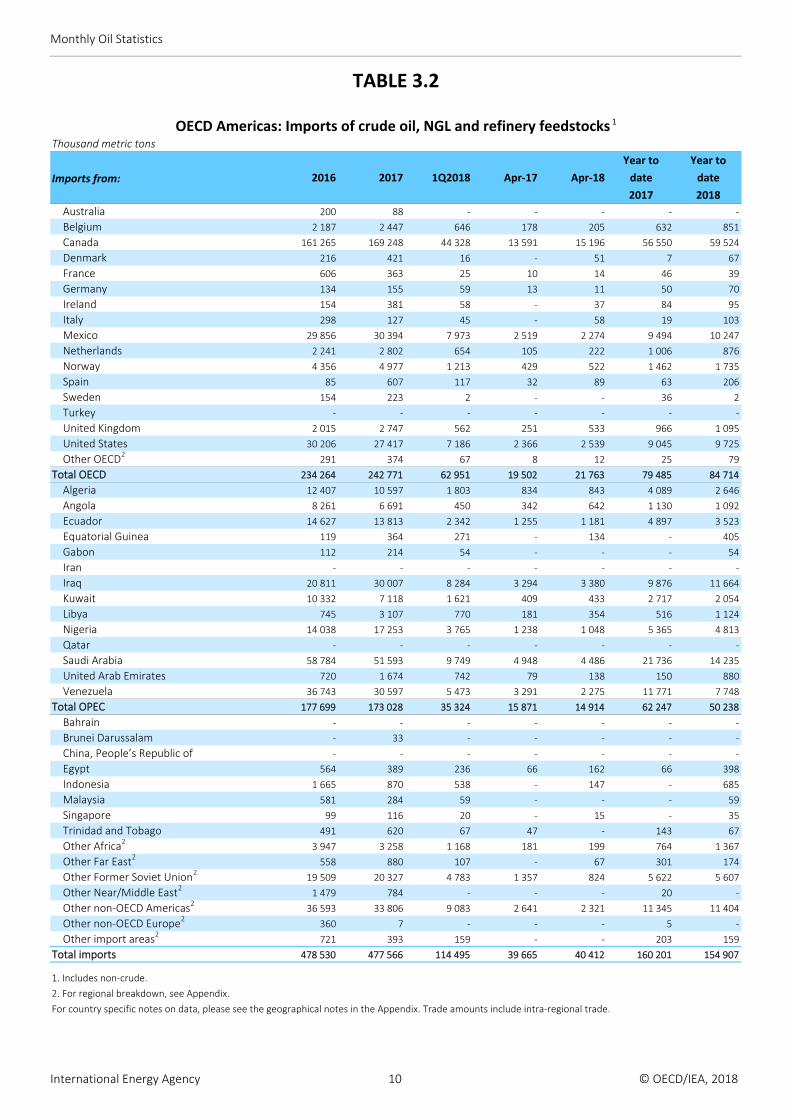
OECD Americas: Imports of crude oil, NGL and refinery feedstocks 1
Thousand metric tons
Year to Year to
Imports from: 2016 2017 1Q2018 Apr‐17 Apr‐18 date date
2017 2018
Australia 200 88 ‐ ‐ ‐ ‐ ‐
Belgium 2 187 2 447 646 178 205 632 851
Canada 161 265 169 248 44 328 13 591 15 196 56 550 59 524
Denmark 216 421 16 ‐ 51 7 67
France 606 363 25 10 14 46 39
Germany 134 155 59 13 11 50 70
Ireland 154 381 58 ‐ 37 84 95
Italy 298 127 45 ‐ 58 19 103
Mexico 29 856 30 394 7 973 2 519 2 274 9 494 10 247
Netherlands 2 241 2 802 654 105 222 1 006 876
Norway 4 356 4 977 1 213 429 522 1 462 1 735
Spain 85 607 117 32 89 63 206
Sweden 154 223 2 ‐ ‐ 36 2
Turkey ‐ ‐ ‐ ‐ ‐ ‐ ‐
United Kingdom 2 015 2 747 562 251 533 966 1 095
United States 30 206 27 417 7 186 2 366 2 539 9 045 9 725
Other OECD2 291 374 67 8 12 25 79
Total OECD 234 264 242 771 62 951 19 502 21 763 79 485 84 714
Algeria 12 407 10 597 1 803 834 843 4 089 2 646
Angola 8 261 6 691 450 342 642 1 130 1 092
Ecuador 14 627 13 813 2 342 1 255 1 181 4 897 3 523
Equatorial Guinea 119 364 271 ‐ 134 ‐ 405
Gabon 112 214 54 ‐ ‐ ‐ 54
Iran ‐ ‐ ‐ ‐ ‐ ‐ ‐
Iraq 20 811 30 007 8 284 3 294 3 380 9 876 11 664
Kuwait 10 332 7 118 1 621 409 433 2 717 2 054
Libya 745 3 107 770 181 354 516 1 124
Nigeria 14 038 17 253 3 765 1 238 1 048 5 365 4 813
Qatar ‐ ‐ ‐ ‐ ‐ ‐ ‐
Saudi Arabia 58 784 51 593 9 749 4 948 4 486 21 736 14 235
United Arab Emirates 720 1 674 742 79 138 150 880
Venezuela 36 743 30 597 5 473 3 291 2 275 11 771 7 748
Total OPEC 177 699 173 028 35 324 15 871 14 914 62 247 50 238
Bahrain ‐ ‐ ‐ ‐ ‐ ‐ ‐
Brunei Darussalam ‐ 33 ‐ ‐ ‐ ‐ ‐
China, People’s Republic of ‐ ‐ ‐ ‐ ‐ ‐ ‐
Egypt 564 389 236 66 162 66 398
Indonesia 1 665 870 538 ‐ 147 ‐ 685
Malaysia 581 284 59 ‐ ‐ ‐ 59
Singapore 99 116 20 ‐ 15 ‐ 35
Trinidad and Tobago 491 620 67 47 ‐ 143 67
Other Africa2 3 947 3 258 1 168 181 199 764 1 367
Other Far East2 558 880 107 ‐ 67 301 174
Other Former Soviet Union2 19 509 20 327 4 783 1 357 824 5 622 5 607
Other Near/Middle East2 1 479 784 ‐ ‐ ‐ 20 ‐
Other non‐OECD Americas2 36 593 33 806 9 083 2 641 2 321 11 345 11 404
Other non‐OECD Europe2 360 7 ‐ ‐ ‐ 5 ‐
Other import areas2 721 393 159 ‐ ‐ 203 159
Total imports 478 530 477 566 114 495 39 665 40 412 160 201 154 907
1. Includes non‐crude.
2. For regional breakdown, see Appendix.
For country specific notes on data, please see the geographical notes in the Appendix. Trade amounts include intra‐regional trade.
International Energy Agency 10 © OECD/IEA, 2018
Monthly Oil Statistics
TABLE 3.3
OECD Asia Oceania: Imports of crude oil, NGL and refinery feedstocks 1
Thousand metric tons
Year to Year to
Imports from: 2016 2017 1Q2018 Apr‐17 Apr‐18 date date
2017 2018
Australia 2 394 2 103 306 212 238 603 544
Belgium ‐ ‐ ‐ ‐ ‐ ‐ ‐
Canada ‐ ‐ 37 ‐ ‐ ‐ 37
Denmark ‐ ‐ ‐ ‐ ‐ ‐ ‐
France ‐ ‐ ‐ ‐ ‐ ‐ ‐
Germany ‐ ‐ ‐ ‐ ‐ ‐ ‐
Ireland ‐ ‐ ‐ ‐ ‐ ‐ ‐
Italy ‐ ‐ ‐ ‐ ‐ ‐ ‐
Mexico 8 166 6 373 1 737 494 548 1 966 2 285
Netherlands ‐ ‐ ‐ ‐ ‐ ‐ ‐
Norway ‐ 100 102 ‐ ‐ ‐ 102
Spain ‐ ‐ ‐ ‐ ‐ ‐ ‐
Sweden ‐ ‐ ‐ ‐ ‐ ‐ ‐
Turkey ‐ ‐ ‐ ‐ ‐ ‐ ‐
United Kingdom 2 523 4 710 1 096 142 ‐ 1 220 1 096
United States 851 3 461 969 143 284 627 1 253
Other OECD2 1 381 1 137 226 82 73 370 299
Total OECD 15 315 17 884 4 473 1 073 1 143 4 786 5 616
Algeria 712 1 681 953 31 316 159 1 269
Angola 381 523 ‐ ‐ ‐ ‐ ‐
Ecuador 848 1 328 402 206 86 451 488
Equatorial Guinea ‐ ‐ ‐ ‐ ‐ ‐ ‐
Gabon 2 251 1 235 382 168 138 521 520
Iran 25 964 28 307 6 133 1 800 1 484 10 678 7 617
Iraq 22 662 19 898 5 167 1 761 1 466 6 842 6 633
Kuwait 32 802 33 253 8 163 2 741 3 194 11 197 11 357
Libya 886 1 630 532 138 110 627 642
Nigeria 176 800 159 ‐ 234 ‐ 393
Qatar 26 948 20 480 5 901 1 586 1 293 6 959 7 194
Saudi Arabia 103 206 107 206 26 227 9 343 8 559 37 254 34 786
United Arab Emirates 57 725 57 163 13 931 4 904 4 726 18 968 18 657
Venezuela 137 406 ‐ 140 ‐ 406 ‐
Total OPEC 274 698 273 910 67 950 22 818 21 606 94 062 89 556
Bahrain ‐ ‐ 141 ‐ 213 ‐ 354
Brunei Darussalam 1 703 696 238 ‐ ‐ 159 238
China, People’s Republic of 216 8 8 ‐ 2 ‐ 10
Egypt ‐ ‐ ‐ ‐ ‐ ‐ ‐
Indonesia 5 633 4 577 841 412 300 1 394 1 141
Malaysia 6 684 7 822 2 330 435 997 2 630 3 327
Singapore 224 87 51 ‐ ‐ 9 51
Trinidad and Tobago ‐ ‐ ‐ ‐ ‐ ‐ ‐
Other Africa2 2 332 1 948 230 93 187 541 417
Other Far East2 3 246 3 517 835 402 215 1 028 1 050
Other Former Soviet Union2 16 933 20 668 5 052 1 776 1 880 6 304 6 932
Other Near/Middle East2 4 376 2 091 496 303 303 818 799
Other non‐OECD Americas2 469 381 67 55 ‐ 150 67
Other non‐OECD Europe2 ‐ ‐ ‐ ‐ ‐ ‐ ‐
Other import areas2 13 383 15 093 3 312 509 2 011 4 513 5 323
Total imports 345 212 348 682 86 024 27 876 28 857 116 394 114 881
1. Includes non‐crude.
2. For regional breakdown, see Appendix.
For country specific notes on data, please see the geographical notes in the Appendix. Trade amounts include intra‐regional trade.
© OECD/IEA, 2018 11 International Energy Agency
Monthly Oil Statistics
TABLE 3.4
OECD Europe: Imports of crude oil, NGL and refinery feedstocks 1
Thousand metric tons
Year to Year to
Imports from: 2016 2017 1Q2018 Apr‐17 Apr‐18 date date
2017 2018
Australia ‐ ‐ ‐ ‐ ‐ ‐ ‐
Belgium 3 155 3 022 583 236 282 1 063 865
Canada 1 757 2 263 1 458 29 365 744 1 823
Denmark 4 120 4 214 765 228 245 1 265 1 010
France 891 532 139 37 87 170 226
Germany 408 354 84 40 26 136 110
Ireland 807 325 30 36 ‐ 116 30
Italy 973 1 186 206 201 69 451 275
Mexico 13 792 11 577 3 608 1 028 1 205 4 124 4 813
Netherlands 3 258 3 812 876 385 429 1 234 1 305
Norway 65 804 65 892 14 928 4 753 3 881 22 883 18 809
Spain 487 768 224 94 64 293 288
Sweden 1 185 1 084 162 98 73 241 235
Turkey 312 380 331 39 ‐ 44 331
United Kingdom 20 616 21 315 6 624 1 613 1 844 6 609 8 468
United States 5 617 11 119 5 031 620 2 128 2 097 7 159
Other OECD2 1 801 1 608 589 123 151 516 740
Total OECD 124 983 129 451 35 638 9 560 10 849 41 986 46 487
Algeria 16 213 16 644 3 246 1 907 1 050 5 997 4 296
Angola 12 922 6 288 2 056 376 719 1 666 2 775
Ecuador ‐ ‐ ‐ ‐ ‐ ‐ ‐
Equatorial Guinea 3 739 2 892 222 45 132 1 159 354
Gabon 3 348 1 052 142 30 ‐ 272 142
Iran 21 652 39 964 8 004 2 982 2 928 12 618 10 932
Iraq 49 648 49 285 9 924 3 659 2 881 16 295 12 805
Kuwait 9 655 9 985 1 598 698 550 3 196 2 148
Libya 12 915 28 629 8 817 1 354 3 014 6 922 11 831
Nigeria 30 807 35 571 10 266 2 227 3 711 9 688 13 977
Qatar 86 ‐ ‐ ‐ ‐ ‐ ‐
Saudi Arabia 42 542 36 569 8 436 3 441 2 395 11 904 10 831
United Arab Emirates 619 276 ‐ 210 ‐ 210 ‐
Venezuela 3 690 3 314 524 276 180 1 396 704
Total OPEC 207 836 230 469 53 235 17 205 17 560 71 323 70 795
Bahrain ‐ ‐ ‐ ‐ ‐ ‐ ‐
Brunei Darussalam ‐ ‐ ‐ ‐ ‐ ‐ ‐
China, People’s Republic of ‐ 2 ‐ ‐ ‐ 2 ‐
Egypt 6 700 5 241 979 523 177 1 684 1 156
Indonesia 194 297 70 24 15 89 85
Malaysia 10 10 13 ‐ ‐ 5 13
Singapore ‐ 3 ‐ ‐ ‐ ‐ ‐
Trinidad and Tobago 21 366 15 220 ‐ 327 15
Other Africa2 8 358 7 347 2 058 499 403 2 009 2 461
Other Far East2 ‐ 35 ‐ ‐ ‐ 33 ‐
Other Former Soviet Union2 225 015 224 107 52 392 19 486 16 970 76 359 69 362
Other Near/Middle East2 504 62 ‐ ‐ ‐ ‐ ‐
Other non‐OECD Americas2 8 466 7 625 1 629 475 274 2 273 1 903
Other non‐OECD Europe2 1 715 1 302 252 146 66 438 318
Other import areas2 1 153 416 251 639 198 1 302 449
Total imports 584 889 606 265 146 408 48 777 46 480 197 786 192 888
1. Includes non‐crude.
2. For regional breakdown, see Appendix.
For country specific notes on data, please see the geographical notes in the Appendix. Trade amounts include intra‐regional trade.
International Energy Agency 12 © OECD/IEA, 2018
Monthly Oil Statistics
TABLE 4.1
Total OECD: Imports of total productsThousand metric tons
Year to Year to
Imports from: 2016 2017 1Q2018 Apr‐17 Apr‐18 date date
2017 2018
Australia 1 050 719 198 24 45 161 243
Belgium 30 636 31 133 8 127 2 514 3 016 9 789 11 143
Canada 25 652 28 170 7 011 2 064 2 074 9 483 9 085
Denmark 5 084 4 058 952 369 335 1 472 1 287
France 11 240 11 921 3 054 1 020 1 010 4 069 4 064
Germany 22 584 22 272 5 358 1 919 1 975 7 283 7 333
Ireland 739 1 242 287 81 113 274 400
Italy 11 494 13 228 3 115 1 186 979 4 287 4 094
Mexico 4 414 3 729 913 327 302 1 426 1 215
Netherlands 51 414 49 480 12 777 3 991 4 700 15 727 17 477
Norway 11 234 10 914 3 088 1 092 913 3 578 4 001
Spain 12 473 12 904 3 465 889 794 4 012 4 259
Sweden 12 827 14 322 3 698 872 1 260 4 745 4 958
Turkey 870 959 184 85 97 488 281
United Kingdom 22 683 21 939 4 814 1 885 1 837 7 309 6 651
United States 86 763 88 486 25 167 6 303 7 529 28 512 32 696
Other OECD1 66 308 67 659 16 113 6 086 5 327 22 962 21 440
Total OECD 377 465 383 135 98 321 30 707 32 306 125 577 130 627
Algeria 9 539 9 974 2 767 850 823 3 215 3 590
Angola 415 209 60 10 44 28 104
Ecuador 89 ‐ 66 ‐ ‐ ‐ 66
Equatorial Guinea 248 56 ‐ ‐ ‐ 45 ‐
Gabon 169 158 35 ‐ ‐ 62 35
Iran 36 97 ‐ ‐ ‐ 94 ‐
Iraq 104 138 20 100 16 101 36
Kuwait 7 400 8 476 1 419 694 542 3 072 1 961
Libya 835 1 421 449 101 151 429 600
Nigeria 2 284 1 766 358 148 110 336 468
Qatar 11 521 11 998 3 385 845 1 217 3 411 4 602
Saudi Arabia 18 928 18 291 5 248 1 420 1 647 4 944 6 895
United Arab Emirates 17 272 16 324 4 173 994 1 246 5 117 5 419
Venezuela 4 044 3 995 1 205 230 394 1 196 1 599
Total OPEC 72 884 72 903 19 185 5 392 6 190 22 050 25 375
Bahrain 1 809 2 124 680 161 218 519 898
Brunei Darussalam ‐ ‐ ‐ ‐ ‐ ‐ ‐
China, People’s Republic of 4 837 4 274 1 164 163 341 1 319 1 505
Egypt 1 287 1 613 270 77 225 385 495
Indonesia 1 077 1 135 225 132 34 382 259
Malaysia 6 533 6 609 1 585 597 563 2 636 2 148
Singapore 14 015 14 279 4 174 1 359 1 448 5 235 5 622
Trinidad and Tobago 1 216 1 451 367 169 141 500 508
Other Africa1 1 602 1 389 250 30 96 274 346
Other Far East1 22 764 20 130 5 228 1 796 1 858 6 711 7 086
Other Former Soviet Union1 95 324 93 373 24 799 8 834 8 470 32 748 33 269
Other Near/Middle East1 313 726 126 17 49 70 175
Other non‐OECD Americas1 6 951 7 687 2 587 668 641 2 570 3 228
Other non‐OECD Europe1 4 906 5 093 1 083 374 329 1 547 1 412
Other import areas1 423 7 263 1 688 ‐ 166 ‐ 314 1 765 1 374
Total imports 605 782 618 174 160 728 48 932 52 147 201 756 212 875
1. For regional breakdown, see Appendix.
For country specific notes on data, please see the geographical notes in the Appendix. Trade amounts include intra‐regional trade.
© OECD/IEA, 2018 13 International Energy Agency

Monthly Oil Statistics
TABLE 4.2
OECD Americas: Imports of total productsThousand metric tons
Year to Year to
Imports from: 2016 2017 1Q2018 Apr‐17 Apr‐18 date date
2017 2018
Australia 10 ‐ ‐ ‐ ‐ ‐ ‐
Belgium 1 349 2 050 368 179 143 646 511
Canada 23 310 25 643 6 759 1 981 1 875 8 698 8 634
Denmark 85 74 3 4 2 24 5
France 1 158 1 383 355 72 62 425 417
Germany 215 242 24 58 2 126 26
Ireland ‐ 113 80 ‐ ‐ ‐ 80
Italy 554 710 146 97 71 230 217
Mexico 4 096 3 687 873 327 302 1 426 1 175
Netherlands 4 349 4 387 1 110 307 378 1 161 1 488
Norway 1 493 1 241 73 144 124 403 197
Spain 2 558 2 080 583 276 191 742 774
Sweden 467 569 288 49 102 219 390
Turkey 105 331 74 8 53 56 127
United Kingdom 4 726 5 112 547 471 512 1 659 1 059
United States 44 531 46 984 14 580 3 029 4 411 14 146 18 991
Other OECD1 9 273 8 978 1 483 1 015 681 2 981 2 164
Total OECD 98 279 103 584 27 346 8 017 8 909 32 942 36 255
Algeria 421 159 49 ‐ ‐ 52 49
Angola 56 45 18 ‐ 38 ‐ 56
Ecuador 89 ‐ 66 ‐ ‐ ‐ 66
Equatorial Guinea ‐ ‐ ‐ ‐ ‐ ‐ ‐
Gabon 28 ‐ ‐ ‐ ‐ ‐ ‐
Iran ‐ ‐ ‐ ‐ ‐ ‐ ‐
Iraq 100 12 1 ‐ 1 1 2
Kuwait 36 30 56 ‐ ‐ 7 56
Libya 45 229 24 ‐ ‐ ‐ 24
Nigeria 1 232 1 063 220 97 68 236 288
Qatar 561 318 288 ‐ 32 72 320
Saudi Arabia 211 188 351 ‐ ‐ 6 351
United Arab Emirates 49 205 30 15 37 34 67
Venezuela 2 846 2 749 910 173 319 1 014 1 229
Total OPEC 5 674 4 998 2 013 285 495 1 422 2 508
Bahrain 103 111 45 31 20 59 65
Brunei Darussalam ‐ ‐ ‐ ‐ ‐ ‐ ‐
China, People’s Republic of 1 334 1 392 592 24 72 278 664
Egypt 51 67 ‐ ‐ ‐ ‐ ‐
Indonesia 132 9 39 ‐ 10 ‐ 49
Malaysia 109 251 3 1 3 28 6
Singapore 350 702 23 12 94 57 117
Trinidad and Tobago 1 171 1 355 328 161 124 471 452
Other Africa1 440 233 1 2 27 24 28
Other Far East1 4 491 3 791 857 264 554 1 061 1 411
Other Former Soviet Union1 7 055 4 998 1 225 279 405 1 461 1 630
Other Near/Middle East1 4 18 22 ‐ 44 ‐ 66
Other non‐OECD Americas1 5 458 6 668 2 199 540 571 2 008 2 770
Other non‐OECD Europe1 ‐ 32 ‐ ‐ ‐ ‐ ‐
Other import areas1 249 836 227 59 24 190 251
Total imports 124 802 129 045 34 920 9 675 11 352 40 001 46 272
1. For regional breakdown, see Appendix.
For country specific notes on data, please see the geographical notes in the Appendix. Trade amounts include intra‐regional trade.
International Energy Agency 14 © OECD/IEA, 2018
Monthly Oil Statistics
TABLE 4.3
OECD Asia Oceania: Imports of total productsThousand metric tons
Year to Year to
Imports from: 2016 2017 1Q2018 Apr‐17 Apr‐18 date date
2017 2018
Australia 1 040 719 198 24 31 161 229
Belgium 6 4 29 ‐ 47 1 76
Canada 425 475 131 22 85 109 216
Denmark 33 29 ‐ 29 ‐ 29 ‐
France 1 4 1 ‐ 1 1 2
Germany 12 14 3 5 1 7 4
Ireland ‐ ‐ ‐ ‐ ‐ ‐ ‐
Italy 202 105 53 25 ‐ 25 53
Mexico 113 ‐ ‐ ‐ ‐ ‐ ‐
Netherlands 203 88 329 ‐ 66 ‐ 395
Norway 582 345 152 60 ‐ 161 152
Spain 608 273 253 ‐ ‐ 165 253
Sweden 61 ‐ ‐ ‐ 1 ‐ 1
Turkey ‐ ‐ ‐ ‐ ‐ ‐ ‐
United Kingdom 49 ‐ 89 ‐ ‐ ‐ 89
United States 12 122 15 978 4 681 1 438 1 681 5 661 6 362
Other OECD1 17 546 19 321 5 633 1 120 1 427 6 192 7 060
Total OECD 33 003 37 355 11 552 2 723 3 340 12 512 14 892
Algeria 801 1 111 333 180 119 274 452
Angola 148 164 42 10 6 28 48
Ecuador ‐ ‐ ‐ ‐ ‐ ‐ ‐
Equatorial Guinea 195 45 ‐ ‐ ‐ 45 ‐
Gabon ‐ ‐ 8 ‐ ‐ ‐ 8
Iran 34 35 ‐ ‐ ‐ 35 ‐
Iraq ‐ 123 ‐ 100 ‐ 100 ‐
Kuwait 5 212 5 643 1 055 520 432 2 196 1 487
Libya ‐ ‐ ‐ ‐ ‐ ‐ ‐
Nigeria 382 93 22 10 24 22 46
Qatar 9 168 9 242 2 382 798 944 2 859 3 326
Saudi Arabia 6 453 5 620 1 286 379 272 1 507 1 558
United Arab Emirates 11 360 10 680 2 721 750 713 3 270 3 434
Venezuela 22 ‐ ‐ ‐ ‐ ‐ ‐
Total OPEC 33 775 32 756 7 849 2 747 2 510 10 336 10 359
Bahrain 1 056 1 304 407 88 192 314 599
Brunei Darussalam ‐ ‐ ‐ ‐ ‐ ‐ ‐
China, People’s Republic of 2 947 2 527 528 125 257 999 785
Egypt 138 81 53 ‐ 37 26 90
Indonesia 641 669 106 88 20 224 126
Malaysia 6 157 6 108 1 519 592 552 2 422 2 071
Singapore 11 848 11 357 3 664 1 134 1 261 4 684 4 925
Trinidad and Tobago ‐ ‐ ‐ ‐ ‐ ‐ ‐
Other Africa1 105 ‐ 17 ‐ 14 ‐ 31
Other Far East1 8 159 8 302 2 030 826 327 2 544 2 357
Other Former Soviet Union1 6 038 7 624 1 918 529 738 2 539 2 656
Other Near/Middle East1 12 30 ‐ ‐ ‐ 12 ‐
Other non‐OECD Americas1 721 362 137 100 ‐ 234 137
Other non‐OECD Europe1 206 89 ‐ 57 ‐ 88 ‐
Other import areas1 2 318 2 574 939 163 194 920 1 133
Total imports 107 124 111 138 30 719 9 172 9 360 37 854 40 079
1. For regional breakdown, see Appendix.
For country specific notes on data, please see the geographical notes in the Appendix. Trade amounts include intra‐regional trade.
© OECD/IEA, 2018 15 International Energy Agency
Monthly Oil Statistics
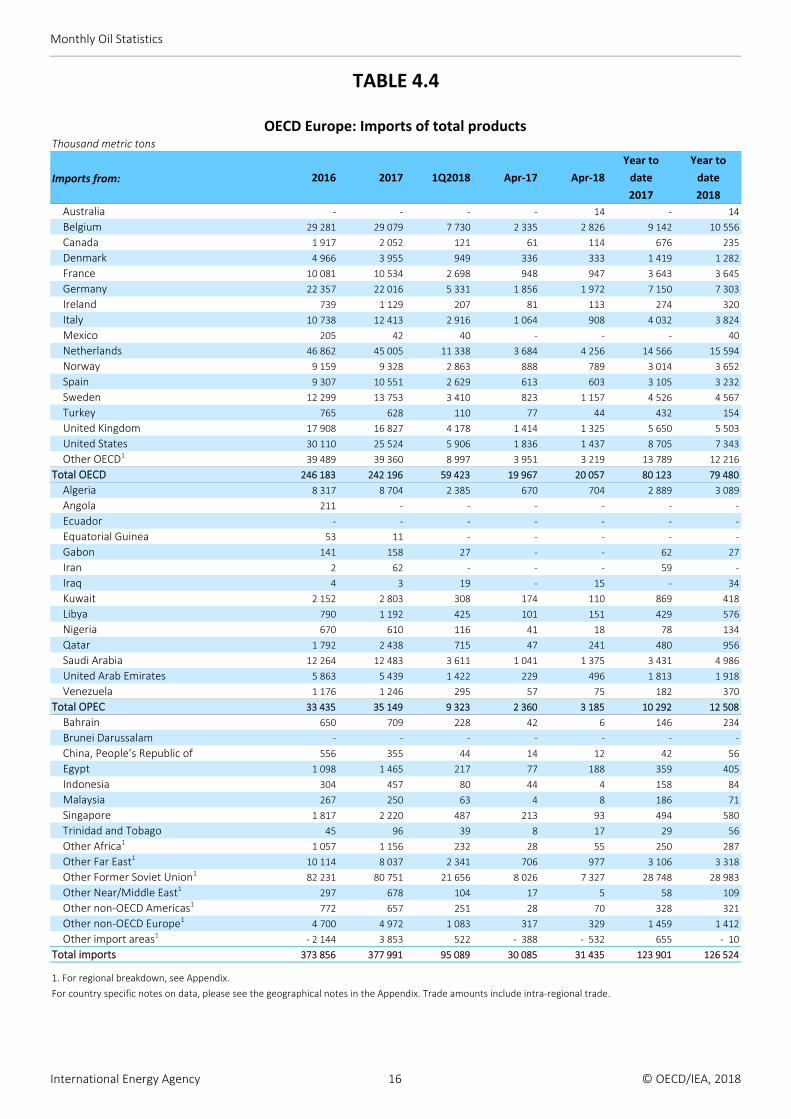
TABLE 4.4
OECD Europe: Imports of total productsThousand metric tons
Year to Year to
Imports from: 2016 2017 1Q2018 Apr‐17 Apr‐18 date date
2017 2018
Australia ‐ ‐ ‐ ‐ 14 ‐ 14
Belgium 29 281 29 079 7 730 2 335 2 826 9 142 10 556
Canada 1 917 2 052 121 61 114 676 235
Denmark 4 966 3 955 949 336 333 1 419 1 282
France 10 081 10 534 2 698 948 947 3 643 3 645
Germany 22 357 22 016 5 331 1 856 1 972 7 150 7 303
Ireland 739 1 129 207 81 113 274 320
Italy 10 738 12 413 2 916 1 064 908 4 032 3 824
Mexico 205 42 40 ‐ ‐ ‐ 40
Netherlands 46 862 45 005 11 338 3 684 4 256 14 566 15 594
Norway 9 159 9 328 2 863 888 789 3 014 3 652
Spain 9 307 10 551 2 629 613 603 3 105 3 232
Sweden 12 299 13 753 3 410 823 1 157 4 526 4 567
Turkey 765 628 110 77 44 432 154
United Kingdom 17 908 16 827 4 178 1 414 1 325 5 650 5 503
United States 30 110 25 524 5 906 1 836 1 437 8 705 7 343
Other OECD1 39 489 39 360 8 997 3 951 3 219 13 789 12 216
Total OECD 246 183 242 196 59 423 19 967 20 057 80 123 79 480
Algeria 8 317 8 704 2 385 670 704 2 889 3 089
Angola 211 ‐ ‐ ‐ ‐ ‐ ‐
Ecuador ‐ ‐ ‐ ‐ ‐ ‐ ‐
Equatorial Guinea 53 11 ‐ ‐ ‐ ‐ ‐
Gabon 141 158 27 ‐ ‐ 62 27
Iran 2 62 ‐ ‐ ‐ 59 ‐
Iraq 4 3 19 ‐ 15 ‐ 34
Kuwait 2 152 2 803 308 174 110 869 418
Libya 790 1 192 425 101 151 429 576
Nigeria 670 610 116 41 18 78 134
Qatar 1 792 2 438 715 47 241 480 956
Saudi Arabia 12 264 12 483 3 611 1 041 1 375 3 431 4 986
United Arab Emirates 5 863 5 439 1 422 229 496 1 813 1 918
Venezuela 1 176 1 246 295 57 75 182 370
Total OPEC 33 435 35 149 9 323 2 360 3 185 10 292 12 508
Bahrain 650 709 228 42 6 146 234
Brunei Darussalam ‐ ‐ ‐ ‐ ‐ ‐ ‐
China, People’s Republic of 556 355 44 14 12 42 56
Egypt 1 098 1 465 217 77 188 359 405
Indonesia 304 457 80 44 4 158 84
Malaysia 267 250 63 4 8 186 71
Singapore 1 817 2 220 487 213 93 494 580
Trinidad and Tobago 45 96 39 8 17 29 56
Other Africa1 1 057 1 156 232 28 55 250 287
Other Far East1 10 114 8 037 2 341 706 977 3 106 3 318
Other Former Soviet Union1 82 231 80 751 21 656 8 026 7 327 28 748 28 983
Other Near/Middle East1 297 678 104 17 5 58 109
Other non‐OECD Americas1 772 657 251 28 70 328 321
Other non‐OECD Europe1 4 700 4 972 1 083 317 329 1 459 1 412
Other import areas1 ‐ 2 144 3 853 522 ‐ 388 ‐ 532 655 ‐ 10
Total imports 373 856 377 991 95 089 30 085 31 435 123 901 126 524
1. For regional breakdown, see Appendix.
For country specific notes on data, please see the geographical notes in the Appendix. Trade amounts include intra‐regional trade.
International Energy Agency 16 © OECD/IEA, 2018
Monthly Oil Statistics
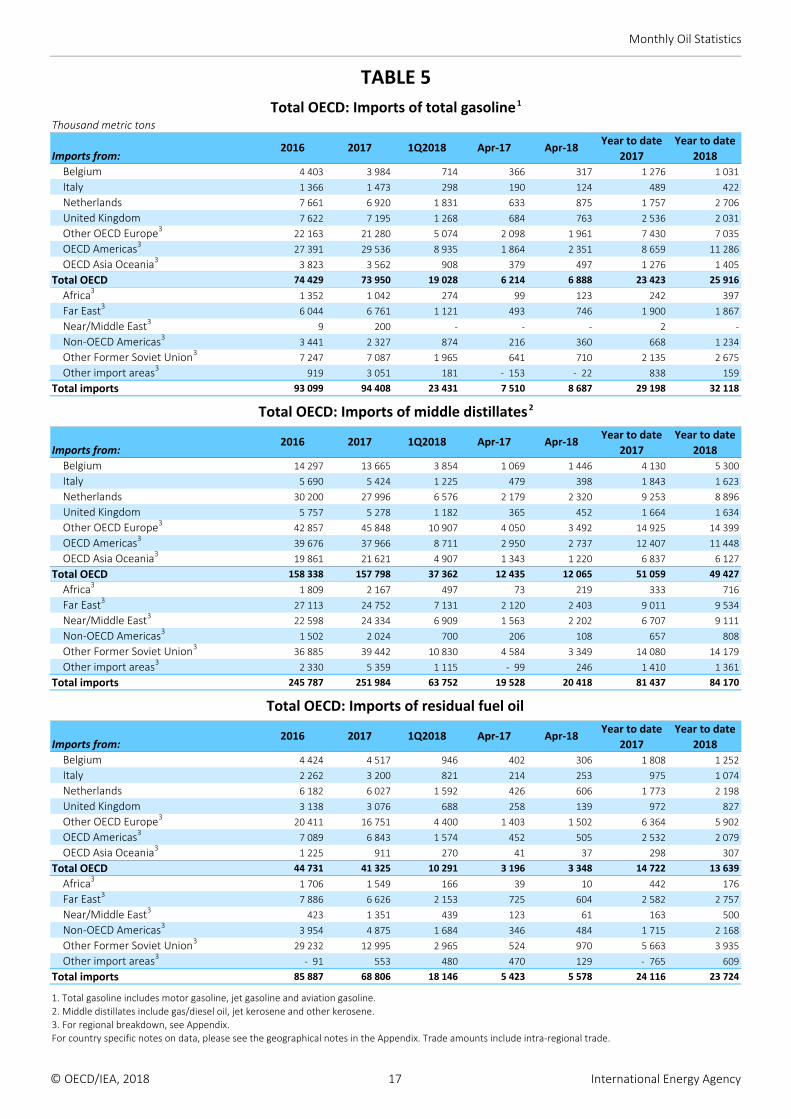
TABLE 5
Total OECD: Imports of total gasoline1
Thousand metric tons
Year to date Year to date
2017 2018
Belgium 4 403 3 984 714 366 317 1 276 1 031
Italy 1 366 1 473 298 190 124 489 422
Netherlands 7 661 6 920 1 831 633 875 1 757 2 706
United Kingdom 7 622 7 195 1 268 684 763 2 536 2 031
Other OECD Europe3 22 163 21 280 5 074 2 098 1 961 7 430 7 035
OECD Americas3 27 391 29 536 8 935 1 864 2 351 8 659 11 286
OECD Asia Oceania3 3 823 3 562 908 379 497 1 276 1 405
Total OECD 74 429 73 950 19 028 6 214 6 888 23 423 25 916
Africa3 1 352 1 042 274 99 123 242 397
Far East3 6 044 6 761 1 121 493 746 1 900 1 867
Near/Middle East3 9 200 ‐ ‐ ‐ 2 ‐
Non‐OECD Americas3 3 441 2 327 874 216 360 668 1 234
Other Former Soviet Union3 7 247 7 087 1 965 641 710 2 135 2 675
Other import areas3 919 3 051 181 ‐ 153 ‐ 22 838 159
Total imports 93 099 94 408 23 431 7 510 8 687 29 198 32 118
Total OECD: Imports of middle distillates2
Year to date Year to date
2017 2018
Belgium 14 297 13 665 3 854 1 069 1 446 4 130 5 300
Italy 5 690 5 424 1 225 479 398 1 843 1 623
Netherlands 30 200 27 996 6 576 2 179 2 320 9 253 8 896
United Kingdom 5 757 5 278 1 182 365 452 1 664 1 634
Other OECD Europe3 42 857 45 848 10 907 4 050 3 492 14 925 14 399
OECD Americas3 39 676 37 966 8 711 2 950 2 737 12 407 11 448
OECD Asia Oceania3 19 861 21 621 4 907 1 343 1 220 6 837 6 127
Total OECD 158 338 157 798 37 362 12 435 12 065 51 059 49 427
Africa3 1 809 2 167 497 73 219 333 716
Far East3 27 113 24 752 7 131 2 120 2 403 9 011 9 534
Near/Middle East3 22 598 24 334 6 909 1 563 2 202 6 707 9 111
Non‐OECD Americas3 1 502 2 024 700 206 108 657 808
Other Former Soviet Union3 36 885 39 442 10 830 4 584 3 349 14 080 14 179
Other import areas3 2 330 5 359 1 115 ‐ 99 246 1 410 1 361
Total imports 245 787 251 984 63 752 19 528 20 418 81 437 84 170
Total OECD: Imports of residual fuel oil
Year to date Year to date
2017 2018
Belgium 4 424 4 517 946 402 306 1 808 1 252
Italy 2 262 3 200 821 214 253 975 1 074
Netherlands 6 182 6 027 1 592 426 606 1 773 2 198
United Kingdom 3 138 3 076 688 258 139 972 827
Other OECD Europe3 20 411 16 751 4 400 1 403 1 502 6 364 5 902
OECD Americas3 7 089 6 843 1 574 452 505 2 532 2 079
OECD Asia Oceania3 1 225 911 270 41 37 298 307
Total OECD 44 731 41 325 10 291 3 196 3 348 14 722 13 639
Africa3 1 706 1 549 166 39 10 442 176
Far East3 7 886 6 626 2 153 725 604 2 582 2 757
Near/Middle East3 423 1 351 439 123 61 163 500
Non‐OECD Americas3 3 954 4 875 1 684 346 484 1 715 2 168
Other Former Soviet Union3 29 232 12 995 2 965 524 970 5 663 3 935
Other import areas3 ‐ 91 553 480 470 129 ‐ 765 609
Total imports 85 887 68 806 18 146 5 423 5 578 24 116 23 724
1. Total gasoline includes motor gasoline, jet gasoline and aviation gasoline.
2. Middle distillates include gas/diesel oil, jet kerosene and other kerosene.
3. For regional breakdown, see Appendix.
For country specific notes on data, please see the geographical notes in the Appendix. Trade amounts include intra‐regional trade.
Apr‐18Apr‐171Q201820172016Imports from:
Apr‐18Apr‐171Q201820172016Imports from:
Imports from:2016 2017 1Q2018 Apr‐17 Apr‐18
© OECD/IEA, 2018 17 International Energy Agency
Monthly Oil Statistics
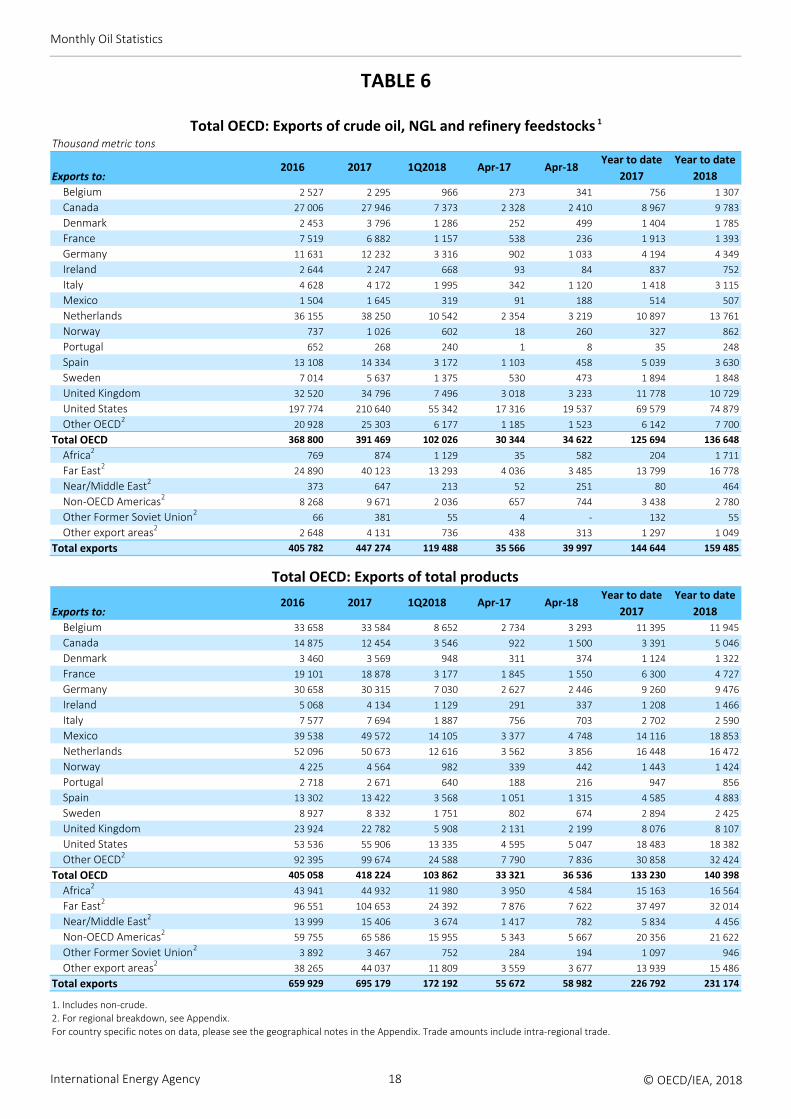
TABLE 6
Total OECD: Exports of crude oil, NGL and refinery feedstocks 1
Thousand metric tons
Year to date Year to date
2017 2018
Belgium 2 527 2 295 966 273 341 756 1 307
Canada 27 006 27 946 7 373 2 328 2 410 8 967 9 783
Denmark 2 453 3 796 1 286 252 499 1 404 1 785
France 7 519 6 882 1 157 538 236 1 913 1 393
Germany 11 631 12 232 3 316 902 1 033 4 194 4 349
Ireland 2 644 2 247 668 93 84 837 752
Italy 4 628 4 172 1 995 342 1 120 1 418 3 115
Mexico 1 504 1 645 319 91 188 514 507
Netherlands 36 155 38 250 10 542 2 354 3 219 10 897 13 761
Norway 737 1 026 602 18 260 327 862
Portugal 652 268 240 1 8 35 248
Spain 13 108 14 334 3 172 1 103 458 5 039 3 630
Sweden 7 014 5 637 1 375 530 473 1 894 1 848
United Kingdom 32 520 34 796 7 496 3 018 3 233 11 778 10 729
United States 197 774 210 640 55 342 17 316 19 537 69 579 74 879
Other OECD2 20 928 25 303 6 177 1 185 1 523 6 142 7 700
Total OECD 368 800 391 469 102 026 30 344 34 622 125 694 136 648
Africa2 769 874 1 129 35 582 204 1 711
Far East2 24 890 40 123 13 293 4 036 3 485 13 799 16 778
Near/Middle East2 373 647 213 52 251 80 464
Non‐OECD Americas2 8 268 9 671 2 036 657 744 3 438 2 780
Other Former Soviet Union2 66 381 55 4 ‐ 132 55
Other export areas2 2 648 4 131 736 438 313 1 297 1 049
Total exports 405 782 447 274 119 488 35 566 39 997 144 644 159 485
Total OECD: Exports of total productsYear to date Year to date
2017 2018
Belgium 33 658 33 584 8 652 2 734 3 293 11 395 11 945
Canada 14 875 12 454 3 546 922 1 500 3 391 5 046
Denmark 3 460 3 569 948 311 374 1 124 1 322
France 19 101 18 878 3 177 1 845 1 550 6 300 4 727
Germany 30 658 30 315 7 030 2 627 2 446 9 260 9 476
Ireland 5 068 4 134 1 129 291 337 1 208 1 466
Italy 7 577 7 694 1 887 756 703 2 702 2 590
Mexico 39 538 49 572 14 105 3 377 4 748 14 116 18 853
Netherlands 52 096 50 673 12 616 3 562 3 856 16 448 16 472
Norway 4 225 4 564 982 339 442 1 443 1 424
Portugal 2 718 2 671 640 188 216 947 856
Spain 13 302 13 422 3 568 1 051 1 315 4 585 4 883
Sweden 8 927 8 332 1 751 802 674 2 894 2 425
United Kingdom 23 924 22 782 5 908 2 131 2 199 8 076 8 107
United States 53 536 55 906 13 335 4 595 5 047 18 483 18 382
Other OECD2 92 395 99 674 24 588 7 790 7 836 30 858 32 424
Total OECD 405 058 418 224 103 862 33 321 36 536 133 230 140 398
Africa2 43 941 44 932 11 980 3 950 4 584 15 163 16 564
Far East2 96 551 104 653 24 392 7 876 7 622 37 497 32 014
Near/Middle East2 13 999 15 406 3 674 1 417 782 5 834 4 456
Non‐OECD Americas2 59 755 65 586 15 955 5 343 5 667 20 356 21 622
Other Former Soviet Union2 3 892 3 467 752 284 194 1 097 946
Other export areas2 38 265 44 037 11 809 3 559 3 677 13 939 15 486
Total exports 659 929 695 179 172 192 55 672 58 982 226 792 231 174
1. Includes non‐crude.
2. For regional breakdown, see Appendix.
For country specific notes on data, please see the geographical notes in the Appendix. Trade amounts include intra‐regional trade.
Exports to:2016 2017 1Q2018 Apr‐17 Apr‐18
Apr‐18Apr‐171Q20182017Exports to:
2016
International Energy Agency 18 © OECD/IEA, 2018
Monthly Oil Statistics
TABLE 7
Refinery gross output in OECD regionsThousand metric tons
Year to Year to %Change %Change
2016 2017 1Q2018 Apr‐17 Apr‐18 date date current year to
2017 2018 month1 date2
OECD Americas
Liquefied petroleum gases 12 385 12 542 1 705 1 596 1 466 3 822 3 171 ‐8.1 ‐17.0
Naphtha 15 263 14 550 3 134 1 222 979 4 907 4 113 ‐19.9 ‐16.2
Total gasoline3 411 116 409 708 100 909 33 202 32 877 131 893 133 786 ‐1.0 1.4
Total kerosene4 84 701 87 468 21 585 7 390 7 305 28 057 28 890 ‐1.2 3.0
Gas/diesel oil 284 045 284 665 67 325 23 131 23 245 90 539 90 570 0.5 ‐
Residual fuel oil 41 288 42 127 9 931 3 570 3 632 15 162 13 563 1.7 ‐10.5
Other products 140 766 146 530 35 001 12 382 11 935 48 056 46 936 ‐3.6 ‐2.3
Total products 989 564 997 590 239 590 82 493 81 439 322 436 321 029 ‐1.3 ‐0.4
OECD Asia Oceania
Liquefied petroleum gases 7 191 8 020 1 994 683 666 2 654 2 660 ‐2.5 0.2
Naphtha 46 416 50 414 13 041 3 730 4 126 16 777 17 167 10.6 2.3
Total gasoline3 70 950 71 015 17 356 5 792 5 689 23 543 23 045 ‐1.8 ‐2.1
Total kerosene4 53 512 54 783 14 239 4 218 4 003 18 904 18 242 ‐5.1 ‐3.5
Gas/diesel oil 105 169 106 499 25 914 8 759 8 619 35 137 34 533 ‐1.6 ‐1.7
Residual fuel oil 32 441 29 058 8 237 2 118 2 577 9 856 10 814 21.7 9.7
Other products 36 311 35 510 8 949 2 895 2 965 11 919 11 914 2.4 ‐
Total products 351 990 355 299 89 730 28 195 28 645 118 790 118 375 1.6 ‐0.3
OECD Europe
Liquefied petroleum gases 16 667 17 918 4 458 1 604 1 508 5 842 5 966 ‐6.0 2.1
Naphtha 42 772 45 793 12 080 3 841 3 686 15 469 15 766 ‐4.0 1.9
Total gasoline3 123 031 121 421 29 514 9 664 9 371 39 141 38 885 ‐3.0 ‐0.7
Total kerosene4 49 229 52 554 12 874 4 418 4 469 16 694 17 343 1.2 3.9
Gas/diesel oil 260 328 263 593 63 455 21 486 20 962 86 008 84 417 ‐2.4 ‐1.8
Residual fuel oil 75 240 77 861 20 123 6 247 6 328 26 356 26 451 1.3 0.4
Other products 83 109 83 449 17 374 6 933 6 185 25 334 23 559 ‐10.8 ‐7.0
Total products 650 376 662 589 159 878 54 193 52 509 214 844 212 387 ‐3.1 ‐1.1
Total OECD
Liquefied petroleum gases 36 243 38 480 8 157 3 883 3 640 12 318 11 797 ‐6.3 ‐4.2
Naphtha 104 451 110 757 28 255 8 793 8 791 37 153 37 046 ‐ ‐0.3
Total gasoline3 605 097 602 144 147 779 48 658 47 937 194 577 195 716 ‐1.5 0.6
Total kerosene4 187 442 194 805 48 698 16 026 15 777 63 655 64 475 ‐1.6 1.3
Gas/diesel oil 649 542 654 757 156 694 53 376 52 826 211 684 209 520 ‐1.0 ‐1.0
Residual fuel oil 148 969 149 046 38 291 11 935 12 537 51 374 50 828 5.0 ‐1.1
Other products 260 186 265 489 61 324 22 210 21 085 85 309 82 409 ‐5.1 ‐3.4
Total products 1 991 930 2 015 478 489 198 164 881 162 593 656 070 651 791 ‐1.4 ‐0.7
1. Percentage change over corresponding month of previous year.
2. Percentage change over corresponding period (beginning of year to current month) of previous year.
3. Total gasoline includes motor gasoline, jet gasoline and aviation gasoline.
4. Total kerosene includes jet kerosene and other kerosene.
For country specific notes on data, please see the geographical notes in the Appendix. Trade amounts include intra‐regional trade.
© OECD/IEA, 2018 19 International Energy Agency
Monthly Oil Statistics
TABLE 8.1
Net deliveries in OECD countriesThousand metric tons
Year to Year to %Change %Change
2016 2017 1Q2018 Apr‐17 Apr‐18 date date current year to
2017 2018 month1 date2
OECD Americas
Liquefied petroleum gases 43 226 40 034 13 728 3 117 3 254 14 605 16 982 4.4 16.3
Naphtha 14 796 14 601 2 933 1 245 1 035 4 887 3 968 ‐16.9 ‐18.8
Total gasoline3 477 157 472 935 112 223 38 593 38 950 149 698 151 173 0.9 1.0
Total kerosene4 85 764 89 887 21 946 7 126 7 101 28 319 29 047 ‐0.4 2.6
Gas/diesel oil 245 623 244 546 63 170 19 014 20 657 78 797 83 827 8.6 6.4
Residual fuel oil 12 300 14 099 3 280 1 114 1 116 4 487 4 396 0.2 ‐2.0
Other products 95 002 104 365 23 988 7 819 8 303 31 214 32 291 6.2 3.5
Total products 973 868 980 467 241 268 78 028 80 416 312 007 321 684 3.1 3.1
OECD Asia Oceania
Liquefied petroleum gases 24 291 23 179 6 326 1 901 1 846 8 313 8 172 ‐2.9 ‐1.7
Naphtha 74 405 79 151 19 348 6 229 6 342 26 280 25 690 1.8 ‐2.2
Total gasoline3 61 596 60 979 14 688 4 911 4 793 18 978 19 481 ‐2.4 2.7
Total kerosene4 41 495 42 410 13 598 3 042 2 963 16 373 16 561 ‐2.6 1.1
Gas/diesel oil 86 449 89 893 22 825 7 136 7 433 29 110 30 258 4.2 3.9
Residual fuel oil 16 860 12 510 4 074 1 116 794 4 933 4 868 ‐28.9 ‐1.3
Other products 21 017 19 005 4 862 1 534 1 559 6 407 6 421 1.6 0.2
Total products 326 113 327 127 85 721 25 869 25 730 110 394 111 451 ‐0.5 1.0
OECD Europe
Liquefied petroleum gases 34 919 33 683 9 092 2 824 2 719 11 600 11 811 ‐3.7 1.8
Naphtha 45 150 47 752 11 357 3 785 3 377 16 128 14 734 ‐10.8 ‐8.6
Total gasoline3 75 048 75 140 18 716 6 161 6 768 23 317 25 484 9.9 9.3
Total kerosene4 64 080 67 740 15 608 5 364 5 605 20 191 21 213 4.5 5.1
Gas/diesel oil 298 071 306 610 75 465 24 024 24 965 97 730 100 430 3.9 2.8
Residual fuel oil 11 897 12 800 3 761 939 1 196 4 203 4 957 27.4 17.9
Other products 51 160 50 540 10 443 3 869 3 861 14 532 14 304 ‐0.2 ‐1.6
Total products 580 325 594 265 144 442 46 966 48 491 187 701 192 933 3.2 2.8
Total OECD
Liquefied petroleum gases 102 436 96 896 29 146 7 842 7 819 34 518 36 965 ‐0.3 7.1
Naphtha 134 351 141 504 33 638 11 259 10 754 47 295 44 392 ‐4.5 ‐6.1
Total gasoline3 613 801 609 054 145 627 49 665 50 511 191 993 196 138 1.7 2.2
Total kerosene4 191 339 200 037 51 152 15 532 15 669 64 883 66 821 0.9 3.0
Gas/diesel oil 630 143 641 049 161 460 50 174 53 055 205 637 214 515 5.7 4.3
Residual fuel oil 41 057 39 409 11 115 3 169 3 106 13 623 14 221 ‐2.0 4.4
Other products 167 179 173 910 39 293 13 222 13 723 52 153 53 016 3.8 1.7
Total products 1 880 306 1 901 859 471 431 150 863 154 637 610 102 626 068 2.5 2.6
1. Percentage change over corresponding month of previous year.
2. Percentage change over corresponding period (beginning of year to current month) of previous year.
3. Total gasoline includes motor gasoline, jet gasoline and aviation gasoline.
4. Total kerosene includes jet kerosene and other kerosene.
For country specific notes on data, please see the geographical notes in the Appendix. Trade amounts include intra‐regional trade.
International Energy Agency 20 © OECD/IEA, 2018
Monthly Oil Statistics
TABLE 8.2
Net deliveries in OECD countriesThousand metric tons
Year to Year to %Change %Change
2016 2017 1Q2018 Apr‐17 Apr‐18 date date current year to
2017 2018 month1 date2
Australia
Liquefied petroleum gases 1 602 1 505 259 124 88 472 347 ‐29.0 ‐26.5
Naphtha 17 ‐ 18 5 1 8 ‐ 5 13 700.0 ‐360.0
Total gasoline3 13 458 13 582 3 349 1 071 1 070 4 424 4 419 ‐0.1 ‐0.1
Total kerosene4 6 979 7 254 1 840 578 607 2 354 2 447 5.0 4.0
Gas/diesel oil 19 784 23 093 5 876 1 827 2 017 7 075 7 893 10.4 11.6
Residual fuel oil 37 96 54 11 24 25 78 118.2 212.0
Other products 1 280 1 290 374 107 149 432 523 39.3 21.1
Total products 43 157 46 802 11 757 3 719 3 963 14 777 15 720 6.6 6.4
Austria
Liquefied petroleum gases 81 82 26 6 7 31 33 16.7 6.5
Naphtha 964 800 253 42 85 289 338 102.4 17.0
Total gasoline3 1 637 1 618 356 133 134 478 490 0.8 2.5
Total kerosene4 765 740 169 61 64 227 233 4.9 2.6
Gas/diesel oil 7 911 8 155 1 932 649 664 2 578 2 596 2.3 0.7
Residual fuel oil 238 159 33 8 5 93 38 ‐37.5 ‐59.1
Other products 609 592 63 40 47 108 110 17.5 1.9
Total products 12 205 12 146 2 832 939 1 006 3 804 3 838 7.1 0.9
Belgium
Liquefied petroleum gases 2 114 1 901 573 178 187 562 760 5.1 35.2
Naphtha 5 648 5 329 1 402 377 381 1 766 1 783 1.1 1.0
Total gasoline3 1 477 1 549 395 127 141 487 536 11.0 10.1
Total kerosene4 1 453 1 615 396 130 149 488 545 14.6 11.7
Gas/diesel oil 10 730 10 492 2 969 853 786 3 786 3 755 ‐7.9 ‐0.8
Residual fuel oil 59 62 15 4 5 21 20 25.0 ‐4.8
Other products 1 679 1 025 163 85 64 324 227 ‐24.7 ‐29.9
Total products 23 160 21 973 5 913 1 754 1 713 7 434 7 626 ‐2.3 2.6
Canada
Liquefied petroleum gases 4 488 4 742 1 280 294 150 1 474 1 430 ‐49.0 ‐3.0
Naphtha 4 411 4 120 613 365 209 1 305 822 ‐42.7 ‐37.0
Total gasoline3 34 602 34 583 7 769 2 661 2 688 10 662 10 457 1.0 ‐1.9
Total kerosene4 6 530 6 942 1 632 510 513 2 075 2 145 0.6 3.4
Gas/diesel oil 26 652 28 595 6 805 1 937 1 987 8 682 8 792 2.6 1.3
Residual fuel oil 2 156 2 640 724 160 235 822 959 46.9 16.7
Other products 14 706 14 222 3 264 1 084 1 071 4 447 4 335 ‐1.2 ‐2.5
Total products 93 545 95 844 22 087 7 011 6 853 29 467 28 940 ‐2.3 ‐1.8
Chile
Liquefied petroleum gases 1 186 1 162 256 91 78 311 334 ‐14.3 7.4
Naphtha 113 82 13 ‐ 37 25 50 ‐ 100.0
Total gasoline3 3 313 3 411 898 269 311 1 134 1 209 15.6 6.6
Total kerosene4 1 183 1 353 348 94 70 407 418 ‐25.5 2.7
Gas/diesel oil 8 205 8 201 2 108 650 799 2 644 2 907 22.9 9.9
Residual fuel oil 848 866 219 80 73 334 292 ‐8.7 ‐12.6
Other products 519 534 162 59 115 210 277 94.9 31.9
Total products 15 367 15 609 4 004 1 243 1 483 5 065 5 487 19.3 8.3
1. Percentage change over corresponding month of previous year.
2. Percentage change over corresponding period (beginning of year to current month) of previous year.
3. Total gasoline includes motor gasoline, jet gasoline and aviation gasoline.
4. Total kerosene includes jet kerosene and other kerosene.
For country specific notes on data, please see the geographical notes in the Appendix. Trade amounts include intra‐regional trade.
© OECD/IEA, 2018 21 International Energy Agency
Monthly Oil Statistics
TABLE 8.3
Net deliveries in OECD countriesThousand metric tons
Year to Year to %Change %Change
2016 2017 1Q2018 Apr‐17 Apr‐18 date date current year to
2017 2018 month1 date2
Czech Republic
Liquefied petroleum gases 242 439 129 39 34 138 163 ‐12.8 18.1
Naphtha 178 942 277 87 77 277 354 ‐11.5 27.8
Total gasoline3 1 608 1 603 338 131 132 483 470 0.8 ‐2.7
Total kerosene4 346 397 80 30 27 100 107 ‐10.0 7.0
Gas/diesel oil 4 777 4 902 1 103 392 400 1 477 1 503 2.0 1.8
Residual fuel oil 59 56 7 6 2 28 9 ‐66.7 ‐67.9
Other products 1 021 1 290 247 100 81 359 328 ‐19.0 ‐8.6
Total products 8 231 9 629 2 181 785 753 2 862 2 934 ‐4.1 2.5
Denmark
Liquefied petroleum gases 50 53 14 4 4 16 18 ‐ 12.5
Naphtha ‐ ‐ ‐ ‐ ‐ ‐ ‐ ‐ ‐
Total gasoline3 1 329 1 323 302 104 108 410 410 3.8 ‐
Total kerosene4 1 005 1 021 210 77 62 295 272 ‐19.5 ‐7.8
Gas/diesel oil 3 774 3 847 998 305 341 1 259 1 339 11.8 6.4
Residual fuel oil 78 74 5 3 2 13 7 ‐33.3 ‐46.2
Other products 430 476 65 36 37 126 102 2.8 ‐19.0
Total products 6 666 6 794 1 594 529 554 2 119 2 148 4.7 1.4
Estonia
Liquefied petroleum gases 13 7 3 ‐ 1 5 4 ‐ ‐20.0
Naphtha ‐ ‐ ‐ ‐ ‐ ‐ ‐ ‐ ‐
Total gasoline3 251 260 60 17 19 94 79 11.8 ‐16.0
Total kerosene4 40 43 6 3 2 13 8 ‐33.3 ‐38.5
Gas/diesel oil 652 660 161 39 51 222 212 30.8 ‐4.5
Residual fuel oil 51 30 10 2 2 13 12 ‐ ‐7.7
Other products ‐ ‐ ‐ ‐ ‐ ‐ ‐ ‐ ‐
Total products 1 007 1 000 240 61 75 347 315 23.0 ‐9.2
Finland
Liquefied petroleum gases 516 446 124 39 37 171 161 ‐5.1 ‐5.8
Naphtha 1 ‐ ‐ ‐ ‐ ‐ ‐ ‐ ‐
Total gasoline3 1 466 1 439 324 113 111 434 435 ‐1.8 0.2
Total kerosene4 729 773 198 61 66 236 264 8.2 11.9
Gas/diesel oil 4 132 4 170 1 103 310 330 1 309 1 433 6.5 9.5
Residual fuel oil 481 393 90 31 25 137 115 ‐19.4 ‐16.1
Other products 208 73 ‐ 15 ‐ 3 ‐ 7 ‐ 7 ‐ 22 133.3 214.3
Total products 7 533 7 294 1 824 551 562 2 280 2 386 2.0 4.6
France
Liquefied petroleum gases 3 902 3 490 1 069 267 285 1 376 1 354 6.7 ‐1.6
Naphtha 4 538 4 462 1 220 382 456 1 668 1 676 19.4 0.5
Total gasoline3 6 285 6 768 1 605 559 615 2 027 2 220 10.0 9.5
Total kerosene4 6 962 7 506 1 741 611 608 2 281 2 349 ‐0.5 3.0
Gas/diesel oil 46 400 47 326 11 666 3 633 3 692 15 510 15 358 1.6 ‐1.0
Residual fuel oil 636 1 297 295 84 75 489 370 ‐10.7 ‐24.3
Other products 5 516 5 732 1 114 413 539 1 477 1 653 30.5 11.9
Total products 74 239 76 581 18 710 5 949 6 270 24 828 24 980 5.4 0.6
1. Percentage change over corresponding month of previous year.
2. Percentage change over corresponding period (beginning of year to current month) of previous year.
3. Total gasoline includes motor gasoline, jet gasoline and aviation gasoline.
4. Total kerosene includes jet kerosene and other kerosene.
For country specific notes on data, please see the geographical notes in the Appendix. Trade amounts include intra‐regional trade.
International Energy Agency 22 © OECD/IEA, 2018
Monthly Oil Statistics
TABLE 8.4
Net deliveries in OECD countriesThousand metric tons
Year to Year to %Change %Change
2016 2017 1Q2018 Apr‐17 Apr‐18 date date current year to
2017 2018 month1 date2
Germany
Liquefied petroleum gases 3 047 3 918 879 339 306 1 297 1 185 ‐9.7 ‐8.6
Naphtha 15 560 15 351 2 979 1 329 868 5 397 3 847 ‐34.7 ‐28.7
Total gasoline3 13 994 14 369 4 256 1 190 1 431 4 512 5 687 20.3 26.0
Total kerosene4 9 200 9 988 2 130 817 806 3 066 2 936 ‐1.3 ‐4.2
Gas/diesel oil 53 714 54 538 13 155 4 260 4 157 17 742 17 312 ‐2.4 ‐2.4
Residual fuel oil 2 786 2 988 977 295 315 1 022 1 292 6.8 26.4
Other products 5 753 5 328 958 441 357 1 595 1 315 ‐19.0 ‐17.6
Total products 104 054 106 480 25 334 8 671 8 240 34 631 33 574 ‐5.0 ‐3.1
Greece
Liquefied petroleum gases 512 516 127 39 39 162 166 ‐ 2.5
Naphtha 4 6 4 ‐ 1 1 5 ‐ 400.0
Total gasoline3 2 424 2 351 520 185 186 695 706 0.5 1.6
Total kerosene4 1 170 1 278 157 73 80 196 237 9.6 20.9
Gas/diesel oil 4 381 4 444 1 150 315 306 1 606 1 456 ‐2.9 ‐9.3
Residual fuel oil 1 411 1 435 296 108 98 428 394 ‐9.3 ‐7.9
Other products 1 381 1 173 239 109 67 420 306 ‐38.5 ‐27.1
Total products 11 283 11 203 2 493 829 777 3 508 3 270 ‐6.3 ‐6.8
Hungary
Liquefied petroleum gases 490 555 146 46 43 186 189 ‐6.5 1.6
Naphtha 880 1 053 266 89 91 397 357 2.2 ‐10.1
Total gasoline3 1 341 1 340 325 92 116 386 441 26.1 14.2
Total kerosene4 195 226 54 18 21 71 75 16.7 5.6
Gas/diesel oil 3 270 3 659 871 296 255 1 086 1 126 ‐13.9 3.7
Residual fuel oil 6 14 3 ‐ ‐ 10 3 ‐ ‐70.0
Other products 459 361 84 28 48 92 132 71.4 43.5
Total products 6 641 7 208 1 749 569 574 2 228 2 323 0.9 4.3
Iceland
Liquefied petroleum gases ‐ ‐ ‐ ‐ ‐ ‐ ‐ ‐ ‐
Naphtha ‐ ‐ ‐ ‐ ‐ ‐ ‐ ‐ ‐
Total gasoline3 135 137 28 8 11 38 39 37.5 2.6
Total kerosene4 278 320 66 1 24 33 90 2300.0 172.7
Gas/diesel oil 353 359 69 14 27 76 96 92.9 26.3
Residual fuel oil ‐ ‐ ‐ ‐ ‐ ‐ ‐ ‐ ‐
Other products 18 15 9 1 1 6 10 ‐ 66.7
Total products 784 831 172 24 63 153 235 162.5 53.6
Ireland
Liquefied petroleum gases 144 148 51 11 15 55 66 36.4 20.0
Naphtha ‐ ‐ 4 ‐ ‐ ‐ 4 ‐ ‐
Total gasoline3 993 905 196 76 65 303 261 ‐14.5 ‐13.9
Total kerosene4 1 695 1 801 531 126 138 562 669 9.5 19.0
Gas/diesel oil 3 593 3 684 915 295 310 1 171 1 225 5.1 4.6
Residual fuel oil 104 74 24 7 5 25 29 ‐28.6 16.0
Other products 434 432 117 36 39 144 156 8.3 8.3
Total products 6 963 7 044 1 838 551 572 2 260 2 410 3.8 6.6
1. Percentage change over corresponding month of previous year.
2. Percentage change over corresponding period (beginning of year to current month) of previous year.
3. Total gasoline includes motor gasoline, jet gasoline and aviation gasoline.
4. Total kerosene includes jet kerosene and other kerosene.
For country specific notes on data, please see the geographical notes in the Appendix. Trade amounts include intra‐regional trade.
© OECD/IEA, 2018 23 International Energy Agency
Monthly Oil Statistics
TABLE 8.5
Net deliveries in OECD countriesThousand metric tons
Year to Year to %Change %Change
2016 2017 1Q2018 Apr‐17 Apr‐18 date date current year to
2017 2018 month1 date2
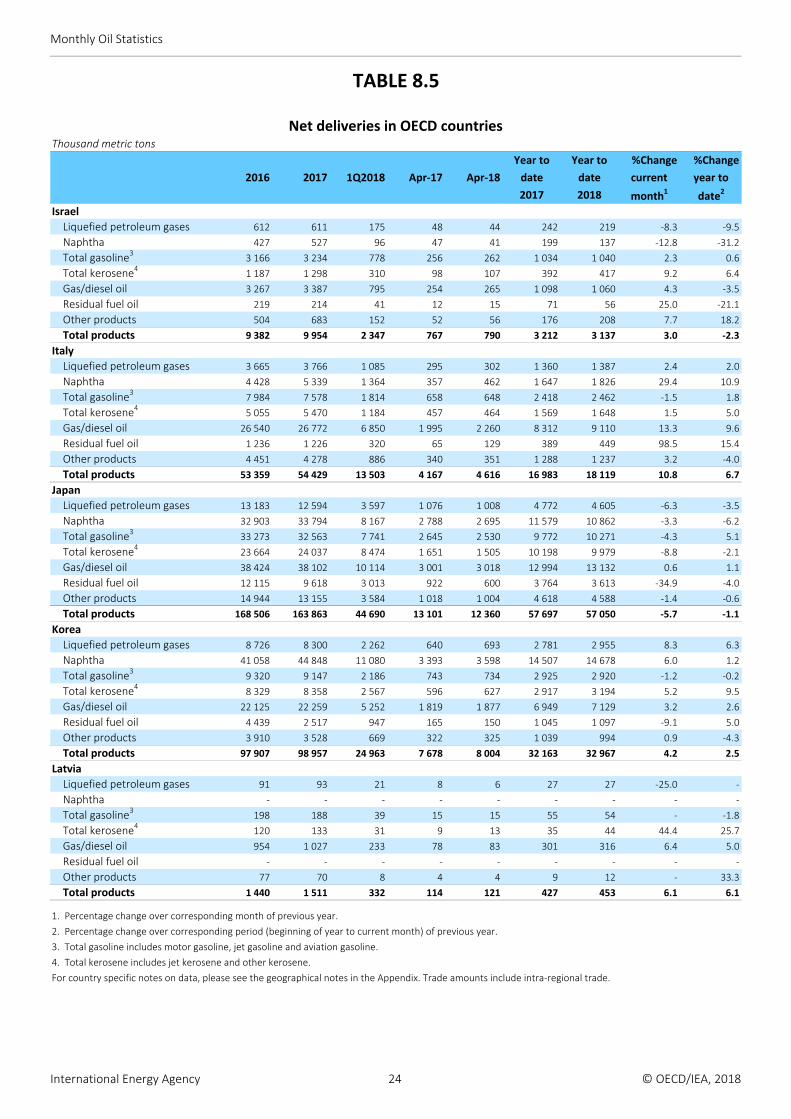
Israel
Liquefied petroleum gases 612 611 175 48 44 242 219 ‐8.3 ‐9.5
Naphtha 427 527 96 47 41 199 137 ‐12.8 ‐31.2
Total gasoline3 3 166 3 234 778 256 262 1 034 1 040 2.3 0.6
Total kerosene4 1 187 1 298 310 98 107 392 417 9.2 6.4
Gas/diesel oil 3 267 3 387 795 254 265 1 098 1 060 4.3 ‐3.5
Residual fuel oil 219 214 41 12 15 71 56 25.0 ‐21.1
Other products 504 683 152 52 56 176 208 7.7 18.2
Total products 9 382 9 954 2 347 767 790 3 212 3 137 3.0 ‐2.3
Italy
Liquefied petroleum gases 3 665 3 766 1 085 295 302 1 360 1 387 2.4 2.0
Naphtha 4 428 5 339 1 364 357 462 1 647 1 826 29.4 10.9
Total gasoline3 7 984 7 578 1 814 658 648 2 418 2 462 ‐1.5 1.8
Total kerosene4 5 055 5 470 1 184 457 464 1 569 1 648 1.5 5.0
Gas/diesel oil 26 540 26 772 6 850 1 995 2 260 8 312 9 110 13.3 9.6
Residual fuel oil 1 236 1 226 320 65 129 389 449 98.5 15.4
Other products 4 451 4 278 886 340 351 1 288 1 237 3.2 ‐4.0
Total products 53 359 54 429 13 503 4 167 4 616 16 983 18 119 10.8 6.7
Japan
Liquefied petroleum gases 13 183 12 594 3 597 1 076 1 008 4 772 4 605 ‐6.3 ‐3.5
Naphtha 32 903 33 794 8 167 2 788 2 695 11 579 10 862 ‐3.3 ‐6.2
Total gasoline3 33 273 32 563 7 741 2 645 2 530 9 772 10 271 ‐4.3 5.1
Total kerosene4 23 664 24 037 8 474 1 651 1 505 10 198 9 979 ‐8.8 ‐2.1
Gas/diesel oil 38 424 38 102 10 114 3 001 3 018 12 994 13 132 0.6 1.1
Residual fuel oil 12 115 9 618 3 013 922 600 3 764 3 613 ‐34.9 ‐4.0
Other products 14 944 13 155 3 584 1 018 1 004 4 618 4 588 ‐1.4 ‐0.6
Total products 168 506 163 863 44 690 13 101 12 360 57 697 57 050 ‐5.7 ‐1.1
Korea
Liquefied petroleum gases 8 726 8 300 2 262 640 693 2 781 2 955 8.3 6.3
Naphtha 41 058 44 848 11 080 3 393 3 598 14 507 14 678 6.0 1.2
Total gasoline3 9 320 9 147 2 186 743 734 2 925 2 920 ‐1.2 ‐0.2
Total kerosene4 8 329 8 358 2 567 596 627 2 917 3 194 5.2 9.5
Gas/diesel oil 22 125 22 259 5 252 1 819 1 877 6 949 7 129 3.2 2.6
Residual fuel oil 4 439 2 517 947 165 150 1 045 1 097 ‐9.1 5.0
Other products 3 910 3 528 669 322 325 1 039 994 0.9 ‐4.3
Total products 97 907 98 957 24 963 7 678 8 004 32 163 32 967 4.2 2.5
Latvia
Liquefied petroleum gases 91 93 21 8 6 27 27 ‐25.0 ‐
Naphtha ‐ ‐ ‐ ‐ ‐ ‐ ‐ ‐ ‐
Total gasoline3 198 188 39 15 15 55 54 ‐ ‐1.8
Total kerosene4 120 133 31 9 13 35 44 44.4 25.7
Gas/diesel oil 954 1 027 233 78 83 301 316 6.4 5.0
Residual fuel oil ‐ ‐ ‐ ‐ ‐ ‐ ‐ ‐ ‐
Other products 77 70 8 4 4 9 12 ‐ 33.3
Total products 1 440 1 511 332 114 121 427 453 6.1 6.1
1. Percentage change over corresponding month of previous year.
2. Percentage change over corresponding period (beginning of year to current month) of previous year.
3. Total gasoline includes motor gasoline, jet gasoline and aviation gasoline.
4. Total kerosene includes jet kerosene and other kerosene.
For country specific notes on data, please see the geographical notes in the Appendix. Trade amounts include intra‐regional trade.
International Energy Agency 24 © OECD/IEA, 2018
Monthly Oil Statistics
TABLE 8.6
Net deliveries in OECD countriesThousand metric tons
Year to Year to %Change %Change
2016 2017 1Q2018 Apr‐17 Apr‐18 date date current year to
2017 2018 month1 date2
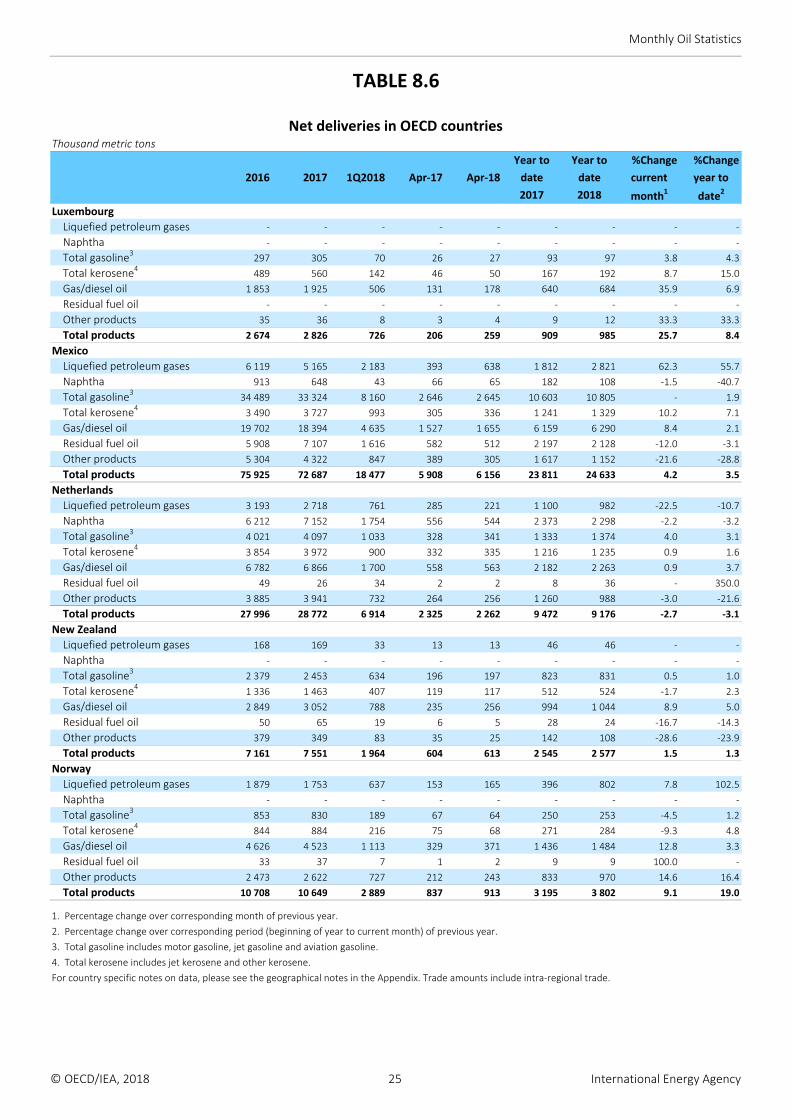
Luxembourg
Liquefied petroleum gases ‐ ‐ ‐ ‐ ‐ ‐ ‐ ‐ ‐
Naphtha ‐ ‐ ‐ ‐ ‐ ‐ ‐ ‐ ‐
Total gasoline3 297 305 70 26 27 93 97 3.8 4.3
Total kerosene4 489 560 142 46 50 167 192 8.7 15.0
Gas/diesel oil 1 853 1 925 506 131 178 640 684 35.9 6.9
Residual fuel oil ‐ ‐ ‐ ‐ ‐ ‐ ‐ ‐ ‐
Other products 35 36 8 3 4 9 12 33.3 33.3
Total products 2 674 2 826 726 206 259 909 985 25.7 8.4
Mexico
Liquefied petroleum gases 6 119 5 165 2 183 393 638 1 812 2 821 62.3 55.7
Naphtha 913 648 43 66 65 182 108 ‐1.5 ‐40.7
Total gasoline3 34 489 33 324 8 160 2 646 2 645 10 603 10 805 ‐ 1.9
Total kerosene4 3 490 3 727 993 305 336 1 241 1 329 10.2 7.1
Gas/diesel oil 19 702 18 394 4 635 1 527 1 655 6 159 6 290 8.4 2.1
Residual fuel oil 5 908 7 107 1 616 582 512 2 197 2 128 ‐12.0 ‐3.1
Other products 5 304 4 322 847 389 305 1 617 1 152 ‐21.6 ‐28.8
Total products 75 925 72 687 18 477 5 908 6 156 23 811 24 633 4.2 3.5
Netherlands
Liquefied petroleum gases 3 193 2 718 761 285 221 1 100 982 ‐22.5 ‐10.7
Naphtha 6 212 7 152 1 754 556 544 2 373 2 298 ‐2.2 ‐3.2
Total gasoline3 4 021 4 097 1 033 328 341 1 333 1 374 4.0 3.1
Total kerosene4 3 854 3 972 900 332 335 1 216 1 235 0.9 1.6
Gas/diesel oil 6 782 6 866 1 700 558 563 2 182 2 263 0.9 3.7
Residual fuel oil 49 26 34 2 2 8 36 ‐ 350.0
Other products 3 885 3 941 732 264 256 1 260 988 ‐3.0 ‐21.6
Total products 27 996 28 772 6 914 2 325 2 262 9 472 9 176 ‐2.7 ‐3.1
New Zealand
Liquefied petroleum gases 168 169 33 13 13 46 46 ‐ ‐
Naphtha ‐ ‐ ‐ ‐ ‐ ‐ ‐ ‐ ‐
Total gasoline3 2 379 2 453 634 196 197 823 831 0.5 1.0
Total kerosene4 1 336 1 463 407 119 117 512 524 ‐1.7 2.3
Gas/diesel oil 2 849 3 052 788 235 256 994 1 044 8.9 5.0
Residual fuel oil 50 65 19 6 5 28 24 ‐16.7 ‐14.3
Other products 379 349 83 35 25 142 108 ‐28.6 ‐23.9
Total products 7 161 7 551 1 964 604 613 2 545 2 577 1.5 1.3
Norway
Liquefied petroleum gases 1 879 1 753 637 153 165 396 802 7.8 102.5
Naphtha ‐ ‐ ‐ ‐ ‐ ‐ ‐ ‐ ‐
Total gasoline3 853 830 189 67 64 250 253 ‐4.5 1.2
Total kerosene4 844 884 216 75 68 271 284 ‐9.3 4.8
Gas/diesel oil 4 626 4 523 1 113 329 371 1 436 1 484 12.8 3.3
Residual fuel oil 33 37 7 1 2 9 9 100.0 ‐
Other products 2 473 2 622 727 212 243 833 970 14.6 16.4
Total products 10 708 10 649 2 889 837 913 3 195 3 802 9.1 19.0
1. Percentage change over corresponding month of previous year.
2. Percentage change over corresponding period (beginning of year to current month) of previous year.
3. Total gasoline includes motor gasoline, jet gasoline and aviation gasoline.
4. Total kerosene includes jet kerosene and other kerosene.
For country specific notes on data, please see the geographical notes in the Appendix. Trade amounts include intra‐regional trade.
© OECD/IEA, 2018 25 International Energy Agency
Monthly Oil Statistics
TABLE 8.7
Net deliveries in OECD countriesThousand metric tons
Year to Year to %Change %Change
2016 2017 1Q2018 Apr‐17 Apr‐18 date date current year to
2017 2018 month1 date2
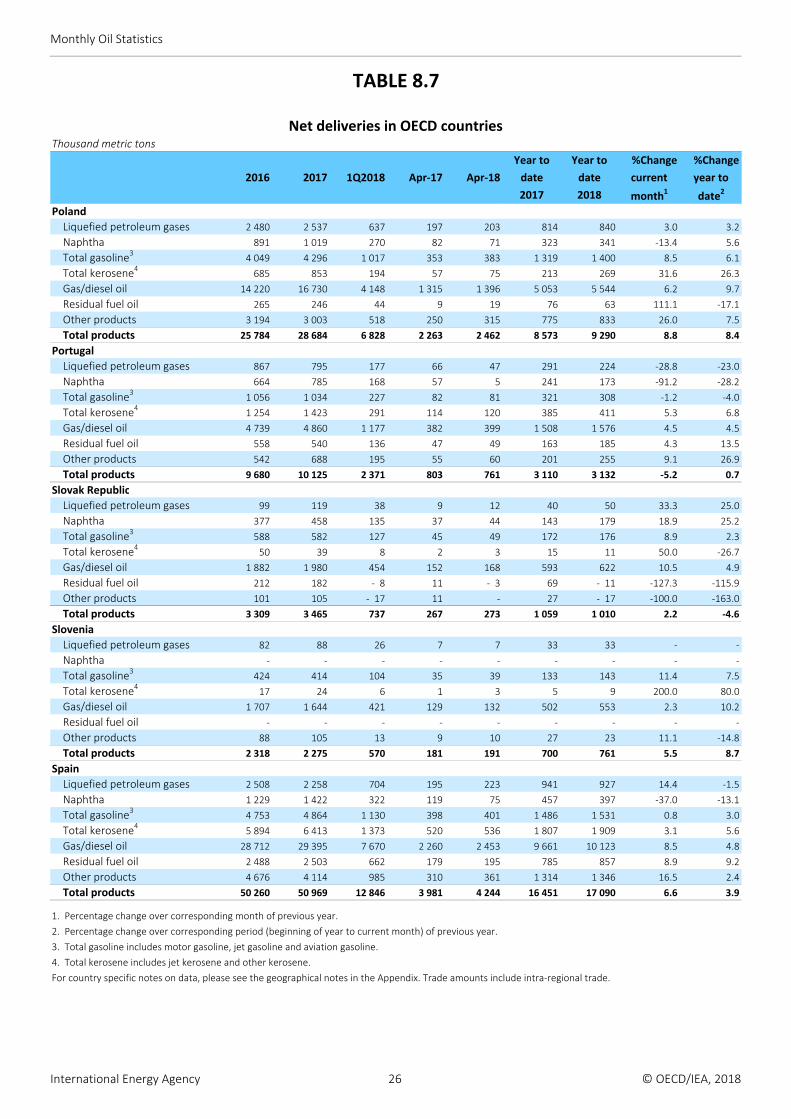
Poland
Liquefied petroleum gases 2 480 2 537 637 197 203 814 840 3.0 3.2
Naphtha 891 1 019 270 82 71 323 341 ‐13.4 5.6
Total gasoline3 4 049 4 296 1 017 353 383 1 319 1 400 8.5 6.1
Total kerosene4 685 853 194 57 75 213 269 31.6 26.3
Gas/diesel oil 14 220 16 730 4 148 1 315 1 396 5 053 5 544 6.2 9.7
Residual fuel oil 265 246 44 9 19 76 63 111.1 ‐17.1
Other products 3 194 3 003 518 250 315 775 833 26.0 7.5
Total products 25 784 28 684 6 828 2 263 2 462 8 573 9 290 8.8 8.4
Portugal
Liquefied petroleum gases 867 795 177 66 47 291 224 ‐28.8 ‐23.0
Naphtha 664 785 168 57 5 241 173 ‐91.2 ‐28.2
Total gasoline3 1 056 1 034 227 82 81 321 308 ‐1.2 ‐4.0
Total kerosene4 1 254 1 423 291 114 120 385 411 5.3 6.8
Gas/diesel oil 4 739 4 860 1 177 382 399 1 508 1 576 4.5 4.5
Residual fuel oil 558 540 136 47 49 163 185 4.3 13.5
Other products 542 688 195 55 60 201 255 9.1 26.9
Total products 9 680 10 125 2 371 803 761 3 110 3 132 ‐5.2 0.7
Slovak Republic
Liquefied petroleum gases 99 119 38 9 12 40 50 33.3 25.0
Naphtha 377 458 135 37 44 143 179 18.9 25.2
Total gasoline3 588 582 127 45 49 172 176 8.9 2.3
Total kerosene4 50 39 8 2 3 15 11 50.0 ‐26.7
Gas/diesel oil 1 882 1 980 454 152 168 593 622 10.5 4.9
Residual fuel oil 212 182 ‐ 8 11 ‐ 3 69 ‐ 11 ‐127.3 ‐115.9
Other products 101 105 ‐ 17 11 ‐ 27 ‐ 17 ‐100.0 ‐163.0
Total products 3 309 3 465 737 267 273 1 059 1 010 2.2 ‐4.6
Slovenia
Liquefied petroleum gases 82 88 26 7 7 33 33 ‐ ‐
Naphtha ‐ ‐ ‐ ‐ ‐ ‐ ‐ ‐ ‐
Total gasoline3 424 414 104 35 39 133 143 11.4 7.5
Total kerosene4 17 24 6 1 3 5 9 200.0 80.0
Gas/diesel oil 1 707 1 644 421 129 132 502 553 2.3 10.2
Residual fuel oil ‐ ‐ ‐ ‐ ‐ ‐ ‐ ‐ ‐
Other products 88 105 13 9 10 27 23 11.1 ‐14.8
Total products 2 318 2 275 570 181 191 700 761 5.5 8.7
Spain
Liquefied petroleum gases 2 508 2 258 704 195 223 941 927 14.4 ‐1.5
Naphtha 1 229 1 422 322 119 75 457 397 ‐37.0 ‐13.1
Total gasoline3 4 753 4 864 1 130 398 401 1 486 1 531 0.8 3.0
Total kerosene4 5 894 6 413 1 373 520 536 1 807 1 909 3.1 5.6
Gas/diesel oil 28 712 29 395 7 670 2 260 2 453 9 661 10 123 8.5 4.8
Residual fuel oil 2 488 2 503 662 179 195 785 857 8.9 9.2
Other products 4 676 4 114 985 310 361 1 314 1 346 16.5 2.4
Total products 50 260 50 969 12 846 3 981 4 244 16 451 17 090 6.6 3.9
1. Percentage change over corresponding month of previous year.
2. Percentage change over corresponding period (beginning of year to current month) of previous year.
3. Total gasoline includes motor gasoline, jet gasoline and aviation gasoline.
4. Total kerosene includes jet kerosene and other kerosene.
For country specific notes on data, please see the geographical notes in the Appendix. Trade amounts include intra‐regional trade.
International Energy Agency 26 © OECD/IEA, 2018
Monthly Oil Statistics
TABLE 8.8
Net deliveries in OECD countriesThousand metric tons
Year to Year to %Change %Change
2016 2017 1Q2018 Apr‐17 Apr‐18 date date current year to
2017 2018 month1 date2
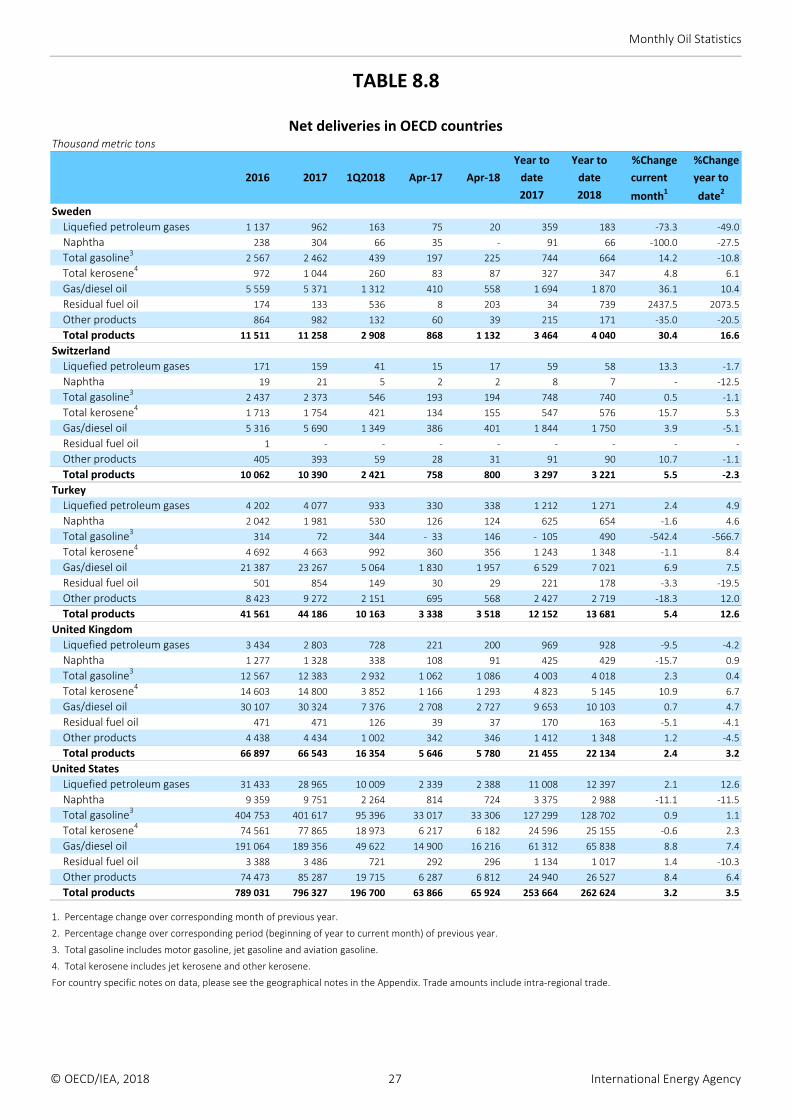
Sweden
Liquefied petroleum gases 1 137 962 163 75 20 359 183 ‐73.3 ‐49.0
Naphtha 238 304 66 35 ‐ 91 66 ‐100.0 ‐27.5
Total gasoline3 2 567 2 462 439 197 225 744 664 14.2 ‐10.8
Total kerosene4 972 1 044 260 83 87 327 347 4.8 6.1
Gas/diesel oil 5 559 5 371 1 312 410 558 1 694 1 870 36.1 10.4
Residual fuel oil 174 133 536 8 203 34 739 2437.5 2073.5
Other products 864 982 132 60 39 215 171 ‐35.0 ‐20.5
Total products 11 511 11 258 2 908 868 1 132 3 464 4 040 30.4 16.6
Switzerland
Liquefied petroleum gases 171 159 41 15 17 59 58 13.3 ‐1.7
Naphtha 19 21 5 2 2 8 7 ‐ ‐12.5
Total gasoline3 2 437 2 373 546 193 194 748 740 0.5 ‐1.1
Total kerosene4 1 713 1 754 421 134 155 547 576 15.7 5.3
Gas/diesel oil 5 316 5 690 1 349 386 401 1 844 1 750 3.9 ‐5.1
Residual fuel oil 1 ‐ ‐ ‐ ‐ ‐ ‐ ‐ ‐
Other products 405 393 59 28 31 91 90 10.7 ‐1.1
Total products 10 062 10 390 2 421 758 800 3 297 3 221 5.5 ‐2.3
Turkey
Liquefied petroleum gases 4 202 4 077 933 330 338 1 212 1 271 2.4 4.9
Naphtha 2 042 1 981 530 126 124 625 654 ‐1.6 4.6
Total gasoline3 314 72 344 ‐ 33 146 ‐ 105 490 ‐542.4 ‐566.7
Total kerosene4 4 692 4 663 992 360 356 1 243 1 348 ‐1.1 8.4
Gas/diesel oil 21 387 23 267 5 064 1 830 1 957 6 529 7 021 6.9 7.5
Residual fuel oil 501 854 149 30 29 221 178 ‐3.3 ‐19.5
Other products 8 423 9 272 2 151 695 568 2 427 2 719 ‐18.3 12.0
Total products 41 561 44 186 10 163 3 338 3 518 12 152 13 681 5.4 12.6
United Kingdom
Liquefied petroleum gases 3 434 2 803 728 221 200 969 928 ‐9.5 ‐4.2
Naphtha 1 277 1 328 338 108 91 425 429 ‐15.7 0.9
Total gasoline3 12 567 12 383 2 932 1 062 1 086 4 003 4 018 2.3 0.4
Total kerosene4 14 603 14 800 3 852 1 166 1 293 4 823 5 145 10.9 6.7
Gas/diesel oil 30 107 30 324 7 376 2 708 2 727 9 653 10 103 0.7 4.7
Residual fuel oil 471 471 126 39 37 170 163 ‐5.1 ‐4.1
Other products 4 438 4 434 1 002 342 346 1 412 1 348 1.2 ‐4.5
Total products 66 897 66 543 16 354 5 646 5 780 21 455 22 134 2.4 3.2
United States
Liquefied petroleum gases 31 433 28 965 10 009 2 339 2 388 11 008 12 397 2.1 12.6
Naphtha 9 359 9 751 2 264 814 724 3 375 2 988 ‐11.1 ‐11.5
Total gasoline3 404 753 401 617 95 396 33 017 33 306 127 299 128 702 0.9 1.1
Total kerosene4 74 561 77 865 18 973 6 217 6 182 24 596 25 155 ‐0.6 2.3
Gas/diesel oil 191 064 189 356 49 622 14 900 16 216 61 312 65 838 8.8 7.4
Residual fuel oil 3 388 3 486 721 292 296 1 134 1 017 1.4 ‐10.3
Other products 74 473 85 287 19 715 6 287 6 812 24 940 26 527 8.4 6.4
Total products 789 031 796 327 196 700 63 866 65 924 253 664 262 624 3.2 3.5
1. Percentage change over corresponding month of previous year.
2. Percentage change over corresponding period (beginning of year to current month) of previous year.
3. Total gasoline includes motor gasoline, jet gasoline and aviation gasoline.
4. Total kerosene includes jet kerosene and other kerosene.
For country specific notes on data, please see the geographical notes in the Appendix. Trade amounts include intra‐regional trade.
© OECD/IEA, 2018 27 International Energy Agency
Monthly Oil Statistics
TABLE 9.1
Closing stock levels: Total oilThousand metric tons
2016 2017 2Q2017 3Q2017 4Q2017 1Q2018 Apr2017 Apr2018
Canada 16 591 17 199 16 971 17 016 17 199 17 510 16 847 17 277
Chile 1 432 1 487 1 430 1 617 1 487 1 387 1 513 1 471
Mexico 6 261 5 731 6 452 6 164 5 731 6 236 6 291 5 425
United States 233 845 214 627 232 074 225 229 214 627 213 291 236 425 212 940
OECD Americas 258 129 239 044 256 927 250 026 239 044 238 424 261 076 237 113
Australia 4 348 4 360 4 547 4 340 4 360 5 189 4 748 5 331
Israel ‐ ‐ ‐ ‐ ‐ ‐ ‐ ‐
Japan 73 291 73 257 73 688 74 235 73 257 70 125 72 740 72 010
Korea 28 900 28 360 29 996 30 538 28 360 27 059 29 864 26 089
New Zealand 1 236 1 048 1 248 1 108 1 048 1 091 1 093 1 242
OECD Asia Oceania 107 775 107 025 109 479 110 221 107 025 103 464 108 445 104 672
Austria 3 048 2 850 2 923 2 948 2 850 3 067 3 004 3 003
Belgium 6 321 5 575 6 249 5 937 5 575 6 219 6 405 5 852
Czech Republic 2 698 2 646 2 638 2 635 2 646 2 793 2 731 2 604
Denmark 4 103 3 082 3 624 3 112 3 082 2 898 3 679 2 901
Estonia 314 401 361 287 401 332 399 356
Finland 5 628 5 412 5 775 5 884 5 412 5 464 5 882 5 699
France 21 761 22 105 22 073 22 083 22 105 22 166 22 015 22 374
Germany 37 638 36 861 36 637 36 262 36 861 36 986 37 332 36 899
Greece 4 894 4 751 4 772 4 739 4 751 4 856 4 669 4 494
Hungary 2 986 3 066 3 053 3 175 3 066 3 157 2 968 3 053
Iceland ‐ ‐ ‐ ‐ ‐ ‐ ‐ ‐
Ireland 1 657 1 434 1 586 1 341 1 434 1 488 1 585 1 389
Italy 16 719 16 761 17 986 17 126 16 761 16 915 17 611 17 342
Latvia 320 341 441 204 341 413 386 480
Luxembourg 88 78 94 84 78 73 95 56
Netherlands 16 337 16 082 17 469 15 891 16 082 17 410 18 381 17 413
Norway 3 003 3 012 2 865 2 838 3 012 3 480 3 213 3 604
Poland 8 607 9 202 8 898 8 859 9 202 9 633 9 018 9 698
Portugal 3 008 3 037 3 202 3 216 3 037 3 306 3 416 3 059
Slovak Republic 1 373 1 287 1 506 1 369 1 287 1 385 1 420 1 358
Slovenia 581 662 655 599 662 651 618 657
Spain 17 658 16 408 17 683 17 475 16 408 17 137 19 120 17 553
Sweden 7 401 5 316 7 753 6 204 5 316 5 678 7 477 5 623
Switzerland 4 374 4 241 4 290 4 410 4 241 4 130 4 475 4 162
Turkey 10 619 11 151 11 287 11 266 11 151 11 264 11 095 11 236
United Kingdom 10 927 10 655 10 682 10 269 10 655 10 500 11 143 10 514
OECD Europe 192 063 186 416 194 502 188 213 186 416 191 401 198 137 191 379
Total OECD 557 967 532 485 560 908 548 460 532 485 533 289 567 658 533 164
For country specific notes on data, please see the geographical notes in the Appendix.
International Energy Agency 28 © OECD/IEA, 2018
Monthly Oil Statistics
TABLE 9.2
Closing stock levels: Crude, NGL and refinery feedstocks 1
Thousand metric tons
2016 2017 2Q2017 3Q2017 4Q2017 1Q2018 Apr2017 Apr2018
Canada 10 718 10 955 10 883 10 659 10 955 10 251 10 319 10 363
Chile 499 545 460 590 545 458 585 502
Mexico 3 535 2 974 3 417 3 739 2 974 3 580 2 993 2 620
United States 157 695 143 435 158 277 152 503 143 435 145 546 162 930 146 285
OECD Americas 172 447 157 909 173 037 167 491 157 909 159 835 176 827 159 770
Australia 1 515 1 410 1 569 1 434 1 410 1 522 1 571 1 657
Israel ‐ ‐ ‐ ‐ ‐ ‐ ‐ ‐
Japan 60 825 60 794 61 032 60 767 60 794 58 118 60 392 59 617
Korea 20 486 19 510 20 747 21 521 19 510 18 428 20 751 17 688
New Zealand 304 306 370 374 306 370 300 381
OECD Asia Oceania 83 130 82 020 83 718 84 096 82 020 78 438 83 014 79 343
Austria 1 178 1 097 1 277 1 233 1 097 1 182 1 102 1 204
Belgium 807 832 856 918 832 942 785 1 045
Czech Republic 1 186 1 213 1 184 1 177 1 213 1 226 1 209 1 206
Denmark 562 532 535 527 532 517 581 574
Estonia 84 136 144 100 136 102 137 112
Finland 2 113 1 917 2 166 2 000 1 917 2 139 2 280 2 219
France 7 413 7 758 7 787 7 918 7 758 8 363 7 761 8 325
Germany 20 773 20 524 21 058 20 598 20 524 20 734 20 922 20 353
Greece 2 044 1 642 1 695 1 779 1 642 1 834 1 676 1 479
Hungary 1 392 1 380 1 432 1 500 1 380 1 471 1 386 1 479
Iceland ‐ ‐ ‐ ‐ ‐ ‐ ‐ ‐
Ireland 410 145 339 212 145 174 321 114
Italy 7 405 7 222 8 393 7 001 7 222 6 967 7 469 7 753
Latvia ‐ ‐ ‐ ‐ ‐ ‐ ‐ ‐
Luxembourg ‐ ‐ ‐ ‐ ‐ ‐ ‐ ‐
Netherlands 4 324 5 140 5 785 4 558 5 140 6 035 5 293 6 286
Norway 1 994 2 081 1 869 1 741 2 081 2 407 2 019 2 659
Poland 5 756 6 031 5 989 5 729 6 031 6 387 5 803 6 475
Portugal 1 165 1 246 1 389 1 398 1 246 1 437 1 584 1 198
Slovak Republic 725 706 791 692 706 714 684 709
Slovenia ‐ ‐ ‐ ‐ ‐ ‐ ‐ ‐
Spain 5 837 5 713 6 301 6 232 5 713 6 383 6 562 6 916
Sweden 1 991 1 495 2 568 2 049 1 495 2 233 2 278 2 353
Switzerland 48 43 29 46 43 69 61 54
Turkey 6 136 6 425 6 378 6 479 6 425 6 330 6 330 6 416
United Kingdom 5 498 5 080 5 115 4 899 5 080 4 862 5 233 4 995
OECD Europe 78 841 78 358 83 080 78 786 78 358 82 508 81 476 83 924
Total OECD 334 418 318 287 339 835 330 373 318 287 320 781 341 317 323 037
1. Includes non‐crude.
For country specific notes on data, please see the geographical notes in the Appendix.
© OECD/IEA, 2018 29 International Energy Agency
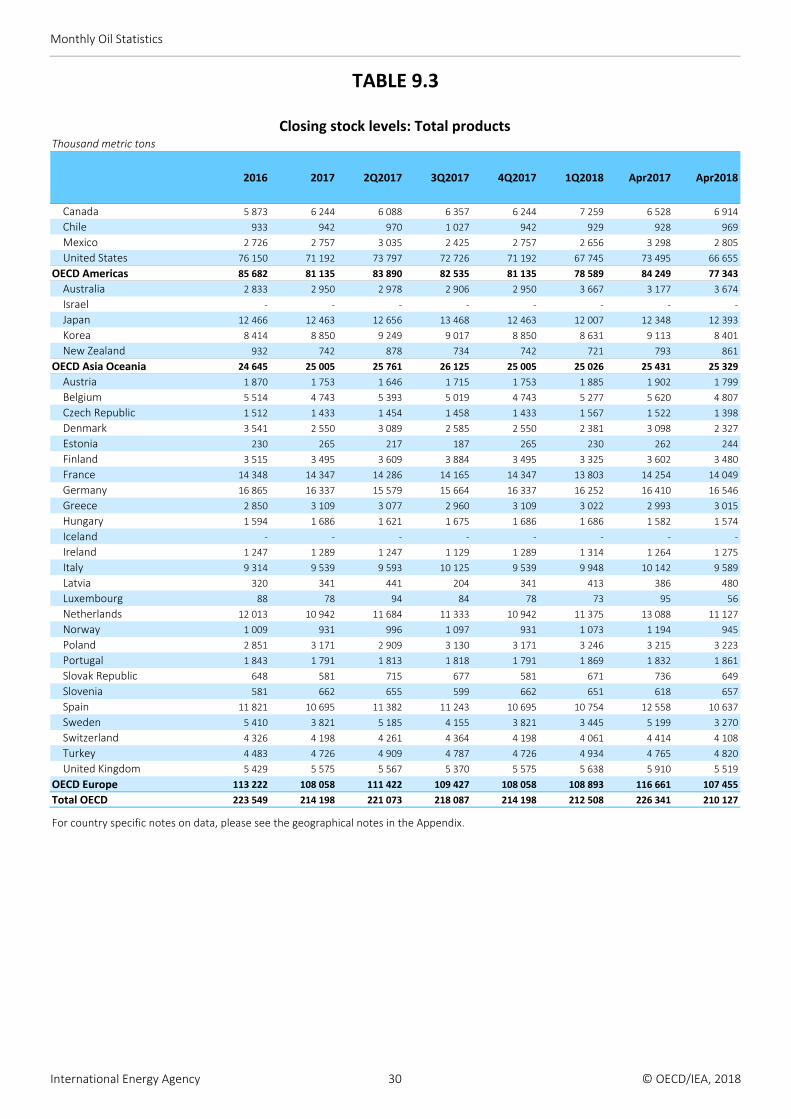
Monthly Oil Statistics
TABLE 9.3
Closing stock levels: Total productsThousand metric tons
2016 2017 2Q2017 3Q2017 4Q2017 1Q2018 Apr2017 Apr2018
Canada 5 873 6 244 6 088 6 357 6 244 7 259 6 528 6 914
Chile 933 942 970 1 027 942 929 928 969
Mexico 2 726 2 757 3 035 2 425 2 757 2 656 3 298 2 805
United States 76 150 71 192 73 797 72 726 71 192 67 745 73 495 66 655
OECD Americas 85 682 81 135 83 890 82 535 81 135 78 589 84 249 77 343
Australia 2 833 2 950 2 978 2 906 2 950 3 667 3 177 3 674
Israel ‐ ‐ ‐ ‐ ‐ ‐ ‐ ‐
Japan 12 466 12 463 12 656 13 468 12 463 12 007 12 348 12 393
Korea 8 414 8 850 9 249 9 017 8 850 8 631 9 113 8 401
New Zealand 932 742 878 734 742 721 793 861
OECD Asia Oceania 24 645 25 005 25 761 26 125 25 005 25 026 25 431 25 329
Austria 1 870 1 753 1 646 1 715 1 753 1 885 1 902 1 799
Belgium 5 514 4 743 5 393 5 019 4 743 5 277 5 620 4 807
Czech Republic 1 512 1 433 1 454 1 458 1 433 1 567 1 522 1 398
Denmark 3 541 2 550 3 089 2 585 2 550 2 381 3 098 2 327
Estonia 230 265 217 187 265 230 262 244
Finland 3 515 3 495 3 609 3 884 3 495 3 325 3 602 3 480
France 14 348 14 347 14 286 14 165 14 347 13 803 14 254 14 049
Germany 16 865 16 337 15 579 15 664 16 337 16 252 16 410 16 546
Greece 2 850 3 109 3 077 2 960 3 109 3 022 2 993 3 015
Hungary 1 594 1 686 1 621 1 675 1 686 1 686 1 582 1 574
Iceland ‐ ‐ ‐ ‐ ‐ ‐ ‐ ‐
Ireland 1 247 1 289 1 247 1 129 1 289 1 314 1 264 1 275
Italy 9 314 9 539 9 593 10 125 9 539 9 948 10 142 9 589
Latvia 320 341 441 204 341 413 386 480
Luxembourg 88 78 94 84 78 73 95 56
Netherlands 12 013 10 942 11 684 11 333 10 942 11 375 13 088 11 127
Norway 1 009 931 996 1 097 931 1 073 1 194 945
Poland 2 851 3 171 2 909 3 130 3 171 3 246 3 215 3 223
Portugal 1 843 1 791 1 813 1 818 1 791 1 869 1 832 1 861
Slovak Republic 648 581 715 677 581 671 736 649
Slovenia 581 662 655 599 662 651 618 657
Spain 11 821 10 695 11 382 11 243 10 695 10 754 12 558 10 637
Sweden 5 410 3 821 5 185 4 155 3 821 3 445 5 199 3 270
Switzerland 4 326 4 198 4 261 4 364 4 198 4 061 4 414 4 108
Turkey 4 483 4 726 4 909 4 787 4 726 4 934 4 765 4 820
United Kingdom 5 429 5 575 5 567 5 370 5 575 5 638 5 910 5 519
OECD Europe 113 222 108 058 111 422 109 427 108 058 108 893 116 661 107 455
Total OECD 223 549 214 198 221 073 218 087 214 198 212 508 226 341 210 127
For country specific notes on data, please see the geographical notes in the Appendix.
International Energy Agency 30 © OECD/IEA, 2018
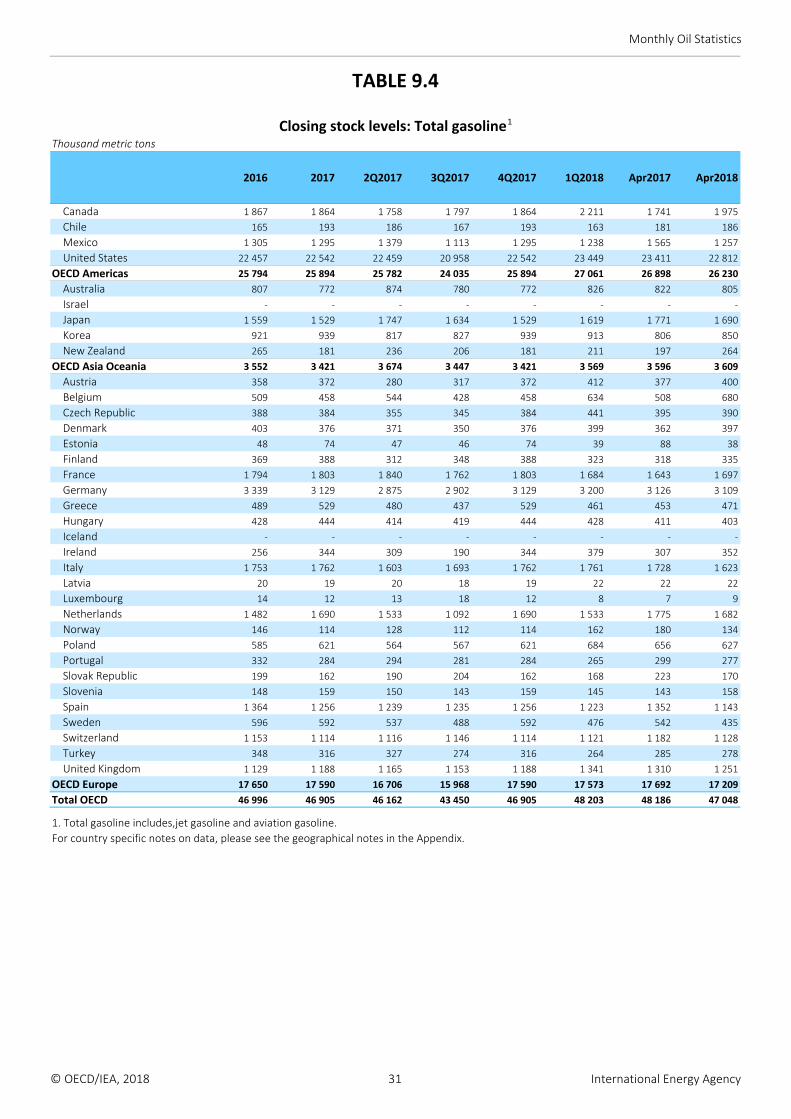
Monthly Oil Statistics
TABLE 9.4
Closing stock levels: Total gasoline1
Thousand metric tons
2016 2017 2Q2017 3Q2017 4Q2017 1Q2018 Apr2017 Apr2018
Canada 1 867 1 864 1 758 1 797 1 864 2 211 1 741 1 975
Chile 165 193 186 167 193 163 181 186
Mexico 1 305 1 295 1 379 1 113 1 295 1 238 1 565 1 257
United States 22 457 22 542 22 459 20 958 22 542 23 449 23 411 22 812
OECD Americas 25 794 25 894 25 782 24 035 25 894 27 061 26 898 26 230
Australia 807 772 874 780 772 826 822 805
Israel ‐ ‐ ‐ ‐ ‐ ‐ ‐ ‐
Japan 1 559 1 529 1 747 1 634 1 529 1 619 1 771 1 690
Korea 921 939 817 827 939 913 806 850
New Zealand 265 181 236 206 181 211 197 264
OECD Asia Oceania 3 552 3 421 3 674 3 447 3 421 3 569 3 596 3 609
Austria 358 372 280 317 372 412 377 400
Belgium 509 458 544 428 458 634 508 680
Czech Republic 388 384 355 345 384 441 395 390
Denmark 403 376 371 350 376 399 362 397
Estonia 48 74 47 46 74 39 88 38
Finland 369 388 312 348 388 323 318 335
France 1 794 1 803 1 840 1 762 1 803 1 684 1 643 1 697
Germany 3 339 3 129 2 875 2 902 3 129 3 200 3 126 3 109
Greece 489 529 480 437 529 461 453 471
Hungary 428 444 414 419 444 428 411 403
Iceland ‐ ‐ ‐ ‐ ‐ ‐ ‐ ‐
Ireland 256 344 309 190 344 379 307 352
Italy 1 753 1 762 1 603 1 693 1 762 1 761 1 728 1 623
Latvia 20 19 20 18 19 22 22 22
Luxembourg 14 12 13 18 12 8 7 9
Netherlands 1 482 1 690 1 533 1 092 1 690 1 533 1 775 1 682
Norway 146 114 128 112 114 162 180 134
Poland 585 621 564 567 621 684 656 627
Portugal 332 284 294 281 284 265 299 277
Slovak Republic 199 162 190 204 162 168 223 170
Slovenia 148 159 150 143 159 145 143 158
Spain 1 364 1 256 1 239 1 235 1 256 1 223 1 352 1 143
Sweden 596 592 537 488 592 476 542 435
Switzerland 1 153 1 114 1 116 1 146 1 114 1 121 1 182 1 128
Turkey 348 316 327 274 316 264 285 278
United Kingdom 1 129 1 188 1 165 1 153 1 188 1 341 1 310 1 251
OECD Europe 17 650 17 590 16 706 15 968 17 590 17 573 17 692 17 209
Total OECD 46 996 46 905 46 162 43 450 46 905 48 203 48 186 47 048
1. Total gasoline includes,jet gasoline and aviation gasoline.
For country specific notes on data, please see the geographical notes in the Appendix.
© OECD/IEA, 2018 31 International Energy Agency
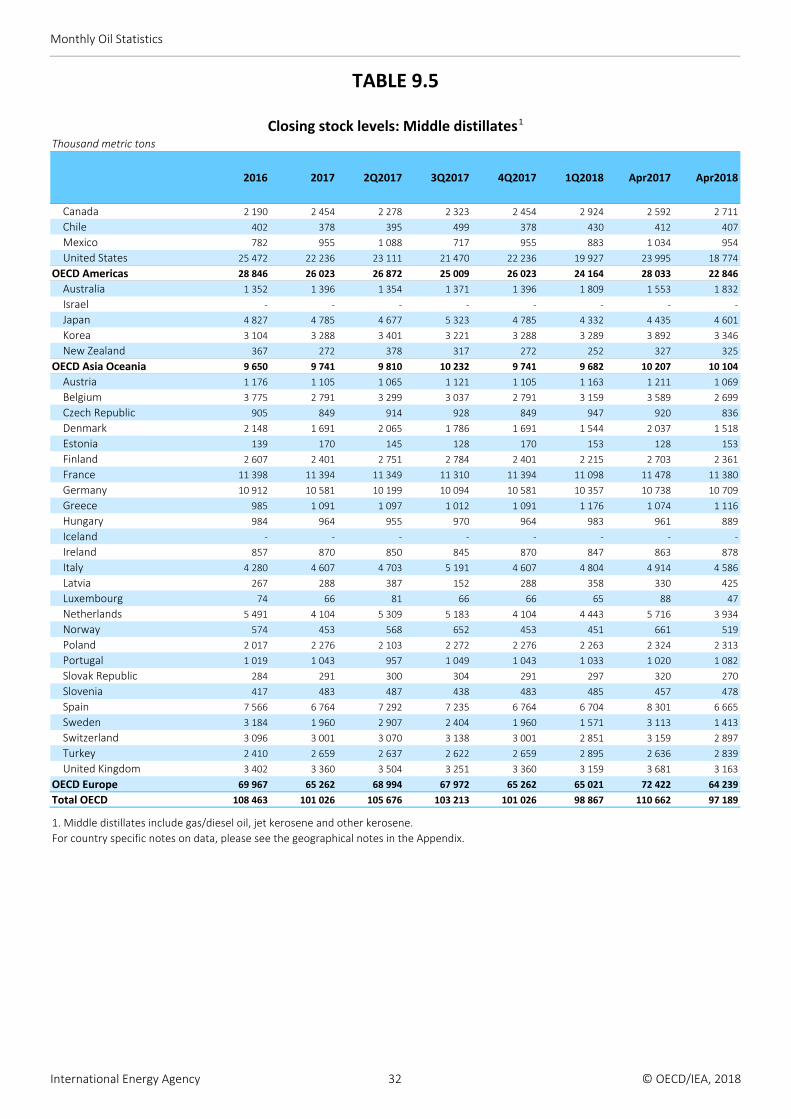
Monthly Oil Statistics
TABLE 9.5
Closing stock levels: Middle distillates1
Thousand metric tons
2016 2017 2Q2017 3Q2017 4Q2017 1Q2018 Apr2017 Apr2018
Canada 2 190 2 454 2 278 2 323 2 454 2 924 2 592 2 711
Chile 402 378 395 499 378 430 412 407
Mexico 782 955 1 088 717 955 883 1 034 954
United States 25 472 22 236 23 111 21 470 22 236 19 927 23 995 18 774
OECD Americas 28 846 26 023 26 872 25 009 26 023 24 164 28 033 22 846
Australia 1 352 1 396 1 354 1 371 1 396 1 809 1 553 1 832
Israel ‐ ‐ ‐ ‐ ‐ ‐ ‐ ‐
Japan 4 827 4 785 4 677 5 323 4 785 4 332 4 435 4 601
Korea 3 104 3 288 3 401 3 221 3 288 3 289 3 892 3 346
New Zealand 367 272 378 317 272 252 327 325
OECD Asia Oceania 9 650 9 741 9 810 10 232 9 741 9 682 10 207 10 104
Austria 1 176 1 105 1 065 1 121 1 105 1 163 1 211 1 069
Belgium 3 775 2 791 3 299 3 037 2 791 3 159 3 589 2 699
Czech Republic 905 849 914 928 849 947 920 836
Denmark 2 148 1 691 2 065 1 786 1 691 1 544 2 037 1 518
Estonia 139 170 145 128 170 153 128 153
Finland 2 607 2 401 2 751 2 784 2 401 2 215 2 703 2 361
France 11 398 11 394 11 349 11 310 11 394 11 098 11 478 11 380
Germany 10 912 10 581 10 199 10 094 10 581 10 357 10 738 10 709
Greece 985 1 091 1 097 1 012 1 091 1 176 1 074 1 116
Hungary 984 964 955 970 964 983 961 889
Iceland ‐ ‐ ‐ ‐ ‐ ‐ ‐ ‐
Ireland 857 870 850 845 870 847 863 878
Italy 4 280 4 607 4 703 5 191 4 607 4 804 4 914 4 586
Latvia 267 288 387 152 288 358 330 425
Luxembourg 74 66 81 66 66 65 88 47
Netherlands 5 491 4 104 5 309 5 183 4 104 4 443 5 716 3 934
Norway 574 453 568 652 453 451 661 519
Poland 2 017 2 276 2 103 2 272 2 276 2 263 2 324 2 313
Portugal 1 019 1 043 957 1 049 1 043 1 033 1 020 1 082
Slovak Republic 284 291 300 304 291 297 320 270
Slovenia 417 483 487 438 483 485 457 478
Spain 7 566 6 764 7 292 7 235 6 764 6 704 8 301 6 665
Sweden 3 184 1 960 2 907 2 404 1 960 1 571 3 113 1 413
Switzerland 3 096 3 001 3 070 3 138 3 001 2 851 3 159 2 897
Turkey 2 410 2 659 2 637 2 622 2 659 2 895 2 636 2 839
United Kingdom 3 402 3 360 3 504 3 251 3 360 3 159 3 681 3 163
OECD Europe 69 967 65 262 68 994 67 972 65 262 65 021 72 422 64 239
Total OECD 108 463 101 026 105 676 103 213 101 026 98 867 110 662 97 189
1. Middle distillates include gas/diesel oil, jet kerosene and other kerosene.
For country specific notes on data, please see the geographical notes in the Appendix.
International Energy Agency 32 © OECD/IEA, 2018
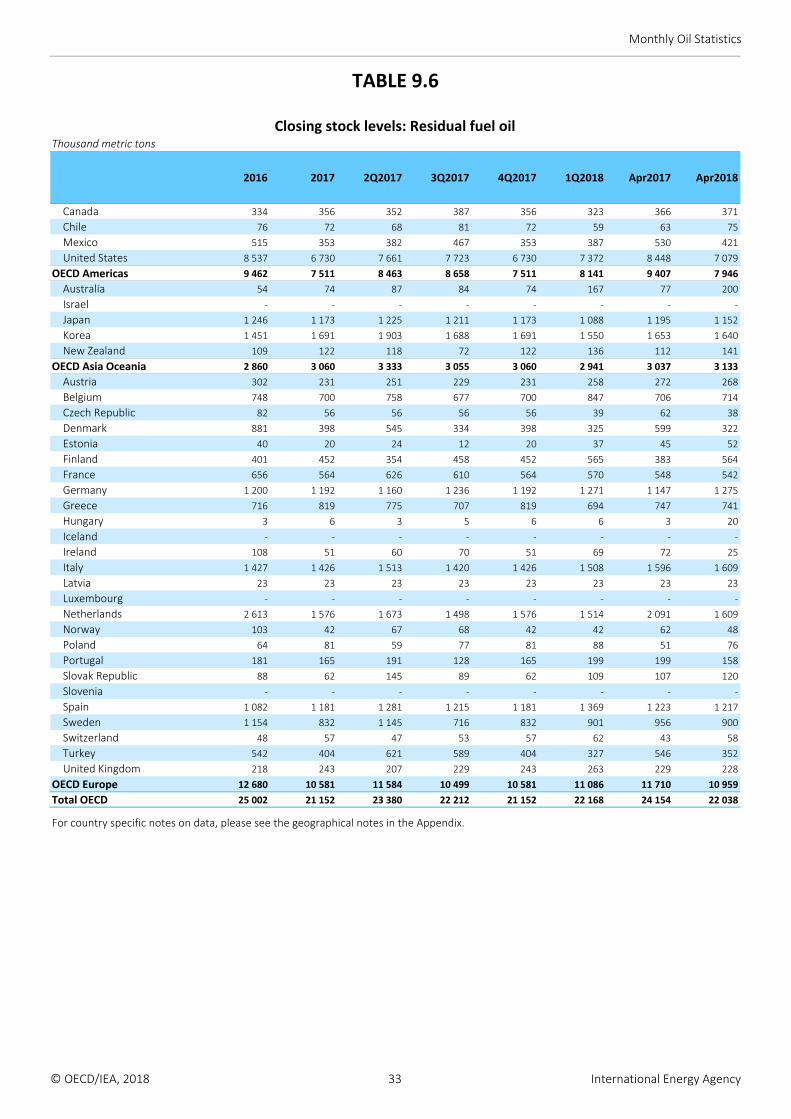
Monthly Oil Statistics
TABLE 9.6
Closing stock levels: Residual fuel oilThousand metric tons
2016 2017 2Q2017 3Q2017 4Q2017 1Q2018 Apr2017 Apr2018
Canada 334 356 352 387 356 323 366 371
Chile 76 72 68 81 72 59 63 75
Mexico 515 353 382 467 353 387 530 421
United States 8 537 6 730 7 661 7 723 6 730 7 372 8 448 7 079
OECD Americas 9 462 7 511 8 463 8 658 7 511 8 141 9 407 7 946
Australia 54 74 87 84 74 167 77 200
Israel ‐ ‐ ‐ ‐ ‐ ‐ ‐ ‐
Japan 1 246 1 173 1 225 1 211 1 173 1 088 1 195 1 152
Korea 1 451 1 691 1 903 1 688 1 691 1 550 1 653 1 640
New Zealand 109 122 118 72 122 136 112 141
OECD Asia Oceania 2 860 3 060 3 333 3 055 3 060 2 941 3 037 3 133
Austria 302 231 251 229 231 258 272 268
Belgium 748 700 758 677 700 847 706 714
Czech Republic 82 56 56 56 56 39 62 38
Denmark 881 398 545 334 398 325 599 322
Estonia 40 20 24 12 20 37 45 52
Finland 401 452 354 458 452 565 383 564
France 656 564 626 610 564 570 548 542
Germany 1 200 1 192 1 160 1 236 1 192 1 271 1 147 1 275
Greece 716 819 775 707 819 694 747 741
Hungary 3 6 3 5 6 6 3 20
Iceland ‐ ‐ ‐ ‐ ‐ ‐ ‐ ‐
Ireland 108 51 60 70 51 69 72 25
Italy 1 427 1 426 1 513 1 420 1 426 1 508 1 596 1 609
Latvia 23 23 23 23 23 23 23 23
Luxembourg ‐ ‐ ‐ ‐ ‐ ‐ ‐ ‐
Netherlands 2 613 1 576 1 673 1 498 1 576 1 514 2 091 1 609
Norway 103 42 67 68 42 42 62 48
Poland 64 81 59 77 81 88 51 76
Portugal 181 165 191 128 165 199 199 158
Slovak Republic 88 62 145 89 62 109 107 120
Slovenia ‐ ‐ ‐ ‐ ‐ ‐ ‐ ‐
Spain 1 082 1 181 1 281 1 215 1 181 1 369 1 223 1 217
Sweden 1 154 832 1 145 716 832 901 956 900
Switzerland 48 57 47 53 57 62 43 58
Turkey 542 404 621 589 404 327 546 352
United Kingdom 218 243 207 229 243 263 229 228
OECD Europe 12 680 10 581 11 584 10 499 10 581 11 086 11 710 10 959
Total OECD 25 002 21 152 23 380 22 212 21 152 22 168 24 154 22 038
For country specific notes on data, please see the geographical notes in the Appendix.
© OECD/IEA, 2018 33 International Energy Agency
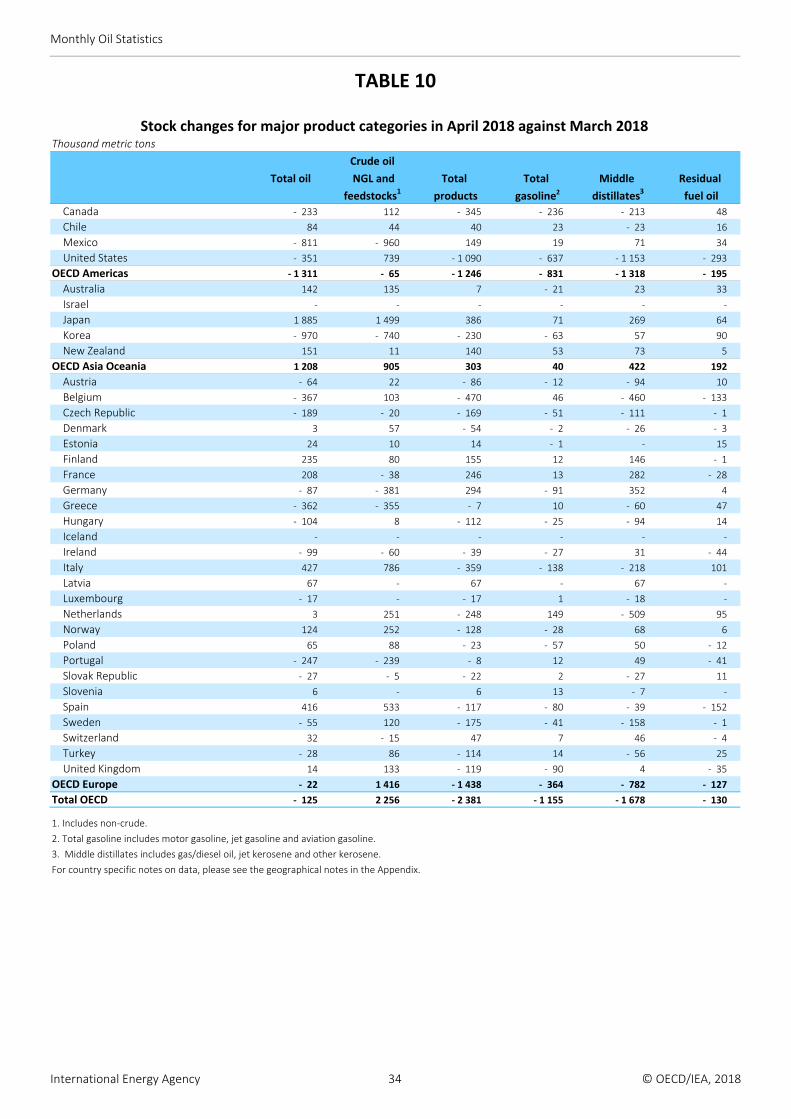
Monthly Oil Statistics
TABLE 10
Stock changes for major product categories in April 2018 against March 2018Thousand metric tons
Crude oil
Total oil NGL and Total Total Middle Residual
feedstocks1 products gasoline2 distillates3 fuel oil
Canada ‐ 233 112 ‐ 345 ‐ 236 ‐ 213 48
Chile 84 44 40 23 ‐ 23 16
Mexico ‐ 811 ‐ 960 149 19 71 34
United States ‐ 351 739 ‐ 1 090 ‐ 637 ‐ 1 153 ‐ 293
OECD Americas ‐ 1 311 ‐ 65 ‐ 1 246 ‐ 831 ‐ 1 318 ‐ 195
Australia 142 135 7 ‐ 21 23 33
Israel ‐ ‐ ‐ ‐ ‐ ‐
Japan 1 885 1 499 386 71 269 64
Korea ‐ 970 ‐ 740 ‐ 230 ‐ 63 57 90
New Zealand 151 11 140 53 73 5
OECD Asia Oceania 1 208 905 303 40 422 192
Austria ‐ 64 22 ‐ 86 ‐ 12 ‐ 94 10
Belgium ‐ 367 103 ‐ 470 46 ‐ 460 ‐ 133
Czech Republic ‐ 189 ‐ 20 ‐ 169 ‐ 51 ‐ 111 ‐ 1
Denmark 3 57 ‐ 54 ‐ 2 ‐ 26 ‐ 3
Estonia 24 10 14 ‐ 1 ‐ 15
Finland 235 80 155 12 146 ‐ 1
France 208 ‐ 38 246 13 282 ‐ 28
Germany ‐ 87 ‐ 381 294 ‐ 91 352 4
Greece ‐ 362 ‐ 355 ‐ 7 10 ‐ 60 47
Hungary ‐ 104 8 ‐ 112 ‐ 25 ‐ 94 14
Iceland ‐ ‐ ‐ ‐ ‐ ‐
Ireland ‐ 99 ‐ 60 ‐ 39 ‐ 27 31 ‐ 44
Italy 427 786 ‐ 359 ‐ 138 ‐ 218 101
Latvia 67 ‐ 67 ‐ 67 ‐
Luxembourg ‐ 17 ‐ ‐ 17 1 ‐ 18 ‐
Netherlands 3 251 ‐ 248 149 ‐ 509 95
Norway 124 252 ‐ 128 ‐ 28 68 6
Poland 65 88 ‐ 23 ‐ 57 50 ‐ 12
Portugal ‐ 247 ‐ 239 ‐ 8 12 49 ‐ 41
Slovak Republic ‐ 27 ‐ 5 ‐ 22 2 ‐ 27 11
Slovenia 6 ‐ 6 13 ‐ 7 ‐
Spain 416 533 ‐ 117 ‐ 80 ‐ 39 ‐ 152
Sweden ‐ 55 120 ‐ 175 ‐ 41 ‐ 158 ‐ 1
Switzerland 32 ‐ 15 47 7 46 ‐ 4
Turkey ‐ 28 86 ‐ 114 14 ‐ 56 25
United Kingdom 14 133 ‐ 119 ‐ 90 4 ‐ 35
OECD Europe ‐ 22 1 416 ‐ 1 438 ‐ 364 ‐ 782 ‐ 127
Total OECD ‐ 125 2 256 ‐ 2 381 ‐ 1 155 ‐ 1 678 ‐ 130
1. Includes non‐crude.
2. Total gasoline includes motor gasoline, jet gasoline and aviation gasoline.
3. Middle distillates includes gas/diesel oil, jet kerosene and other kerosene.
For country specific notes on data, please see the geographical notes in the Appendix.
International Energy Agency 34 © OECD/IEA, 2018

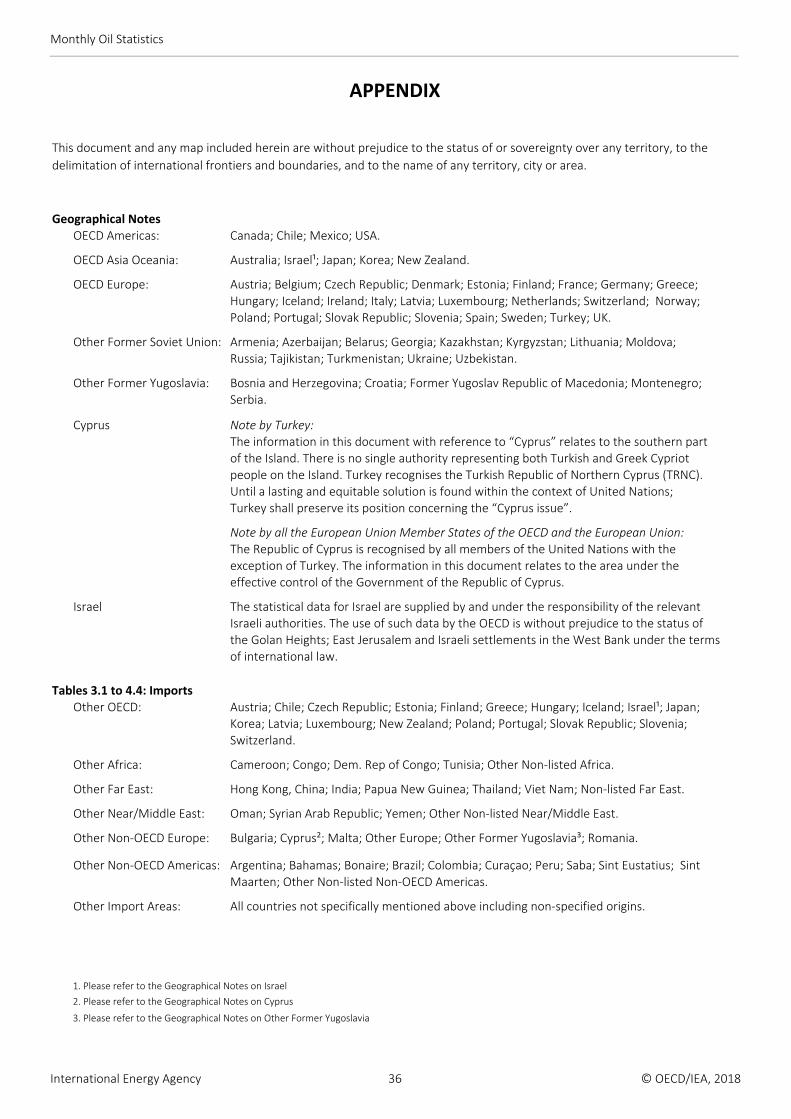
Monthly Oil Statistics
APPENDIX
This document and any map included herein are without prejudice to the status of or sovereignty over any territory, to the
delimitation of international frontiers and boundaries, and to the name of any territory, city or area.
OECD Americas: Canada; Chile; Mexico; USA.
OECD Asia Oceania: Australia; Israel¹; Japan; Korea; New Zealand.
OECD Europe: Austria; Belgium; Czech Republic; Denmark; Estonia; Finland; France; Germany; Greece; Hungary; Iceland; Ireland; Italy; Latvia; Luxembourg; Netherlands; Switzerland; Norway;Poland; Portugal; Slovak Republic; Slovenia; Spain; Sweden; Turkey; UK.
Other Former Soviet Union: Armenia; Azerbaijan; Belarus; Georgia; Kazakhstan; Kyrgyzstan; Lithuania; Moldova;Russia; Tajikistan; Turkmenistan; Ukraine; Uzbekistan.
Other Former Yugoslavia: Bosnia and Herzegovina; Croatia; Former Yugoslav Republic of Macedonia; Montenegro;Serbia.
Cyprus Note by Turkey: The information in this document with reference to “Cyprus” relates to the southern part of the Island. There is no single authority representing both Turkish and Greek Cypriot people on the Island. Turkey recognises the Turkish Republic of Northern Cyprus (TRNC). Until a lasting and equitable solution is found within the context of United Nations; Turkey shall preserve its position concerning the “Cyprus issue”.
Note by all the European Union Member States of the OECD and the European Union:The Republic of Cyprus is recognised by all members of the United Nations with the exception of Turkey. The information in this document relates to the area under theeffective control of the Government of the Republic of Cyprus.
Israel The statistical data for Israel are supplied by and under the responsibility of the relevant Israeli authorities. The use of such data by the OECD is without prejudice to the status of the Golan Heights; East Jerusalem and Israeli settlements in the West Bank under the terms of international law.
Other OECD: Austria; Chile; Czech Republic; Estonia; Finland; Greece; Hungary; Iceland; Israel¹; Japan; Korea; Latvia; Luxembourg; New Zealand; Poland; Portugal; Slovak Republic; Slovenia;Switzerland.
Other Africa: Cameroon; Congo; Dem. Rep of Congo; Tunisia; Other Non‐listed Africa.
Other Far East: Hong Kong, China; India; Papua New Guinea; Thailand; Viet Nam; Non‐listed Far East.
Other Near/Middle East: Oman; Syrian Arab Republic; Yemen; Other Non‐listed Near/Middle East.
Other Non‐OECD Europe: Bulgaria; Cyprus²; Malta; Other Europe; Other Former Yugoslavia³; Romania.
Other Non‐OECD Americas: Argentina; Bahamas; Bonaire; Brazil; Colombia; Curaçao; Peru; Saba; Sint Eustatius; Sint Maarten; Other Non‐listed Non‐OECD Americas.
Other Import Areas: All countries not specifically mentioned above including non‐specified origins.
1. Please refer to the Geographical Notes on Israel
2. Please refer to the Geographical Notes on Cyprus
3. Please refer to the Geographical Notes on Other Former Yugoslavia
Geographical Notes
Tables 3.1 to 4.4: Imports
International Energy Agency 36 © OECD/IEA, 2018
Monthly Oil Statistics
Africa: Algeria; Angola; Cameroon; Congo; Dem Rep. of Congo; Egypt; Equatorial Guinea; Gabon; Libya; Nigeria; Tunisia; Other Africa.
Far East: Brunei Darussalam; China, People’s Republic of; Hong Kong, China; India; Indonesia; Malaysia; Papua New Guinea; Singapore; Viet Nam; Thailand; Non‐listed Far East.
Near/Middle East: Bahrain; Iran; Iraq; Kuwait; Oman; Qatar; Saudi Arabia; Syrian Arab Republic; UAE; Yemen; Neutral Zone; Other Near/Middle East.
Non‐OECD Americas: Argentina; Bahamas; Bonaire; Brazil; Colombia; Curaçao; Ecuador; Peru; Saba; Sint Eustatius;Sint Maarten; Trinidad and Tobago; Venezuela; Other Non‐OECD Americas.
Other OECD Europe Austria; Czech Republic; Denmark; Estonia; Finland; France; Germany; Greece; Hungary; Iceland; Ireland; Latvia; Luxembourg; Switzerland; Norway; Poland; Portugal;Slovak Republic; Slovenia; Spain; Sweden; Turkey.
Other Import Areas: All countries not specifically mentioned above including non‐specified origins.
Other OECD: Australia; Austria; Chile; Czech Republic; Estonia; Finland; Greece; Hungary; Iceland; Israel²; Japan; Korea; Latvia; Luxembourg; New Zealand; Poland; Turkey; Slovak Republic; Slovenia; Switzerland.
Africa: Algeria; Egypt; Libya; Morocco; Nigeria; South Africa; Tunisia; Other Africa.
Far East: China; People’s Republic of; Hong Kong; China; India; Indonesia; Malaysia; Pakistan; Philippines; Singapore; Chinese Taipei; Thailand; Viet Nam; Non‐listed Far East.
Near/Middle East: Iran; Iraq; Kuwait; Lebanon; Qatar; Saudi Arabia; Syrian Arab Republic; Other Near/Middle East.
Non‐OECD Americas: Argentina; Bonaire; Brazil; Colombia; Curaçao; Saba; Sint Eustatius; Sint Maarten; Eustatius; Sint Maarten; Trinidad and Tobago; Venezuela; Other Non‐OECD Americas.
Other Export Areas: All countries not specifically mentioned above including non‐specified destinations.
Total ProductsOther OECD: Australia; Austria; Chile; Czech Republic; Estonia; Finland; Greece; Hungary; Iceland; Israel²;
Japan; Korea; Latvia; Luxembourg; New Zealand; Poland; Turkey; Slovak Republic; Slovenia; Switzerland.
Africa: Algeria; Egypt; Libya; Morocco; Nigeria; South Africa; Tunisia; Other Non‐listed Africa.
Far East: China; People’s Republic of; India; Indonesia; Pakistan; Singapore; Thailand; Chinese Taipei; Viet Nam; Non‐listed Far East.
Near/Middle East: Iran; Iraq; Kuwait; Lebanon; Qatar; Saudi Arabia; Syrian Arab Republic; Other Non‐listed Near/Middle East.
Non‐OECD Americas: Argentina; Bonaire; Brazil; Colombia; Curaçao; Saba; Sint Eustatius; Sint Maarten; Trinidad and Tobago; Venezuela; Other Non‐OECD Americas.
Other Export Areas: All countries not specifically mentioned above including non‐specified destinations.
1. Please refer to the Geographical Notes on Cyprus
2. Please refer to the Geographical Notes on Israel
3. Please refer to the Geographical Notes on Other Former Yugoslavia
Table 5: Imports by products
Table 6: Exports
Crude, NGL and Refinery Feedstocks
© OECD/IEA, 2018 37 International Energy Agency
Overall responsibilityErica Robin Stève Gervais
StatisticsAmani Al-SaidiLouis ChambeauSina KeivaniIvo LetraDionysia Lyngopoulou
Contacts:Energy Data Center Monthly Oil and Gas Statistics Unit9, rue de la Fédération75739 PARIS Cedex 15France +33 (0)1 40 57 67 95 [email protected]
Media Enquiries:IEA Press Office +33 (0)1 40 57 65 54 [email protected]
This document can be downloaded free of charge at:http://www.iea.org/statistics/topics/oil/
The publication schedule can be downloaded at:http://www.iea.org/media/statistics/Schedule_monthly.pdf