Embed Size (px)
Citation preview

1 |
NHS provider board membership and diversity survey: findingsOctober 2018

2 |
NHS boards have some of the most important roles in this country, ensuring through the strategy, accountability and
culture they create in their organisations that patients consistently receive high quality, ever-improving services and
that the full talents of our diverse workforce are realised.
Evidence from inside and outside the healthcare sector, shows that diverse boards make better decisions. We need
diverse leadership teams on our boards, who not only reflect the communities we serve and the staff we employ but
also have the breadth of perspective and leadership style to make great collective decisions.
Measuring and publishing how diverse our boards are is an important step in improving the diversity of our senior
leadership teams. This report shows there are areas of relative board strength, such as gender diversity, and areas
where we need to make significant improvement, such as ethnic diversity. We can use this as a baseline on which to
measure the improvement in diversity we need to see in the coming months and years.
Improving our leadership diversity will require real commitment and work locally, regionally and nationally. This is a
significant priority for NHS Improvement and should be for every NHS board.
Message from Dido Harding
NHS provider board membership and diversity survey findings: October 2018
Baroness Dido Harding
Chair
NHS Improvement

3 |
We recognise the critical role strong and effective leadership plays in the delivery of safe and effective healthcare
services to patients. We have already given a commitment to supporting leadership development and talent
management for senior leaders and helping to build capacity and capability for continuous improvement across the
NHS. Two specific strategic objectives in our 2020 objectives have enabled us to focus our actions to make good
that commitment:
• Objective 12: Develop, maintain and enhance effective boards: both people and ways of working.
• Objective 13: Expect every provider board to reflect the diversity of the people it serves, including
gender-balanced boards.
This report of our findings from a survey of NHS provider boards in 2017 provides the first snapshot of their make-up
and diversity. It enables us to understand where we are today and how far we need to go if we are to achieve our
objectives. NHS providers will be able to hold it up as a mirror, both individually and collectively, so they can identify
areas in which changes need to be made to improve the diversity of their boards. It will also help us hold NHS
providers to account and is already being used to inform the work we are doing with boards to help them improve in
strength and diversity.
Foreword
NHS provider board membership and diversity survey findings: October 2018

4 |
New initiatives like our NExT Director scheme are supporting the development of the next generation of non-
executive directors and over time we will be able to measure progress using annual updates of this data.
Thank you to everyone who contributed to the production of this important report - the Non-Executive Appointments
Team for all their work collecting and analysing the survey data, board secretaries for helping us to understand their
boards and individual board members for telling us about themselves. Between you, you have created a detailed
picture of the leadership of the NHS which will be an invaluable resource for years to come.
NHS provider board membership and diversity survey findings: October 2018
Steve Russell
Executive Regional Managing Director
NHS Improvement
5 |
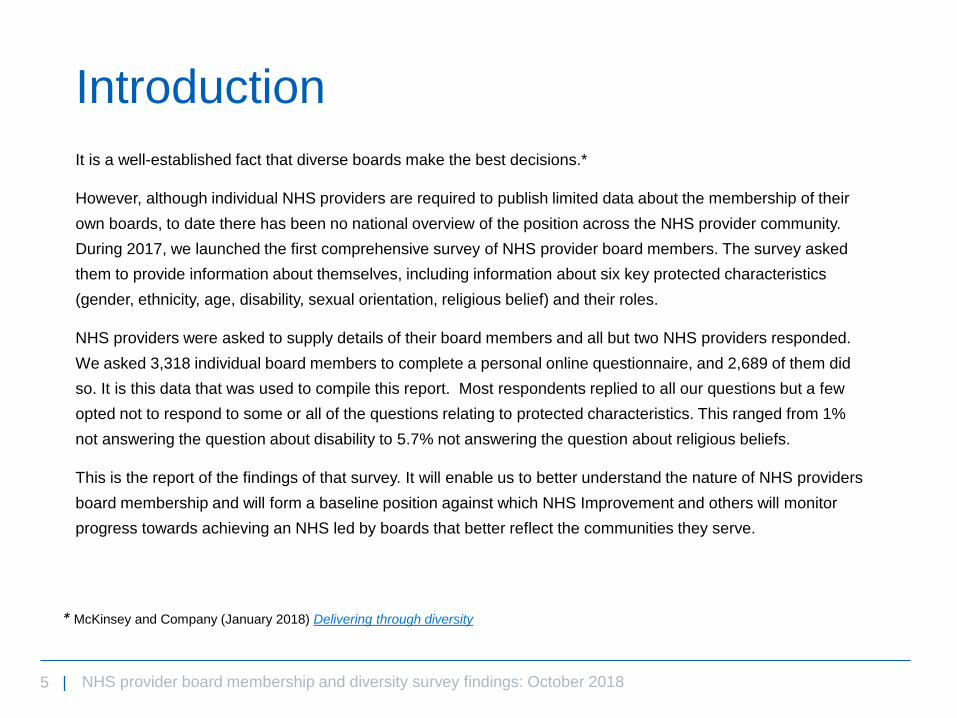
It is a well-established fact that diverse boards make the best decisions.*
However, although individual NHS providers are required to publish limited data about the membership of their
own boards, to date there has been no national overview of the position across the NHS provider community.
During 2017, we launched the first comprehensive survey of NHS provider board members. The survey asked
them to provide information about themselves, including information about six key protected characteristics
(gender, ethnicity, age, disability, sexual orientation, religious belief) and their roles.
NHS providers were asked to supply details of their board members and all but two NHS providers responded.
We asked 3,318 individual board members to complete a personal online questionnaire, and 2,689 of them did
so. It is this data that was used to compile this report. Most respondents replied to all our questions but a few
opted not to respond to some or all of the questions relating to protected characteristics. This ranged from 1%
not answering the question about disability to 5.7% not answering the question about religious beliefs.
This is the report of the findings of that survey. It will enable us to better understand the nature of NHS providers
board membership and will form a baseline position against which NHS Improvement and others will monitor
progress towards achieving an NHS led by boards that better reflect the communities they serve.
Introduction
NHS provider board membership and diversity survey findings: October 2018
* McKinsey and Company (January 2018) Delivering through diversity
6 |
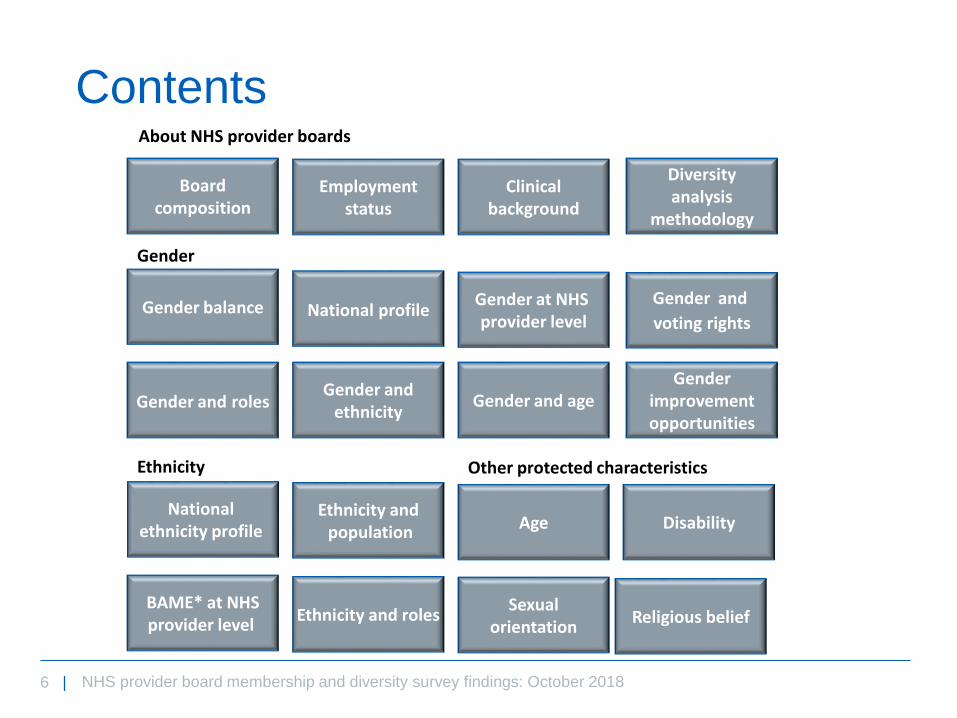
Contents
NHS provider board membership and diversity survey findings: October 2018
Gender
Boardcomposition
About NHS provider boards
Employmentstatus
Clinicalbackground
Diversity analysis
methodology
Gender balance National profileGender at NHS provider level
Gender and
voting rights
Gender and ageGender and rolesGender
improvementopportunities
Gender and ethnicity
Ethnicity
National ethnicity profile
Ethnicity andpopulation
Ethnicity and rolesBAME* at NHSprovider level
Age Disability
Sexualorientation
Religious belief
Other protected characteristics

7 |
• NHS provider board membership ranges
between 10 and 20 voting and non-voting
members, with 13 or 14 members being the
most common.
• Foundation trust boards have an average of
14.3 members (89% with voting rights); NHS
trust boards 14.1 members (80% voting).
• Most trust types have a similar average
number of board members, with the exceptions
of acute teaching (15.2) and community (12.5).
• Although the expectation would be more non-
executive directors (NEDs) than executive
directors (EDs) on NHS provider boards ‒ the
survey identified slightly more ED positions
(1666 v. 1603).
• There are more voting NEDs than EDs – 34%
of EDs non-voting compared to just 4% of
NEDs.
Provider board composition
NHS provider board membership and diversity survey findings: October 2018 Contents

8 |
5% of executive directors are on non-permanent contracts.
Executive directors: employment status
Nearly all executive directors (97%) are full-time employees of NHS providers.
NHS provider board membership and diversity survey: October 2018 Contents

9 |
It is clear that many NHS provider boards benefit from strong clinical leadership across a wide
range of different board roles.
49% of executive directors and 25% of non-executive directors declared a clinical background.
The most common backgrounds were medical and nursing. This was also the case when current medical and
nursing directors were excluded from the analysis.
Clinical background
NHS provider board membership and diversity survey: October 2018 Contents

10 |
Our survey therefore asked NHS provider board members to provide personal information about six protected
characteristics:
• Gender
• Ethnicity
• Age
• Disability
• Sexual orientation
• Faith
In all cases, individuals had a ‘prefer not to say’ option. The survey data used in this analysis generally
excludes both ‘ no response received ’and ‘prefer not to say’ categories.
To establish a comprehensive baseline for gender composition of NHS provider boards, data based on
assumed gender from public information was used where no survey response was received.
For the purpose of this analysis the survey data provided on ethnicity has generally been grouped as white or
black, Asian and minority ethnic (BAME). BAME was used to group any response that was not a white ethnic
group.
Diversity analysis: methodology
We wanted to understand the extent to which NHS provider boards reflect the people they serve.
NHS provider board membership and diversity survey: October 2018 Contents

11 |
Diversity analysis: gender
NHS provider board membership and diversity survey: October 018 Contents

12 |
The regions have a similar proportion of women on NHS provider boards, meeting the EU definition of
gender parity but not yet achieving the minimum ‘50:50 by 2020’ target of 45%.
Gender balance
The EU Commission defines board gender parity as being between 40% and 60% men or women.
With women comprising just under 43%* of NHS provider board members, the EU definition is
being met. The NHS, however, has signed up to the more challenging goal of ‘50:50 by 2020’
where board gender parity is defined as 45%-55%.
NHS provider board membership and diversity survey: October 2018
EU Commission <40% 40−60 % >60%
NHS ‘50:50 by 2020’ <45% 45−55% >55%
2017 NHS position 43%
Overall London Midlands & East North South
Proportion of women on NHS provider
boards 42.9% 42.3% 42.3% 44.2% 42.5%
Contents

13 |
Of NHS provider boards 43% are women, whereas
77% of the NHS workforce are women.*
There are currently1406 women on NHS provider
boards – absolute parity (50:50) would be achieved
through switching 231 current positions from men to
women.
*Source: NHS Women on Boards 50:50 by 2020
National gender profile
NHS provider board membership and diversity survey: October 2018
Men hold around six in every 10 NHS provider board
positions.
The greatest disparity between the representation of men
and women on NHS provider boards is in the NED
community.
Contents

14 |
Only 26% of NHS provider boards are currently achieving the ‘50:50 by 2020’ target of 45-55% of members being women.
136 NHS provider boards have less than 45% women; this highlights the work needed to improve gender balance.
Gender on individual NHS provider boards
NHS provider board membership and diversity survey findings: October 2018
Data based on assumed gender from public information was used to compile this analysis where no survey response was received.
Contents

15 |
A handful of NHS providers have multiple
representatives from the same discipline on their
board (eg divisional medical director) where only one
has voting rights. This may explain why some
apparently key roles on NHS provider boards are filled
by non-voting members.
Gender and voting rights
NHS provider board membership and diversity survey findings: October 2018
The survey indicated that generally women were no
more likely to be appointed to non-voting positions
than their male colleagues, although there is a
significant disparity among the chief operating officer
community.
Main Board
Director Roles
Men -
Voting
Rights
Women -
Voting
Rights
Difference
Operations 82% 74% 8%
Medical 98% 96% 2%
Chair 100% 99% 1%
Finance 99% 98% 1%
Chief Executive 100% 100% 0%
NED 96% 97% -1%
HR 42% 43% -1%
Nursing 96% 98% -2%
Contents
16 |
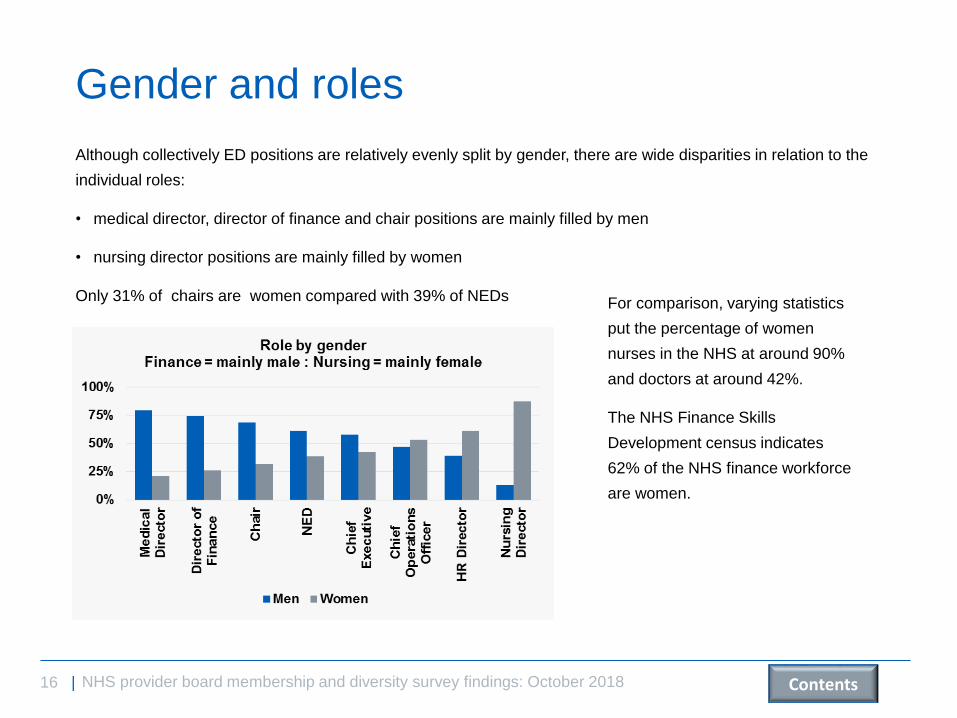
Although collectively ED positions are relatively evenly split by gender, there are wide disparities in relation to the
individual roles:
• medical director, director of finance and chair positions are mainly filled by men
• nursing director positions are mainly filled by women
Only 31% of chairs are women compared with 39% of NEDs
Gender and roles
NHS provider board membership and diversity survey findings: October 2018
For comparison, varying statistics
put the percentage of women
nurses in the NHS at around 90%
and doctors at around 42%.
The NHS Finance Skills
Development census indicates
62% of the NHS finance workforce
are women.
Contents

17 |
NED positions for both BAME and white women
fall well below the ‘50:50 by 2020’ target of a
minimum of 45%.
Gender and ethnicity
NHS provider board membership and diversity survey findings: October 2018
Women from BAME communities are slightly less
likely to be appointed to NHS provider boards
than white women.
Contents

18 |
Executive directors
Although some younger EDs are women, the number
of women appointed to these positions particularly
increases at about age 45, with women then
outnumbering men between ages 45-55.
There is a substantial reduction in the number of
women in ED positions beyond the ages of 50-55.
Gender and age
NHS provider board membership and diversity survey findings: October 2018
Non-executive directors
Up to and including the 50-55 age group the gender of
NEDs is fairly evenly balanced. From the 55-60 age
group onwards NED roles are predominantly filled by
men.
Contents

19 |
There are 27 chair and 96 NED positions held by men who have served over six years and whose
appointments are coming to an end between 2018 and 2020. Each post represents a potential opportunity to
improve NHS provider board diversity. This is just over half of the 231 positions currently held by men that
would need to go to women to achieve the absolute 50:50 target. It is clear that to achieve this ambitious
target, NHS provider boards need to consistently appoint more women than men in the future.
Opportunities to address gender imbalance
Chairs and NEDs are appointed to NHS provider boards for fixed terms. While re-appointments
are common, service in the role beyond six years may compromise a NED’s independence.
NHS provider board membership and diversity survey findings: October 2018 Contents

20 |
Diversity analysis: ethnicity
NHS provider board membership and diversity survey findings: October 2018
21 |
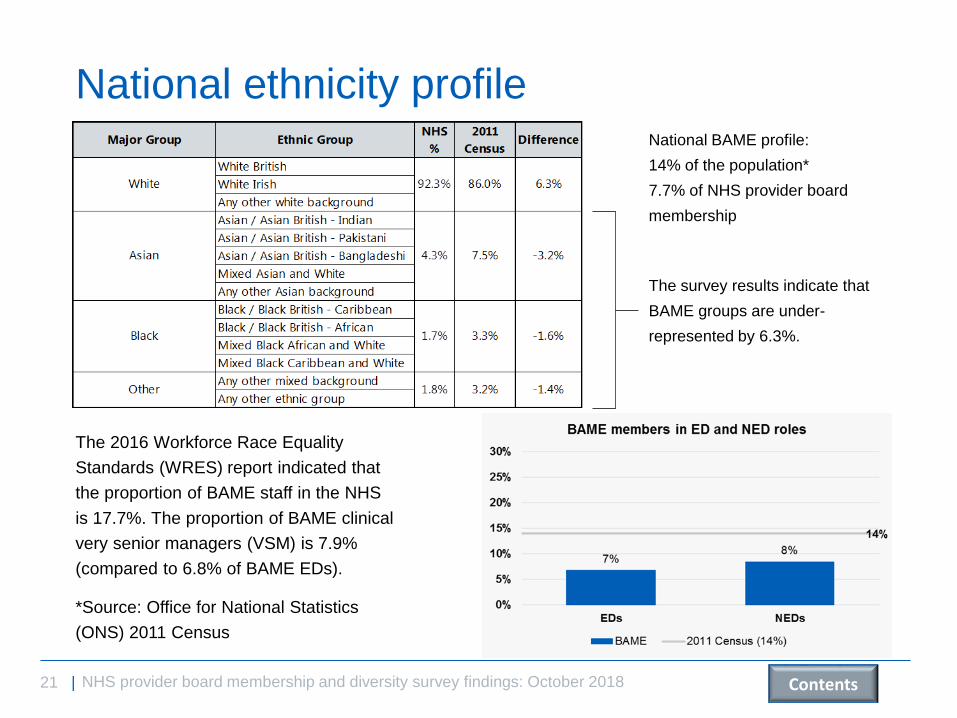
The 2016 Workforce Race Equality
Standards (WRES) report indicated that
the proportion of BAME staff in the NHS
is 17.7%. The proportion of BAME clinical
very senior managers (VSM) is 7.9%
(compared to 6.8% of BAME EDs).
*Source: Office for National Statistics
(ONS) 2011 Census
National ethnicity profile
NHS provider board membership and diversity survey findings: October 2018
National BAME profile:
14% of the population*
7.7% of NHS provider board
membership
The survey results indicate that
BAME groups are under-
represented by 6.3%.
Contents

22 |
At a regional level, comparing our survey data to the 2011 Census data from the Office for National
Statistics shows how far NHS provider board membership reflects the populations they serve.
London has the most diverse boards at 15% BAME membership but they are still less diverse than the
population they serve in terms of ethnicity. The area closest to reflecting the ethnicity of the local
population is the North East with 3.5% BAME board membership and a local BAME population of 4.7%.
Reflecting the ethnicity of the population
NHS provider board membership and diversity survey findings: October 2018
All regions have work to do before they match the
ethnic population of the areas they serve.
Contents
23 |
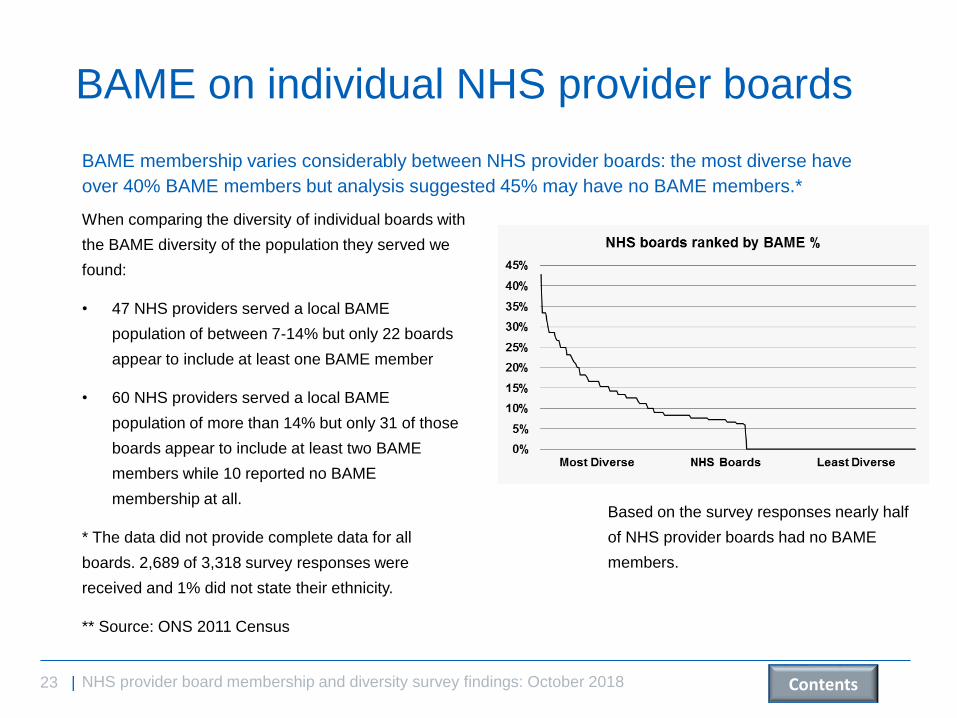
When comparing the diversity of individual boards with
the BAME diversity of the population they served we
found:
• 47 NHS providers served a local BAME
population of between 7-14% but only 22 boards
appear to include at least one BAME member
• 60 NHS providers served a local BAME
population of more than 14% but only 31 of those
boards appear to include at least two BAME
members while 10 reported no BAME
membership at all.
* The data did not provide complete data for all
boards. 2,689 of 3,318 survey responses were
received and 1% did not state their ethnicity.
** Source: ONS 2011 Census
BAME on individual NHS provider boards
NHS provider board membership and diversity survey findings: October 2018
Based on the survey responses nearly half
of NHS provider boards had no BAME
members.
BAME membership varies considerably between NHS provider boards: the most diverse have
over 40% BAME members but analysis suggested 45% may have no BAME members.*
Contents

24 |
• BAME communities are better represented among NEDs than among their ED colleagues.
• Medical director is the only role where the proportion of BAME membership matches that of the NHS
workforce.
• Comparative staff numbers for ED roles are not available although the 2016 WRES report indicated that
17.7% of all NHS staff are from a BAME background (7.9% of very senior managers).
Ethnicity and roles
NHS provider board membership and diversity survey findings: October 2018 Contents

25 |
Diversity analysis: other protected characteristics
NHS provider board membership and diversity survey findings: October 2018

26 |
The age of NHS provider board members ranged from 26 to 79.
Over 90% of NEDs are aged 50 or above compared to just 65% of Eds.
A study of the top 150 companies in the FTSE rankings* found that the average age of an ED is 52.8
and of a NED is 59.6. This compares to the survey findings of 51.7 and 60.0 respectively.
Age
NHS provider board membership and diversity survey findings: October 2018
* SpencerStuart UK Board Index 2016
Contents

27 |
Our survey asked: “Do you consider yourself to be a disabled person? You can consider yourself disabled if you
have a physical or mental impairment or other long term health condition that has had an impact or is expected
to have an impact on you for at least a year, or would have done had your condition not been mitigated or
managed by medication, treatment or adjustments (for example the use of inhalers, physiotherapy, a hearing or
visual aid or insulin).”
According to the ONS 2011 Census, 8.3% of the population considered themselves to be ‘limited a lot’ by a
disability ‒ with a further 9.3% admitting to being ‘limited a little’.
Disability
NHS provider board membership and diversity survey findings: October 2018
At an average of 5.3%, the proportion
of disabled people on NHS provider
boards is well below that of the
general population (17.6%).
People with disabilities are slightly
better represented in NED positions
than in ED positions.
Contents

28 |
• The sexual orientation of the general
population is:*
o 97.9% heterosexual
o 1.2% gay/lesbian
o 0.5% bisexual
o 0.3% other.
• NHS provider boards are slightly more
diverse than the general population in
relation to sexual orientation.
• There is little difference between EDs
and NEDs in terms of sexual orientation.
Sexual orientation
NHS provider board membership and diversity survey findings: October 2018
*Source: Integrated Household Survey, Office for National Statistics
Sexual Identity by Region, UK, 2014 – sexual orientation was not part
of the ONS 2011 Census.
Contents
29 |
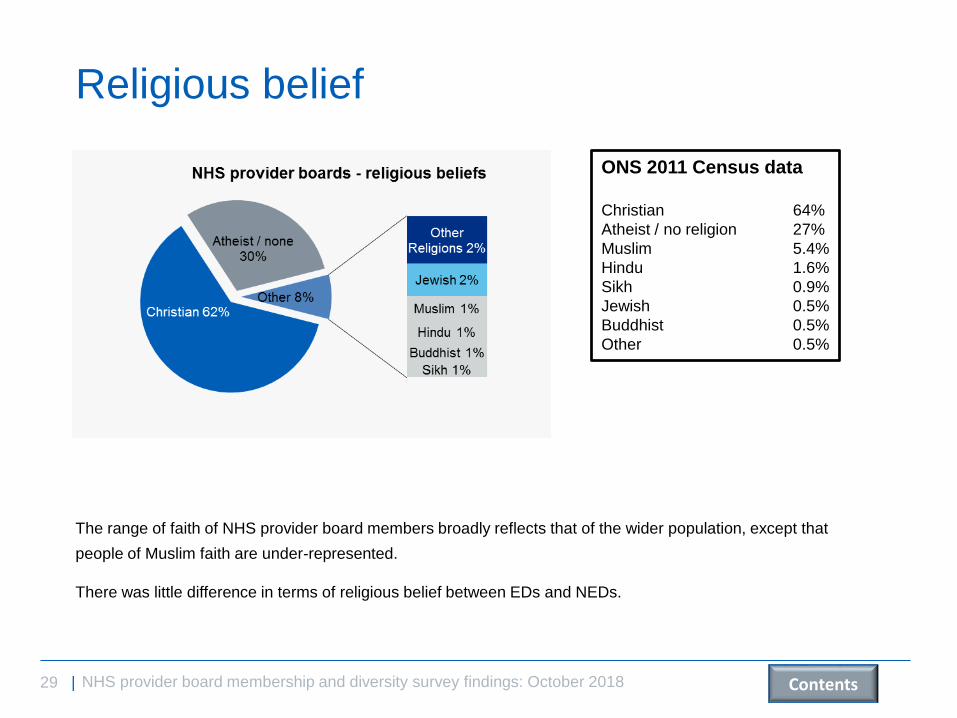
The range of faith of NHS provider board members broadly reflects that of the wider population, except that
people of Muslim faith are under-represented.
There was little difference in terms of religious belief between EDs and NEDs.
Religious belief
NHS provider board membership and diversity survey findings: October 2018
ONS 2011 Census data
Christian 64%
Atheist / no religion 27%
Muslim 5.4%
Hindu 1.6%
Sikh 0.9%
Jewish 0.5%
Buddhist 0.5%
Other 0.5%
Contents

Contact us:
NHS Improvement
Wellington House,
133-155 Waterloo Road,
London,
SE1 8UG
This publication can be made available in a number of other formats on request.
© NHS Improvement 2018 Publication code: R&A 05/18
0300 123 2257
improvement.nhs.uk
@NHSImprovement