Embed Size (px)
Citation preview

A National Statistics Publication for Scotland
Information Services Division
Publication Report
NHSScotland Workforce Information
Quarterly update of Staff in Post, Vacancies and Turnover
at 31 March 2016
Publication date – 07 June 2016
Information Services Division
1
Contents
Contents ..................................................................................................................................... 1
Introduction ................................................................................................................................ 2
Main points ................................................................................................................................. 3
Number of Staff in Post .............................................................................................................. 4
Trend in Staff Numbers .............................................................................................................. 6
Vacancies................................................................................................................................. 10
Nursing and midwifery: bank and agency ................................................................................ 13
Sickness Absence .................................................................................................................... 14
Other information updated in this release ................................................................................ 15
Turnover ............................................................................................................................... 15
Dentist numbers ................................................................................................................... 15
Equality and Diversity ........................................................................................................... 15
Glossary ................................................................................................................................... 16
List of Tables ............................................................................................................................ 17
Contact ..................................................................................................................................... 18
Further Information ................................................................................................................... 18
NHS Performs .......................................................................................................................... 18
Rate this publication ................................................................................................................. 18
Appendices .............................................................................................................................. 19
A1 – Background Information ............................................................................................... 19
A2 – Publication Metadata (including revisions details) ........................................................ 21
A3 – Early Access details (including Pre-Release Access) .................................................. 23
A4 – ISD and Official Statistics ............................................................................................. 24
Information Services Division
2
Introduction
The NHSScotland workforce has a significant role to play in the delivery of quality services that meet the needs of patients, their families and the general public in a modern health service.
The main source of information on staff employed by NHSScotland is the Scottish Workforce Information Standard System (SWISS). In addition to this, ISD collects a range of information directly from NHS Boards. This is published by the Information Services Division (ISD) to support NHS Boards and the Scottish Government in their local, regional and national workforce planning.
This release provides an updates of the following NHSScotland workforce information as at 31 March 2016.
All staff in post
Vacancy numbers for nursing and midwifery, allied health professions and consultants
Staff turnover
Dental workforce
Bank and agency usage for nursing and midwifery staff
Sickness absence
Equality and diversity
Figures are presented as headcount (actual numbers of staff) and whole time equivalent (WTE) which adjusts the figures to take account of part-time working.
For March 2016 data it has been identified that there is a coding issue which has excluded a small number of staff (approximately 200 wte) on fixed term secondments within NHS Boards. This has resulted in a small decrease in reported staff numbers. The biggest impact is on NHS Tayside figures which show a decrease of 179.6 wte. This is being rectified and solutions sought to minimise the opportunity for this type of coding issue recurring.
Revisions
Please note this publication includes revisions to December 2015 consultant vacancies. This is due to resubmissions by NHS Highland, who updated their Clinical radiology vacancies, and NHS Tayside, who updated their General psychiatry vacancies, both with an additional 2.0 WTE compared to the figures that had previously been reported. These revisions affect the following tables:
Consultant_Vacancies_M2016 Medical_Trend_M2016
R On 23/06/2016 a revision was made to medical and dental staff (HCHS) joiner figures for financial year 1st April 2015 to 31st March 2016 to correct a processing error. All staff joiner figures were also affected. The revised figures can be found in the following table: Turnover_M2016.xls
Information Services Division
3
Main points
At 31 March 2016, the number of staff employed by NHSScotland was 161,656
(headcount). This is equivalent to 138,458.2 whole time staff (referred to as whole time
equivalent or WTE), an increase of 0.6% compared to March 2015.
The number of consultants in post was 5,115.6 WTE in March 2016, an increase of 4.0%
compared to March 2015.
There were 355.4 WTE vacant consultant posts. This represents a vacancy rate of 6.5%, a
decrease from 7.7% at March 2015. Of these vacancies, 166.1 WTE were vacant for more
than six months, an increase of 17.4 WTE compared to March 2015.
The number of nursing and midwifery staff in post increased by 0.3% to 59,372.4 WTE
compared to March 2015.
There were 2,207.3 WTE vacant nursing and midwifery posts. This represents a vacancy
rate of 3.6%, a slight increase from 3.3% at March 2015.
The use of bank nursing and midwifery staff stabilised in the last year, increasing by 0.7%
from 4,256 WTE in March 2015 to 4,287 WTE in March 2016. The use of agency nursing
and midwifery staff increased substantially for the third consecutive year, providing cover
equivalent to 276.7 WTE in 2015/16 compared to 191 WTE in 2014/15. This represents an
increase of 44.9% with costs rising at a similar rate from £16m to just under £23.5m. This
is a large increase in agency use but, when viewed in the context of the total nursing and
midwifery workforce (WTE of staff in post, agency and bank), the proportion is small (0.4%).
Information Services Division
4
Number of Staff in Post
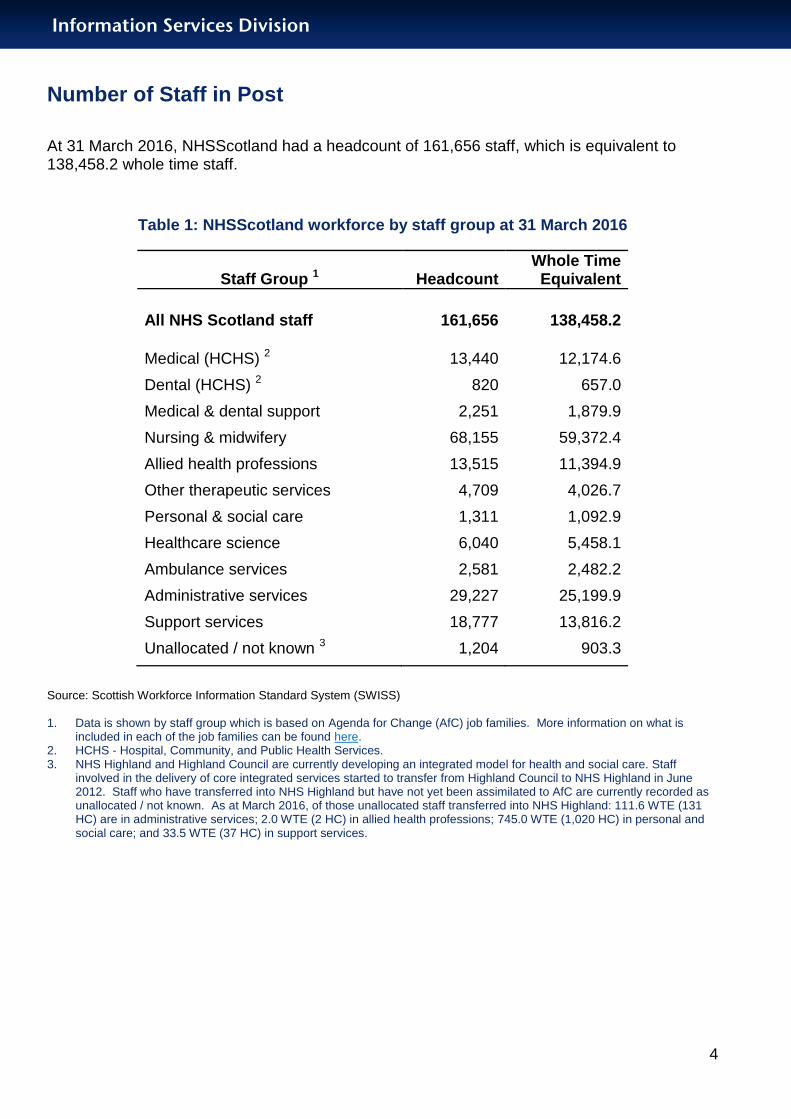
At 31 March 2016, NHSScotland had a headcount of 161,656 staff, which is equivalent to 138,458.2 whole time staff.
Table 1: NHSScotland workforce by staff group at 31 March 2016
Staff Group 1 Headcount Whole Time
Equivalent
All NHS Scotland staff 161,656 138,458.2
Medical (HCHS) 2 13,440 12,174.6
Dental (HCHS) 2 820 657.0
Medical & dental support 2,251 1,879.9
Nursing & midwifery 68,155 59,372.4
Allied health professions 13,515 11,394.9
Other therapeutic services 4,709 4,026.7
Personal & social care 1,311 1,092.9
Healthcare science 6,040 5,458.1
Ambulance services 2,581 2,482.2
Administrative services 29,227 25,199.9
Support services 18,777 13,816.2
Unallocated / not known 3 1,204 903.3
Source: Scottish Workforce Information Standard System (SWISS) 1. Data is shown by staff group which is based on Agenda for Change (AfC) job families. More information on what is
included in each of the job families can be found here. 2. HCHS - Hospital, Community, and Public Health Services. 3. NHS Highland and Highland Council are currently developing an integrated model for health and social care. Staff
involved in the delivery of core integrated services started to transfer from Highland Council to NHS Highland in June 2012. Staff who have transferred into NHS Highland but have not yet been assimilated to AfC are currently recorded as unallocated / not known. As at March 2016, of those unallocated staff transferred into NHS Highland: 111.6 WTE (131 HC) are in administrative services; 2.0 WTE (2 HC) in allied health professions; 745.0 WTE (1,020 HC) in personal and social care; and 33.5 WTE (37 HC) in support services.
Information Services Division
5
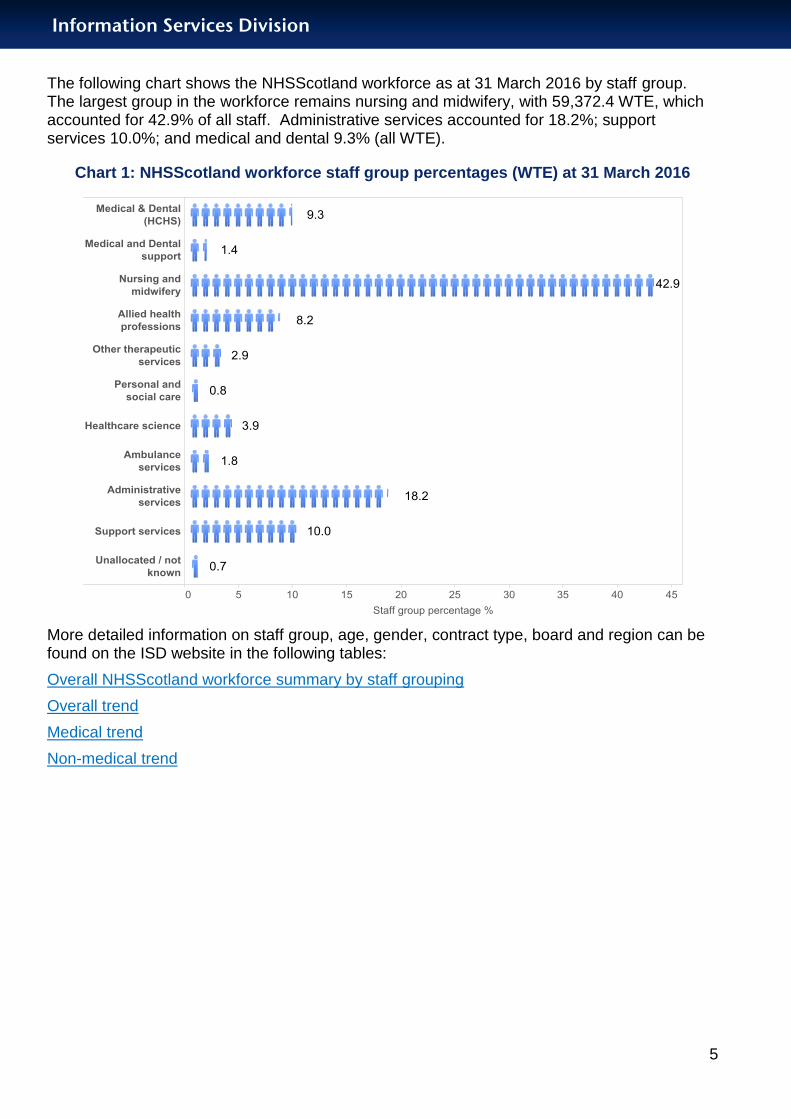
The following chart shows the NHSScotland workforce as at 31 March 2016 by staff group. The largest group in the workforce remains nursing and midwifery, with 59,372.4 WTE, which accounted for 42.9% of all staff. Administrative services accounted for 18.2%; support services 10.0%; and medical and dental 9.3% (all WTE).
Chart 1: NHSScotland workforce staff group percentages (WTE) at 31 March 2016
More detailed information on staff group, age, gender, contract type, board and region can be found on the ISD website in the following tables:
Overall NHSScotland workforce summary by staff grouping
Overall trend
Medical trend
Non-medical trend

Information Services Division
6
Trend in Staff Numbers
There has been an increase of 5.6% (7,286.1 WTE) in the total NHSScotland workforce since March 2012.
Chart 2: NHSScotland total workforce trend 1
1. Note that the vertical axis does not start from zero
Information Services Division
7
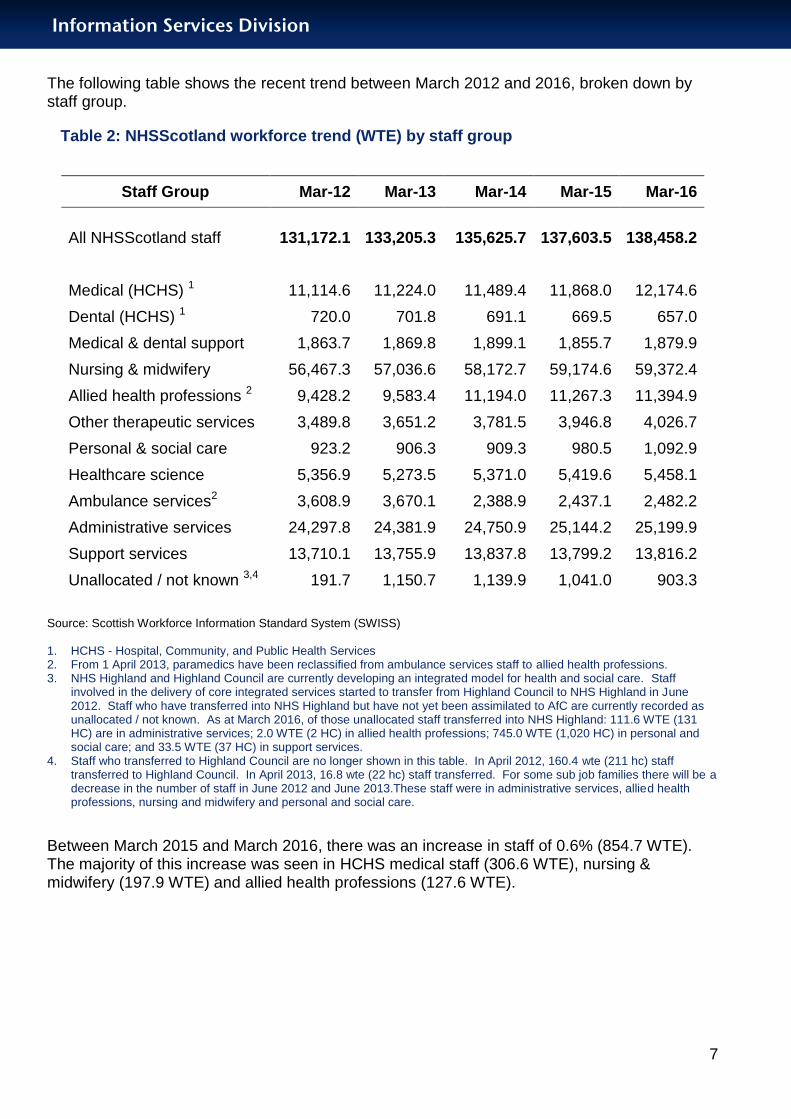
The following table shows the recent trend between March 2012 and 2016, broken down by staff group.
Table 2: NHSScotland workforce trend (WTE) by staff group
Source: Scottish Workforce Information Standard System (SWISS) 1. HCHS - Hospital, Community, and Public Health Services 2. From 1 April 2013, paramedics have been reclassified from ambulance services staff to allied health professions. 3. NHS Highland and Highland Council are currently developing an integrated model for health and social care. Staff
involved in the delivery of core integrated services started to transfer from Highland Council to NHS Highland in June 2012. Staff who have transferred into NHS Highland but have not yet been assimilated to AfC are currently recorded as unallocated / not known. As at March 2016, of those unallocated staff transferred into NHS Highland: 111.6 WTE (131 HC) are in administrative services; 2.0 WTE (2 HC) in allied health professions; 745.0 WTE (1,020 HC) in personal and social care; and 33.5 WTE (37 HC) in support services.
4. Staff who transferred to Highland Council are no longer shown in this table. In April 2012, 160.4 wte (211 hc) staff transferred to Highland Council. In April 2013, 16.8 wte (22 hc) staff transferred. For some sub job families there will be a decrease in the number of staff in June 2012 and June 2013.These staff were in administrative services, allied health professions, nursing and midwifery and personal and social care.
Between March 2015 and March 2016, there was an increase in staff of 0.6% (854.7 WTE). The majority of this increase was seen in HCHS medical staff (306.6 WTE), nursing & midwifery (197.9 WTE) and allied health professions (127.6 WTE).
Staff Group Mar-12 Mar-13 Mar-14 Mar-15 Mar-16
All NHSScotland staff 131,172.1 133,205.3 135,625.7 137,603.5 138,458.2
Medical (HCHS) 1 11,114.6 11,224.0 11,489.4 11,868.0 12,174.6
Dental (HCHS) 1 720.0 701.8 691.1 669.5 657.0
Medical & dental support 1,863.7 1,869.8 1,899.1 1,855.7 1,879.9
Nursing & midwifery 56,467.3 57,036.6 58,172.7 59,174.6 59,372.4
Allied health professions 2 9,428.2 9,583.4 11,194.0 11,267.3 11,394.9
Other therapeutic services 3,489.8 3,651.2 3,781.5 3,946.8 4,026.7
Personal & social care 923.2 906.3 909.3 980.5 1,092.9
Healthcare science 5,356.9 5,273.5 5,371.0 5,419.6 5,458.1
Ambulance services2 3,608.9 3,670.1 2,388.9 2,437.1 2,482.2
Administrative services 24,297.8 24,381.9 24,750.9 25,144.2 25,199.9
Support services 13,710.1 13,755.9 13,837.8 13,799.2 13,816.2
Unallocated / not known 3,4 191.7 1,150.7 1,139.9 1,041.0 903.3
Information Services Division
8
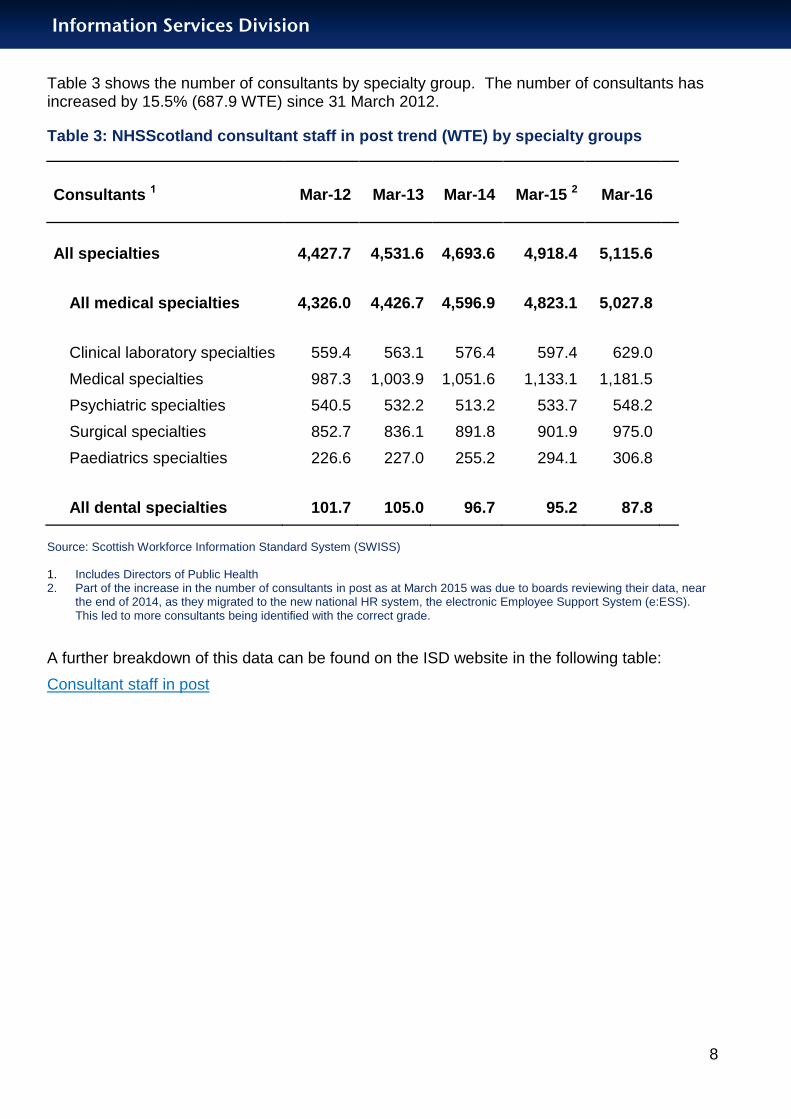
Table 3 shows the number of consultants by specialty group. The number of consultants has increased by 15.5% (687.9 WTE) since 31 March 2012.
Table 3: NHSScotland consultant staff in post trend (WTE) by specialty groups
Consultants 1 Mar-12 Mar-13 Mar-14 Mar-15 2 Mar-16
All specialties 4,427.7 4,531.6 4,693.6 4,918.4 5,115.6
All medical specialties 4,326.0 4,426.7 4,596.9 4,823.1 5,027.8
Clinical laboratory specialties 559.4 563.1 576.4 597.4 629.0
Medical specialties 987.3 1,003.9 1,051.6 1,133.1 1,181.5
Psychiatric specialties 540.5 532.2 513.2 533.7 548.2
Surgical specialties 852.7 836.1 891.8 901.9 975.0
Paediatrics specialties 226.6 227.0 255.2 294.1 306.8
All dental specialties 101.7 105.0 96.7 95.2 87.8
Source: Scottish Workforce Information Standard System (SWISS) 1. Includes Directors of Public Health 2. Part of the increase in the number of consultants in post as at March 2015 was due to boards reviewing their data, near
the end of 2014, as they migrated to the new national HR system, the electronic Employee Support System (e:ESS). This led to more consultants being identified with the correct grade.
A further breakdown of this data can be found on the ISD website in the following table:
Consultant staff in post
Information Services Division
9
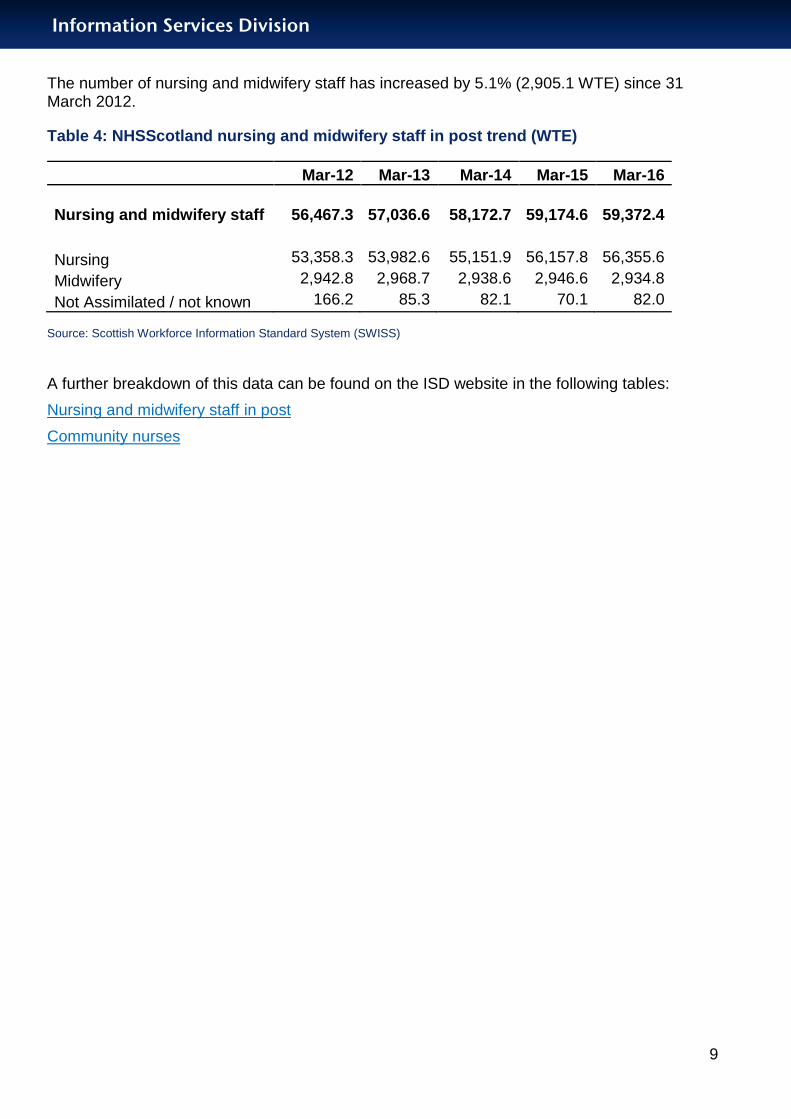
The number of nursing and midwifery staff has increased by 5.1% (2,905.1 WTE) since 31 March 2012.
Table 4: NHSScotland nursing and midwifery staff in post trend (WTE)
Mar-12 Mar-13 Mar-14 Mar-15 Mar-16
Nursing and midwifery staff 56,467.3 57,036.6 58,172.7 59,174.6 59,372.4
Nursing 53,358.3 53,982.6 55,151.9 56,157.8 56,355.6
Midwifery 2,942.8 2,968.7 2,938.6 2,946.6 2,934.8
Not Assimilated / not known 166.2 85.3 82.1 70.1 82.0
Source: Scottish Workforce Information Standard System (SWISS)
A further breakdown of this data can be found on the ISD website in the following tables:
Nursing and midwifery staff in post
Community nurses
Information Services Division
10
Vacancies Vacancies are counted as posts that have been cleared for advert after being through the redeployment process (internal or external advert) and remain as a vacancy until an individual starts in the post. The number of vacancies is a measure of how many posts are being recruited to. Figures may reflect a variety of circumstances within a board such as a gap in staffing or the establishment or growth of services in which new staff are being recruited to. However, note that a post marked as a vacancy may still be occupied by the previous incumbent and so also included within the staff in post figure. In contrast, some NHS Boards may not recruit where the post is currently being covered by a locum. NHS Boards are currently working with ISD to improve the consistency and accuracy of vacancy recording.
Consultants
At 31 March 2016, 6.5% (355.4 WTE) of consultant posts were vacant, a decrease from the rate of 7.7% at March 2015. Of these vacancies, 166.1 WTE were vacant for more than six months, an increase of 17.4 WTE since March 2015.
The highest numbers of vacancies were recorded in Clinical radiology (40.3 WTE; 11.1% vacancy rate), Anaesthetics (32.0 WTE; 4.2%), General psychiatry (24.8 WTE; 6.9%), Emergency medicine (23.5 WTE, 10.1%) and General (acute) medicine (21.5 WTE, 12.9%).
Allied Health Professions
At 31 March 2016, 3.7% (435.1 WTE) of allied health profession posts were vacant, a slight increase from the rate of 3.5% at March 2015. Of these vacancies, 113.9 WTE were vacant for more than three months, an increase of 5.9 WTE since March 2015.
The highest numbers of vacancies were recorded in Physiotherapy (156.7 WTE; 5.3%), Occupational therapy (109.4 WTE; 4.7%) and Diagnostic radiography (78.0 WTE; 3.8%).
Nursing and Midwifery
At 31 March 2016, 3.6 % (2,207.3 WTE) of nursing and midwifery posts were vacant, a slight increase from the rate of 3.3% at March 2015. Of these vacancies, 443.2 WTE posts were vacant for more than three months, a decrease of 29.5 WTE since March 2015.
The highest vacancy rates were recorded in Health visiting (8.6%) and Paediatric (4.9%).
Information Services Division
11
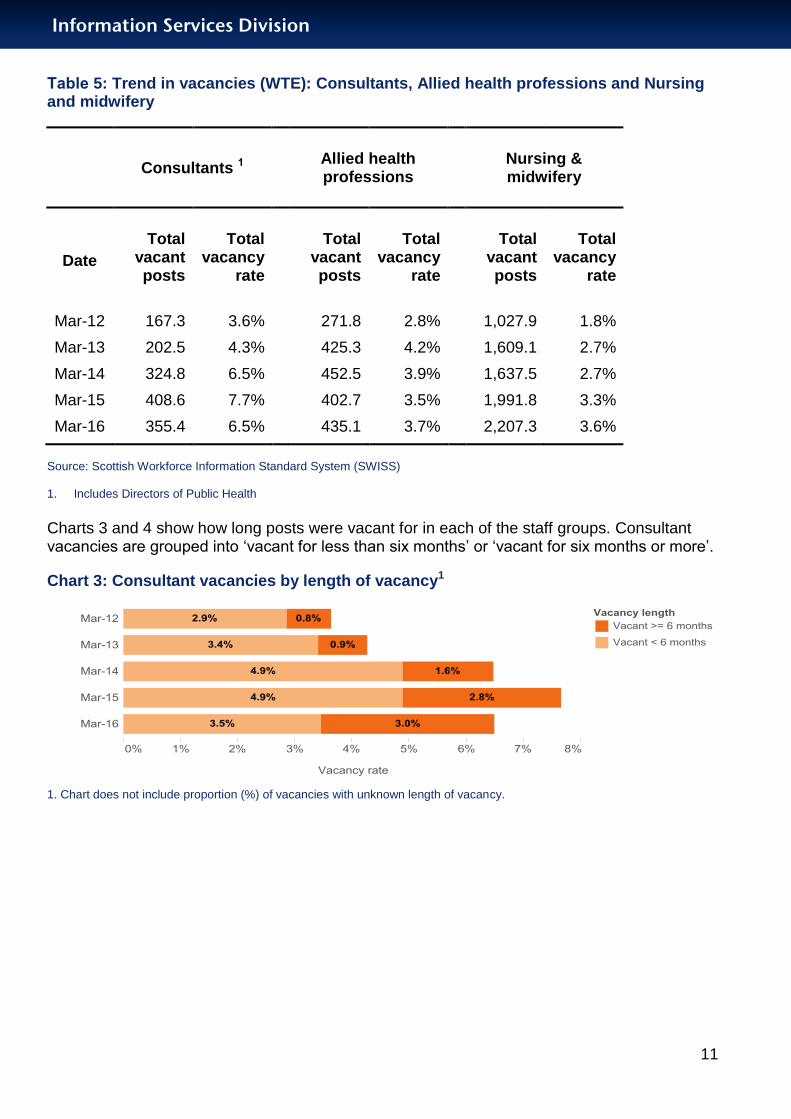
Table 5: Trend in vacancies (WTE): Consultants, Allied health professions and Nursing and midwifery
Consultants 1
Allied health professions
Nursing & midwifery
Date
Total vacant posts
Total vacancy
rate
Total vacant posts
Total vacancy
rate
Total vacant posts
Total vacancy
rate
Mar-12 167.3 3.6%
271.8 2.8%
1,027.9 1.8%
Mar-13 202.5 4.3%
425.3 4.2%
1,609.1 2.7%
Mar-14 324.8 6.5%
452.5 3.9%
1,637.5 2.7%
Mar-15 408.6 7.7%
402.7 3.5%
1,991.8 3.3%
Mar-16 355.4 6.5%
435.1 3.7%
2,207.3 3.6%
Source: Scottish Workforce Information Standard System (SWISS) 1. Includes Directors of Public Health
Charts 3 and 4 show how long posts were vacant for in each of the staff groups. Consultant vacancies are grouped into ‘vacant for less than six months’ or ‘vacant for six months or more’.
Chart 3: Consultant vacancies by length of vacancy1
1. Chart does not include proportion (%) of vacancies with unknown length of vacancy.
Information Services Division
12
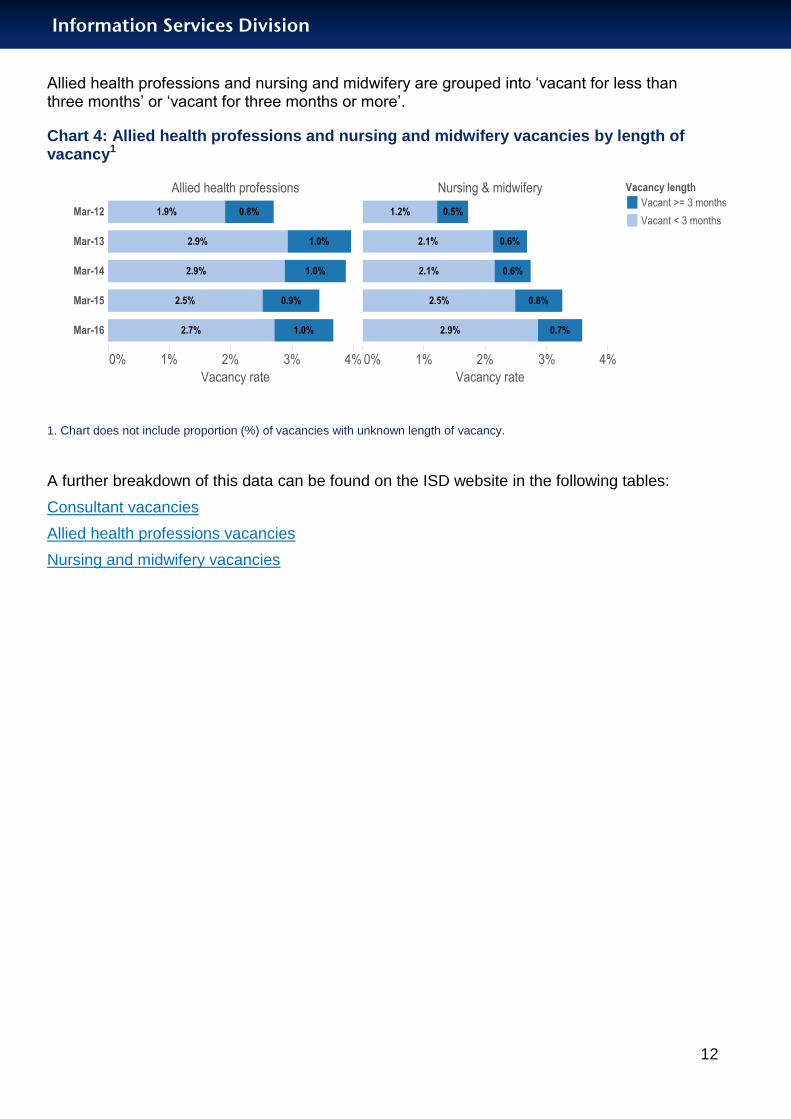
Allied health professions and nursing and midwifery are grouped into ‘vacant for less than three months’ or ‘vacant for three months or more’.
Chart 4: Allied health professions and nursing and midwifery vacancies by length of vacancy1
1. Chart does not include proportion (%) of vacancies with unknown length of vacancy.
A further breakdown of this data can be found on the ISD website in the following tables:
Consultant vacancies
Allied health professions vacancies
Nursing and midwifery vacancies
Information Services Division
13
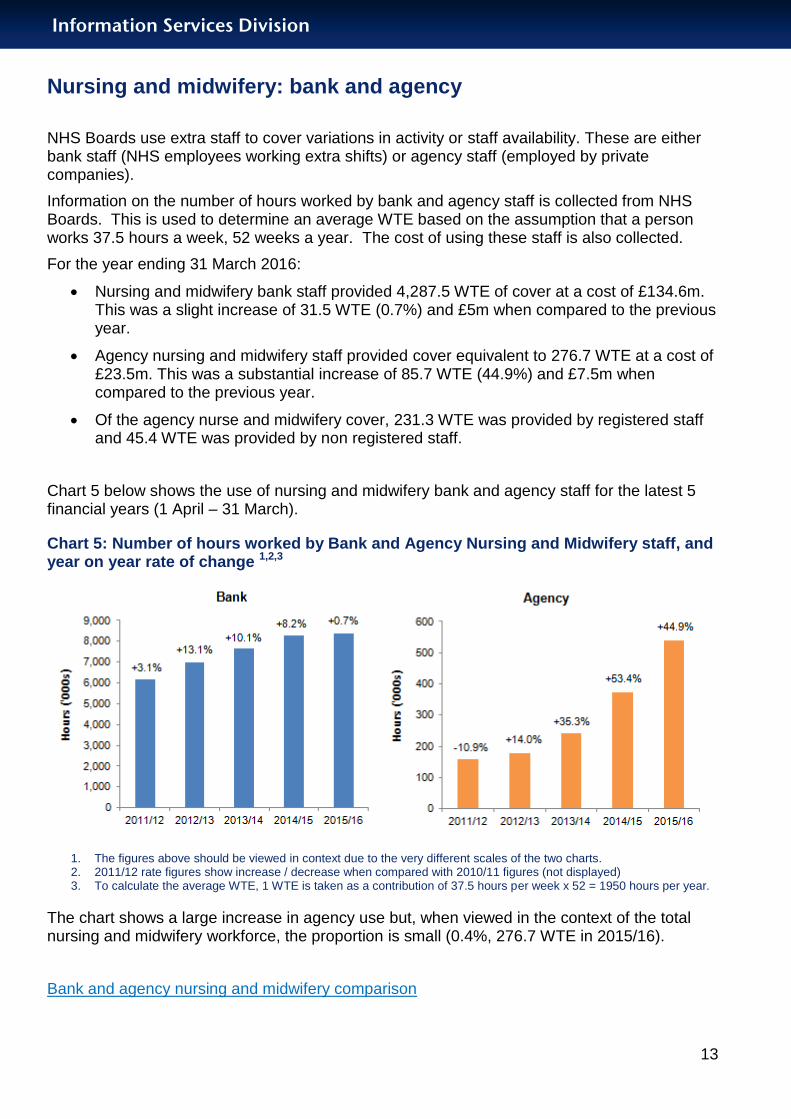
Nursing and midwifery: bank and agency
NHS Boards use extra staff to cover variations in activity or staff availability. These are either bank staff (NHS employees working extra shifts) or agency staff (employed by private companies).
Information on the number of hours worked by bank and agency staff is collected from NHS Boards. This is used to determine an average WTE based on the assumption that a person works 37.5 hours a week, 52 weeks a year. The cost of using these staff is also collected.
For the year ending 31 March 2016:
Nursing and midwifery bank staff provided 4,287.5 WTE of cover at a cost of £134.6m. This was a slight increase of 31.5 WTE (0.7%) and £5m when compared to the previous year.
Agency nursing and midwifery staff provided cover equivalent to 276.7 WTE at a cost of £23.5m. This was a substantial increase of 85.7 WTE (44.9%) and £7.5m when compared to the previous year.
Of the agency nurse and midwifery cover, 231.3 WTE was provided by registered staff and 45.4 WTE was provided by non registered staff.
Chart 5 below shows the use of nursing and midwifery bank and agency staff for the latest 5 financial years (1 April – 31 March).
Chart 5: Number of hours worked by Bank and Agency Nursing and Midwifery staff, and year on year rate of change 1,2,3
1. The figures above should be viewed in context due to the very different scales of the two charts. 2. 2011/12 rate figures show increase / decrease when compared with 2010/11 figures (not displayed) 3. To calculate the average WTE, 1 WTE is taken as a contribution of 37.5 hours per week x 52 = 1950 hours per year.
The chart shows a large increase in agency use but, when viewed in the context of the total nursing and midwifery workforce, the proportion is small (0.4%, 276.7 WTE in 2015/16).
Bank and agency nursing and midwifery comparison
Information Services Division
14
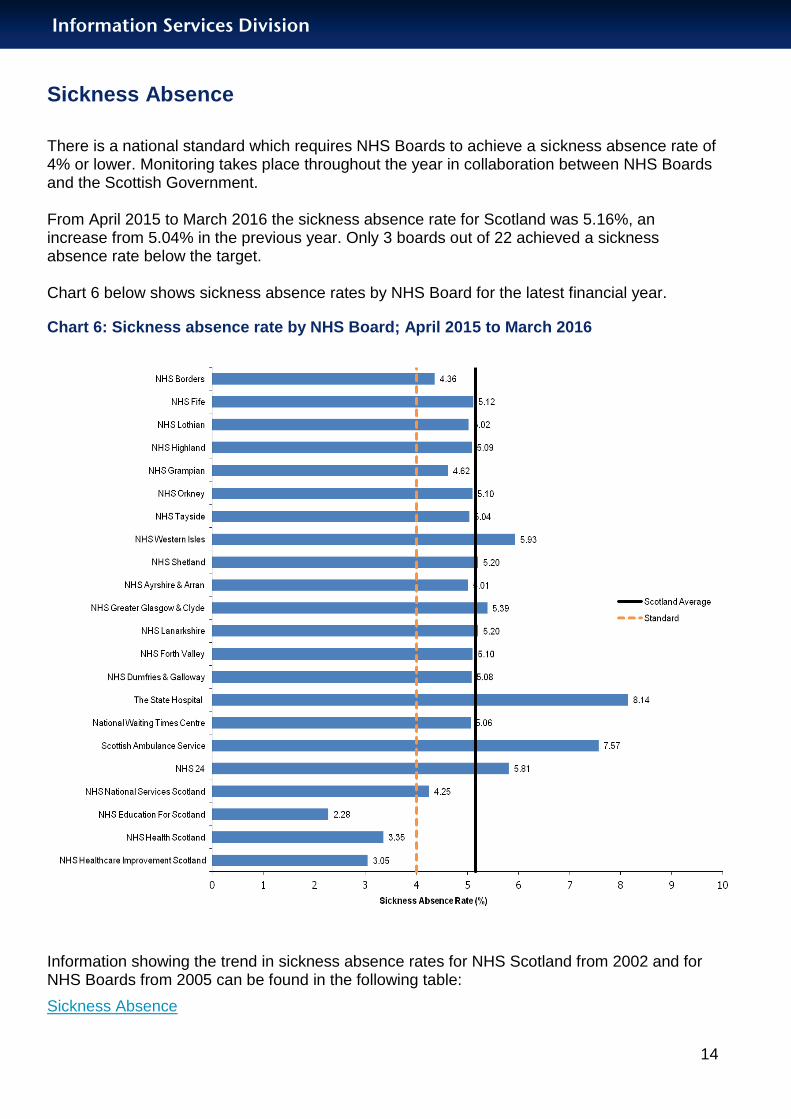
Sickness Absence
There is a national standard which requires NHS Boards to achieve a sickness absence rate of 4% or lower. Monitoring takes place throughout the year in collaboration between NHS Boards and the Scottish Government. From April 2015 to March 2016 the sickness absence rate for Scotland was 5.16%, an increase from 5.04% in the previous year. Only 3 boards out of 22 achieved a sickness absence rate below the target. Chart 6 below shows sickness absence rates by NHS Board for the latest financial year.
Chart 6: Sickness absence rate by NHS Board; April 2015 to March 2016
Information showing the trend in sickness absence rates for NHS Scotland from 2002 and for NHS Boards from 2005 can be found in the following table:
Sickness Absence

Information Services Division
15
Other information updated in this release
Turnover
During the financial year 2015/16, 9,572.4 WTER people joined and 8,449.6 WTE people left NHSScotland. For information on the number of joiners and leavers by NHS Board and staff group, see the following table: Turnover
Dentist numbers
At 31 March 2016, there was a headcount of 3,588 dentists working across Scotland, a slight
increase of 0.1% from 31 March 2015. For more information on dentist numbers, see the
following table:
Dentists
Equality and Diversity
Information presented in this section is based on self-reporting by staff in NHS Scotland. Data is collected via staff engagement forms when people join or change organisations within NHS Scotland, or via a questionnaire exercise undertaken for all staff in post.
For information on all equality and diversity categories, which include ethnic group, religion, disability, transgender and sexual orientation, please go to the following table: Equality and Diversity
Information Services Division
16
Glossary
Agenda for Change (AfC): The national pay system for NHS workforce.
Establishment: Term used in calculating NHSScotland vacancy information to describe the total filled and vacant posts. Establishment is calculated by adding the number of staff in post to the number of vacant posts.
Headcount: The actual number of individuals working within NHSScotland. The Scotland figure eliminates any double counting that may exist as a result of an employee holding more than one post.
Scottish Workforce Information Standard System (SWISS): The main source of NHSScotland workforce statistics. (See Appendix A1 for further information).
Whole time equivalent (WTE): The WTE is calculated by dividing the number of contracted hours by the number of hours worked (conditioned hours). WTE is sometimes a more useful measurement than headcount because it adjusts headcount figures to take account of part time working; e.g. one person may work 20 hours a week, so just using headcount could make the workforce appear larger than it is. WTE is sometimes referred to as full time equivalent (FTE).
A full Workforce information glossary is available on our website here.
Information Services Division
17
List of Tables
Table No. Name Time period File & size
1 Overall trend Mar 2016 Excel [505kb]
2 Medical trend Mar 2016 Excel [15,196kb]
3 Non-medical trend Mar 2016 Excel [17,449kb]
4 Overall NHSScotland workforce summary by staff grouping
Mar 2016 Excel [7,968kb]
5 Staff turnover Mar 2016 Excel [354Kb]
6 Medical & dental staff in post Mar 2016 Excel [11,400kb]
7 HCHS medical and dental staff by specialty Mar 2016 Excel [24,253kb]
8 HCHS medical and dental staff by grade Mar 2016 Excel [9,765kb]
9 Consultant staff in post Mar 2016 Excel [1,297kb]
10 Consultant vacancies Mar 2016 Excel [8,650kb]
11 Consultant contract Sep 2015 Excel [306kb]
12 Nursing and midwifery staff in post Mar 2016 Excel [48,238kb]
13 Community nurses Mar 2016 Excel [8,550kb]
14 Nursing and midwifery vacancies Mar 2016 Excel [1,992kb]
15 Clinical nurse specialists Sep 2015 Excel [6,312kb]
16 Bank and agency nursing and midwifery comparison (capacity)
Mar 2016 Excel [1,236kb]
17 Nursing and midwifery - student intakes and students in training
Sep 2015 Excel [39kb]
18 Nursing and midwifery progression rates Sep 2015 Excel [360kb]
19 Allied health professions staff in post Mar 2016 Excel [9,890kb]
20 Allied health professions vacancies Mar 2016 Excel [2,977kb]
21 Other therapeutic staff and personal social care staff in post
Mar 2016 Excel [5,536kb]
22 Healthcare science staff in post Mar 2016 Excel [7,355kb]
23 All other staff in post Mar 2016 Excel [12,233kb]
24 Pharmacy vacancies Sep 2015 Excel [3,558kb]
25 Sickness absence Mar 2016 Excel [174kb]
26 Equality and Diversity Mar 2016 Excel [439kb]
27 Dentists Mar 2016 Excel [809kb]

Information Services Division
18
Contact Workforce team mailbox – viewed daily [email protected]
Stephen Bush Senior Information Analyst 0131 275 6809
Sian Guy Senior Information Analyst 0141 282 2313
Tracey Steedman Principal Information Analyst 0131 275 6179
Further Information Further information can be found on the ISD website
NHS Performs A selection of information from this publication is included in NHS Performs. NHS Performs is a website that brings together a range of information on how hospitals and NHS Boards within NHSScotland are performing.
Rate this publication Please provide feedback on this publication to help us improve our services.
Information Services Division
19
Appendices
A1 – Background Information
The main source of workforce statistics is the Scottish Workforce Information Standard System (SWISS). SWISS brings together HR and Payroll information into one system.
A new national HR system, electronic Employee Support System (e:ESS), is currently being rolled out across all boards. As boards migrate to the new system, their data captured in e:ESS continues to feed into SWISS.
Data is shown in AfC job families. More information on what is included in each of the job families can be found here.
Further information on current data sources and collections can be found on the ISD Workforce Statistics Frequently Asked Questions page.
Health and social care integration
NHS Highland and Highland Council are currently developing an integrated model for health and social care. Staff involved in the delivery of core integrated services started to transfer from Highland Council to NHS Highland in June 2012. Staff who have already transferred into NHS Highland but have not yet been assimilated to AfC are currently recorded as unallocated / not known. Figures are noted on table 1 above.
Data quality
Workforce information is sourced from each board’s HR and payroll systems. These are dynamic, operational systems in which the data can change over time due to their live status, and potential additional updates made by individual boards.
It is recognised that the published information does not always reflect the data used at board and regional level when planning and presenting the workforce. Accuracy of coding is crucial to the quality and credibility of the data, and ISD seeks to minimise such data inaccuracies. However, responsibility for data accuracy lies with the boards providing the data.
The ISD workforce team work with boards throughout the year in an attempt to improve data quality. Published information may change over time to reflect these improvements.
e:ESS is being introduced across NHSScotland in phases, with each board at a different stage in the process. A number of boards have migrated their data to e:ESS, and this affects data on location of service delivery, medical grade and medical specialty. Changes have been seen in these as boards review their data as part of the migration process.
A review of community nursing staff data, including district nurses and health visitors, was undertaken in 2014/15 to ensure the availability of more accurate and consistent data reporting for these staff groups. The main section of the review is now complete and workforce information for these staff groups is now available in a separate table. Please see the relevant nursing and midwifery tables for further information.
Scottish Government – Workforce Vision
In June 2013, the Scottish Government launched the 2020 Workforce Vision "Everyone Matters" to ensure that everyone who works for NHSScotland is: treated fairly; empowered to influence the way they work; supported to work to the best of their ability; supported to keep their skills and knowledge up to date.
Information Services Division
20
The 2020 Workforce Vision Implementation Framework and Plan 2014-15 sets out the key ambitions, as well as the main challenges, facing the future provision of healthcare services in Scotland. The programme also sets out a framework of what the workforce needs to look like in order to deliver against those ambitions and achieve the 2020 Vision for Healthcare in Scotland.
Information Services Division
21
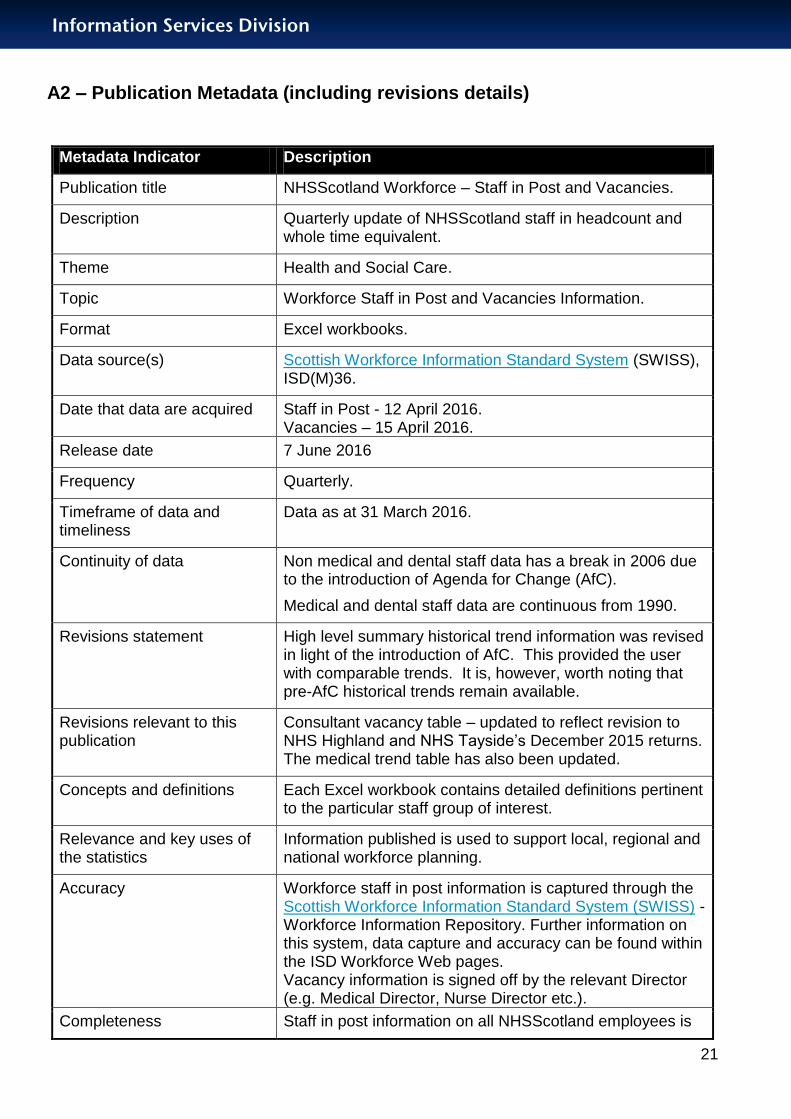
A2 – Publication Metadata (including revisions details)
Metadata Indicator Description
Publication title NHSScotland Workforce – Staff in Post and Vacancies.
Description Quarterly update of NHSScotland staff in headcount and whole time equivalent.
Theme Health and Social Care.
Topic Workforce Staff in Post and Vacancies Information.
Format Excel workbooks.
Data source(s) Scottish Workforce Information Standard System (SWISS), ISD(M)36.
Date that data are acquired Staff in Post - 12 April 2016. Vacancies – 15 April 2016.
Release date 7 June 2016
Frequency Quarterly.
Timeframe of data and timeliness
Data as at 31 March 2016.
Continuity of data Non medical and dental staff data has a break in 2006 due to the introduction of Agenda for Change (AfC).
Medical and dental staff data are continuous from 1990.
Revisions statement High level summary historical trend information was revised in light of the introduction of AfC. This provided the user with comparable trends. It is, however, worth noting that pre-AfC historical trends remain available.
Revisions relevant to this publication
Consultant vacancy table – updated to reflect revision to NHS Highland and NHS Tayside’s December 2015 returns. The medical trend table has also been updated.
Concepts and definitions Each Excel workbook contains detailed definitions pertinent to the particular staff group of interest.
Relevance and key uses of the statistics
Information published is used to support local, regional and national workforce planning.
Accuracy Workforce staff in post information is captured through the Scottish Workforce Information Standard System (SWISS) - Workforce Information Repository. Further information on this system, data capture and accuracy can be found within the ISD Workforce Web pages. Vacancy information is signed off by the relevant Director (e.g. Medical Director, Nurse Director etc.).
Completeness Staff in post information on all NHSScotland employees is

Information Services Division
22
captured (100%) within SWISS. However, it is acknowledged that certain fields within the system are better captured than others. ISD continues to work with the SWISS project team and each individual board to improve data quality.
All NHS Boards in Scotland return vacancy information.
Comparability Workforce data are comparable and regularly used in both UK and international comparison reports (e.g. EUROSTAT).
Accessibility It is the policy of ISD Scotland to make its web sites and products accessible according to published guidelines.
Coherence and clarity All Workforce tables are accessible via the ISD website. Workforce statistics are presented within Excel spreadsheets of staff groupings, where appropriate. Staff groups are split by band, age, gender and contract type. This should minimise the number of spreadsheets a user has to go through to find data, as well as ensure that they are selecting the correct data. Geographical hierarchies are also presented using drop down menus. Spreadsheet formats have been altered for increased clarity by introducing drop-down menus.
Value type and unit of measurement
Headcount and WTE = number, rate, percentage.
Disclosure The ISD protocol on Statistical Disclosure Protocol is followed.
Official Statistics designation National Statistics.
UK Statistics Authority Assessment
Completed assessment by UK Statistics Authority. Report published May 2010.
Last published 1 March 2016
Next published 6 September 2016
Date of first publication Paper publications since 1970s, web publications since 1996.
Help email [email protected]
Date form completed May 2016

Information Services Division
23
A3 – Early Access details (including Pre-Release Access)
Pre-Release Access
Under terms of the "Pre-Release Access to Official Statistics (Scotland) Order 2008", ISD are obliged to publish information on those receiving Pre-Release Access ("Pre-Release Access" refers to statistics in their final form prior to publication). The standard maximum Pre-Release Access is five working days. Shown below are details of those receiving standard Pre-Release Access.
Standard Pre-Release Access:
Scottish Government Health Department
NHS Board Chief Executives
NHS Board Communication leads
Information Services Division
24
A4 – ISD and Official Statistics
About ISD
Scotland has some of the best health service data in the world combining high quality, consistency, national coverage and the ability to link data to allow patient based analysis and follow up.
Information Services Division (ISD) is a business operating unit of NHS National Services Scotland and has been in existence for over 40 years. We are an essential support service to NHSScotland and the Scottish Government and others, responsive to the needs of NHSScotland as the delivery of health and social care evolves.
Purpose: To deliver effective national and specialist intelligence services to improve the health and wellbeing of people in Scotland.
Mission: Better Information, Better Decisions, Better Health
Vision: To be a valued partner in improving health and wellbeing in Scotland by providing a world class intelligence service.
Official Statistics
Information Services Division (ISD) is the principal and authoritative source of statistics on health and care services in Scotland. ISD is designated by legislation as a producer of ‘Official Statistics’. Our official statistics publications are produced to a high professional standard and comply with the Code of Practice for Official Statistics. The Code of Practice is produced and monitored by the UK Statistics Authority which is independent of Government. Under the Code of Practice, the format, content and timing of statistics publications are the responsibility of professional staff working within ISD.
ISD’s statistical publications are currently classified as one of the following:
National Statistics (i.e. assessed by the UK Statistics Authority as complying with the Code of Practice)
National Statistics (i.e. legacy, still to be assessed by the UK Statistics Authority)
Official Statistics (i.e. still to be assessed by the UK Statistics Authority)
other (not Official Statistics)
Further information on ISD’s statistics, including compliance with the Code of Practice for Official Statistics, and on the UK Statistics Authority, is available on the ISD website.
The United Kingdom Statistics Authority has designated these statistics as National Statistics, in accordance with the Statistics and Registration Service Act 2007 and signifying compliance with the Code of Practice for Official Statistics. Designation can be broadly interpreted to mean that the statistics:
meet identified user needs;
are well explained and readily accessible;
are produced according to sound methods, and
are managed impartially and objectively in the public interest.
Once statistics have been designated as National Statistics it is a statutory requirement that the Code of Practice shall continue to be observed.