Embed Size (px)
Citation preview
Catching FireSpreading data journalism through the newsroom.
Emma Carew Grovum / @emmacarewDirector, Digital Content Development
Foreign Policy magazine
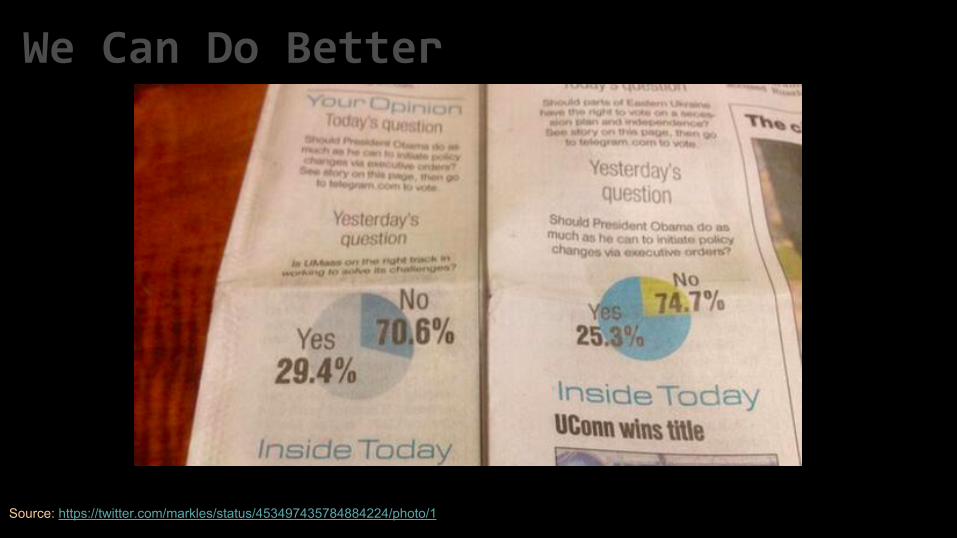
Source: https://twitter.com/markles/status/453497435784884224/photo/1
We Can Do Better
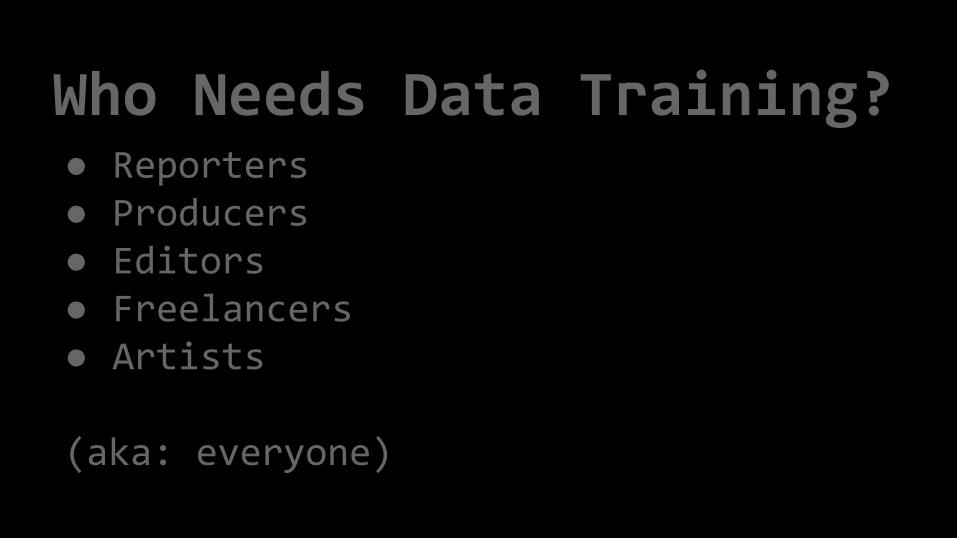
Who Needs Data Training?● Reporters● Producers● Editors● Freelancers● Artists
(aka: everyone)
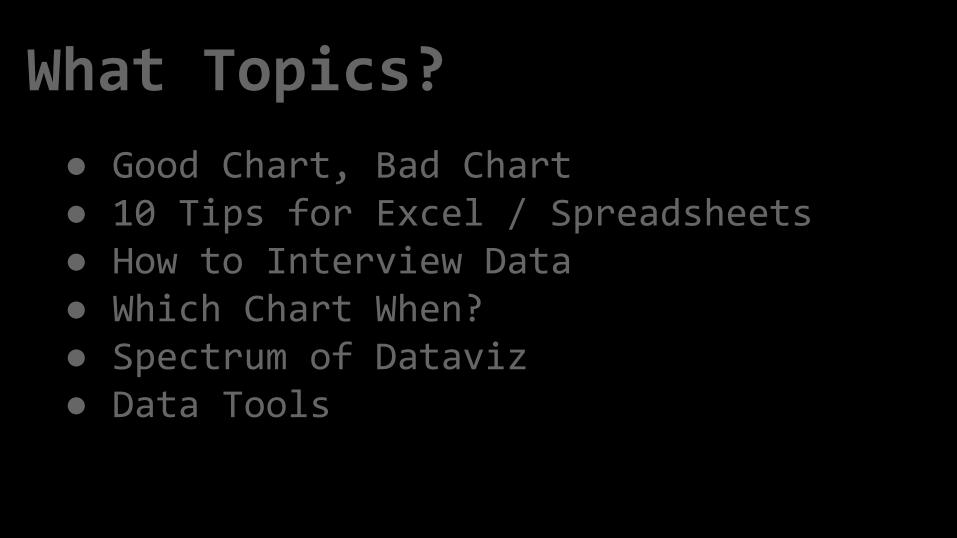
What Topics?
● Good Chart, Bad Chart● 10 Tips for Excel / Spreadsheets● How to Interview Data● Which Chart When?● Spectrum of Dataviz ● Data Tools

Bad Charts
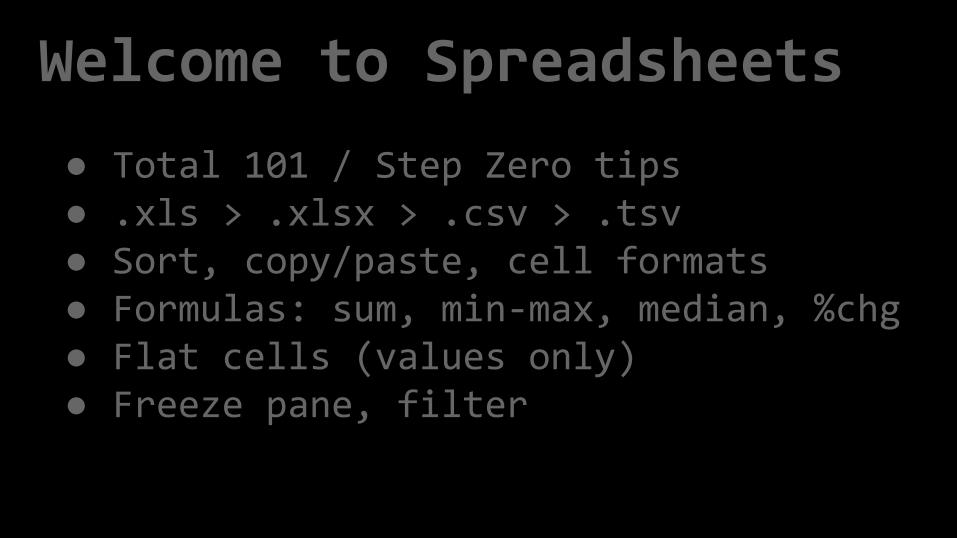
Welcome to Spreadsheets
● Total 101 / Step Zero tips● .xls > .xlsx > .csv > .tsv● Sort, copy/paste, cell formats● Formulas: sum, min-max, median, %chg● Flat cells (values only)● Freeze pane, filter
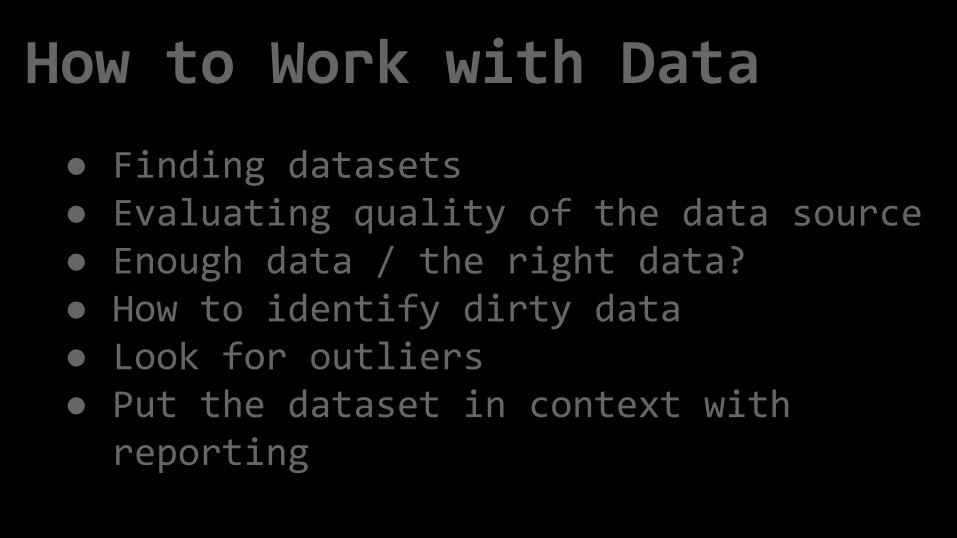
How to Work with Data
● Finding datasets● Evaluating quality of the data source● Enough data / the right data?● How to identify dirty data● Look for outliers● Put the dataset in context with
reporting
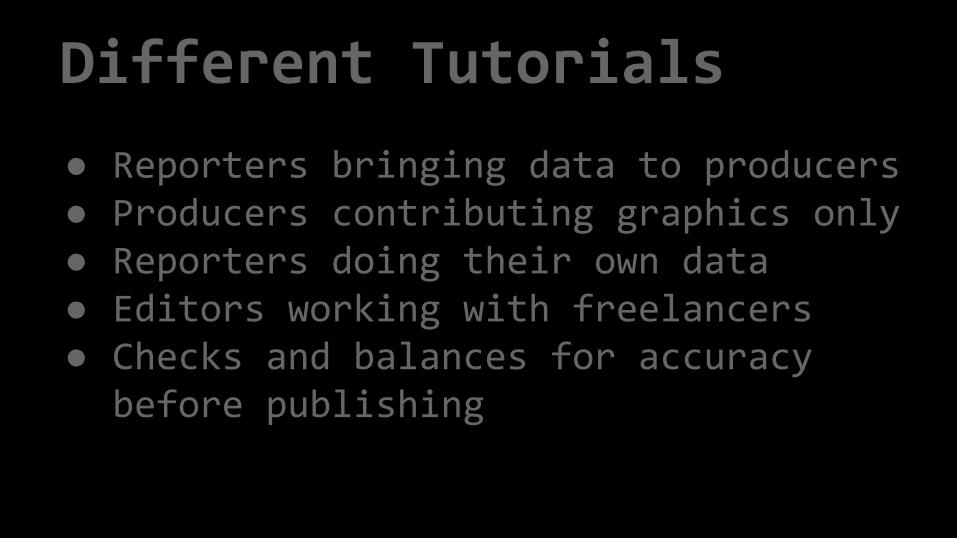
Different Tutorials
● Reporters bringing data to producers● Producers contributing graphics only● Reporters doing their own data● Editors working with freelancers● Checks and balances for accuracy
before publishing
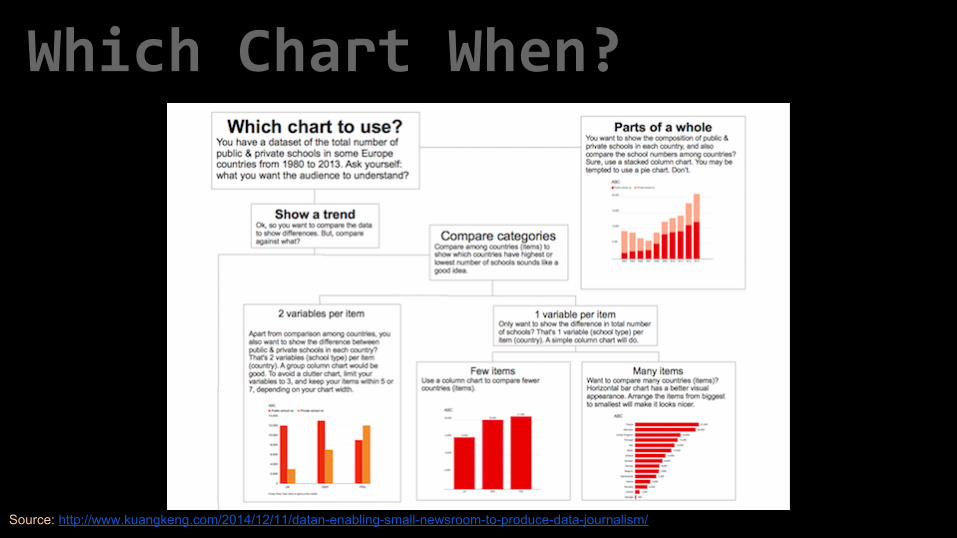
Which Chart When?
Source: http://www.kuangkeng.com/2014/12/11/datan-enabling-small-newsroom-to-produce-data-journalism/
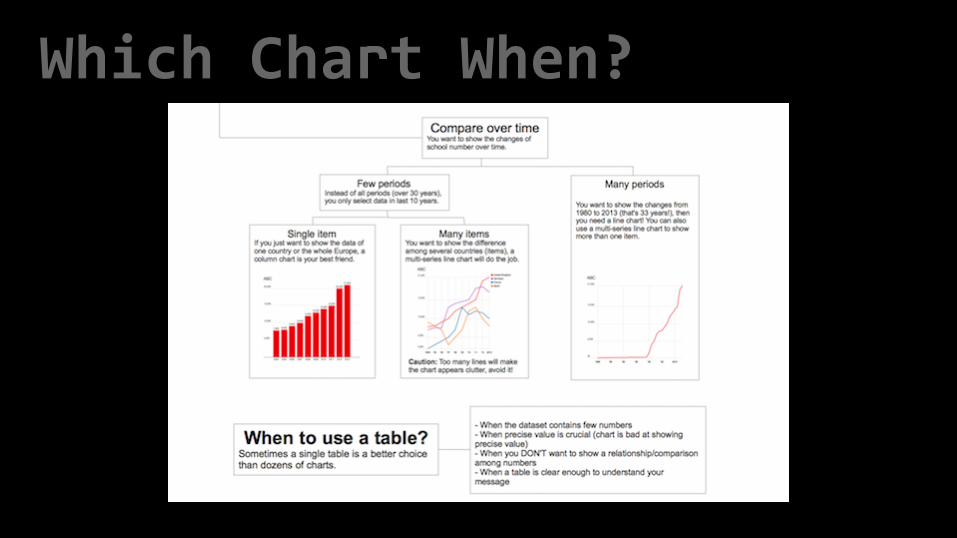
Which Chart When?
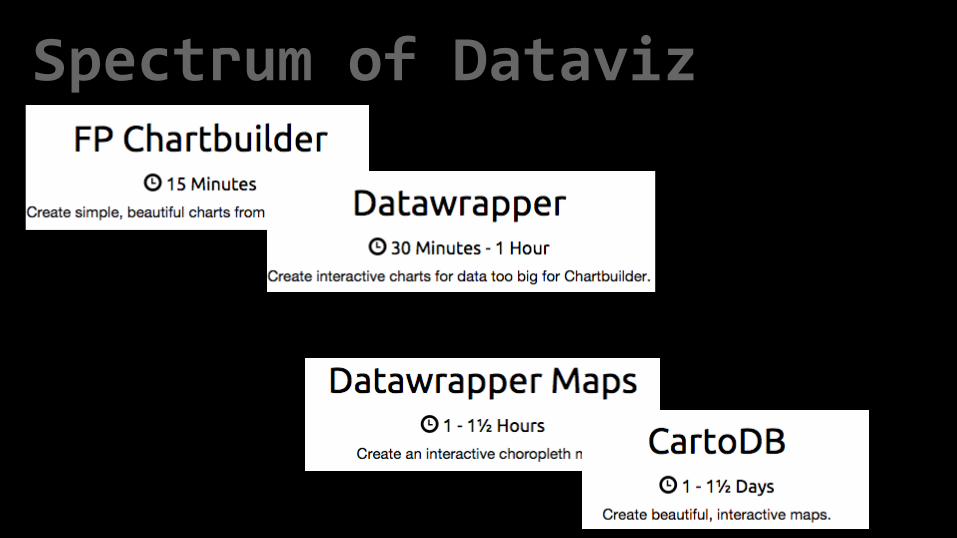
Spectrum of Dataviz
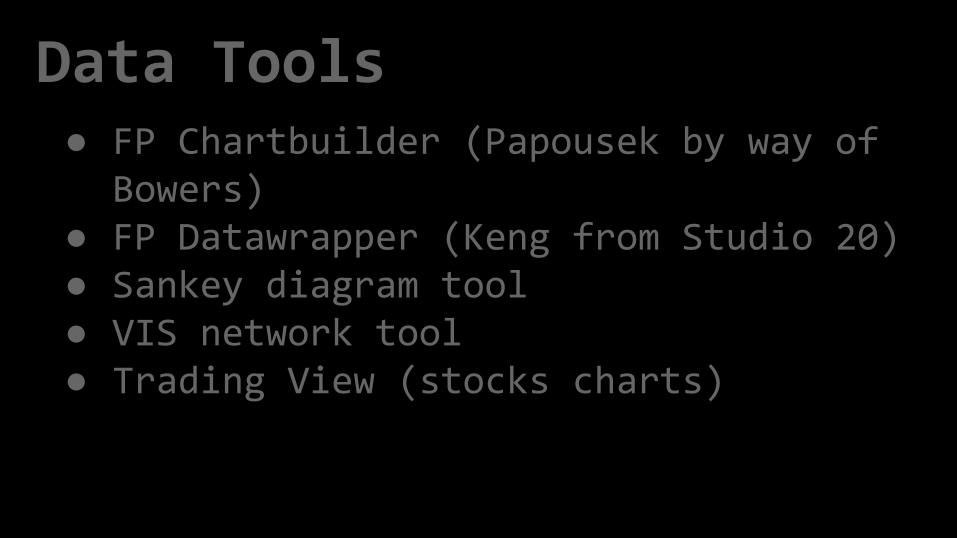
Data Tools● FP Chartbuilder (Papousek by way of
Bowers)● FP Datawrapper (Keng from Studio 20)● Sankey diagram tool● VIS network tool ● Trading View (stocks charts)
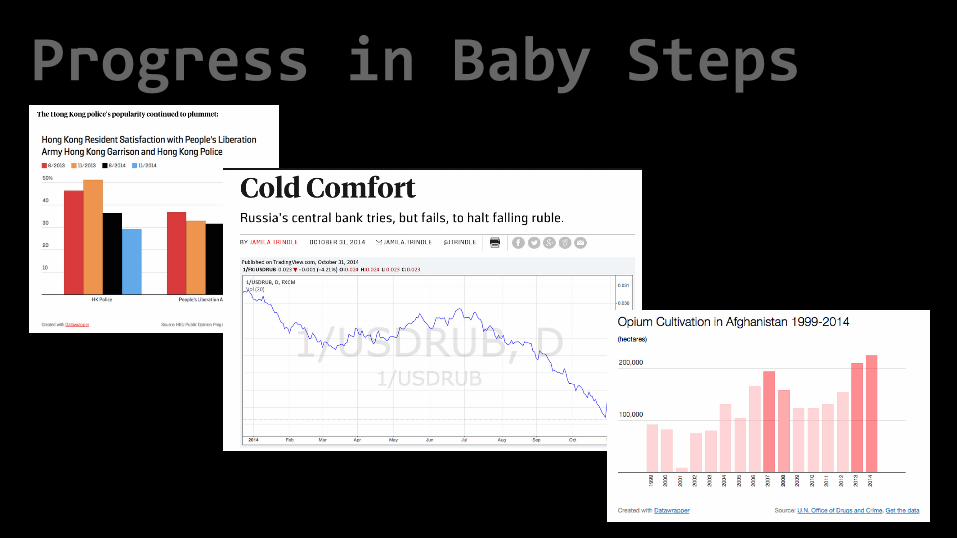
Progress in Baby Steps
Additional Resourceshttp://lenagroeger.s3.amazonaws.com/talks/nicar-2015/timelines-nicar/tmelines.html● Keng’s Studio 20 summary ● Steve Doig’s math tipsheet● Mary Jo Webster’s “Data State of Mind”● Steve Buttry’s tips for editors● Michelle Minkoff on drilling into data● ProPublica’s Guide to Bulletproofing