Embed Size (px)
Citation preview
CC 2009 www.forex4noobs.com Page 2
SOME RIGHTS RESERVED. This work is licensed under the Creative Commons Attribution-
Noncommercial-Share Alike 3.0 Unported License. To view a copy of this license, visit
http://creativecommons.org/licenses/by-nc-sa/3.0/ or send a letter to Creative Commons,
171 Second Street, Suite 300, San Francisco, California, 94105, USA.
Share Feel free to republish excerpts from this e-Book as long as you link back to:
http://www.forex4noobs.com/
And it’s also okay to share this e-Book in its entirety with anyone you think might be interested.
Disclaimer Forex trading has large potential rewards, but also large potential risk. You must be aware of the
risks and be willing to accept them in order to invest in the Forex market. Do not trade with money
you cannot afford to lose. No representation is being made that any account will or is likely to
achieve profits or losses similar to those discussed in this book. The past performance of any trading
system or methodology is not necessarily indicative of future results.
NOT FOR SALE This e-Book is not currently for sale nor will/has it ever been for sale. This e-Book is completely free,
if anybody has sold this book to you please email me at [email protected].
CC 2009 www.forex4noobs.com Page 3
Contents
Chapter 1 - About Me & Forex4Noobs
Chapter 2 - About My Method
Chapter 3 - The Basics
Chapter 4 - Candlestick Analysis & Reading Price Action
Chapter 5 - Constant Lines
Chapter 6 - Support & Resistance Zones
Chapter 7 - Scalp Lines
Chapter 8 - Targets & Stops
Chapter 9 - Monitoring Trades on The 15 Min Chart
Chapter 10 - Know When to Stay Out
Chapter 11 - NickB Method Video Course
CC 2009 www.forex4noobs.com Page 4
Chapter 1: About Me
& Forex4Noobs

CC 2009 www.forex4noobs.com Page 5
About Me
How I Got Into ForexAt age 16, I joined a competition that my economics class was having. It was called ‘the stock market
game’. The object of the game was basically to see how much money we could make from a starting
capital of $50,000 (obviously a demo account). We were given the $50,000 demo account and told
to trade. The grand prize was, as far as I can remember, $2,000 and I wanted to win. I wanted that
money. It was more than just a monetary goal to me though. I thought if I could win then I would
have found something that would steer me away from working a 9 to 5 job.
I hit the books and began studying the stock market; what it was, how it worked and everything. By
the day before the competition begun I knew a lot about the stock market. However, I didn’t know
how to actually trade. A lot of what I read talked about patience. So when the competition begun
everybody involved had taken a trade within the first hour, not me though. I bided my time, waited
until the next day to pick up a copy of the financial newspaper. I scanned it for any information and I
found it. I started taking trade after trade almost all of them winners. I shot out ahead of everybody
in my economics class. By the end of the competition I had close to $90,000 hypothetical dollars.
I sat at the school assembly listening to the mindless supposedly confidence boosting speeches our
teachers gave. I was interested in only one thing that day, ‘did I win the competition?’ Finally my
torture was put to an end. My economics teacher who was a staunch, semi bald man walked up to
the podium. In his hand he held clenched a single piece of paper. As he begun to talk, I could hear
the disappointment in his voice. See my teacher hated me. I always challenged his teachings in
economics never agreeing with any of the textbook generic stuff he taught. I could tell it took away a
large piece of his self esteem to utter out my name as winner of the stock market game. I was
ecstatic. I was 16 years old and $2,000 was a fortune to me. I was also ecstatic because I won and I
finally found a job I wanted to do.
I traded stocks for a few years and did very well. I got sucked into Forex the same way most of you
probably did. One day I was browsing the internet and saw an advertisement for a free demo
account. I tried out the demo and loved it. From then on I was hooked.
Connect With Me
Blog

CC 2009 www.forex4noobs.com Page 6
About Forex4Noobs
How Forex4Noobs StartedTrading can be a pretty boring job. The long periods of waiting in-between trades leaves you with
hours of free time. I used to fill most of my time up with computer games and watching TV.
Then at some point, I realized that I was watching TV or playing games for 12 hours (minimum) per
day. With the exception of the odd work out break and trades, I was squandering all my time. I mean
12 hours a day wasted, it’s crazy! If I do that day in day out for the rest of my life that equals 50% of
my life squandered away without having done anything constructive!
Well those stats scared me so I started looking for things to do. I did not want to look back on my life
and think “I had fun, I played video games” that would not be a life worth living.
I was always a bit of a nerd in school and I always I had an interest in coding websites. The idea of
building a site that thousands of people would see day in day out always appealed to me.
To cut a long story short, a few months of dabbling around with coding and site design I came up
with Forex4Noobs.com. It was ugly, not very user-friendly and slow loading but people loved the
content. Over the past 2 years as my coding skills improved so has the site (immensely).
I released the first NickB Method e-Book back in 2007 and it got popular very fast. It made
Forex4Noobs a huge site visited by thousands of traders daily. In 2008 I released the second version.
Now in 2009 I am releasing the third version. It has been well over a year and a half since the last
version of the NickB method e-Book so hopefully this lives up to the anticipation.
Check Out Forex4NoobsIf you like the method in this e-Book then you have to check out Forex4Noobs. It would take me a
very long time to list all the sites features so I will just give you a quick overview instead:
Forex Education: Education is vital to your success as a trader. Forex4Noobs has a cool, funny and
free education section.
Forex Plus Section: Tools, Systems, Free webinars, live trade videos and much more! The Forex Plus
section is where all the coolest stuff goes.
Forex Chatroom: Easily the best Forex chatroom on the net! With a white board, screen casting and
60+ traders sharing ideas and trading 24hrs a day!
Live Forex Trade Videos: Watch recorded trading videos of me entering trades and making pips. This
is as exciting as Forex education gets! Forget about all the self proclaimed trading gurus who talk the
talk. See a professional trader prove himself by showing you how he makes pips live. No other site
does this.
That’s just a taste. There is heaps more to discover on Forex4Noobs so check it out.

CC 2009 www.forex4noobs.com Page 7
Chapter 2: About My Method
CC 2009 www.forex4noobs.com Page 8
About The NickB Method
In the world of Forex trading most traders are continuously searching for the holy grail of systems
that will make them a millionaire in a week. Like the search for the Fountain of Youth that system
has never been found. Here is a hint why; IT DOESN'T EXIST!
Searching through forums like a crazy person looking for the magic combination of indicators is the
short road to failure. If you are reading this e-Book looking for a system to make you an instant
millionaire then hit that little red ‘X’ right now. If you are reading this eBook looking for a method of
trading that will make you a successful, consistently profitable trader then keep reading. Trading is
not a get rich quick scheme; it takes hard work and dedication.
My method is not a system, I do not use any indicators, and there are hardly any set-in-stone rules.
My method is based on candle patterns and support and resistance lines. These are not to be
confused with pivot points or Fibonacci lines. The best thing about my trading method is you are not
tied down to one specific style. You can implement certain aspects of it, and add others, to tailor
make your own trading style.
I know that not using indicators sounds crazy, but I have been doing it for 4 years and I am still
around. It is up to you to make the choice. Are you going to embark on the futile search for the Holy
Grail trading system? Or are you going to learn how to really trade?
Keeping it SimpleThe foundation of my method is to keep things simple. I am against over complicating trading. In my
opinion, the simpler your method is, the more effective you will be. Making something extremely
complicated is only going to waste time and add stress. That is why I try to keep my trading as simple
as possible. Over complicating something that works very well is counterproductive. All I need are a
few lines on my chart and I can make 100+ pips per week with ease.
Some methods you see are just a mess of indicators; so many that you can barely see the candles.
This is not the way to trade. If you can be consistently profitable keeping it simple, with just a few
lines, then that is obviously the better option. So as you read on, and find out that my method is just
a few simple lines, do not run away. These simple lines have been making me a lot of money
consistently for 4 years. That is more than can be said for 99% of the trading methods out there.
Simplicity is a good thing, not a bad thing.
AdaptabilityAnother foundation of my method is adaptability.
A system is limited in that it gives you a very constrained method of trading. You have rules that are
set in stone, and they do not change when the market changes. Thus, a system works amazingly well
some months during the year, and fails miserably other months.
I do not have a system. I have a method based on the analysis of candle patterns and support and
resistance lines. The most important thing about my method is that it adapts to changing markets. A
huge part of my trading is analyzing current market conditions and trading accordingly. This may
sound hard, but when you learn the basics it becomes second nature. One look at your charts and
you will know that you need to tweak the way you traded last week to suit the market this week.
CC 2009 www.forex4noobs.com Page 9
Candles are perfect because in any market condition they still perform the same task, they show you
price action. Support and resistance lines are basically just showing us where the price action is
stalling and where the market is shifting direction.
Anyway, what I am getting at is that I do not have a system. I can't simply say, “You put lines here
and enter on crosses”, or, “You target 100 pips every time.”
I do not have a system that can be summed up in a few paragraphs. The method gathers together a
hundred different aspects to form an extremely effective and adaptable style of trading. It is
something that will take you time to learn.
Scouring forums for Holy Grail systems is not your answer. Like I said, systems are limited to the
market conditions that spawned them. Systems do not adapt to changing market conditions. There
is a tool however that allows traders to adapt to changing market conditions.
Can anybody guess what it is? It is your brain!
Those new to Forex trading, who have spent time on multiple forex websites, expect me to have
some kind of generic, crappy, enter-when-this-crosses-that system. The reason they expect that is
because that is usually what is offered. This is not what I am offering you. I expect you to be an
active participant in trading; using your mind, and making good trading decisions.
My system involves the use of your brain (every trader has one), and that is why after 4 years, my
method is still profitable.

CC 2009 www.forex4noobs.com Page 10
Chapter 3: The Basics
CC 2009 www.forex4noobs.com Page 11
The Basics
What You NeedPairs: You can use any pair you want but my main three are GBP/JPY, EUR/JPY and GBP/USD. The
method is tested mainly on these three pairs. So before you trade another pair you need to do some
testing.
Time frame: 4 hour charts for all of your analysis. The 15 min chart can be used to manage open
trades (if you want to).
Indicators: None! That’s the best thing about this method... no indicators!
What broker Do You use?This is one of the most common questions I am asked. I use and highly recommend GFT Forex. They
are by far my favourite broker and as far as I am concerned nobody else comes close. All the chart
screenshots in this e-Book are from Dealbook360 which is GFT’s trading platform.
If you want to sign-up for a demo with GFT please click here. When you visit that link you can put
your details on the form to the right to get a demo account. Oh, and in case you’re wondering that
link is not an affiliate link but it is a tracking link. The link allows GFT to track how many visitors it
gets from Forex4Noobs.
Types of AnalysisAs I said above I do not use any indicators. The problem with indicators is they lag. So I use price
action analysis instead. Price action doesn’t lag because price action is just the current movement of
price. So I trade primarily by analyzing the current movement of price. To analyze this I use three
main types of analysis:
1. Candlestick analysis (Reading price action)
2. Support and resistance lines
Candlestick Analysis This is definitely the most important part of my trading method. Using candlesticks to read live price
action is amazingly beneficial. It is a skill that would benefit any trader using any method. Basically
1. Decide if and when to enter a trade.
2. Decide when to exit a trade early or when to stay in a trade.
3. Maximize profits and minimize losses.
4. Spot bad set ups before entering.
Unfortunately, candlestick analysis is something that I cannot fully teach in this e-Book. It would take
me hundreds of pages or hours of video to cover it all. However, I can go over the basic concepts so
you have an idea of what to look for. The rest you need to learn from experience.... like I did!
Let’s take a bit of a close look at these forms of analysis.
what I do is use candlestick patterns, formations and recent price movements to:

CC 2009 www.forex4noobs.com Page 12
Support and Resistance Lines Support and resistance lines (S+R lines) are used as triggers for my trades. They are basically areas in
which the price has historically had trouble breaking through. I want to make a few things clear
about S+R lines before we go any further.
They’re not the same as Pivot points or Fibonacci lines. They’re completely different and are placed
on a chart manually.
There is no magical S+R line placing indicator for MT4 or any trading platform. Sorry but placing
them is a skill you will have to learn yourself.
We will tackle S+R lines in depth later in this e-Book.

CC 2009 www.forex4noobs.com Page 13
Chapter 4: Candlestick Analysis
& Reading Price Action
CC 2009 www.forex4noobs.com Page 14
Candlestick Analysis Intro
In Forex you hear a whole lot of talk about candle patterns. Traders are usually told candles such as
doji's, hammers and shooting stars indicate a pending reversal. Even though this sort of thinking can
be profitable it is a very narrow viewed approach to candlesticks in trading. Candlesticks are much
more than just patterns. They allow us to very accurately read price action and tell us things such as
how to:
Spot reversals in a trend and profit from the reversal.
Spot continuations and know when to stay in a trade.
Spot signs that a trade may not be going your way and close it.
The important thing to understand is that candlestick analysis is not just about pattern recognition.
So forget what you know about candle patterns these are not candle patterns. This is candlestick
analysis.
The Basics of Candlestick Analysis
What’s Candlestick Analysis?The overriding goal of candlestick analysis (from here on out referred to as CA) is to allow you to
figure out who is in control of the market.
1. Once you figure out who has control of the market it allows you to:
2. Place trades with more confidence.
3. Monitor open trades and close them out early or leave them open beyond your targets.
4. Pull more pips out of the market.
5. Trade reversal trades.
The possibilities are endless. Knowing CA back to front is an essential part of the NickB method and
it is also an essential part of any trading method.
In my method, you use candles mainly to figure out who has control (the bulls or the bears). You also
use candles to spot possible reversal points in trends and jump into reversal trades. Figuring out who
has control is really straight forward but let’s look at how to do it anyway.
The BasicsI am going to start with the bare basics. This is stuff you probably already know but read through it
anyway because it all ties in with the more advanced stuff.
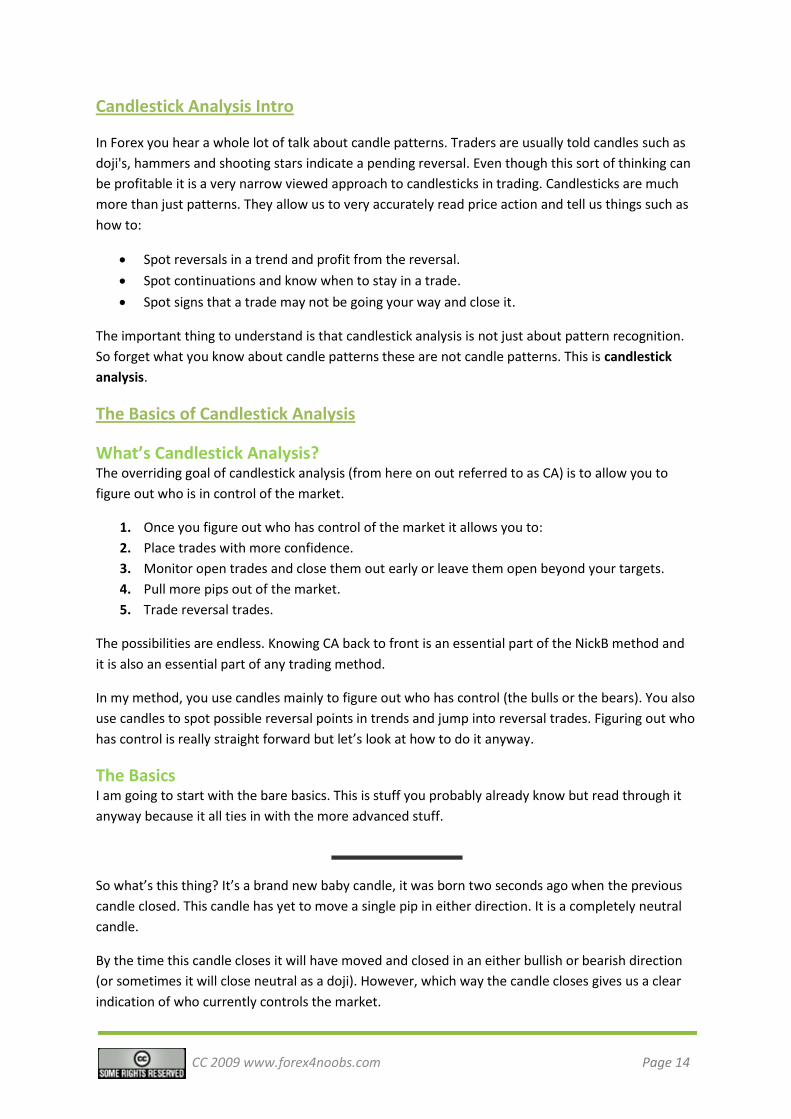
So what’s this thing? It’s a brand new baby candle, it was born two seconds ago when the previous
candle closed. This candle has yet to move a single pip in either direction. It is a completely neutral
candle.
By the time this candle closes it will have moved and closed in an either bullish or bearish direction
(or sometimes it will close neutral as a doji). However, which way the candle closes gives us a clear
indication of who currently controls the market.
CC 2009 www.forex4noobs.com Page 15
This is because we always have two opposing forces. The bulls and the bears. The bulls are always
trying to push the price up and the bears are always trying to push the price down.
So if the baby candle above pushes up and closes higher than open it becomes a bullish candle and
indicates to us that the bulls control the market currently. If it pushes the price down and closes
lower than open it indicates that the bears are in control. So for that particular period in which the
candle is open, depending on how it closes, we know who has control of the market.
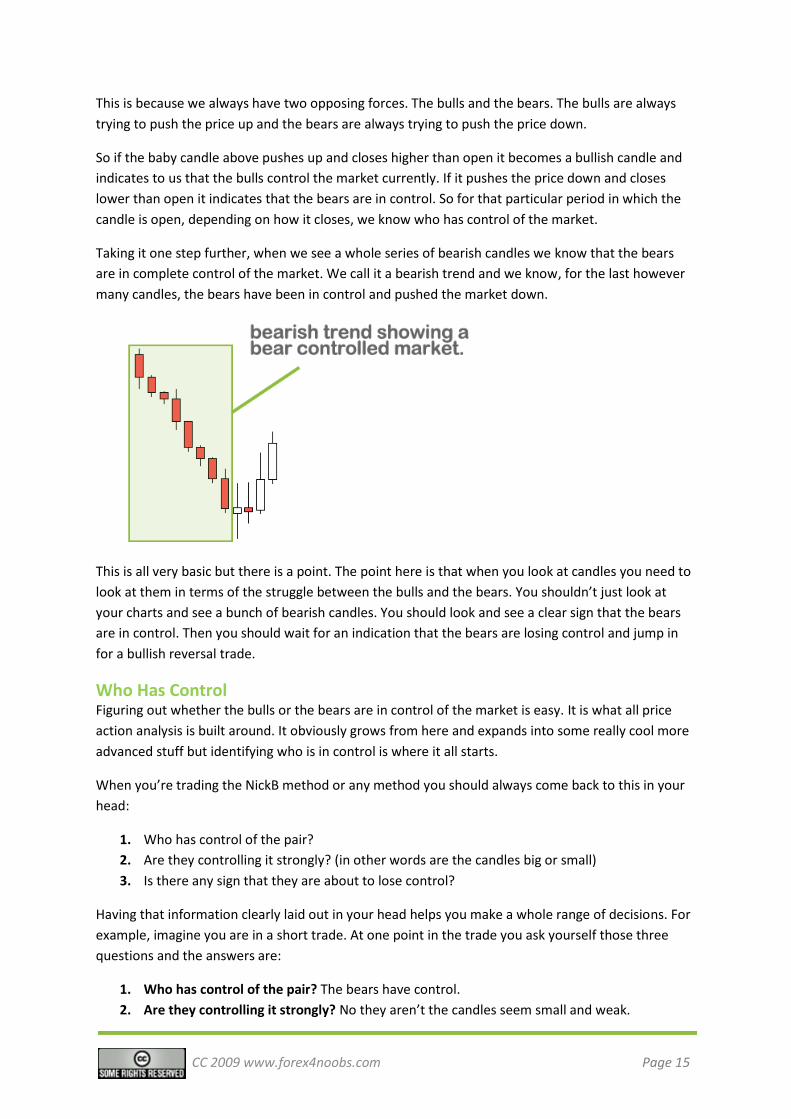
Taking it one step further, when we see a whole series of bearish candles we know that the bears
are in complete control of the market. We call it a bearish trend and we know, for the last however
many candles, the bears have been in control and pushed the market down.
This is all very basic but there is a point. The point here is that when you look at candles you need to
look at them in terms of the struggle between the bulls and the bears. You shouldn’t just look at
your charts and see a bunch of bearish candles. You should look and see a clear sign that the bears
are in control. Then you should wait for an indication that the bears are losing control and jump in
for a bullish reversal trade.
Who Has ControlFiguring out whether the bulls or the bears are in control of the market is easy. It is what all price
action analysis is built around. It obviously grows from here and expands into some really cool more
advanced stuff but identifying who is in control is where it all starts.
When you’re trading the NickB method or any method you should always come back to this in your
head:
1. Who has control of the pair?
2. Are they controlling it strongly? (in other words are the candles big or small)
3. Is there any sign that they are about to lose control?
Having that information clearly laid out in your head helps you make a whole range of decisions. For
example, imagine you are in a short trade. At one point in the trade you ask yourself those three
questions and the answers are:
1. Who has control of the pair? The bears have control.
2. Are they controlling it strongly? No they aren’t the candles seem small and weak.
CC 2009 www.forex4noobs.com Page 16
3. Is there any sign that they are about to lose control? There is an indecision (reversal) candle
forming.
Well if those are your answers then it’s probably time you consider exiting your trade. If the bears
are moving weakly and a reversal candle is forming your short may not survive much longer.
In the next few pages, I will go over some of the more advanced price action analysis techniques.
Always remember though, when in doubt you should always come back to asking yourself ‘who is in
control of the market’?
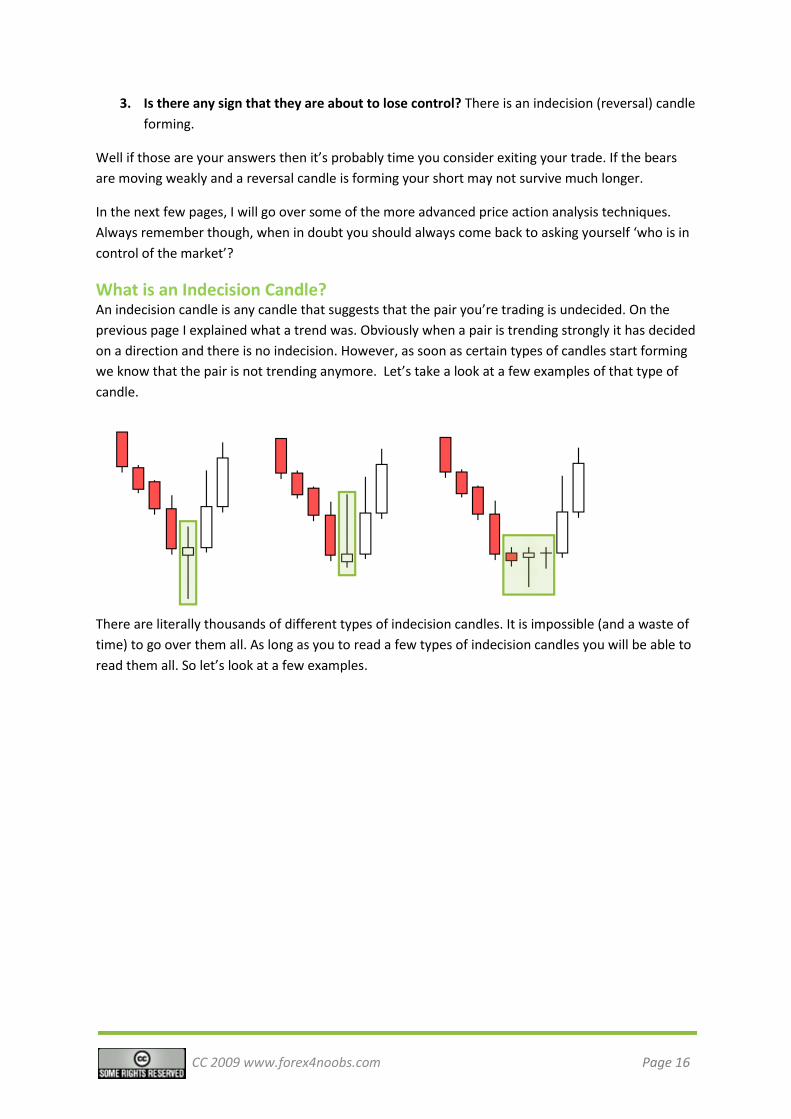
What is an Indecision Candle?An indecision candle is any candle that suggests that the pair you’re trading is undecided. On the
previous page I explained what a trend was. Obviously when a pair is trending strongly it has decided
on a direction and there is no indecision. However, as soon as certain types of candles start forming
we know that the pair is not trending anymore. Let’s take a look at a few examples of that type of
candle.
There are literally thousands of different types of indecision candles. It is impossible (and a waste of
time) to go over them all. As long as you to read a few types of indecision candles you will be able to
read them all. So let’s look at a few examples.
CC 2009 www.forex4noobs.com Page 17
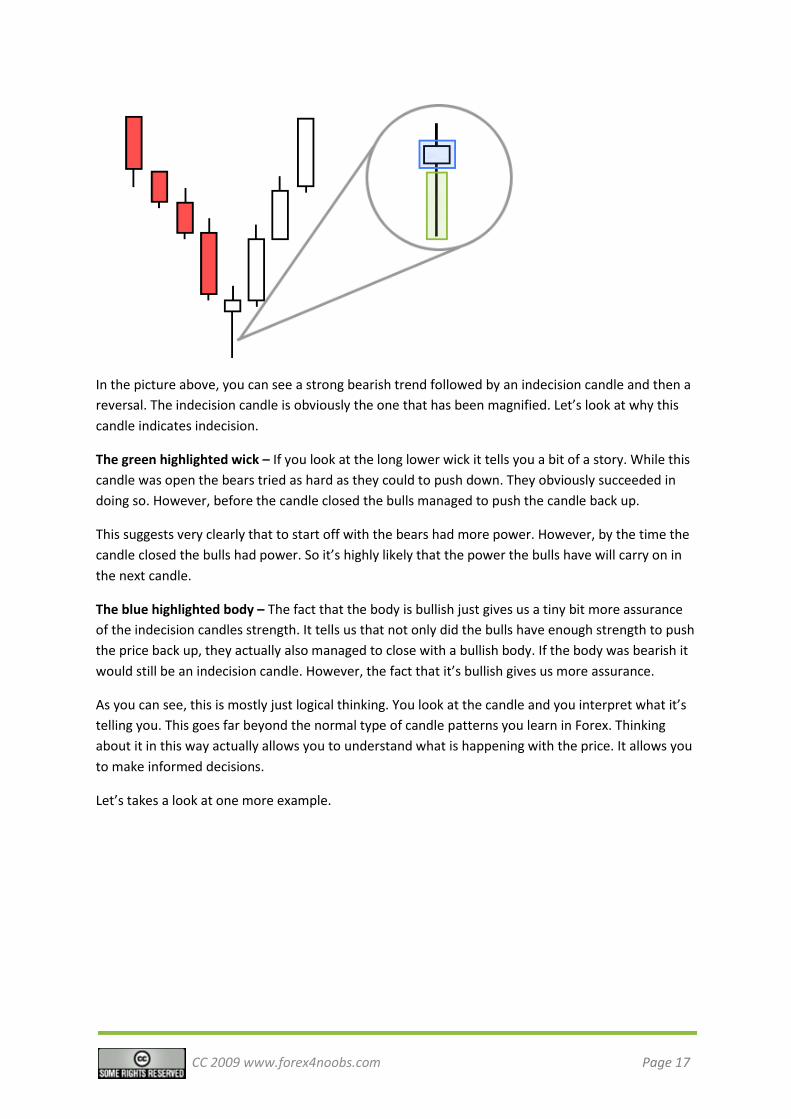
In the picture above, you can see a strong bearish trend followed by an indecision candle and then a
reversal. The indecision candle is obviously the one that has been magnified. Let’s look at why this
candle indicates indecision.
The green highlighted wick – If you look at the long lower wick it tells you a bit of a story. While this
candle was open the bears tried as hard as they could to push down. They obviously succeeded in
doing so. However, before the candle closed the bulls managed to push the candle back up.
This suggests very clearly that to start off with the bears had more power. However, by the time the
candle closed the bulls had power. So it’s highly likely that the power the bulls have will carry on in
the next candle.
The blue highlighted body – The fact that the body is bullish just gives us a tiny bit more assurance
of the indecision candles strength. It tells us that not only did the bulls have enough strength to push
the price back up, they actually also managed to close with a bullish body. If the body was bearish it
would still be an indecision candle. However, the fact that it’s bullish gives us more assurance.
As you can see, this is mostly just logical thinking. You look at the candle and you interpret what it’s
telling you. This goes far beyond the normal type of candle patterns you learn in Forex. Thinking
about it in this way actually allows you to understand what is happening with the price. It allows you
to make informed decisions.
Let’s takes a look at one more example.
CC 2009 www.forex4noobs.com Page 18
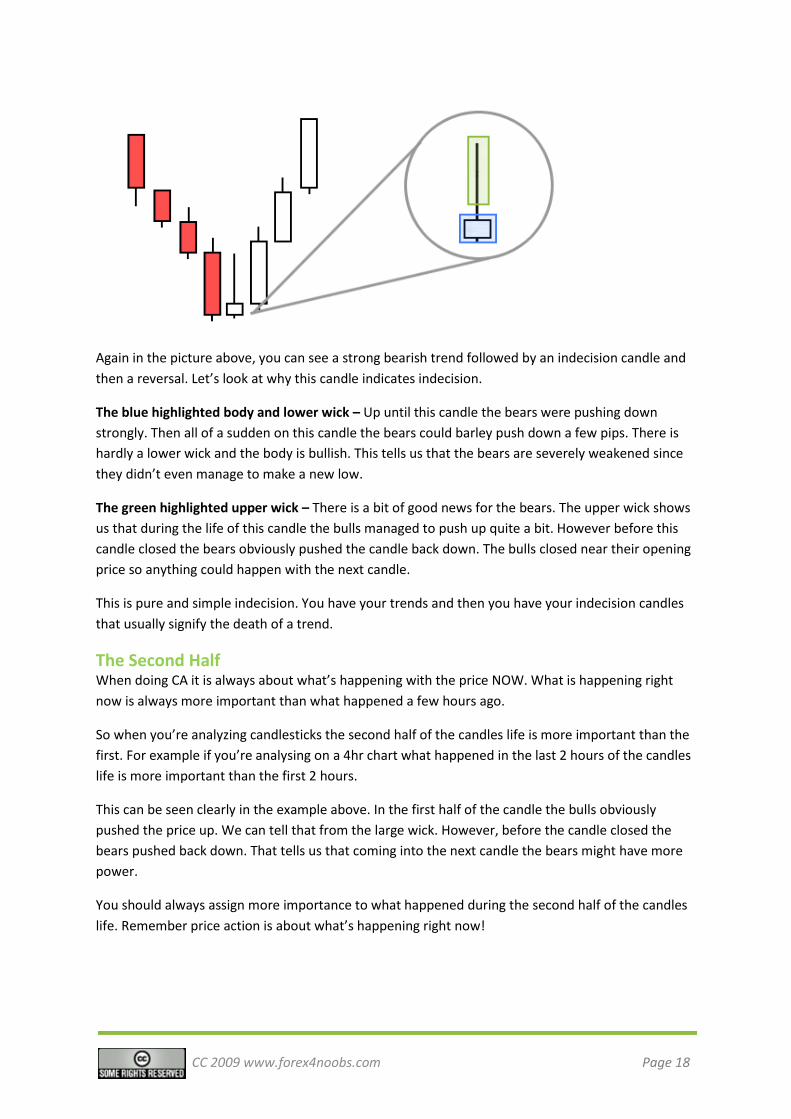
Again in the picture above, you can see a strong bearish trend followed by an indecision candle and
then a reversal. Let’s look at why this candle indicates indecision.
The blue highlighted body and lower wick – Up until this candle the bears were pushing down
strongly. Then all of a sudden on this candle the bears could barley push down a few pips. There is
hardly a lower wick and the body is bullish. This tells us that the bears are severely weakened since
they didn’t even manage to make a new low.
The green highlighted upper wick – There is a bit of good news for the bears. The upper wick shows
us that during the life of this candle the bulls managed to push up quite a bit. However before this
candle closed the bears obviously pushed the candle back down. The bulls closed near their opening
price so anything could happen with the next candle.
This is pure and simple indecision. You have your trends and then you have your indecision candles
that usually signify the death of a trend.
The Second HalfWhen doing CA it is always about what’s happening with the price NOW. What is happening right
now is always more important than what happened a few hours ago.
So when you’re analyzing candlesticks the second half of the candles life is more important than the
first. For example if you’re analysing on a 4hr chart what happened in the last 2 hours of the candles
life is more important than the first 2 hours.
This can be seen clearly in the example above. In the first half of the candle the bulls obviously
pushed the price up. We can tell that from the large wick. However, before the candle closed the
bears pushed back down. That tells us that coming into the next candle the bears might have more
power.
You should always assign more importance to what happened during the second half of the candles
life. Remember price action is about what’s happening right now!
CC 2009 www.forex4noobs.com Page 19
Using Candlestick Analysis
So far you’ve learnt:
1. How to tell who is in control of the market and why it’s important to know.
2. How and why indecision candles form.
3. What indecision candles mean.
It may not seem like it but those few skills give you a huge advantage in your trading. The more you
practice CA the more you will come to learn it. And eventually you will gain the ability to read the
market like a very predictable book. CA allows you to see what will likely happen next. This is
obviously a huge advantage when you’re trading.
What you learned above also helps a lot when monitoring open trades (I discuss this in detail later).
The main use of CA is obviously reversal trades. So let’s take a look at those.
Reversal Trades
Long Wicked Patterns (LWP’s)An indecision candle indicates a possible reversal when it forms during a strong trend.
In one way or another I use all types of indecision candles in my analysis. However, when it comes to
trading reversals I limit myself to the strongest types. Long wicked patterns are, in my opinion, the
strongest type of reversal pattern. These are LWP’s.
LWP’s are not simply doji’s, hammers, or shooting stars. LWP’s are the combination of several
different factors that make for a very strong reversal sign. Let’s dissect the two most important parts
of a LWP.
1. The Preceding Trend.
2. The Indecision Candle.
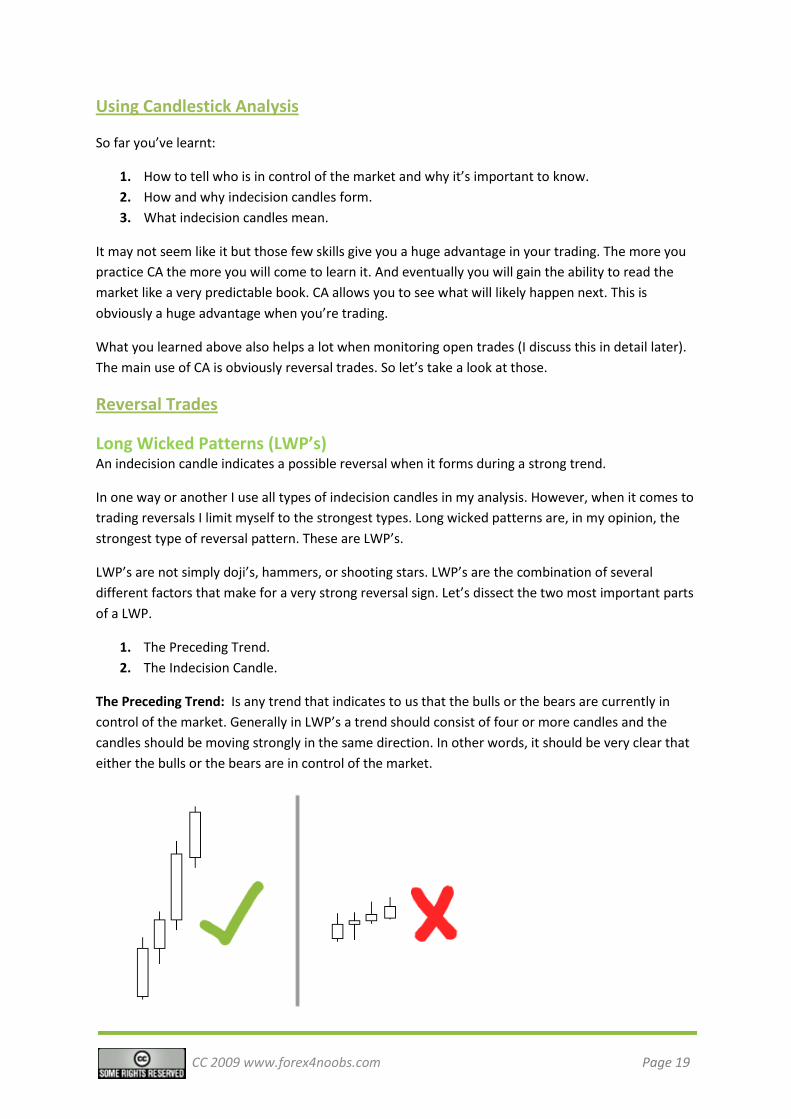
The Preceding Trend: Is any trend that indicates to us that the bulls or the bears are currently in
control of the market. Generally in LWP’s a trend should consist of four or more candles and the
candles should be moving strongly in the same direction. In other words, it should be very clear that
either the bulls or the bears are in control of the market.
CC 2009 www.forex4noobs.com Page 20
If you look at the picture above you can see that both have four bullish candles. However, only the
one with the tick is what I would call a trend. The one with the cross doesn’t indicate to us that the
bulls are in control of the market. The candles are too small and weak. In a preceding trend the
market has to have a clear direction. Big strong candles indicate a clear direction. Small weak candles
don’t.
The preceding trend is the most important part of a reversal trade. If there is no preceding trend
there is no reversal trade. Identifying a preceding trend is not hard, but it is also not a science. I can’t
tell you “a trend is exactly 100 pips,” because a trend is dependent on current market conditions
and, obviously, the pair you are trading. I know it is a little hard when you do not have an exact rule
to follow, but with just a little practice you will be able to spot trends with ease.
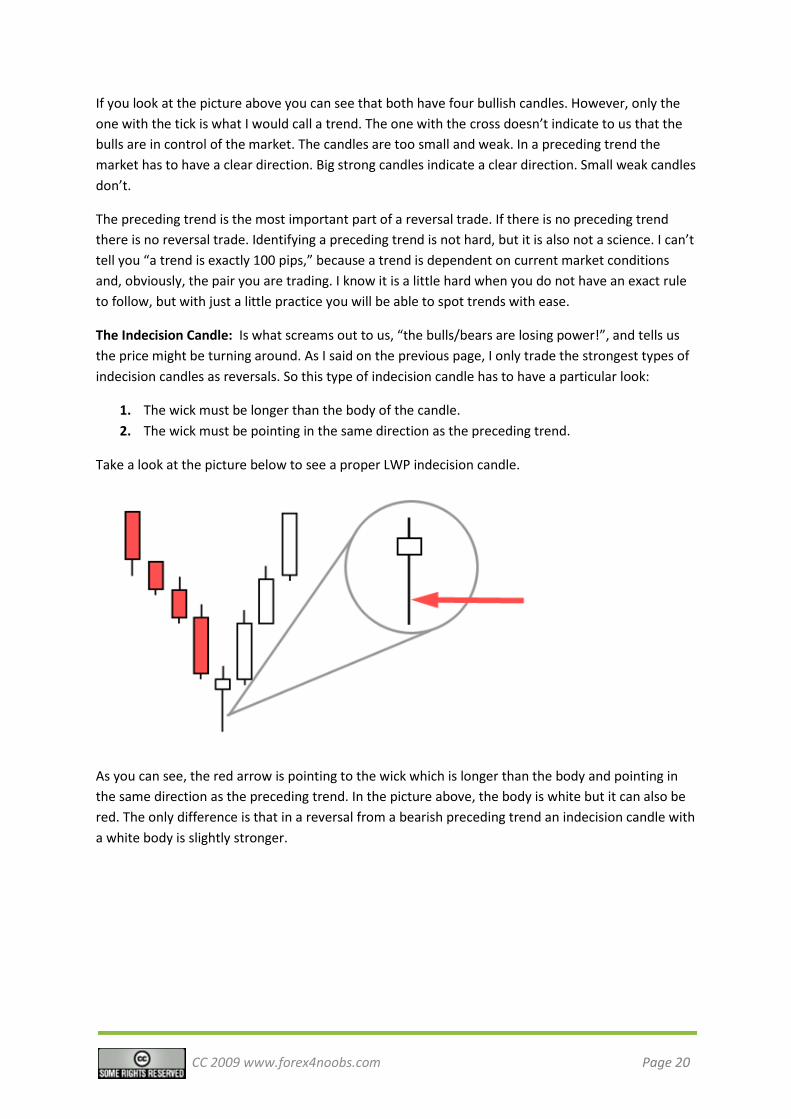
The Indecision Candle: Is what screams out to us, “the bulls/bears are losing power!”, and tells us
the price might be turning around. As I said on the previous page, I only trade the strongest types of
indecision candles as reversals. So this type of indecision candle has to have a particular look:
1. The wick must be longer than the body of the candle.
2. The wick must be pointing in the same direction as the preceding trend.
Take a look at the picture below to see a proper LWP indecision candle.
As you can see, the red arrow is pointing to the wick which is longer than the body and pointing in
the same direction as the preceding trend. In the picture above, the body is white but it can also be
red. The only difference is that in a reversal from a bearish preceding trend an indecision candle with
a white body is slightly stronger.
CC 2009 www.forex4noobs.com Page 21
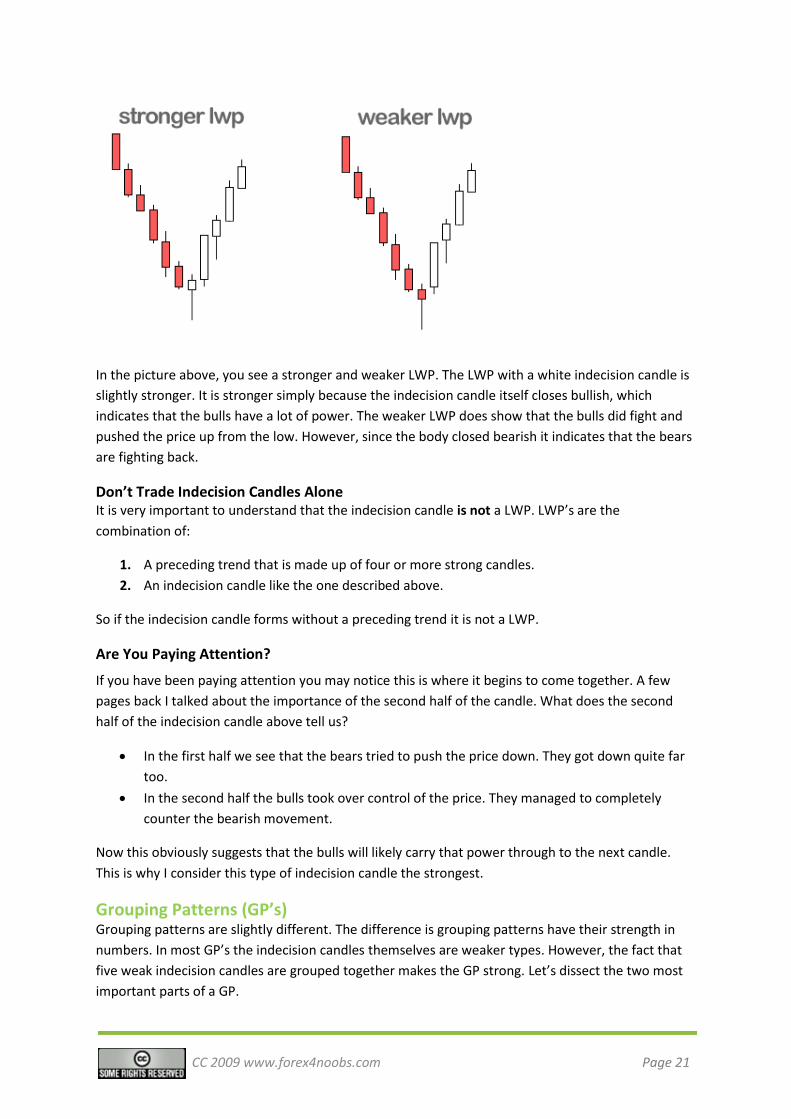
In the picture above, you see a stronger and weaker LWP. The LWP with a white indecision candle is
slightly stronger. It is stronger simply because the indecision candle itself closes bullish, which
indicates that the bulls have a lot of power. The weaker LWP does show that the bulls did fight and
pushed the price up from the low. However, since the body closed bearish it indicates that the bears
are fighting back.
Don’t Trade Indecision Candles Alone It is very important to understand that the indecision candle is not a LWP. LWP’s are the
combination of:
1. A preceding trend that is made up of four or more strong candles.
2. An indecision candle like the one described above.
So if the indecision candle forms without a preceding trend it is not a LWP.
Are You Paying Attention?
If you have been paying attention you may notice this is where it begins to come together. A few
pages back I talked about the importance of the second half of the candle. What does the second
half of the indecision candle above tell us?
In the first half we see that the bears tried to push the price down. They got down quite far
too.
In the second half the bulls took over control of the price. They managed to completely
counter the bearish movement.
Now this obviously suggests that the bulls will likely carry that power through to the next candle.
This is why I consider this type of indecision candle the strongest.
Grouping Patterns (GP’s)Grouping patterns are slightly different. The difference is grouping patterns have their strength in
numbers. In most GP’s the indecision candles themselves are weaker types. However, the fact that
five weak indecision candles are grouped together makes the GP strong. Let’s dissect the two most
important parts of a GP.
CC 2009 www.forex4noobs.com Page 22
1. The Preceding Trend.
2. The Indecision Candles.
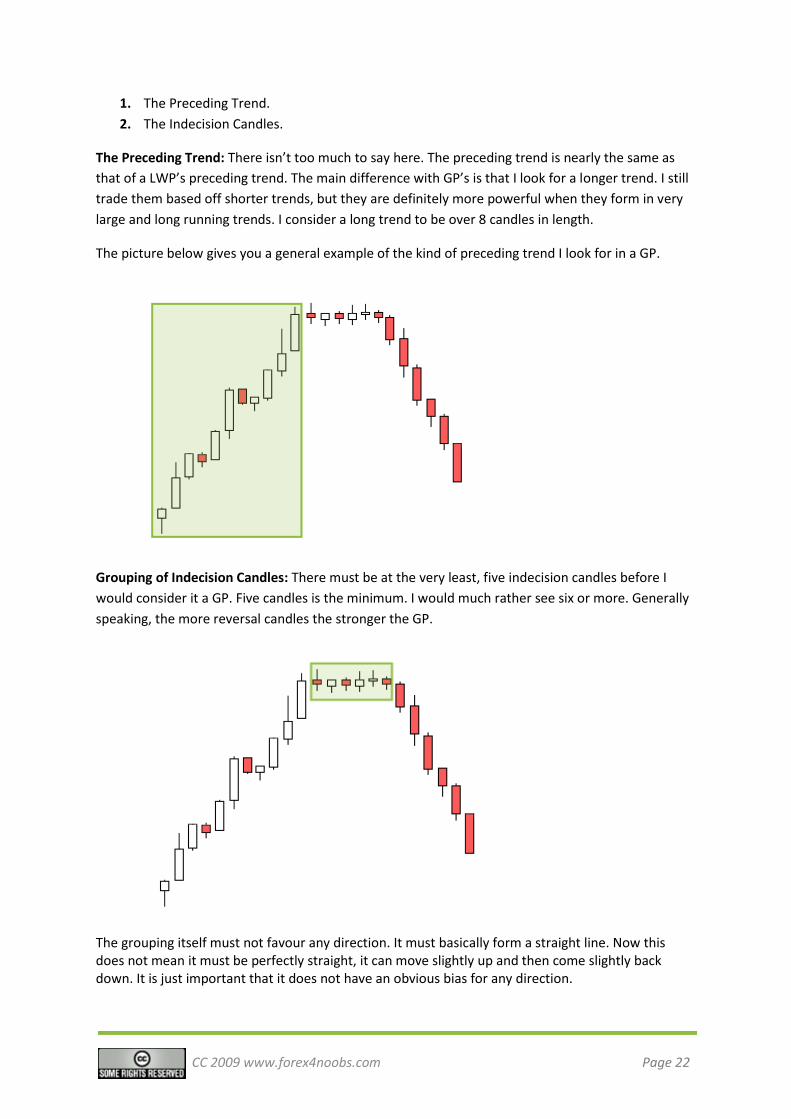
The Preceding Trend: There isn’t too much to say here. The preceding trend is nearly the same as
that of a LWP’s preceding trend. The main difference with GP’s is that I look for a longer trend. I still
trade them based off shorter trends, but they are definitely more powerful when they form in very
large and long running trends. I consider a long trend to be over 8 candles in length.
The picture below gives you a general example of the kind of preceding trend I look for in a GP.
Grouping of Indecision Candles: There must be at the very least, five indecision candles before I
would consider it a GP. Five candles is the minimum. I would much rather see six or more. Generally
speaking, the more reversal candles the stronger the GP.
The grouping itself must not favour any direction. It must basically form a straight line. Now this does not mean it must be perfectly straight, it can move slightly up and then come slightly back down. It is just important that it does not have an obvious bias for any direction.
CC 2009 www.forex4noobs.com Page 23
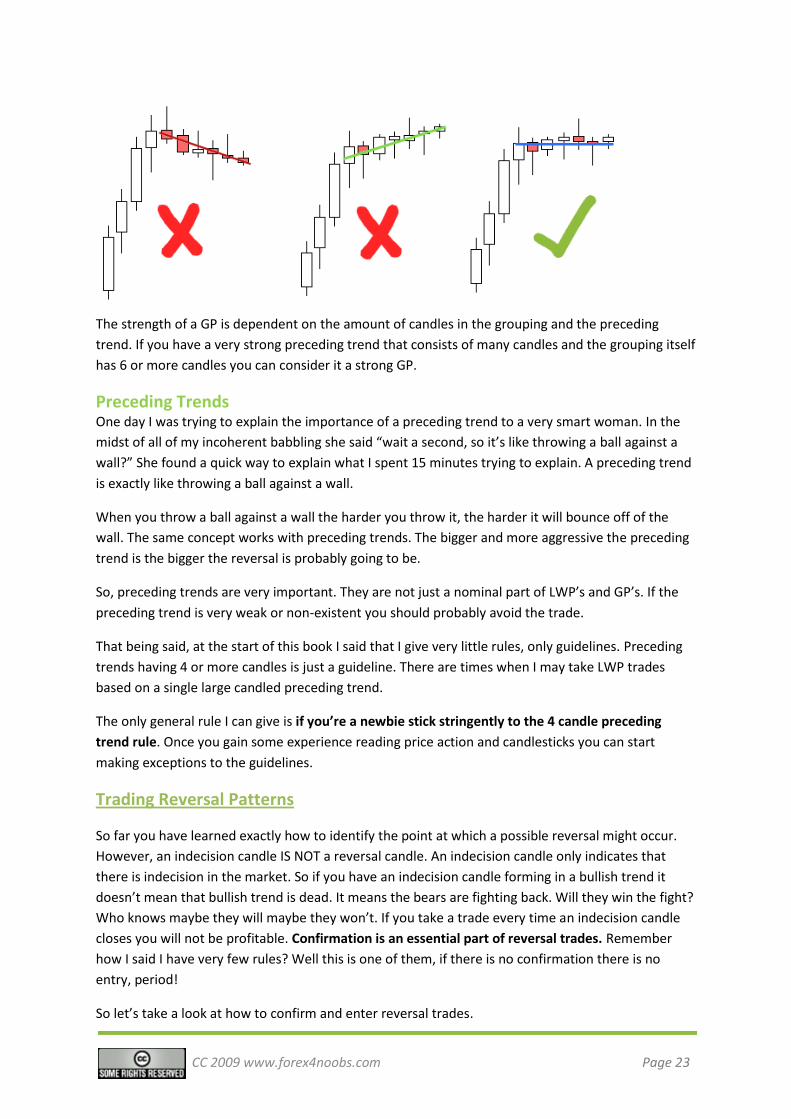
The strength of a GP is dependent on the amount of candles in the grouping and the preceding
trend. If you have a very strong preceding trend that consists of many candles and the grouping itself
has 6 or more candles you can consider it a strong GP.
Preceding TrendsOne day I was trying to explain the importance of a preceding trend to a very smart woman. In the
midst of all of my incoherent babbling she said “wait a second, so it’s like throwing a ball against a
wall?” She found a quick way to explain what I spent 15 minutes trying to explain. A preceding trend
is exactly like throwing a ball against a wall.
When you throw a ball against a wall the harder you throw it, the harder it will bounce off of the
wall. The same concept works with preceding trends. The bigger and more aggressive the preceding
trend is the bigger the reversal is probably going to be.
So, preceding trends are very important. They are not just a nominal part of LWP’s and GP’s. If the
preceding trend is very weak or non-existent you should probably avoid the trade.
That being said, at the start of this book I said that I give very little rules, only guidelines. Preceding
trends having 4 or more candles is just a guideline. There are times when I may take LWP trades
based on a single large candled preceding trend.
The only general rule I can give is if you’re a newbie stick stringently to the 4 candle preceding
trend rule. Once you gain some experience reading price action and candlesticks you can start
making exceptions to the guidelines.
Trading Reversal Patterns
So far you have learned exactly how to identify the point at which a possible reversal might occur.
However, an indecision candle IS NOT a reversal candle. An indecision candle only indicates that
there is indecision in the market. So if you have an indecision candle forming in a bullish trend it
doesn’t mean that bullish trend is dead. It means the bears are fighting back. Will they win the fight?
Who knows maybe they will maybe they won’t. If you take a trade every time an indecision candle
closes you will not be profitable. Confirmation is an essential part of reversal trades. Remember
how I said I have very few rules? Well this is one of them, if there is no confirmation there is no
entry, period!
So let’s take a look at how to confirm and enter reversal trades.
CC 2009 www.forex4noobs.com Page 24
Spotting a Possible ReversalIf you have a LWP on your chart you should be thinking that a reversal is possibly coming. The
problem most traders have is knowing when to enter that reversal. So I am going to let you in on my
secret that gets me on average an 80% win rate, with reversal trades.
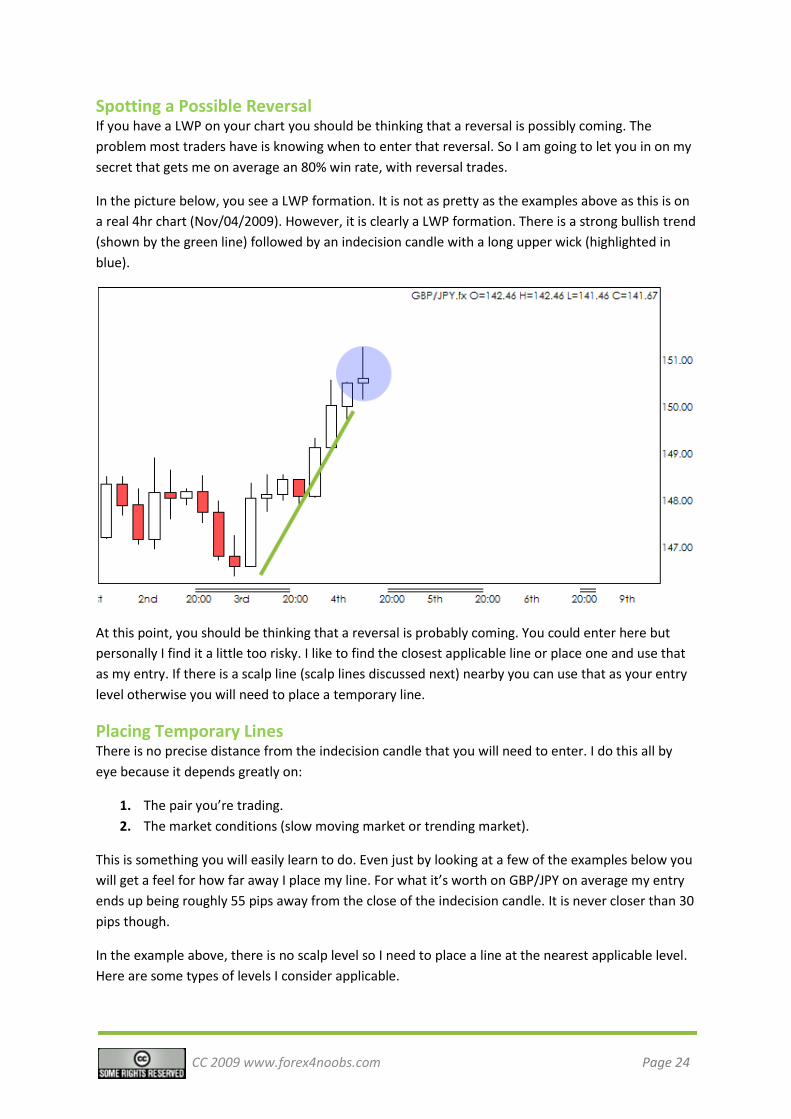
In the picture below, you see a LWP formation. It is not as pretty as the examples above as this is on
a real 4hr chart (Nov/04/2009). However, it is clearly a LWP formation. There is a strong bullish trend
(shown by the green line) followed by an indecision candle with a long upper wick (highlighted in
blue).
At this point, you should be thinking that a reversal is probably coming. You could enter here but
personally I find it a little too risky. I like to find the closest applicable line or place one and use that
as my entry. If there is a scalp line (scalp lines discussed next) nearby you can use that as your entry
level otherwise you will need to place a temporary line.
Placing Temporary LinesThere is no precise distance from the indecision candle that you will need to enter. I do this all by
eye because it depends greatly on:
1. The pair you’re trading.
2. The market conditions (slow moving market or trending market).
This is something you will easily learn to do. Even just by looking at a few of the examples below you
will get a feel for how far away I place my line. For what it’s worth on GBP/JPY on average my entry
ends up being roughly 55 pips away from the close of the indecision candle. It is never closer than 30
pips though.
In the example above, there is no scalp level so I need to place a line at the nearest applicable level.
Here are some types of levels I consider applicable.
CC 2009 www.forex4noobs.com Page 25
Psychological Levels Are any level that ends in a rounded number. So for example, on GBP/JPY your major psychological
levels would be:
140.00
150.00
160.00 and so on.
Your medium psychological levels would be:
141.00
141.50
142.00
142.50
143.00 and so on.
Your minor psychological levels would be:
141.10
141.20
141.30
141.40
141.60 and so on.
These levels are only significant because as humans our minds are fine tuned to look for patterns. So
naturally traders group their stops near rounded numbers such as psychological levels. You may
have noticed the 0.50 levels (141.50) are under medium psych levels. This is because it marks the
halfway point of every 100 pips.
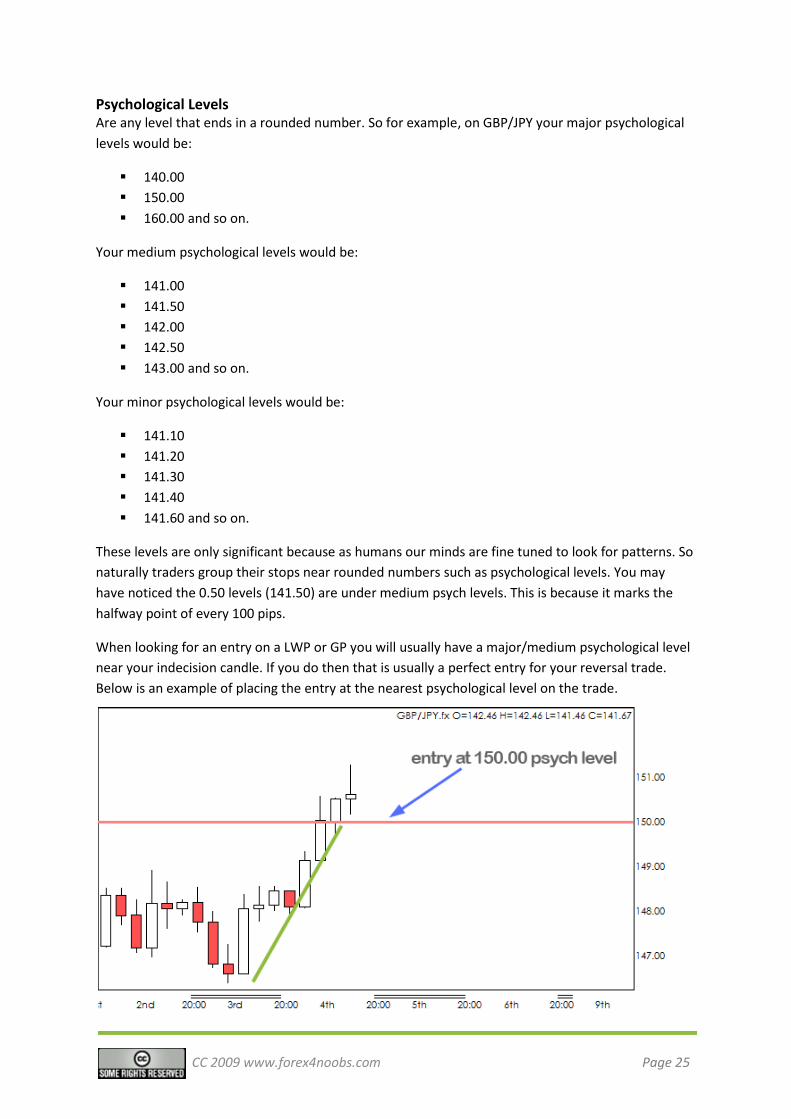
When looking for an entry on a LWP or GP you will usually have a major/medium psychological level
near your indecision candle. If you do then that is usually a perfect entry for your reversal trade.
Below is an example of placing the entry at the nearest psychological level on the trade.
CC 2009 www.forex4noobs.com Page 26
As you can see there is a strong psychological level at 150.00 and it is a good distance from the
indecision candle (60 pips).
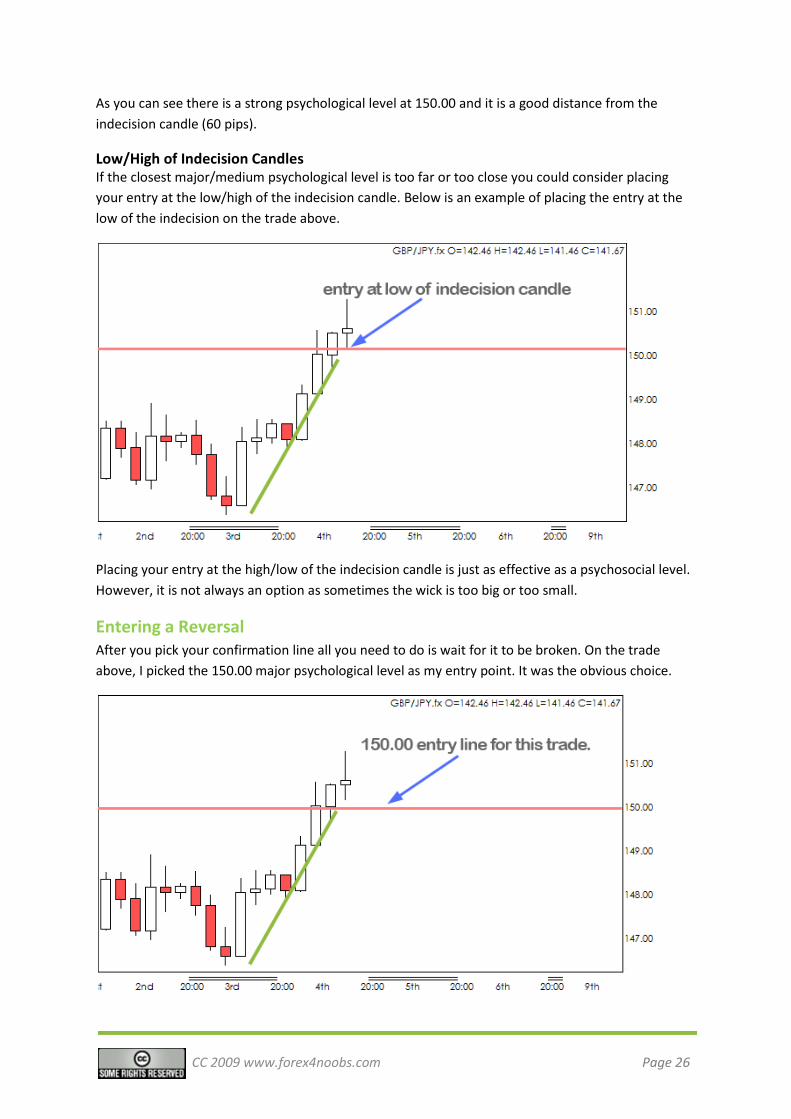
Low/High of Indecision Candles If the closest major/medium psychological level is too far or too close you could consider placing
your entry at the low/high of the indecision candle. Below is an example of placing the entry at the
low of the indecision on the trade above.
Placing your entry at the high/low of the indecision candle is just as effective as a psychosocial level.
However, it is not always an option as sometimes the wick is too big or too small.
Entering a Reversal After you pick your confirmation line all you need to do is wait for it to be broken. On the trade
above, I picked the 150.00 major psychological level as my entry point. It was the obvious choice.
CC 2009 www.forex4noobs.com Page 27
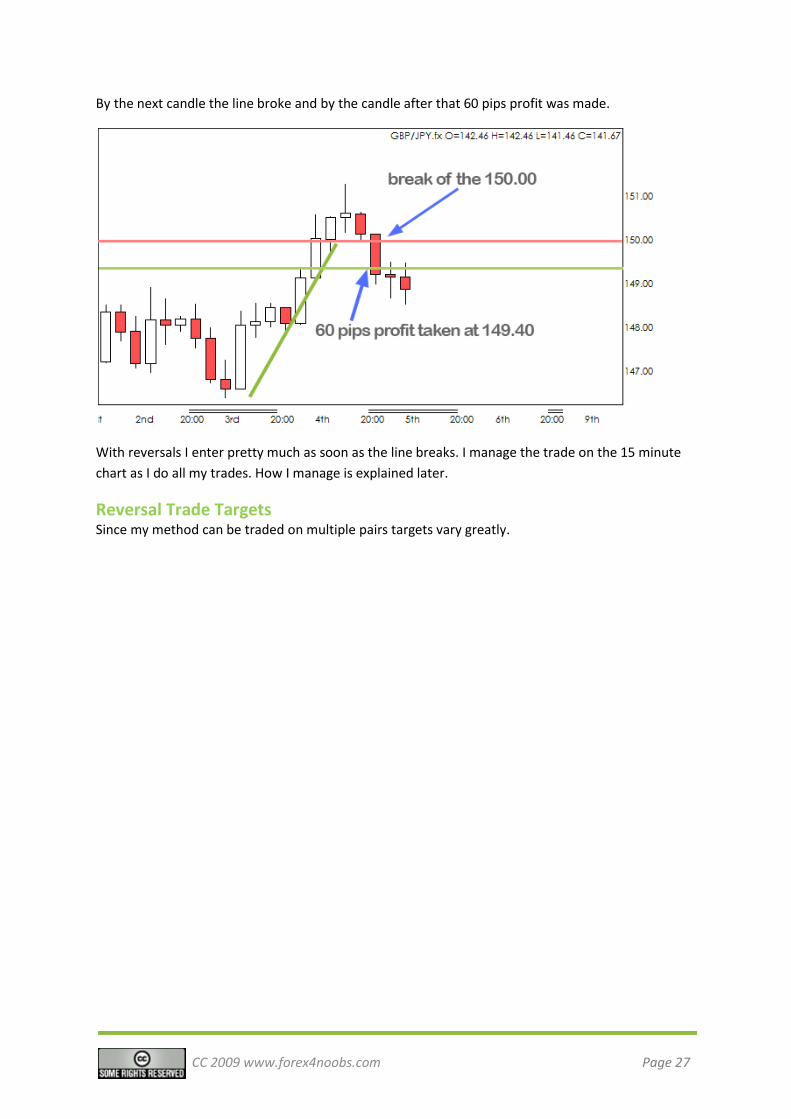
By the next candle the line broke and by the candle after that 60 pips profit was made.
With reversals I enter pretty much as soon as the line breaks. I manage the trade on the 15 minute
chart as I do all my trades. How I manage is explained later.
Reversal Trade TargetsSince my method can be traded on multiple pairs targets vary greatly.

CC 2009 www.forex4noobs.com Page 28
Chapter 5: Constant Lines
CC 2009 www.forex4noobs.com Page 29
Constant Lines
What Are Constant Lines? Constant lines are a part of my method I used to simply refer to as S+R lines. Now I am calling them
constant lines. These lines are called constant lines because they have been on the charts for
decades. And even though they move a little from time to time they’re pretty much constant.
Constant lines are lines at which we expect the price to find a permanent or temporary barrier. This
is based on the price finding a barrier at this line in the past. These lines act as a dam would in a
surging river. They hold the price from moving further. But when the price breaks through one of
these lines it can come surging through (and we can make pips)
So what exactly is a constant line, and why would the price magically stop at some seemingly
arbitrary horizontal line?
Simply put, constant lines are areas traders expect the price to have trouble getting through. A
constant line only exists because a long time ago the price happened to bounce away from it
strongly. Because humans are programmed to look for patterns the next time the price approached
that line it was traded as if the price might reverse from the line. This happened over and over until
this line became widely recognized as a line at which the pair has trouble breaking through.
For examples let’s say in 1980 GBP/USD surges to new highs and hits the level 1.9000. When
GBP/USD hits that level it has a massive reversal from it. 5 years later the price reaches 1.9000 again
and traders see that as a barrier which GBP/USD could not cross last time. So as it reaches that level
they start closing positions thinking they might see a repeat of last time. The fact that so many
traders close positions and/or take short trades actually turns GBP/USD around. So, again the price
has reached 1.9000 and reversed from the line. The more this happens the stronger the line
becomes. Eventually they become commonly viewed as areas at which the price will have trouble
getting through.
How I Use Constant LinesThe basic idea behind these lines is to watch how price will react when the line is reached.
Ideally what I like to see is the price approach the line, break through and then rush past the line. I
usually trade the break of the line. So I enter when the line is broken and target a certain amount of
pips.
I will also trade bounces from the line. So if the price reaches the line and our candlestick analysis
tells us that it may bounce from the line. Ideally with this kind of setup I want to see a trend heading
to the constant line. Then a candlestick pattern that indicates a reversal forming on or just before
the constant line.
CC 2009 www.forex4noobs.com Page 30
Placing Constant Lines
Placing constant lines is actually much easier than it looks. At the end of the day, all you really need
to do is identify areas in which the price has reversed from or had trouble breaking before. The best
thing is the lines are constant so once you place them you don’t have to do it again.
The main thing to keep in mind when placing lines is to make the lines fit the price not the price fit
the lines. Many newbies try so hard to place lines they end up counting any minor price spike to the
line as an actual bounce. Lines only work because they’re obvious enough that a lot of traders are
wary of them. So you should only place the obvious lines that really stand out.
So let’s take a look at how I place constant lines on my chart.
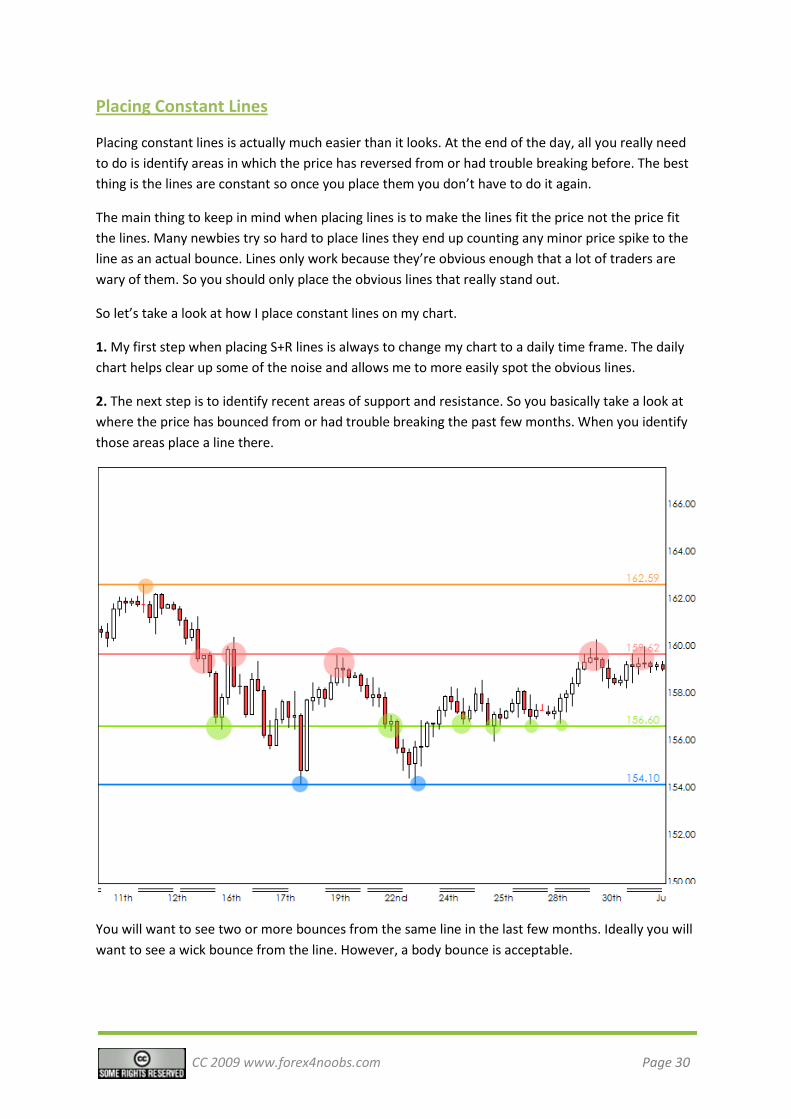
1. My first step when placing S+R lines is always to change my chart to a daily time frame. The daily
chart helps clear up some of the noise and allows me to more easily spot the obvious lines.
2. The next step is to identify recent areas of support and resistance. So you basically take a look at
where the price has bounced from or had trouble breaking the past few months. When you identify
those areas place a line there.
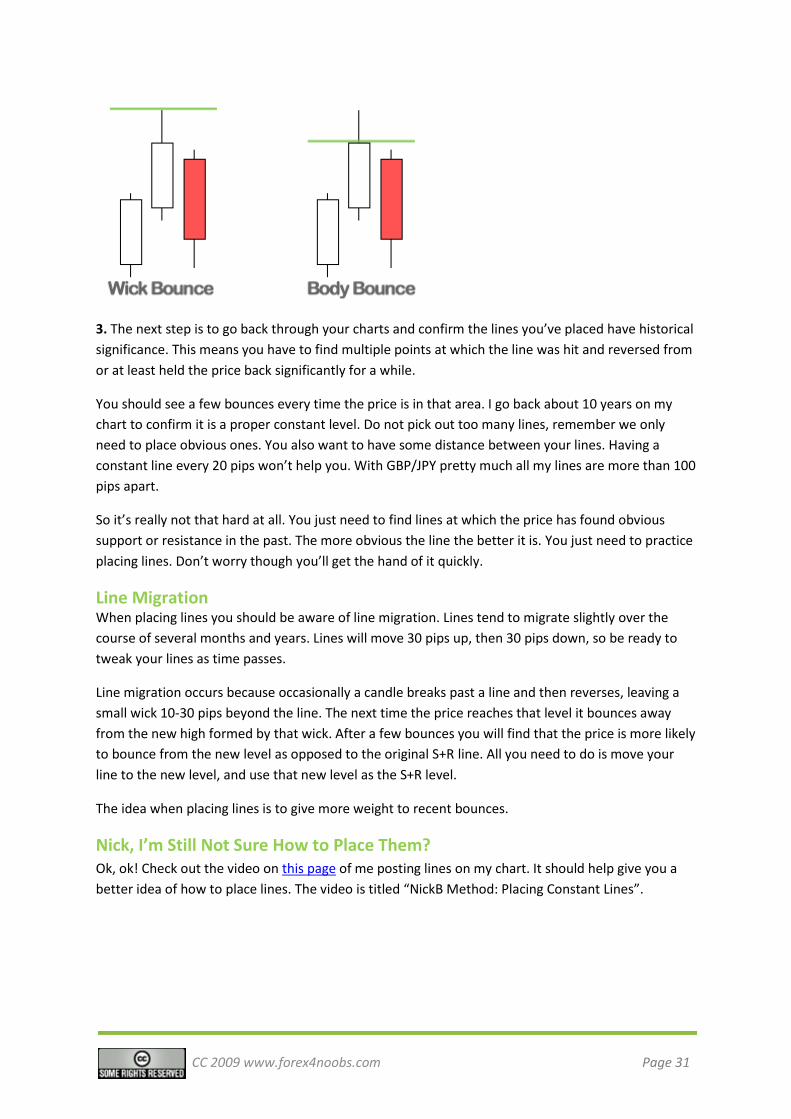
You will want to see two or more bounces from the same line in the last few months. Ideally you will
want to see a wick bounce from the line. However, a body bounce is acceptable.
CC 2009 www.forex4noobs.com Page 31
3. The next step is to go back through your charts and confirm the lines you’ve placed have historical
significance. This means you have to find multiple points at which the line was hit and reversed from
or at least held the price back significantly for a while.
You should see a few bounces every time the price is in that area. I go back about 10 years on my
chart to confirm it is a proper constant level. Do not pick out too many lines, remember we only
need to place obvious ones. You also want to have some distance between your lines. Having a
constant line every 20 pips won’t help you. With GBP/JPY pretty much all my lines are more than 100
pips apart.
So it’s really not that hard at all. You just need to find lines at which the price has found obvious
support or resistance in the past. The more obvious the line the better it is. You just need to practice
placing lines. Don’t worry though you’ll get the hand of it quickly.
Line MigrationWhen placing lines you should be aware of line migration. Lines tend to migrate slightly over the
course of several months and years. Lines will move 30 pips up, then 30 pips down, so be ready to
tweak your lines as time passes.
Line migration occurs because occasionally a candle breaks past a line and then reverses, leaving a
small wick 10-30 pips beyond the line. The next time the price reaches that level it bounces away
from the new high formed by that wick. After a few bounces you will find that the price is more likely
to bounce from the new level as opposed to the original S+R line. All you need to do is move your
line to the new level, and use that new level as the S+R level.
The idea when placing lines is to give more weight to recent bounces.
Nick, I’m Still Not Sure How to Place Them?
Ok, ok! Check out the video on this page of me posting lines on my chart. It should help give you a
better idea of how to place lines. The video is titled “NickB Method: Placing Constant Lines”.
CC 2009 www.forex4noobs.com Page 32
Trading Constant Lines
Line breaks are the main type of entry I use. This style of trading is commonly called ‘Breakout
Trading’. However, this breakout trading is a little different than most types of breakout trading. The
main difference is that I like to think when deciding to enter. I do not robotically enter the moment a
line is broken. There are several factors that dictate whether or not I get into a trade, and if I get in
to the trade when I get in.
Fair warning, this stuff is not something you will learn overnight. If you’re a newbie you need to gain
some experience with the market before all of this starts coming together. To be honest you can just
avoid all the stuff written below and enter blindly the second one of the constant lines break.
However, you will probably find that you will only win 60% of trades that way. As opposed to
winning 80% as I do. I have said it before and I will say it again. Forex is an ever-changing fluid
market. To trade it properly we have to be fluid too. So I don’t blindly jump into trades as soon as
the price jumps 1 pip over my line. I see each trade as unique and I judge it based on the factors
below.
Momentum (Price Action): This is probably the main thing I think about when determining whether
or not I will enter a trade. Some people have trouble understanding what momentum is so I will try
to explain it as best I can. As far as I am concerned it is a simple concept. I believe the people that
have trouble understanding momentum are overcomplicating things.
It all comes back to price action, CA and what I talked about at the start of this book. When a line
break happens you need to ask yourself the questions I mentioned earlier:
1. Who has control of the pair?
2. Are they controlling it strongly? (in other words are the candles big or small)
3. Is there any sign that they are about to lose control?
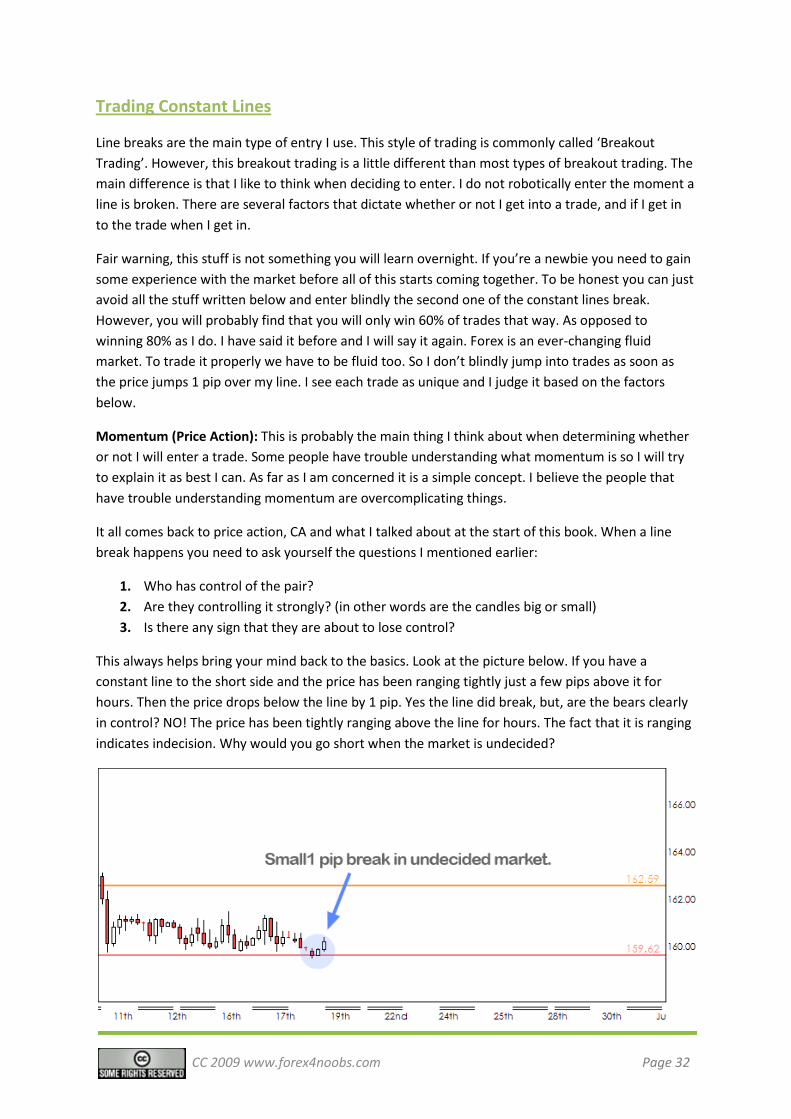
This always helps bring your mind back to the basics. Look at the picture below. If you have a
constant line to the short side and the price has been ranging tightly just a few pips above it for
hours. Then the price drops below the line by 1 pip. Yes the line did break, but, are the bears clearly
in control? NO! The price has been tightly ranging above the line for hours. The fact that it is ranging
indicates indecision. Why would you go short when the market is undecided?
CC 2009 www.forex4noobs.com Page 33
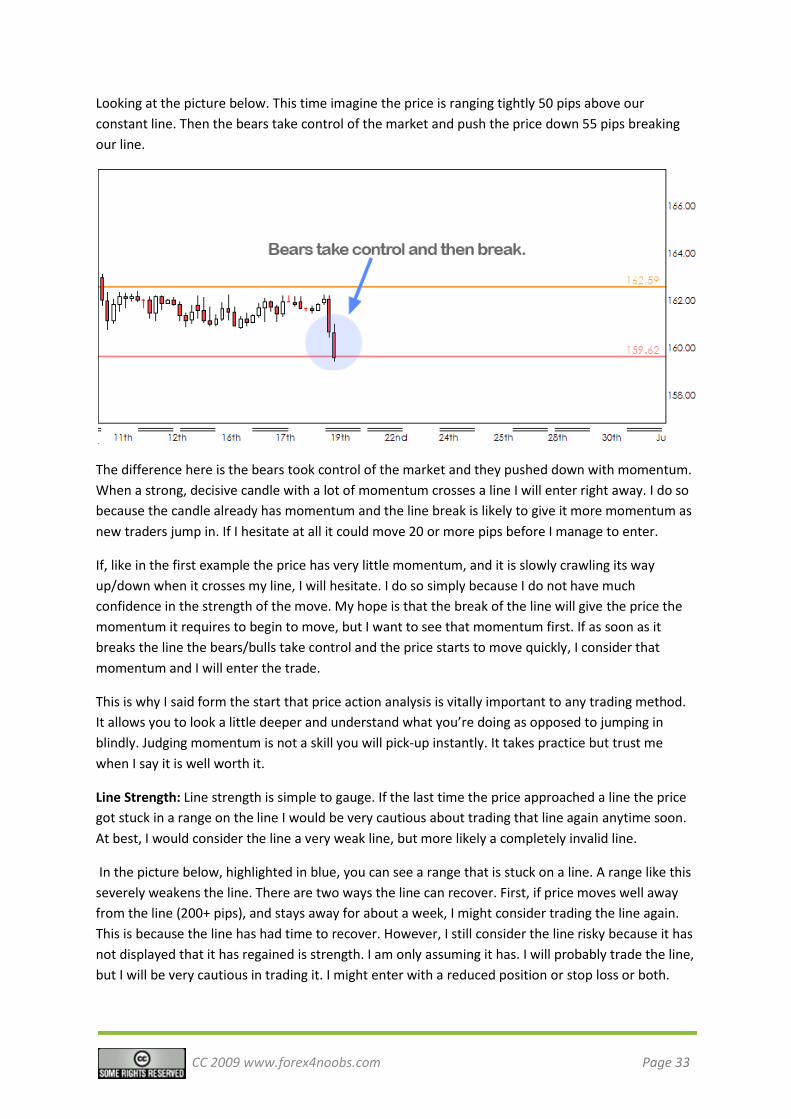
Looking at the picture below. This time imagine the price is ranging tightly 50 pips above our
constant line. Then the bears take control of the market and push the price down 55 pips breaking
our line.
The difference here is the bears took control of the market and they pushed down with momentum.
When a strong, decisive candle with a lot of momentum crosses a line I will enter right away. I do so
because the candle already has momentum and the line break is likely to give it more momentum as
new traders jump in. If I hesitate at all it could move 20 or more pips before I manage to enter.
If, like in the first example the price has very little momentum, and it is slowly crawling its way
up/down when it crosses my line, I will hesitate. I do so simply because I do not have much
confidence in the strength of the move. My hope is that the break of the line will give the price the
momentum it requires to begin to move, but I want to see that momentum first. If as soon as it
breaks the line the bears/bulls take control and the price starts to move quickly, I consider that
momentum and I will enter the trade.
This is why I said form the start that price action analysis is vitally important to any trading method.
It allows you to look a little deeper and understand what you’re doing as opposed to jumping in
blindly. Judging momentum is not a skill you will pick-up instantly. It takes practice but trust me
when I say it is well worth it.
Line Strength: Line strength is simple to gauge. If the last time the price approached a line the price
got stuck in a range on the line I would be very cautious about trading that line again anytime soon.
At best, I would consider the line a very weak line, but more likely a completely invalid line.
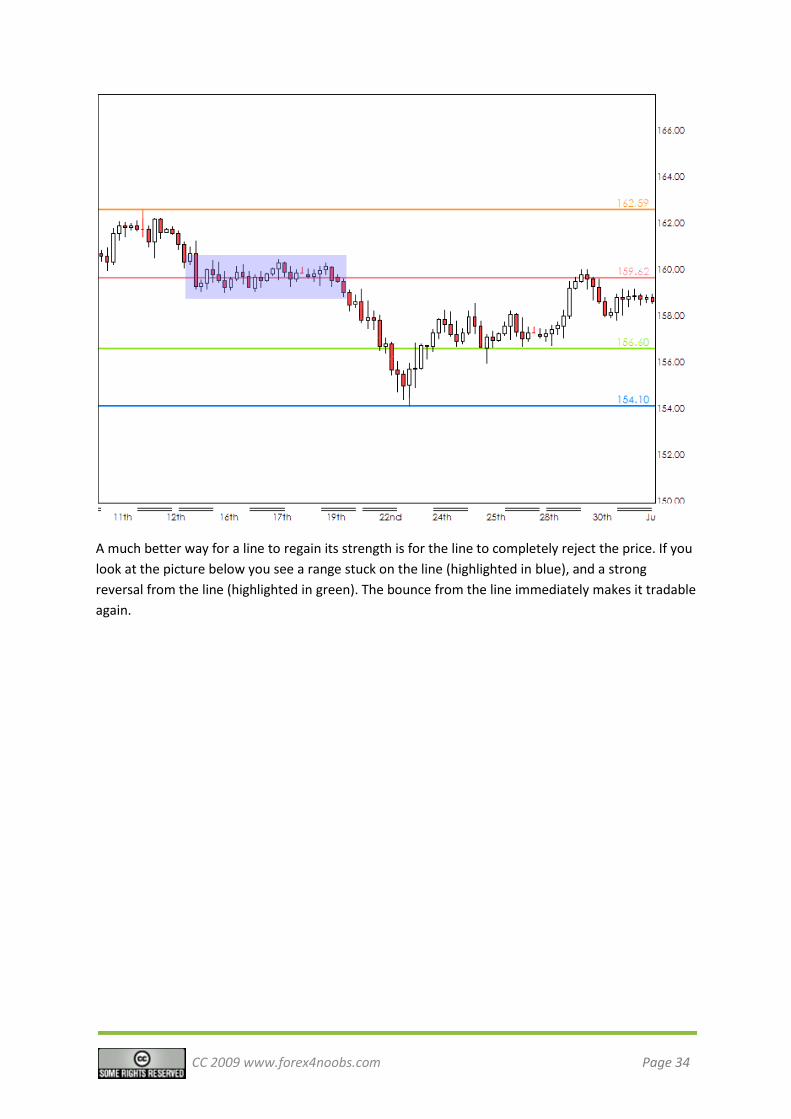
In the picture below, highlighted in blue, you can see a range that is stuck on a line. A range like this
severely weakens the line. There are two ways the line can recover. First, if price moves well away
from the line (200+ pips), and stays away for about a week, I might consider trading the line again.
This is because the line has had time to recover. However, I still consider the line risky because it has
not displayed that it has regained is strength. I am only assuming it has. I will probably trade the line,
but I will be very cautious in trading it. I might enter with a reduced position or stop loss or both.
CC 2009 www.forex4noobs.com Page 34
A much better way for a line to regain its strength is for the line to completely reject the price. If you
look at the picture below you see a range stuck on the line (highlighted in blue), and a strong
reversal from the line (highlighted in green). The bounce from the line immediately makes it tradable
again.
CC 2009 www.forex4noobs.com Page 35
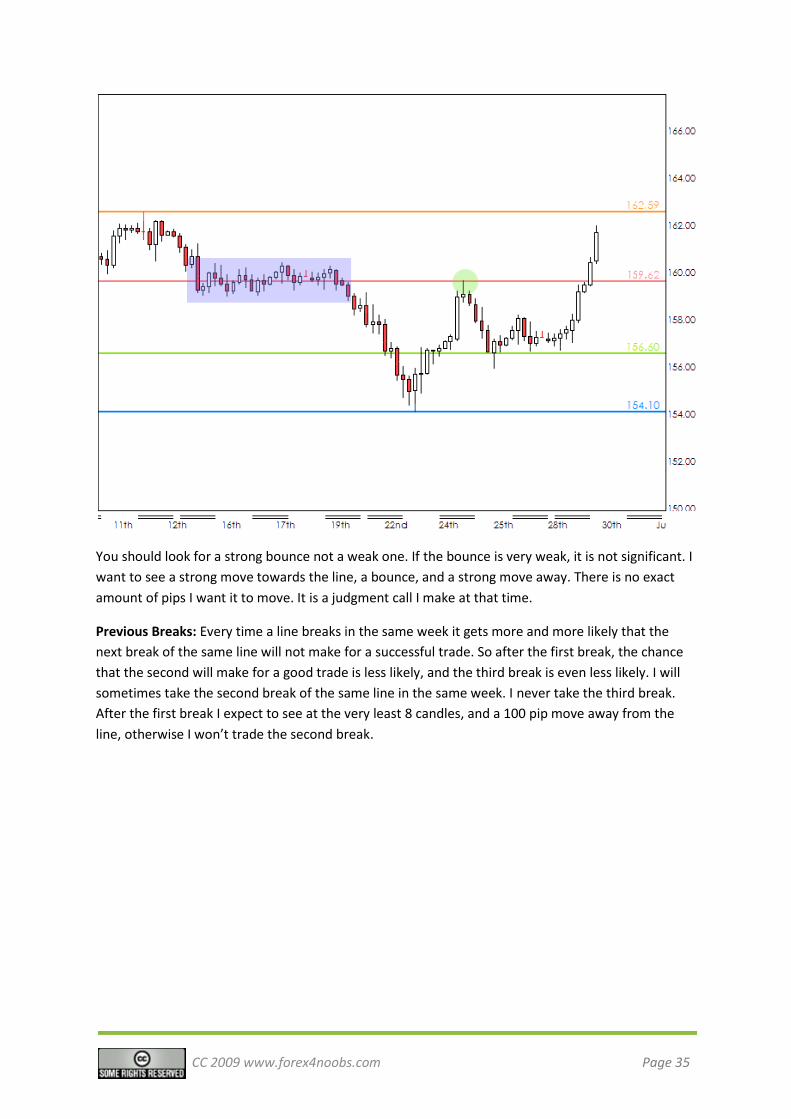
You should look for a strong bounce not a weak one. If the bounce is very weak, it is not significant. I
want to see a strong move towards the line, a bounce, and a strong move away. There is no exact
amount of pips I want it to move. It is a judgment call I make at that time.
Previous Breaks: Every time a line breaks in the same week it gets more and more likely that the
next break of the same line will not make for a successful trade. So after the first break, the chance
that the second will make for a good trade is less likely, and the third break is even less likely. I will
sometimes take the second break of the same line in the same week. I never take the third break.
After the first break I expect to see at the very least 8 candles, and a 100 pip move away from the
line, otherwise I won’t trade the second break.
CC 2009 www.forex4noobs.com Page 36
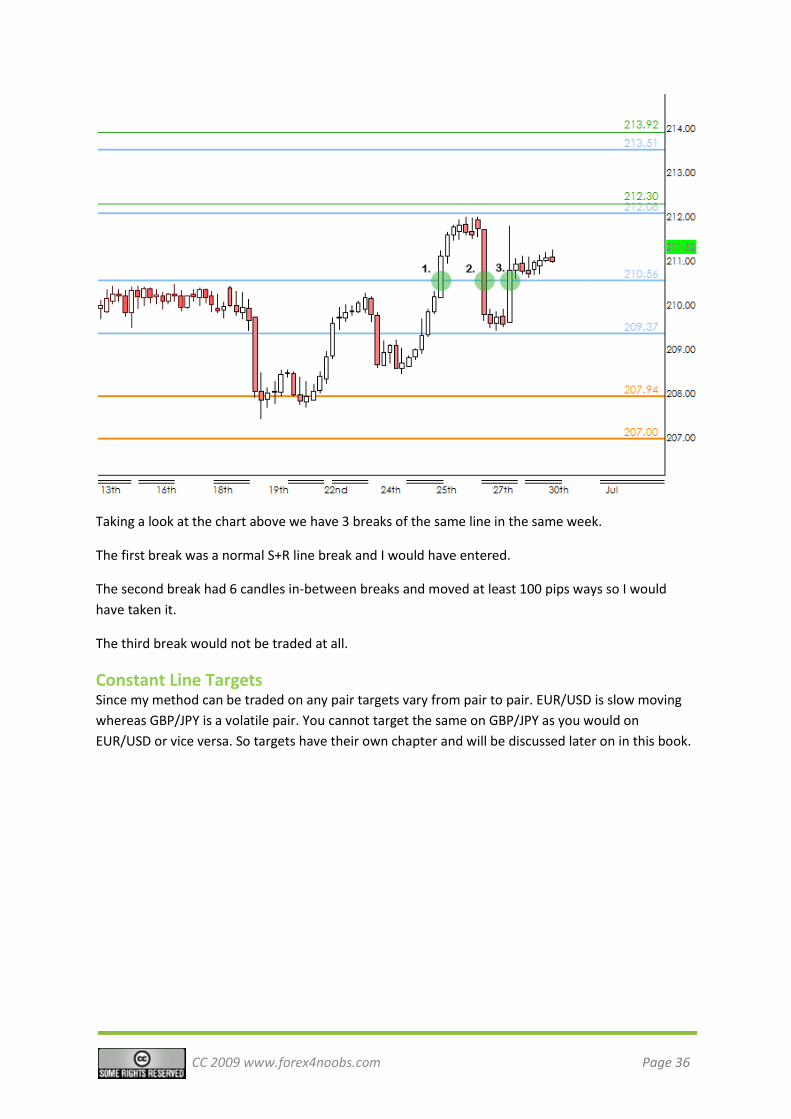
Taking a look at the chart above we have 3 breaks of the same line in the same week.
The first break was a normal S+R line break and I would have entered.
The second break had 6 candles in-between breaks and moved at least 100 pips ways so I would
have taken it.
The third break would not be traded at all.
Constant Line TargetsSince my method can be traded on any pair targets vary from pair to pair. EUR/USD is slow moving
whereas GBP/JPY is a volatile pair. You cannot target the same on GBP/JPY as you would on
EUR/USD or vice versa. So targets have their own chapter and will be discussed later on in this book.
CC 2009 www.forex4noobs.com Page 37
Chapter 6: Support &
Resistance Zones
CC 2009 www.forex4noobs.com Page 38
S+R Zones
What are S+R Zones?S+R zones are areas of around 50-150 pips in which the price tends to act erratically and be
dangerous to trade. They usually form when the price move onto a constant line and begins to
range. If the price ranges at the line for a long enough time the constant line becomes useless, and a
zone forms.
Think about it as a disruption of the S+R line. After the S+R line is disrupted it can take a few weeks,
or even a few months for it to return to normal. You will find that when the price approaches that
area it will get sucked into a range, or it will bounce away from the area randomly. An S+R zone is
no-man’s-land, and I rarely, if ever, take a trade at or near one of these zones. I simply wait for the
line to return to its normal state.
If you’re a newbie an S+R zone is definitely a no trade area.
Spotting S+R ZonesIt’s very simple to spot an S+R zone (even simpler than placing a constant line on your chart).
Basically when the price hits a constant line on your chart and begins to range on that line a S+R
zone can develop. The two biggest clues that a constant line has become an S+R zone are:
1. The price bounces away from random areas within a tight zone. So for example, on GBP/JPY
if the price approaches a constant line and bounces away at random levels within a 100 pip
zone of the constant lines.
2. The price gets sucked into a range within a tight zone around a constant line.
You will find that after the price ranges on or near an S+R line the line no longer holds the price back
very well. You will see the price bouncing away randomly near the line and getting caught in ranges
near the line. Keep in mind, S+R zones are rare and just because you get some ranging here and
there does not automatically mean it is an S+R zone.
CC 2009 www.forex4noobs.com Page 39
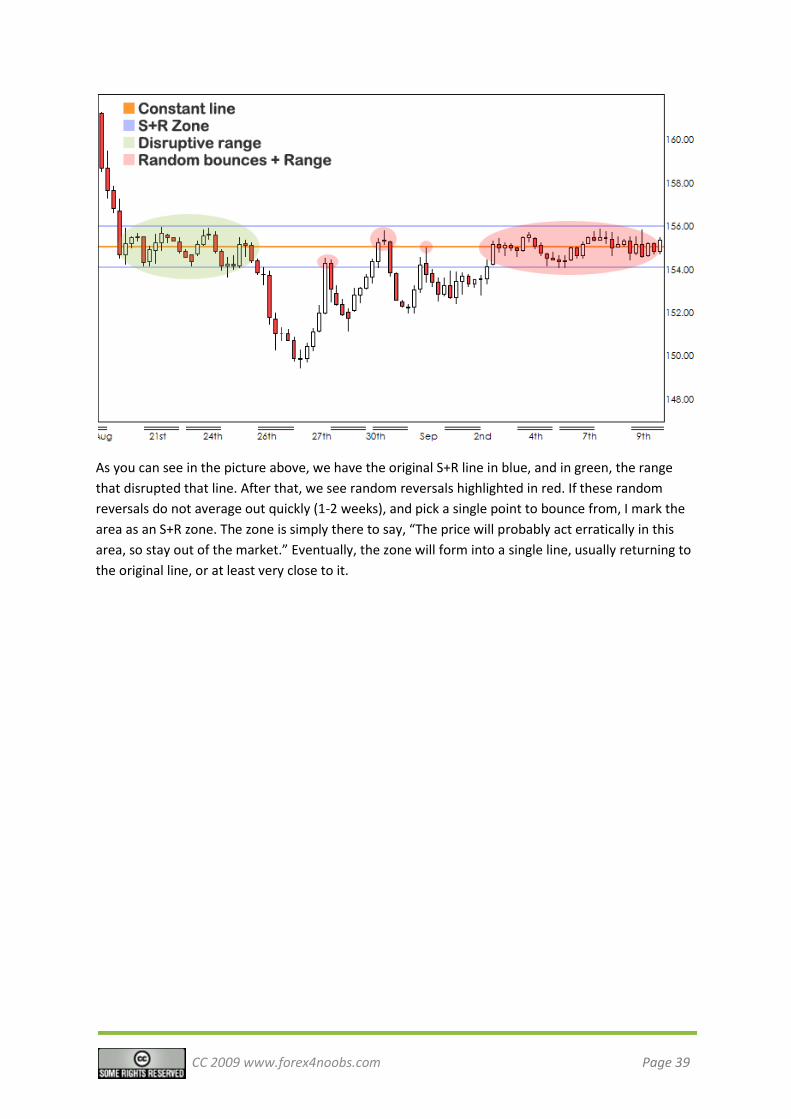
As you can see in the picture above, we have the original S+R line in blue, and in green, the range
that disrupted that line. After that, we see random reversals highlighted in red. If these random
reversals do not average out quickly (1-2 weeks), and pick a single point to bounce from, I mark the
area as an S+R zone. The zone is simply there to say, “The price will probably act erratically in this
area, so stay out of the market.” Eventually, the zone will form into a single line, usually returning to
the original line, or at least very close to it.
CC 2009 www.forex4noobs.com Page 40
Chapter 7: Scalp Lines
CC 2009 www.forex4noobs.com Page 41
Scalp Lines
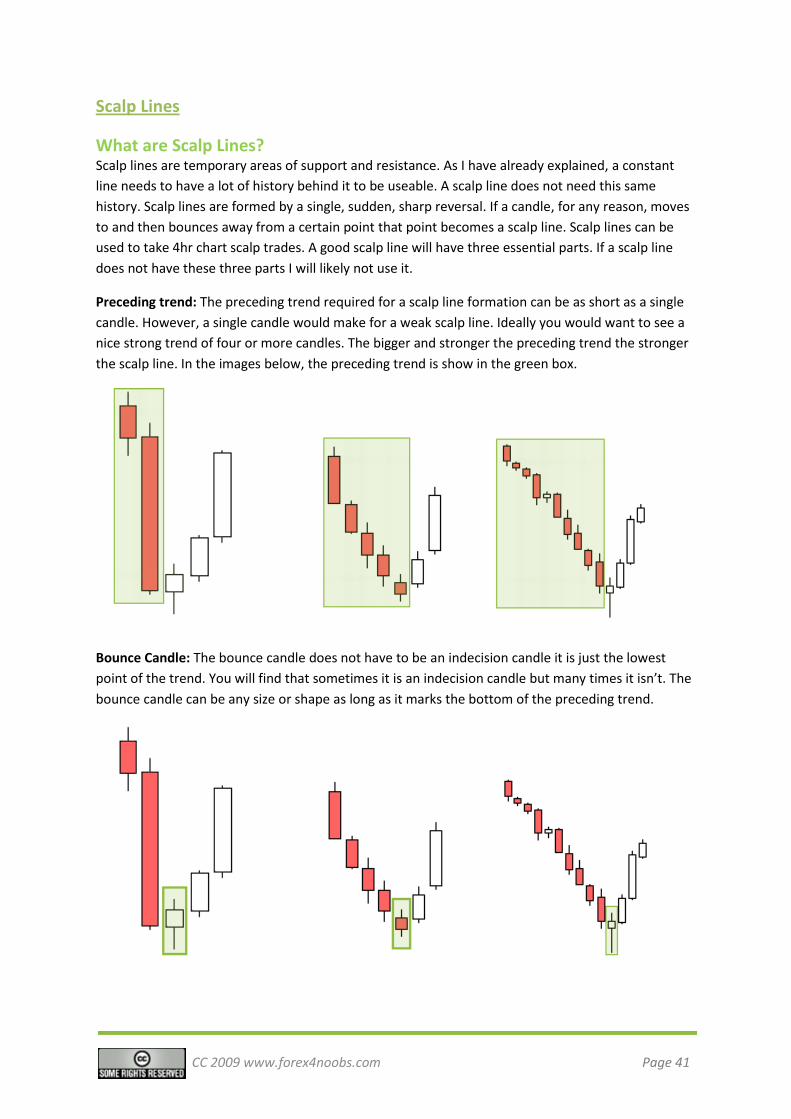
What are Scalp Lines?Scalp lines are temporary areas of support and resistance. As I have already explained, a constant
line needs to have a lot of history behind it to be useable. A scalp line does not need this same
history. Scalp lines are formed by a single, sudden, sharp reversal. If a candle, for any reason, moves
to and then bounces away from a certain point that point becomes a scalp line. Scalp lines can be
used to take 4hr chart scalp trades. A good scalp line will have three essential parts. If a scalp line
does not have these three parts I will likely not use it.
Preceding trend: The preceding trend required for a scalp line formation can be as short as a single
candle. However, a single candle would make for a weak scalp line. Ideally you would want to see a
nice strong trend of four or more candles. The bigger and stronger the preceding trend the stronger
the scalp line. In the images below, the preceding trend is show in the green box.
Bounce Candle: The bounce candle does not have to be an indecision candle it is just the lowest
point of the trend. You will find that sometimes it is an indecision candle but many times it isn’t. The
bounce candle can be any size or shape as long as it marks the bottom of the preceding trend.
CC 2009 www.forex4noobs.com Page 42
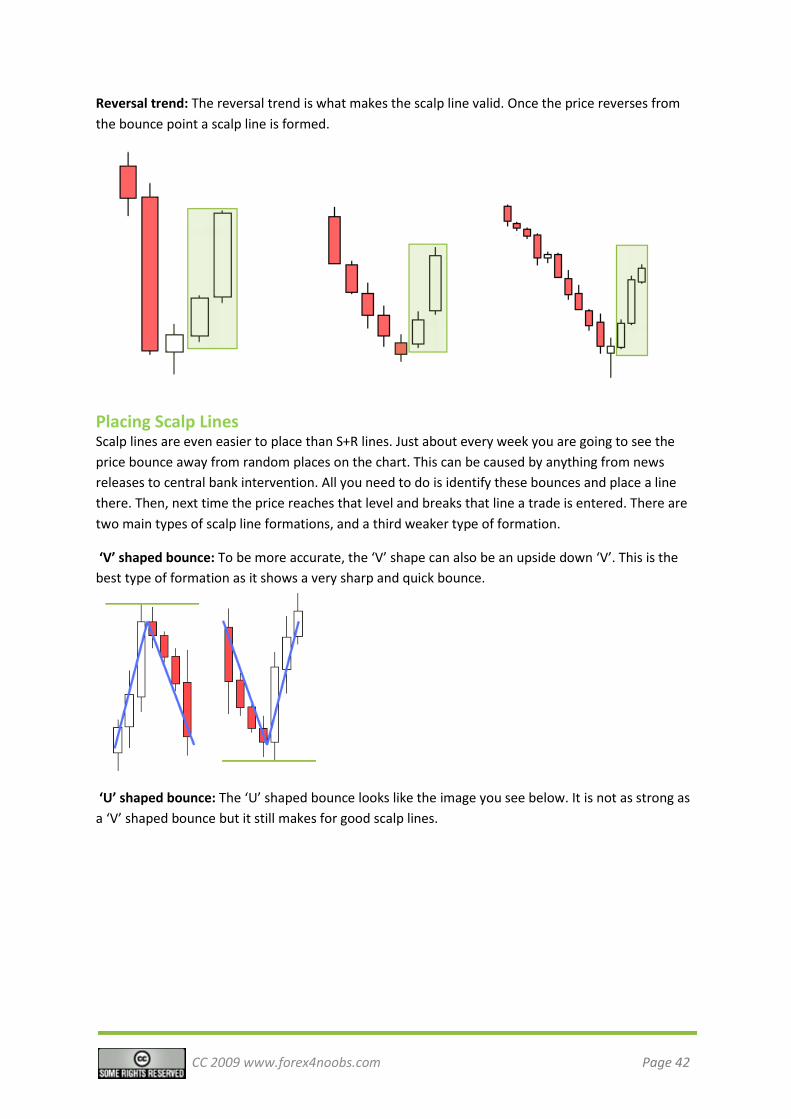
Reversal trend: The reversal trend is what makes the scalp line valid. Once the price reverses from
the bounce point a scalp line is formed.
Placing Scalp LinesScalp lines are even easier to place than S+R lines. Just about every week you are going to see the
price bounce away from random places on the chart. This can be caused by anything from news
releases to central bank intervention. All you need to do is identify these bounces and place a line
there. Then, next time the price reaches that level and breaks that line a trade is entered. There are
two main types of scalp line formations, and a third weaker type of formation.
‘V’ shaped bounce: To be more accurate, the ‘V’ shape can also be an upside down ‘V’. This is the
best type of formation as it shows a very sharp and quick bounce.
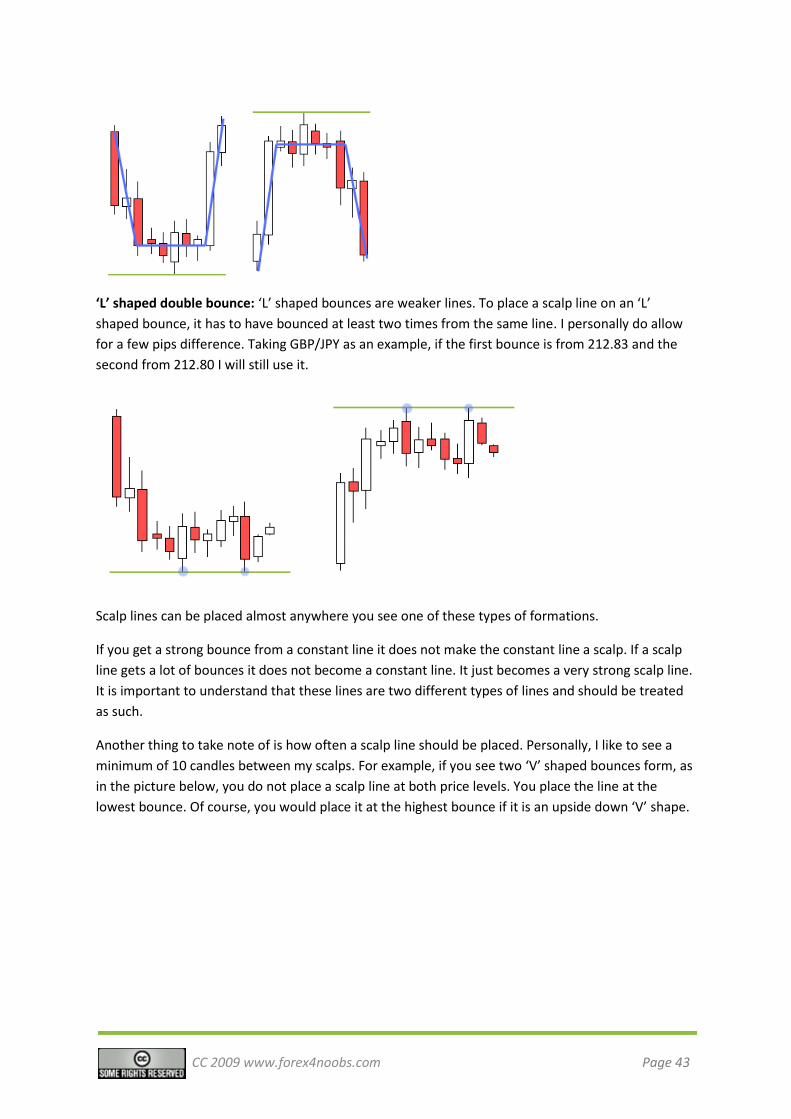
‘U’ shaped bounce: The ‘U’ shaped bounce looks like the image you see below. It is not as strong as
a ‘V’ shaped bounce but it still makes for good scalp lines.
CC 2009 www.forex4noobs.com Page 43
‘L’ shaped double bounce: ‘L’ shaped bounces are weaker lines. To place a scalp line on an ‘L’
shaped bounce, it has to have bounced at least two times from the same line. I personally do allow
for a few pips difference. Taking GBP/JPY as an example, if the first bounce is from 212.83 and the
second from 212.80 I will still use it.
Scalp lines can be placed almost anywhere you see one of these types of formations.
If you get a strong bounce from a constant line it does not make the constant line a scalp. If a scalp
line gets a lot of bounces it does not become a constant line. It just becomes a very strong scalp line.
It is important to understand that these lines are two different types of lines and should be treated
as such.
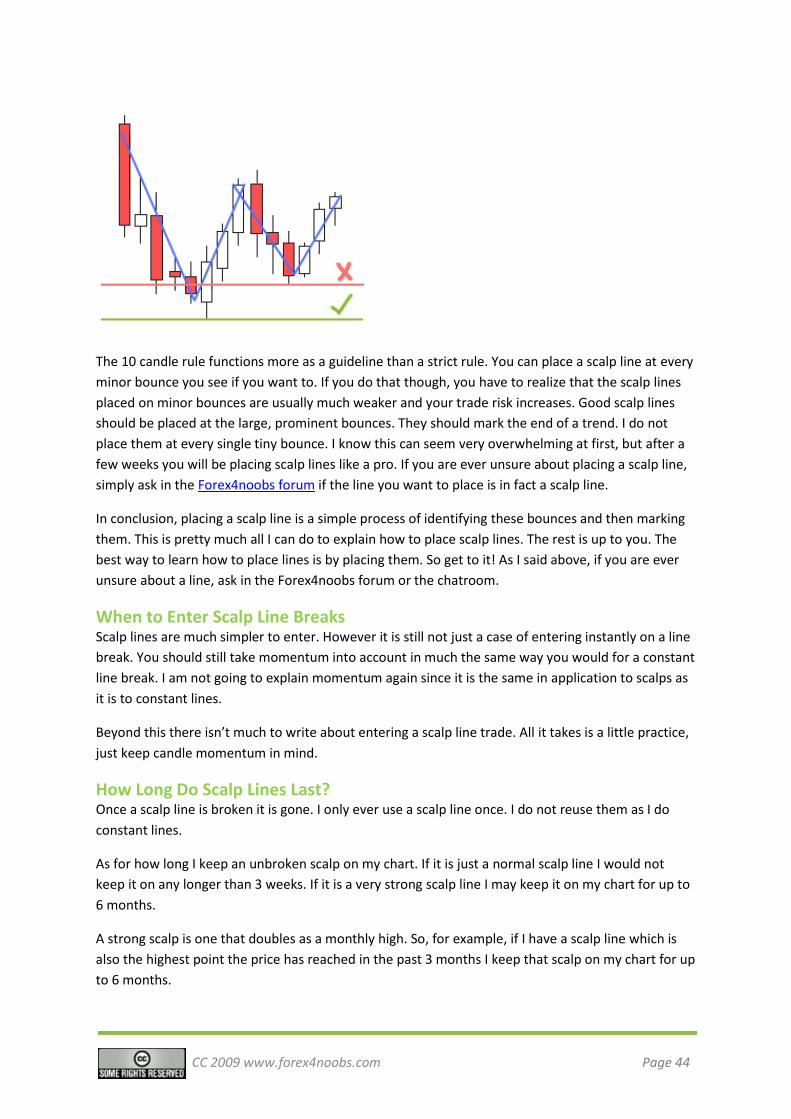
Another thing to take note of is how often a scalp line should be placed. Personally, I like to see a
minimum of 10 candles between my scalps. For example, if you see two ‘V’ shaped bounces form, as
in the picture below, you do not place a scalp line at both price levels. You place the line at the
lowest bounce. Of course, you would place it at the highest bounce if it is an upside down ‘V’ shape.
CC 2009 www.forex4noobs.com Page 44
The 10 candle rule functions more as a guideline than a strict rule. You can place a scalp line at every
minor bounce you see if you want to. If you do that though, you have to realize that the scalp lines
placed on minor bounces are usually much weaker and your trade risk increases. Good scalp lines
should be placed at the large, prominent bounces. They should mark the end of a trend. I do not
place them at every single tiny bounce. I know this can seem very overwhelming at first, but after a
few weeks you will be placing scalp lines like a pro. If you are ever unsure about placing a scalp line,
simply ask in the Forex4noobs forum if the line you want to place is in fact a scalp line.
In conclusion, placing a scalp line is a simple process of identifying these bounces and then marking
them. This is pretty much all I can do to explain how to place scalp lines. The rest is up to you. The
best way to learn how to place lines is by placing them. So get to it! As I said above, if you are ever
unsure about a line, ask in the Forex4noobs forum or the chatroom.
When to Enter Scalp Line BreaksScalp lines are much simpler to enter. However it is still not just a case of entering instantly on a line
break. You should still take momentum into account in much the same way you would for a constant
line break. I am not going to explain momentum again since it is the same in application to scalps as
it is to constant lines.
Beyond this there isn’t much to write about entering a scalp line trade. All it takes is a little practice,
just keep candle momentum in mind.
How Long Do Scalp Lines Last?Once a scalp line is broken it is gone. I only ever use a scalp line once. I do not reuse them as I do
constant lines.
As for how long I keep an unbroken scalp on my chart. If it is just a normal scalp line I would not
keep it on any longer than 3 weeks. If it is a very strong scalp line I may keep it on my chart for up to
6 months.
A strong scalp is one that doubles as a monthly high. So, for example, if I have a scalp line which is
also the highest point the price has reached in the past 3 months I keep that scalp on my chart for up
to 6 months.
CC 2009 www.forex4noobs.com Page 45
Chapter 8: Targets & Stops
CC 2009 www.forex4noobs.com Page 46
Targets & Stops
When people first start trading the Forex markets they are inundated with information from self
proclaimed trading gurus. If you have been around Forex4Noobs for a while you probably know I
believe 90% of these trading gurus are failed traders and 99% of what they say is useless. They’ll tell
you whatever sounds good so they can get into your pockets.
One of the most consistently told lies is that your stops should always be half of your take profit.
Whenever I hear this I have to laugh. It is just so completely ridiculous. If you actually think about it
for a moment it makes little sense. If you are planning to lose 50% then follow those gurus.... to
bankruptcy if you want. I don’t know about you but I certainly do not plan to lose 50% of my trades. I
plan to win 80% and statistically I do.
Look at a pair like GBP/JPY which moves 270 pips per day, on average. Who in their right mind would
hold a 35 pip stop on this pair? I know that routinely on my trades GBP/JPY moves 40 or more pips
against me, before going in my direction. If I had my stop loss at 35 pips I would lose a lot more of
my trades. In fact, had I listened to these trading gurus, who say your stop must be half your take
profit, I would probably not be a trader today.
Since my trading method can be used on any pair it is difficult to give exact targets and stops for all.
So I have come up with a simple way of calculating targets and stops on all pairs. Please keep in mind
that calculating them in the way I detail below only gives you a general idea of your target and stop.
While it will likely work well you still must test and refine the targets to make them perfect. You will
see that even though the stops are always smaller than the take profits they are quite large. Like I
said above, don’t worry about it. I am showing you how to win 80% of trades not 50%. So your stop
doesn’t need to be tiny.
Target & Stop FormulaBefore you say “Formula? Oh noooooo, he is going to give us maths!” don’t worry this is easy. You
only need two numbers to calculate your targets and stops. The first thing you need to do is find the
average daily range for the past 200 (or so) days for the pair you want to trade.
Getting the ADR
This is easy enough to do with any ‘meta trader 4’ platform. All you need is the ADR indicator and
install it. Once you have the indicator on your chart it automatically displays the average daily range
for the pair.
You will find the indicator and installation guide here.
Now that you have the ADR you can easily calculate your targets. Let’s take a look how. In the
examples below we will use GBP/JPY and EUR/USD as examples. The ADR for those is (at the time of
writing this):
GBP/JPY: 270 (rounded up from 266)
EUR/USD: 160 (rounded up from 157)
CC 2009 www.forex4noobs.com Page 47
Target & Stop for Constant LinesConstant lines have the smallest target of all. To calculate your basic constant line target the formula
is:
ADR / 4 = Target
So for GBP/JPY and EUR/USD
GBP/JPY: 270 / 4 = 67.5 (round it up to 70)
EUR/USD: 160 / 4 = 40
So our target for GBP/JPY is 70 pips and our target for EUR/USD is 40 pips. To figure out the stop loss
you divide by 5 instead. So:
GBP/JPY : 270 / 5 = 54 (round it up to 55)
EUR/USD : 160 / 5 = 32 (round down to 30)
So our stop for GBP/JPY is 55 pips and our stop for EUR/USD is 30 pips. That was pretty easy right?
So now you know that when trading constant lines your targets and stops should be
GBP/JPY: Target 70 pips - Stop 50 pips
EUR/USD : Target 40 pips - Stop 30 pips
Target & Stop For Scalp LinesTo calculate your basic scalp line target the formula is:
ADR / 3 = Target
Using the same examples as above:
GBP/JPY: 270 / 3 = 90
EUR/USD: 160 / 3 = 53.3 (round up to 55)
So our target for GBP/JPY is 90 pips and our target for EUR/USD is 55 pips. To figure out the stop loss
you divide by 4 instead. So:
GBP/JPY:270 / 4 = 67.5 (round it up to 70)
EUR/USD : 160 / 4 = 40
GBP/JPY: Target 90 pips - Stop 70 pips
EUR/USD : Target 55 pips - Stop 40 pips
Target & Stop For Reversal TradesReversal trade targets and stops are fluid. The base target and stop however is the same as the
constant line target and stop.
Reversal trades work best when you can sit and watch them. If you can sit and watch you are best
off managing the trade using price action on the 15 minute chart (I explain this in the next chapter).
If you cannot sit and watch the trade just use the constant line target and stop.
CC 2009 www.forex4noobs.com Page 48
Refine Your Targets & StopsIt is extremely important that you understand that this formula gives you a basic starting point. It is
very important that through testing you refine your targets and stops. For example above the
formula gave use the target and stop for GBP/JPY scalp lines as:
GBP/JPY: Target 90 pips - Stop 70 pips
Through testing Metalhawk (one of the cool Forex4Noobs bloggers) has discovered that the best
target and stop for GBP/JPY scalp lines is.
GBP/JPY: Target 80 pips - Stop 70 pips
Over the course of 70 trades changing the target from 90 pips to 80 pips resulted in an overall gain
of an extra 690 pips. This is why it is very important that you refine your targets. To this end on my
blog I have put up a page to keep track of current targets on the main pairs I trade. GBP/JPY,
EUR/JPY and GBP/USD. I will add more pairs as information is gathered so bookmark the page and
check back regularly.
CC 2009 www.forex4noobs.com Page 49
Chapter 9: Monitoring Trades
on The 15 Min Chart
CC 2009 www.forex4noobs.com Page 50
Monitoring Trades
How to MonitorSo far we have discussed analyzing charts, spotting trades, entering trades and setting targets. Now
that you’re in the trade you can do one of two things.
Option 1: Set up a target and stop order to automatically close you out - I have done it for years
and it works fine for me. This option allows you to jump in a trade and then go and do something
else. So you do not have to be there for the duration of the trades life monitoring.
The downside to this option is it gives you little control. You won’t be able to see the price action so
if the trade goes bad you will likely have your stop loss hit. And if it’s a really good trade you
probably won’t be able to let it run and grab more pips.
Option 2: Drop down to the 15 minute chart to monitor your trade – This allows you to have more
control over the trade. If you see signs that the trade may not work out you can close out early. If
you see signs that the trade is very strong you can keep it open and grab more pips.
However, you will find that sometimes a trade looks bad on the 15 min chart to start with but ends
up being profitable. So you may close out with -10 pips and miss out on a cool 70 pip trade.
As with anything in life each options has its advantages and disadvantages. Let’s explore both of the
options a little more so you can decide what’s best for you.
Option 1: Setting up a target and stopAs I said above, I have been doing this for years and it works perfectly for me. There are definitely
some drawbacks but trading cannot be perfect so the drawbacks are something you have to put up
with.
This option works well for people who trade from work or are usually busy when trading. If you can’t
spend two hours monitoring your trade then setting an auto target and stop is your answer. Let’s
take a look at a few different ways to do this.
Hard Target and Stop Using GBP/JPY as an example again lets imagine we are in a trending market. What you would do
here is set your broker to automatically close you out at your 80 pip target and 70 pip stop.
Whichever one is hit first closes your trade. This is easy to do and it works very well.
Scaled Target and Set Stop Again, using GBP/JPY as an example. You would set up a stop order with your broker to close you out
at -70 pips. Your target order would be set up differently though. There a many different variations
but the simplest would be.
1. Set the first half of your open position to close out at 70 pips.
2. Set the second half to close out at 100 pips.
This will allow you to catch more pips. However it might also hit your first target and then reverse
and hit your stop leaving you with a break even trade.
CC 2009 www.forex4noobs.com Page 51
You can experiment with scaled targets and find out what works best for you. Personally I just use a
hard stop. I rather 80 pips than 0 pips, to me making an extra 20 pips on a trade doesn’t justify the
risk of having it drop back down to 0 pips.
Conclusion
If you want less stress and more simplicity setting up a target and a stop is the best option. Also if
you’re a newbie you probably are best off using this option. Monitoring trades on a 15 min chart can
be intimidating and require a bit of practice.
Option 2: Monitoring on the 15 min ChartI am going to say this right from the start so there can be no confusion. Do not jump right in to
monitoring trades on the 15 min chart. Especially if you’re a newbie this is a skill that takes some
refinement and practice.
Should I Monitor on the 15 min? Dropping down to the 15 min chart allows you to very clearly see the current price of the pair you
are trading. This can be both a good thing and a bad thing. And whether it is a good or bad is
dependent on a few factors:
Your skill level as a trader – Are you a newbie who doesn’t have a thorough understanding of price
action and candlestick analysis? Well then you might find it hard to know when to exit or when to
stay in on a 15 min chart.
Your personality – Are you a trigger happy nervous trader? Well then you might have some issues
with closing out too early if you monitor on the 15 min chart.
The pair you’re trading – Some of the more erratic pairs can be hard to monitor on the 15 min chart.
Simply because they are hard to read and you may find yourself closing out all your trades early.
Monitoring on the 15 min chart sounds great but it’s very important that you ease yourself into it. If
you jump right in you may find yourself closing out just about every trade early.
Pros and Cons PRO - Monitoring trades on the 15 min chart allows you to see price action very clearly. This can be a
major benefit when you’re in a great trade that’s trending strongly. If you’re in a short GBP/JPY trade
and the price action tells you that the bears are in control, you can stay in beyond your original
target. So instead of making 80 pips you can make 100 pips or 150 pips.
CON - Sometimes if your trade breaks a line it may not take off right away. It may take 30 minutes,
an hour or even more before it starts moving into positive territory. If you are trading with a set
target and stops (option 1) this won’t matter too much to you. However, looking at this kind of price
action on the 15 min chart tempts you to exit.
It is a definite possibility that you may close out trades destined to be winners too early because
they don’t look good on the 15 min chart. So you may close out a trade with -5 pips and then have it
hit what would have been your 80 pips target an hour later.
CC 2009 www.forex4noobs.com Page 52
Conclusion Monitoring a trade on the 15 min chart is great for intermediate-professional traders who are calm
and collected. I am not saying newbie’s should steer clear of it completely. The main issue is it adds
an element of stress to your trading. Traders with some experience tend to be able to deal with that
stress whereas newbie’s can’t.
Do if you’re a newbie and want to monitor on the 15 min chart read how to below. Just don’t go into
it full throttle. Mess around with 15 min charts a little and get use to monitoring live positions on the
15 min chart.
Keep in mind one of the tricks to trading is to play to your strengths.
How to Monitor on the 15 min Chart
The Basic Concept You will probably be pleasantly surprised at how simple this is. I have already discussed price action
and candlestick analysis. This is all you need to monitor trades on the 15 min chart. Remember what
indecision candles suggest:
1. A close struggle between the bulls and the bears.
2. A possible reversal.
If you just jumped into a GBP/JPY short indecision candles are something you don’t want to see. If
your short you want the bears to be in complete control and push GBP/JPY down. So if the candles
start suggesting to you that the bulls are fighting back that’s likely bad news for your short.
How to Monitor and Exit Trades On The 15 min Chart What you need to do is use what you know about indecision candles and reversal trades and apply it
to the 15 min chart. Instead of looking for indecision candles as opportunities to enter a trade you
look for them as warning signs to close the trade.
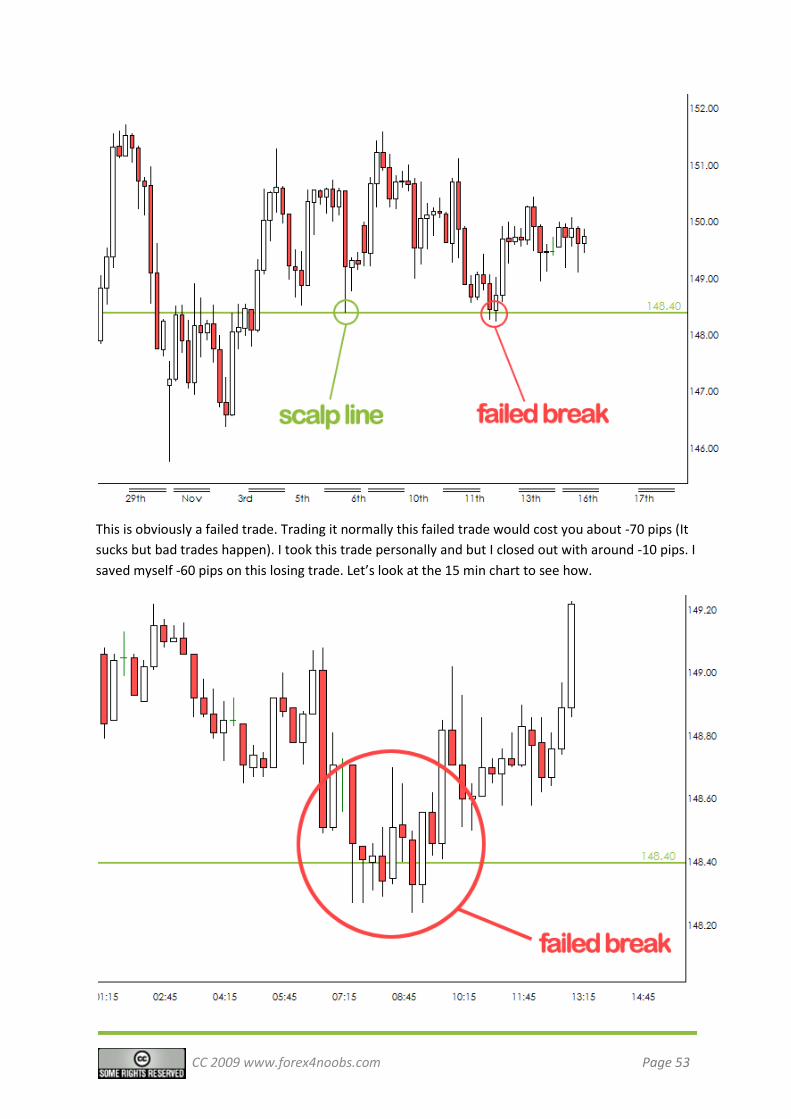
Let’s look at a few examples. Below you see a 4hr GBP/JPYT chart. On it in green you can see the
148.40 scalp line that formed on the 6th of November 2009. The point at which the line formed is
circled in green and the failed break is circled in red:
CC 2009 www.forex4noobs.com Page 53
This is obviously a failed trade. Trading it normally this failed trade would cost you about -70 pips (It
sucks but bad trades happen). I took this trade personally and but I closed out with around -10 pips. I
saved myself -60 pips on this losing trade. Let’s look at the 15 min chart to see how.
CC 2009 www.forex4noobs.com Page 54
Looking at the 15 min chart above we can clearly see a bunch of indecision candles. As soon as the
line broke we see a reversal followed by
1. A indecision candle with a bearish body.
2. A indecision candle with a bullish body.
3. A decent bearish candle that would gives us some hope but it still didn’t make a new low
4. A big bullish reversal that very clear told me the bulls had more power than the bears.
So I used what I know about price action and indecision candles to identify the bears had control
then close out a bad trade early. It really is straight forward simple stuff just like everything in my
method.
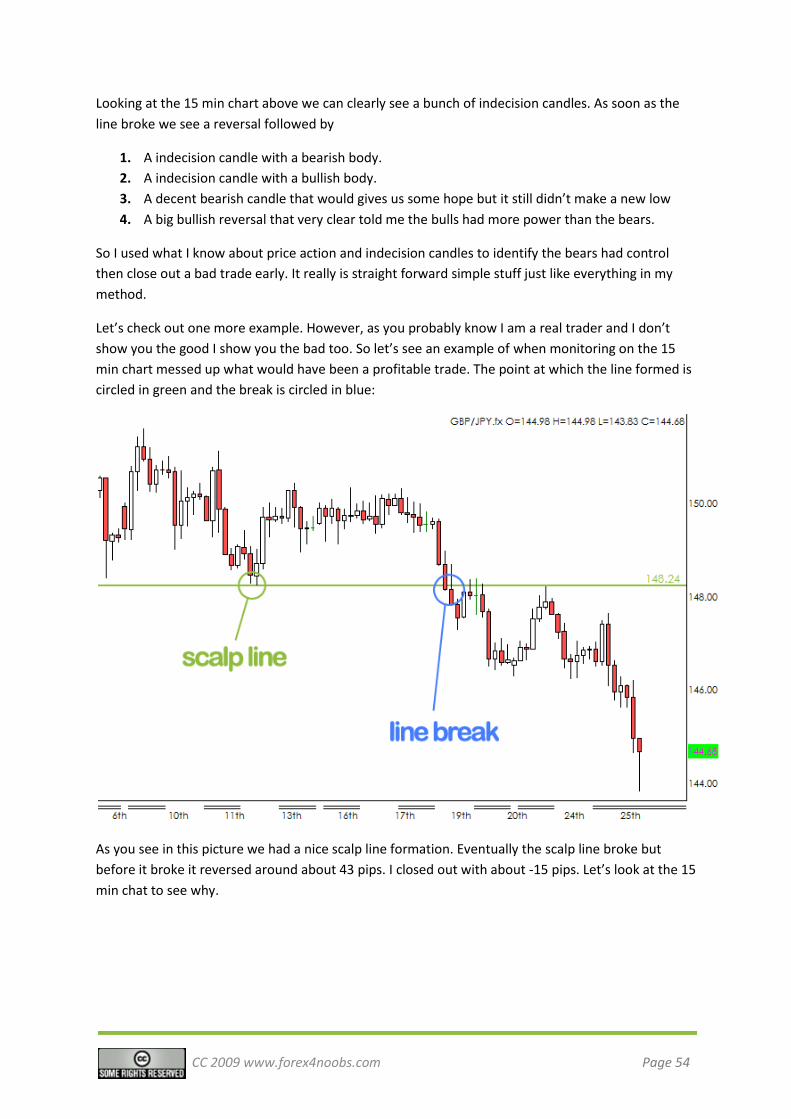
Let’s check out one more example. However, as you probably know I am a real trader and I don’t
show you the good I show you the bad too. So let’s see an example of when monitoring on the 15
min chart messed up what would have been a profitable trade. The point at which the line formed is
circled in green and the break is circled in blue:
As you see in this picture we had a nice scalp line formation. Eventually the scalp line broke but
before it broke it reversed around about 43 pips. I closed out with about -15 pips. Let’s look at the 15
min chat to see why.
CC 2009 www.forex4noobs.com Page 55
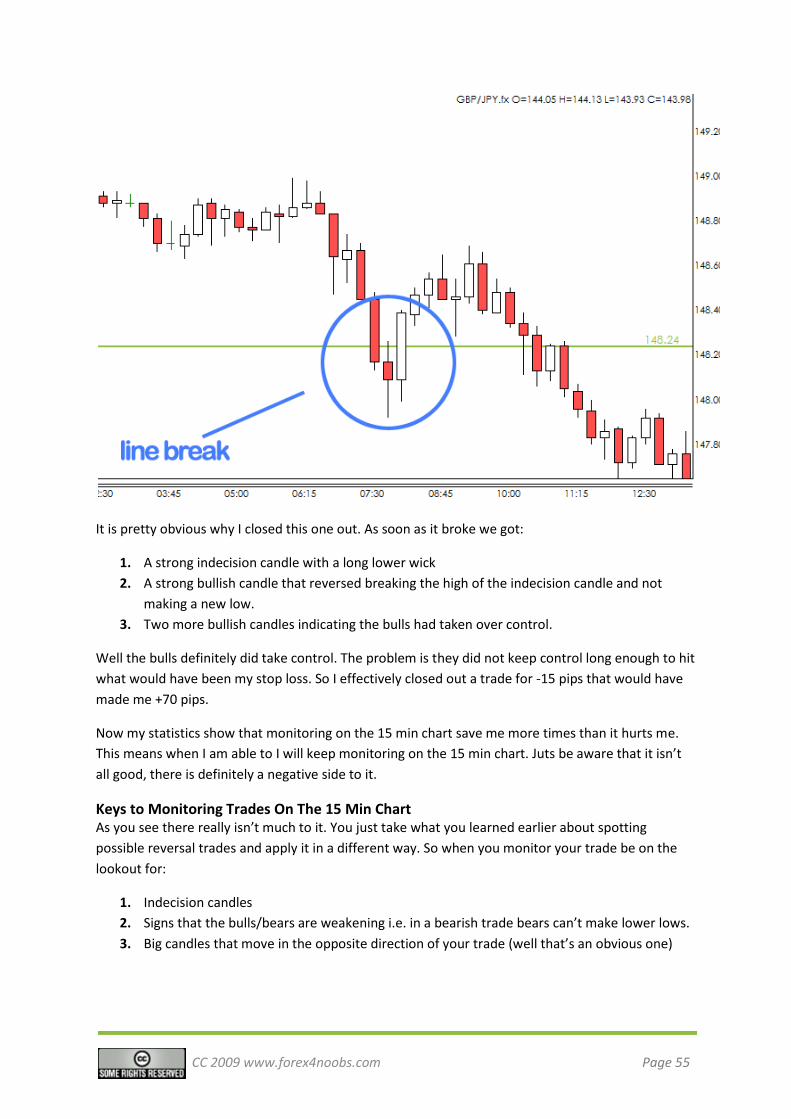
It is pretty obvious why I closed this one out. As soon as it broke we got:
1. A strong indecision candle with a long lower wick
2. A strong bullish candle that reversed breaking the high of the indecision candle and not
making a new low.
3. Two more bullish candles indicating the bulls had taken over control.
Well the bulls definitely did take control. The problem is they did not keep control long enough to hit
what would have been my stop loss. So I effectively closed out a trade for -15 pips that would have
made me +70 pips.
Now my statistics show that monitoring on the 15 min chart save me more times than it hurts me.
This means when I am able to I will keep monitoring on the 15 min chart. Juts be aware that it isn’t
all good, there is definitely a negative side to it.
Keys to Monitoring Trades On The 15 Min Chart As you see there really isn’t much to it. You just take what you learned earlier about spotting
possible reversal trades and apply it in a different way. So when you monitor your trade be on the
lookout for:
1. Indecision candles
2. Signs that the bulls/bears are weakening i.e. in a bearish trade bears can’t make lower lows.
3. Big candles that move in the opposite direction of your trade (well that’s an obvious one)

CC 2009 www.forex4noobs.com Page 56
It all ties in with the rest of my method. All you are doing is using price action analysis to identify if
the bulls or bears are in control. If your short and the bears are in control GREAT stay in if instead
you see the bulls take control you might consider closing the trade.
Be Warned I started with a warning so I will end this with a warning. Do not jump into monitoring trades on the
15 min chart without practicing first. It is not as easy as it looks and adds a whole new dimension to
trading the NickB method.
CC 2009 www.forex4noobs.com Page 57
Chapter 10: Know When to Stay Out
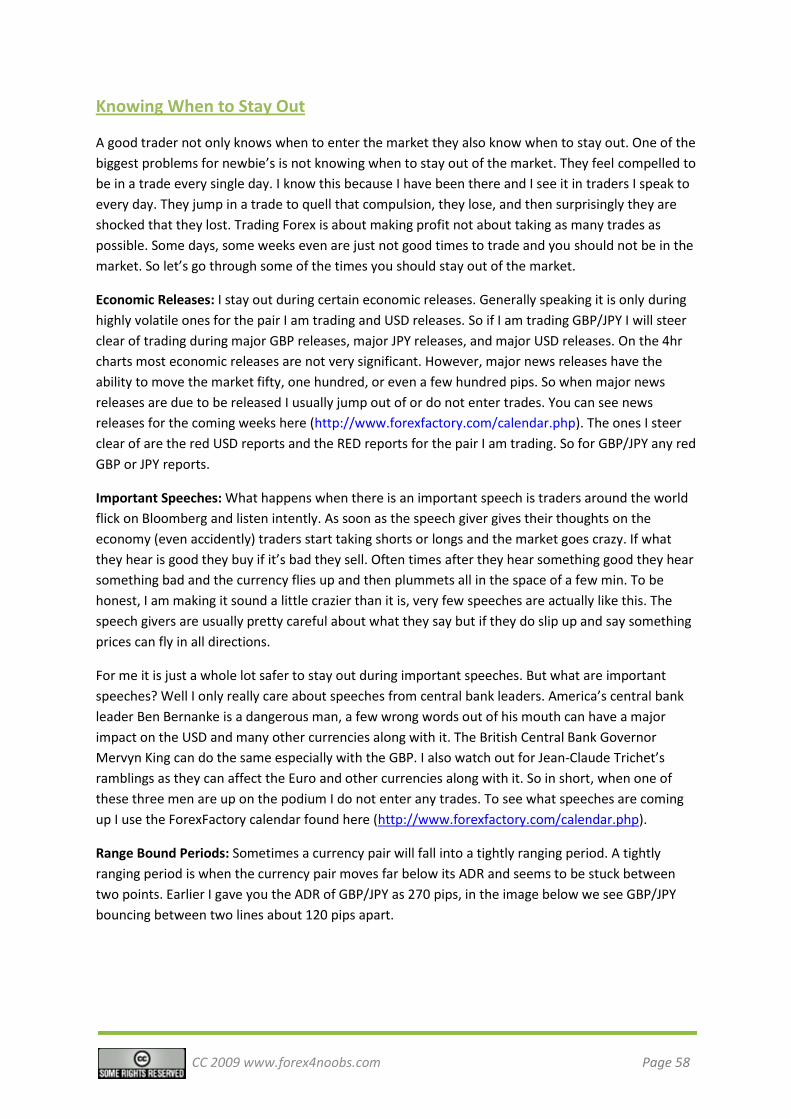
CC 2009 www.forex4noobs.com Page 58
Knowing When to Stay Out
A good trader not only knows when to enter the market they also know when to stay out. One of the
biggest problems for newbie’s is not knowing when to stay out of the market. They feel compelled to
be in a trade every single day. I know this because I have been there and I see it in traders I speak to
every day. They jump in a trade to quell that compulsion, they lose, and then surprisingly they are
shocked that they lost. Trading Forex is about making profit not about taking as many trades as
possible. Some days, some weeks even are just not good times to trade and you should not be in the
market. So let’s go through some of the times you should stay out of the market.
Economic Releases: I stay out during certain economic releases. Generally speaking it is only during
highly volatile ones for the pair I am trading and USD releases. So if I am trading GBP/JPY I will steer
clear of trading during major GBP releases, major JPY releases, and major USD releases. On the 4hr
charts most economic releases are not very significant. However, major news releases have the
ability to move the market fifty, one hundred, or even a few hundred pips. So when major news
releases are due to be released I usually jump out of or do not enter trades. You can see news
releases for the coming weeks here (http://www.forexfactory.com/calendar.php). The ones I steer
clear of are the red USD reports and the RED reports for the pair I am trading. So for GBP/JPY any red
GBP or JPY reports.
Important Speeches: What happens when there is an important speech is traders around the world
flick on Bloomberg and listen intently. As soon as the speech giver gives their thoughts on the
economy (even accidently) traders start taking shorts or longs and the market goes crazy. If what
they hear is good they buy if it’s bad they sell. Often times after they hear something good they hear
something bad and the currency flies up and then plummets all in the space of a few min. To be
honest, I am making it sound a little crazier than it is, very few speeches are actually like this. The
speech givers are usually pretty careful about what they say but if they do slip up and say something
prices can fly in all directions.
For me it is just a whole lot safer to stay out during important speeches. But what are important
speeches? Well I only really care about speeches from central bank leaders. America’s central bank
leader Ben Bernanke is a dangerous man, a few wrong words out of his mouth can have a major
impact on the USD and many other currencies along with it. The British Central Bank Governor
Mervyn King can do the same especially with the GBP. I also watch out for Jean-Claude Trichet’s
ramblings as they can affect the Euro and other currencies along with it. So in short, when one of
these three men are up on the podium I do not enter any trades. To see what speeches are coming
up I use the ForexFactory calendar found here (http://www.forexfactory.com/calendar.php).
Range Bound Periods: Sometimes a currency pair will fall into a tightly ranging period. A tightly
ranging period is when the currency pair moves far below its ADR and seems to be stuck between
two points. Earlier I gave you the ADR of GBP/JPY as 270 pips, in the image below we see GBP/JPY
bouncing between two lines about 120 pips apart.
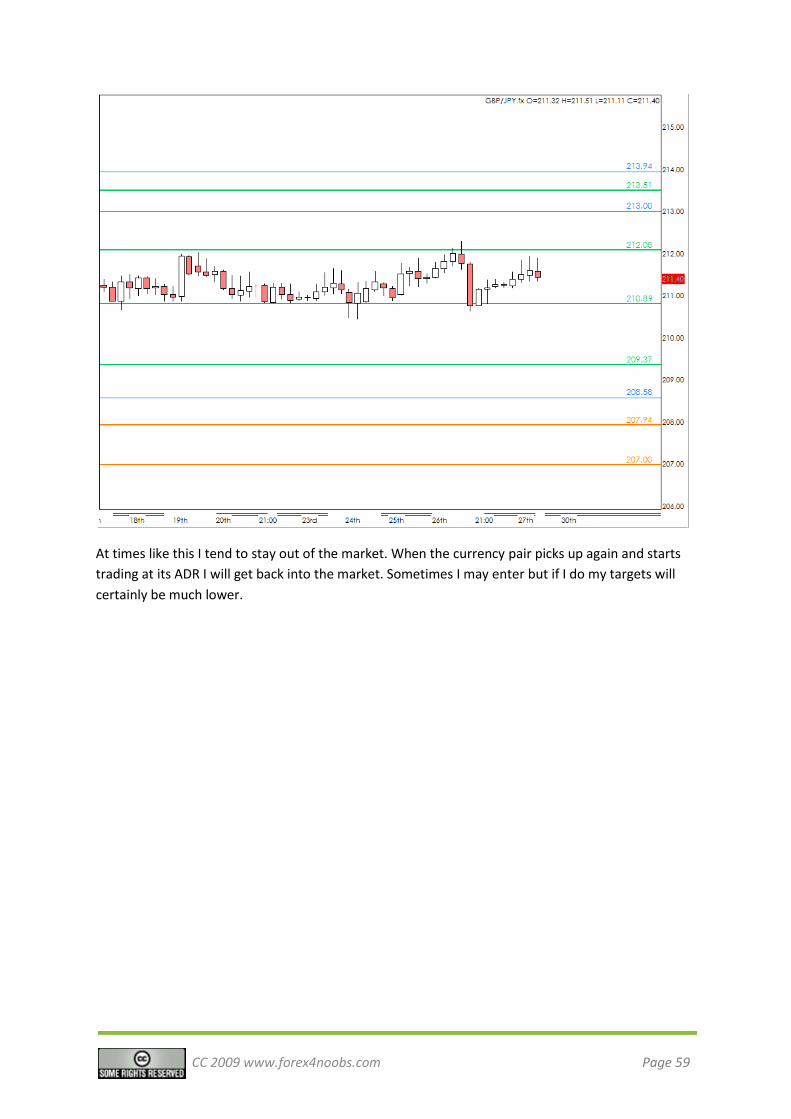
CC 2009 www.forex4noobs.com Page 59
At times like this I tend to stay out of the market. When the currency pair picks up again and starts
trading at its ADR I will get back into the market. Sometimes I may enter but if I do my targets will
certainly be much lower.

CC 2009 www.forex4noobs.com Page 60
Chapter 11: NickB Method Video Course
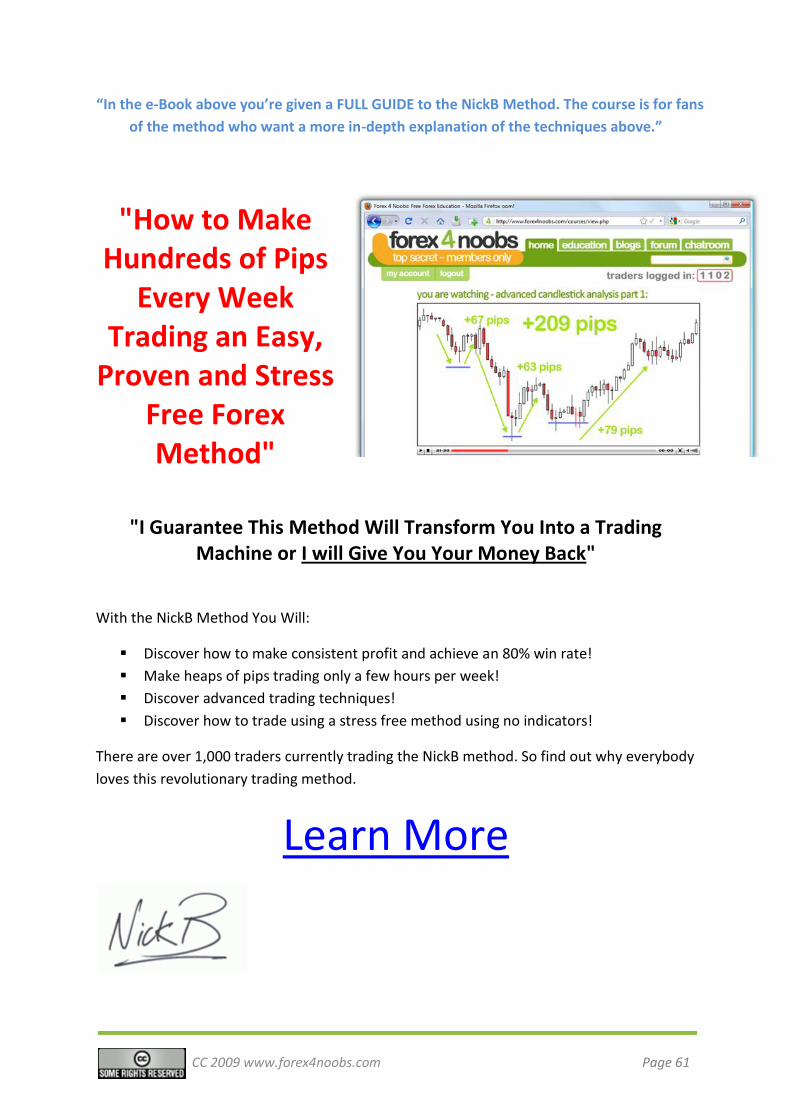
CC 2009 www.forex4noobs.com Page 61
"How to Make Hundreds of Pips
Every Week Trading an Easy,
Proven and Stress Free Forex Method"
"I Guarantee This Method Will Transform You Into a Trading Machine or I will Give You Your Money Back"
With the NickB Method You Will:
Discover how to make consistent profit and achieve an 80% win rate!
Make heaps of pips trading only a few hours per week!
Discover advanced trading techniques!
Discover how to trade using a stress free method using no indicators!
There are over 1,000 traders currently trading the NickB method. So find out why everybody
loves this revolutionary trading method.
Learn More
“In the e-Book above you’re given a FULL GUIDE to the NickB Method. The course is for fans
of the method who want a more in-depth explanation of the techniques above.”

CC 2009 www.forex4noobs.com Page 62
The End
I hope you enjoyed the e-Book and learned something valuable. Love it or hate it please leave a comment about it on this blog post. I would love to hear your thoughts on the book.