Embed Size (px)
Citation preview
UCRL-JC-139459
PREPRINT
NIF-scale hohlraum asymmetry studies usingpoint-projection radiograph of thin shells
Steve Pollaine, David Bradley, Otto Landen, Russell Wallace,Ogden Jones, Peter Amendt, Larry Suter and Robert Turner
Lawrence Livermore National LaboratoryLivermore, CA 94550
This paper wa! prepared for submittal to42nd Annual Meeting of the APS Division of Plamsa Physics
Quebec City, CanadaOctc,ber 23-27,2000
October 18,2000
This is a preprint of a paper intended for publication in ajo.maf or proceedings.Since changes may b. nmde before publication, this preprint is made available withLheunderstanding [hat it will not be citedor reproduced without the permission of the
author.
National Ignition Facility-scale hohlraum asymmetry
studies by thin shell radiography
Steve Pollaine, David Bradley, Otto Landen, Russell Wallace,
Ogden Jones, Peter Amendt, Larry Suter and Robert Turner
Lawrence Livermore National Laboratory
Abstract
A necessary condition for igniting indirectly-driven inertial confinement fusion (ICF)
capsules on the National Ignition Facility (NIF) is controlling drive asymmetry to the 1%
level [S. W. Haan, S. M. Pollaine, J. D. Lindl et al., “Design and modeling of ignition
targets for the National Ignition Facility,” Physics of Plasmas 2, 2480-7 (1995)]. Even
flux-asymmetry modes (e.g. Legendre modes P2,P4, P6 and P8) must be reduced by
hohlraum design and laser beam pointing. Odd flux-asymmetry modes (e.g. Legendre
modes P1, P3, P5, etc.) are theoretically removed by reflection symmetry across the
hohlraum midplane [S. M. Pollaine and D. Eimerl, “Modal analysis of power imbalance
and pointing errors for direct drive and tetrahedral hohlraums,” Nuclear Fusion 38 (10),
1523-30 (1998)], but will be produced by power imbalance, laser beam pointing errors,
and target fabrication errors. We are now conducting an experimental campaign on the
University of Rochester’s Omega laser to measure higher order (P4 and higher) flux
asymmetry modes inside hohlraums that approximate the conditions of a NIF hohlraum
during the 90-eV early drive phase[S. W. Haan, S. M. Pollaine, J. D. Lindl et al., “Design
and modeling of ignition targets for the National Ignition Facility,” Physics of Plasmas 2,
2480-7 (1995)]. These experiments use a new point-projection backlighting technique to
cast high quality 4.7 keV radiographs of thin 2 mm diameter Ge-doped CH shells
designed to enhance sensitivity to drive asymmetries. Distortions in the position of the
limb of the shells resulting primarily from drive asymmetries are measured to an
accuracy of 2 µm. The linearity and sensitivity of thin imploding shells to flux
asymmetry makes it possible to achieve this degree of accuracy, which is sufficient for
NIF ignition symmetry tuning. The promising results to date allow us to compare
measured and predicted distortions and by inference drive asymmetries for the first 8
asymmetry modes.
I. Introduction
The National Ignition Facility (NIF) is a 192 beam, 2 MJ 0.35 µm laser now being
built at Lawrence Livermore National Laboratory [1]. NIF is designed to drive inertial
confinement fusion (ICF) capsules to ignition using indirect drive, in which the laser
energy is converted to thermal x rays inside a cavity (hohlraum). The x rays then ablate
the outer layers of a capsule inside the hohlraum, causing the capsule to implode and
achieve ignition. One of the major sources of possible failure to achieve ignition is x-ray
flux asymmetry on the capsule. All flux asymmetry can be analyzed in terms of the
spherical harmonics Ylm. If the flux is azimuthally symmetric (such as in the NIF
baseline cylindrical hohlraum illuminated by rings of beams), only the m=0 components
exist and the flux asymmetry can be expressed in terms of the Legendre polynomials Pl.
In this paper, we will describe flux asymmetry in terms of the Legendre polynomial
coefficients al.
Because the cylindrical hohlraum is symmetric about the midplane, odd Legendre
modes are zero in the absence of pointing errors and power imbalance. Because higher
modes are smoothed out by radiation transport from the hohlraum walls to the capsule
(with a transfer function that goes roughly as mode-2.5 [2]), we are most concerned with
diagnosing and controlling P2, P4, P6 and P8 flux asymmetry (See Sec. VIII. for details).
Fig. 1 shows a typical NIF ignition capsule and the temperature drive profile.
Typically, three or four shocks keep the DT fuel on a low adiabat, so that the capsule may
reach roughly 1000 g/cc at ignition time. In addition, the fuel must be compressed
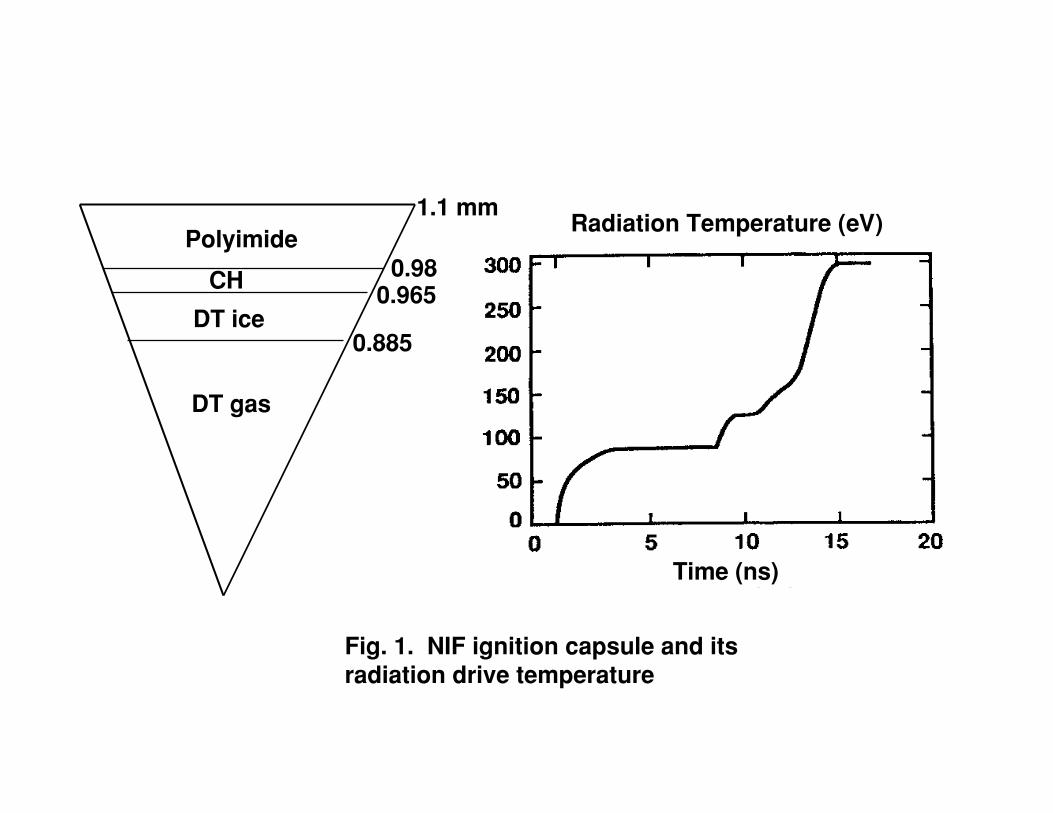
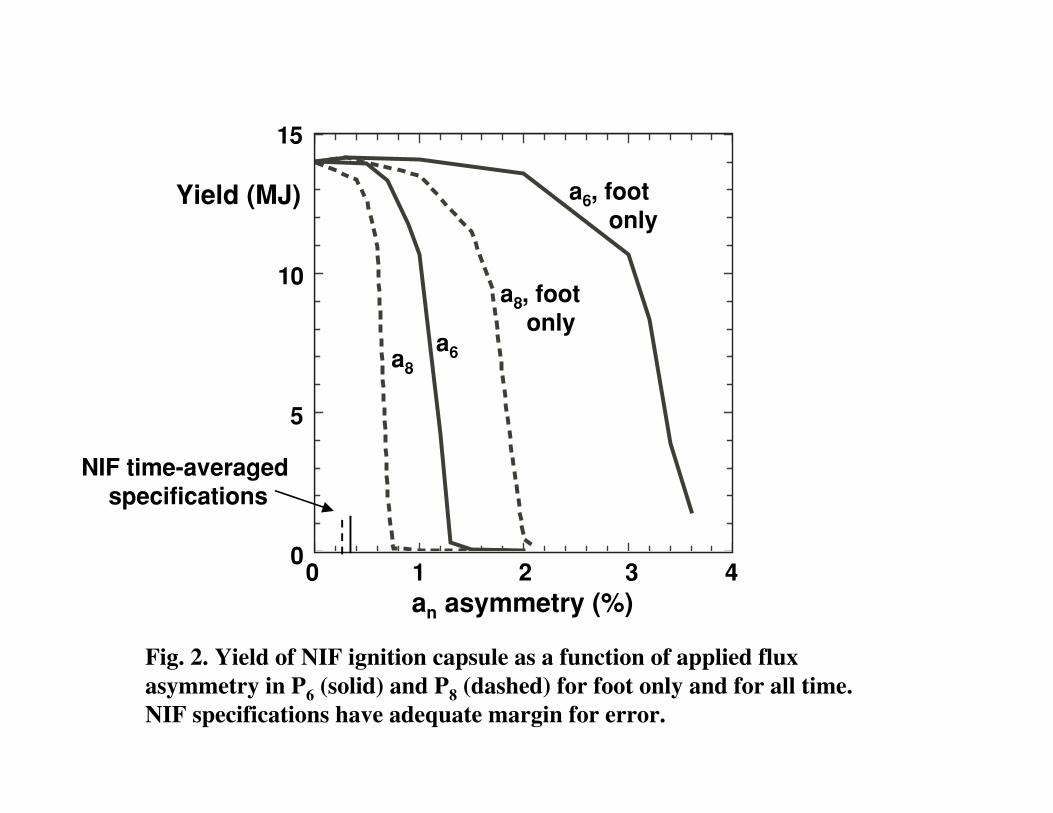
symmetrically to ensure such a high fuel density. For example, 2-D integrated radiation-
hydrodynamics simulations [3] show that the capsule will fail when the average Legendre
coefficient a6 is greater than 1% of a0, or when a8 is greater than 0.6% of a0, as illustrated
in Fig. 2. To provide for some margin of error, we have set the NIF specifications on
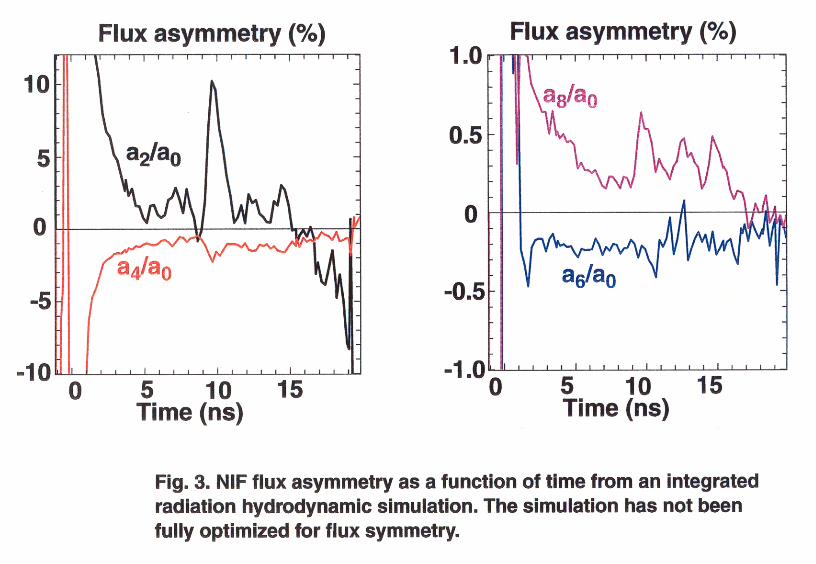
flux asymmetry as a2/a0 < 1.0%, a4/a0 < 0.5%, a6/a0 < 0.3 %, and a8/a0 < 0.25% [4]. Fig. 3
shows the Legendre coefficients as a function of time for one of our NIF integrated
radiation hydrodynamic simulations. This simulation has not been fully optimized for
flux symmetry.
II. Asymmetry Diagnostics
A variety of different techniques measure the symmetry in hohlraums using surrogate
capsules. The reemission ball [5] is a solid high Z (e.g. Bi) ball placed in the same
central location as an ICF capsule. Thermal radiation on the ball heats up its surface, and
it reemits as a blackbody at some slightly lower temperature, which will vary from point
to point on the ball if the incoming flux is asymmetric. When viewed in for example 2
keV x rays, the re-emission from the ball is highly sensitive to fluctuations around the
characteristic 90-300 eV incoming NIF drive temperatures. Thus small variations in
incoming flux are magnified, and can be measured as a function of time.
Another asymmetry diagnostic is the foam ball [6]. This is a solid sphere of low-
density SiO2 or CH. A converging shock produces a visible limb, and the radius of the
limb as a function of angle gives information about the incoming flux asymmetry as a
function of time. The speed of the shock varies as the square root of the incident flux and
as the inverse square root of the foam ball density, explaining why the sensitivity of the
technique is optimized by using foam (i.e. low densities).
A third asymmetry diagnostic is the imaging of imploded cores from a surrogate
capsule. For example, spherical hohlraums with tetrahedral illumination (four laser
entrance holes) have yielded triangular implosion images [7], showing that the part of the
capsule that lies under a laser entrance hole feels a reduced flux. The thickness of the
capsule shell can be varied to vary the sampling time [8]. In this paper, we will
concentrate on the latest addition to the array of symmetry diagnosis techniques, the thin
shell diagnostic. Table 1 below compares the demonstrated accuracy of the various
techniques for P2, P4, P6 and P8.
III. Thin shell asymmetry diagnostic
The thin shell diagnostic is a capsule with a radius r0 equal to or slightly larger relative
to the hohlraum radius than for the NIF capsule, and having a thickness of 10 to 100 µm
of doped plastic. A slightly larger radius enhances the imprinting of higher order modes
(e.g P6 and P8) as discussed later. The dopant (in this case Ge) provides radiographic
contrast and mitigates the effects of decompression due to preheat. Because the
acceleration is proportional to the ablation pressure divided by the areal mass density
ρdr∫ , and ρdr∫ is approximately conserved during the implosion, the shape of the thin-
shell capsule reflects the drive asymmetry. Thus there is less non-linear coupling between
the different modes, compared to shock-driven surrogates such as solid foam balls. This
is important because large but tolerable swings in P2 (e.g. 10% over 2 ns) won’t couple to
the higher order modes we want to measure with the thin shell.
A useful measure of linearity is the coefficient c in d
cαα
=dFF
, where α is the
measured observable (re-emitted flux F for re-emission sphere and distance traveled d for
the foam ball and thin shell diagnostics) and T4 is the flux driving the implosion (or
pressure for thin shell and foam ball). In a strictly linear system, c = 1. For a foam ball, c
= 1/2 because r ~ ∫√(Pr)dt since the shocked particle speed ~ √Pr. For the reemission
balls, we replace radius and pressure with the re-emitted flux F(hν) and incoming flux T4.
For a pure blackbody, F~exp(-hv/kT), so that dF
F
hv
kT
dT
T=
14
4
4 . For example, for a 200
eV hohlraum and hν = 2 keV, then c = 2.5. For a thin shell, c = 1 as long as ρdr∫ is
constant. This approximation is good, as the increase in ρdr∫ due to convergence tends
to cancel the decrease in ρdr∫ due to mass ablation, at least until the shell has converged
by a factor of 2.
Note that the measurement of flux asymmetry depends on the areal mass density being
constant over angle, not over time. As mass is ablated, the areal mass density decreases.
This decrease is enhanced where the flux is stronger. Then the acceleration will increase
both because of the stronger flux and the decreased areal mass density. Because of this
non-linear amplification, c increases from 1 to roughly 1.2.
Another way that nonlinearity could develop is if mass flowed in a transverse
direction due to the Rayleigh-Taylor instability [9]. Most of these models of Rayleigh-
Taylor growth assume an incompressible fluid (with or without density gradients), which
implies an infinite sound speed. In our experiments described below, the sound speed in
the driven shell is less than 30 µm/ns. In the relevant 4.5 ns time interval, pressure
inhomogeneities will propagate no more than 135 µm. For the shortest asymmetry mode
of interest, mode 8, the initial wavelength for the 800 µm shells used was 630 µm.
Becaues pressure inhomogeneities can travel only one fifth of a wavelength in the
transverse dimension, there is not enough time for the Rayleigh-Taylor instability to
grow. This lack of Rayleigh-Taylor growth is confirmed by 2-D hydrodynamic
simulations [3]. These show no growth beyond what is expected from a rocket model
[10], which has the nonlinear amplification discussed in the preceding paragraph.
In a thin shell, the outer part of the shell ablates, compressing the inner part of the
shell. For a typical CH(Ge) shell of ρ ≈ 1.3 g/cc driven by the 90 eV foot drive of the
NIF ignition hohlraum , the shell experiences a 1.2 to 1.4 Mb shock with a velocity jump
of 8 to 9 µm/ns. When the shock reaches the inside edge of the shell (at about t0 = 1.4 ns
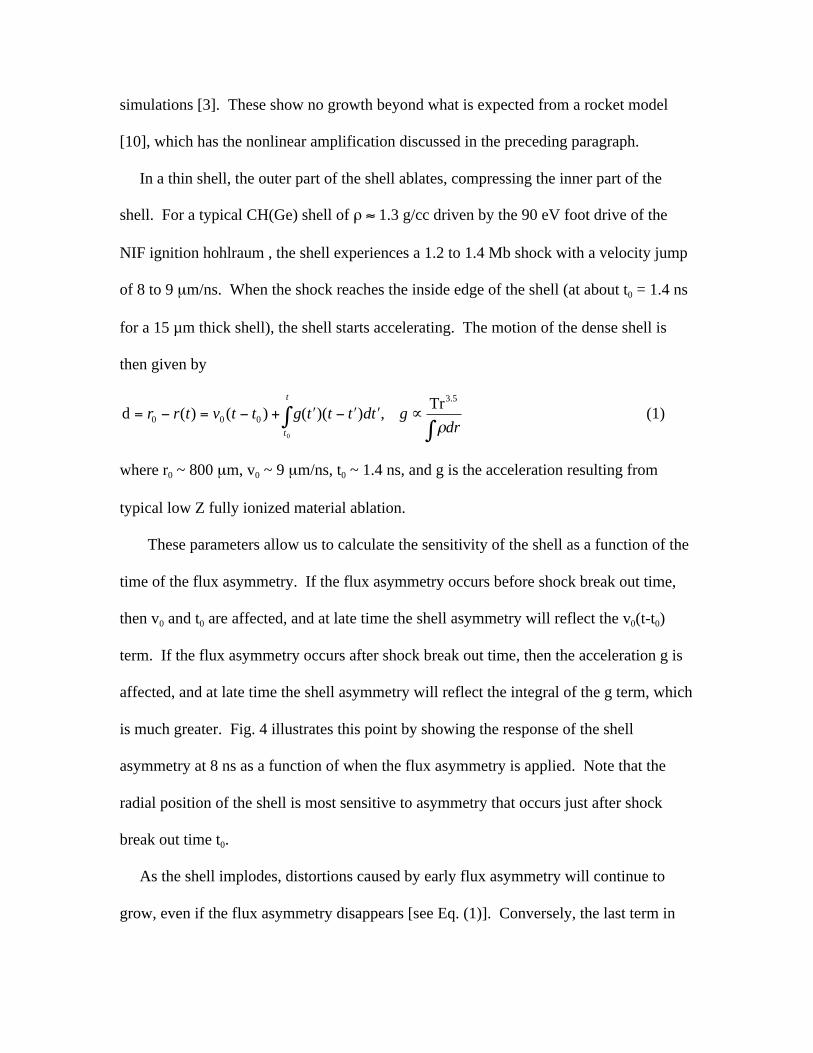
for a 15 µm thick shell), the shell starts accelerating. The motion of the dense shell is
then given by
dTr
= − = − + ′ − ′ ′ ∝∫∫
r r t v t t g t t t dt gdrt
t
0 0 0
3 5
0
( ) ( ) ( )( ) ,.
ρ(1)
where r0 ~ 800 µm, v0 ~ 9 µm/ns, t0 ~ 1.4 ns, and g is the acceleration resulting from
typical low Z fully ionized material ablation.
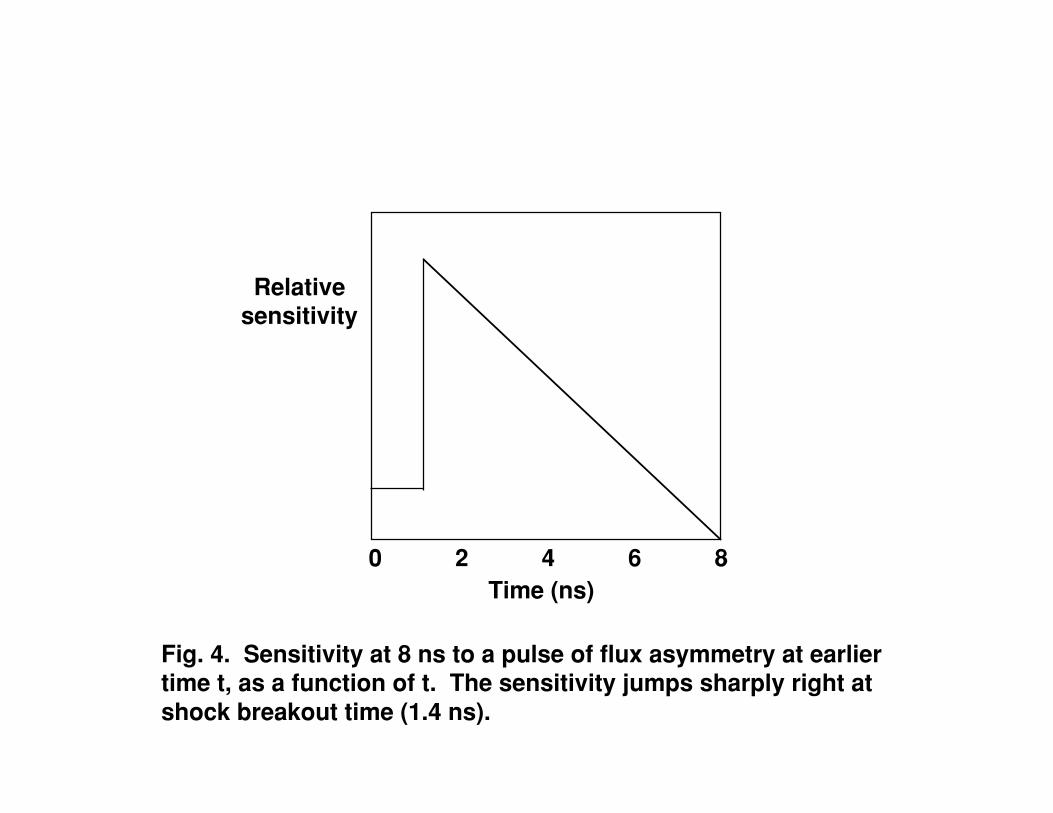
These parameters allow us to calculate the sensitivity of the shell as a function of the
time of the flux asymmetry. If the flux asymmetry occurs before shock break out time,
then v0 and t0 are affected, and at late time the shell asymmetry will reflect the v0(t-t0)
term. If the flux asymmetry occurs after shock break out time, then the acceleration g is
affected, and at late time the shell asymmetry will reflect the integral of the g term, which
is much greater. Fig. 4 illustrates this point by showing the response of the shell
asymmetry at 8 ns as a function of when the flux asymmetry is applied. Note that the
radial position of the shell is most sensitive to asymmetry that occurs just after shock
break out time t0.
As the shell implodes, distortions caused by early flux asymmetry will continue to
grow, even if the flux asymmetry disappears [see Eq. (1)]. Conversely, the last term in
Eq. (1) also shows that there can be some time integration of persisting asymmetries.
This means that the thin shell technique is less well suited to measuring modes whose
amplitude and/or sign change rapidly in time (e.g. with period τ shorter than the duration
of the acceleration before a measurement is taken). This is particularly true of the P2
component (for which a not applicable (NA) has been inserted in Table 1 under thin
shell). The more instantaneous records of asymmetry provided by the foam ball or re-
emission technique are more applicable for measuring the P2 swings. Fortunately, the
higher order modes such as P6 and P8 tend to remain at near constant values for many ns
in NIF ignition hohlraum simulations (see Fig. 3), making them ideally suited for
measurement by the thin shell technique.
The thickness of the shell can be varied to change the sampling time. However, if the
shell is too thin, the Rayleigh-Taylor instability (with modes > 400) will break up the
shell, and resolution of the limb will suffer. Our experiments suggest that an initial
thickness of 15 µm is optimum for the shell travel distance of 200 µm observed in the
experiments we are doing on the Omega laser at the Laboratory for Laser Energetics at
the University of Rochester.
We can increase the capsule/case ratio to enhance the effect of high-order flux
asymmetries. Fig. 5 shows the radiation transfer function for a capsule within a spherical
case for a capsule/case radii ratio of 0, 0.2, 0.4, and 0.6 in modes 0 through 8. Note that
by increasing the capsule/case ratio from a NIF-like value of 0.4 to 0.6, the sensitivity to
modes 6 and 8 are increased by an order of magnitude. The transfer function for a sphere
inside a cylinder, the usual hohlraum shape, is more complicated because the Legendre
polynomials and spherical harmonics are no longer the normal modes. However, when
cross-coupling between modes is taken into account, there is still an order of magnitude
increase in flux sensitivity to the higher modes with the higher capsule/case ratio. It
should also be noted that Fig. 5 implies a strong reduction in transfer function as the shell
implodes, which means that the sampling time for high order modes is even more peaked
at just after shock break-out time, as illustrated in Fig 4.
2-D radiation-hydrodynamics simulations [3] show that a driven thin shell magnifies
thickness variations, but not ripples on the surface that keep the thickness constant. For
example, a 0.1 µm variation in thickness in a 15 µm shell that travels 200 µm will cause a
distortion of 1.3 µm in radius, just below the limit of detectability.
IV. Experiments on Omega
We have run four sets of experiments with the thin shell diagnostic at the 60-beam
Omega laser at the Laboratory for Laser Energetics at the University of Rochester.
These experiments are designed to emulate the foot drive of the NIF ignition hohlraum
(see Fig. 1) while operating at close to NIF spatial scale to enhance detectability of shell
distortions. The capsule-to-case radii ratios are chosen to be between 0.5 and 0.6 to
enhance sensitivity to higher order modes (P6 and P8). In addition, the latest designs have
incorporated a predicted non-negligible few % P6 flux asymmetry component by
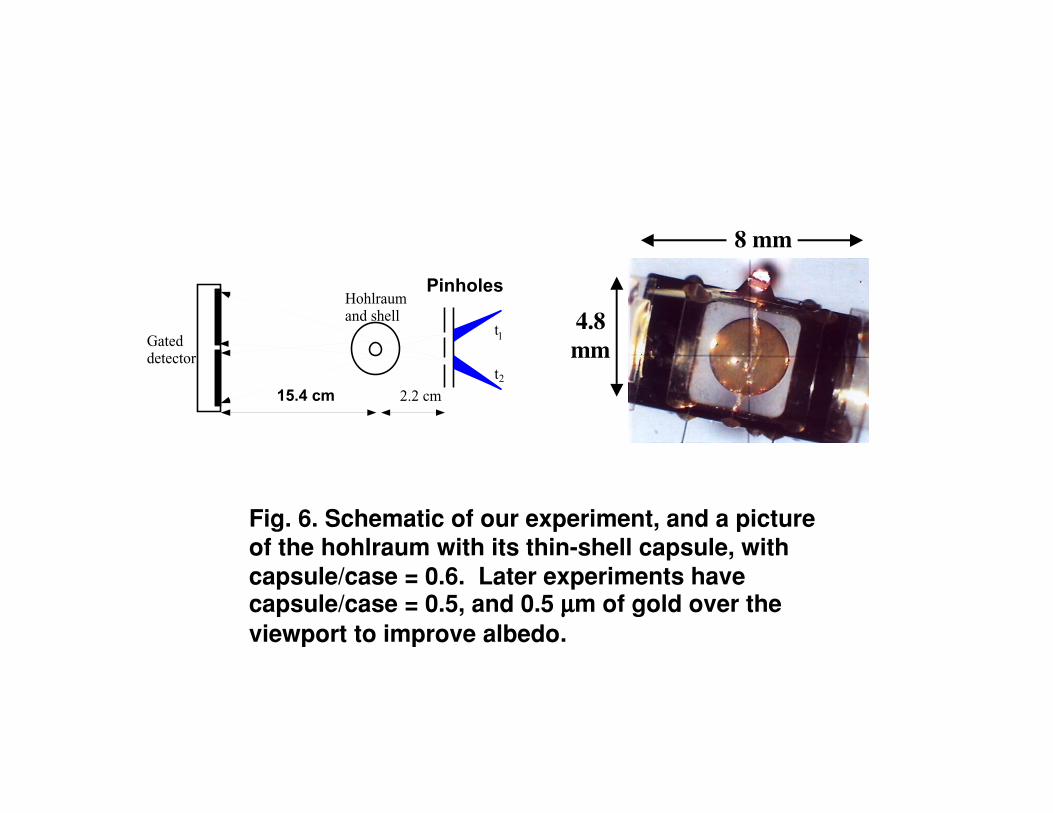
appropriate choice of beam pointing. Fig. 6 shows the basic arrangement. The hohlraum
is driven by several rings of laser beams at 23°, 48°, 59° and 62° relative to the hohlraum
symmetry axis. Twenty-four of the 60 beams heat the hohlraum from 0 to 3 ns, and
another 18 beams continue the heating from 3 to 6 ns. The staggering of beams is
imposed by the 3.5 ns limit on individual beam pulse lengths available at Omega. Four
or five of the remaining beams drive two Ti point-backlighters, which shine through two
50 µm pinholes [11]. The characteristic 4.7 keV Ti He α radiation projects 2 radiographs
of the thin-shell capsule through viewports on the hohlraum onto a two-frame gated
camera. One pinhole is illuminated around 3 ns, and the other is illuminated around 7 ns,
to produce two snapshots of the thin shell as it implodes. The overall time resolution is
240 ps, and the magnification of the image has varied from 5 to 8. The viewports on the
hohlraum are covered with 0.5 µm of Au to keep up the albedo and thus reduce the
asymmetry effect of the viewport holes on the capsule.
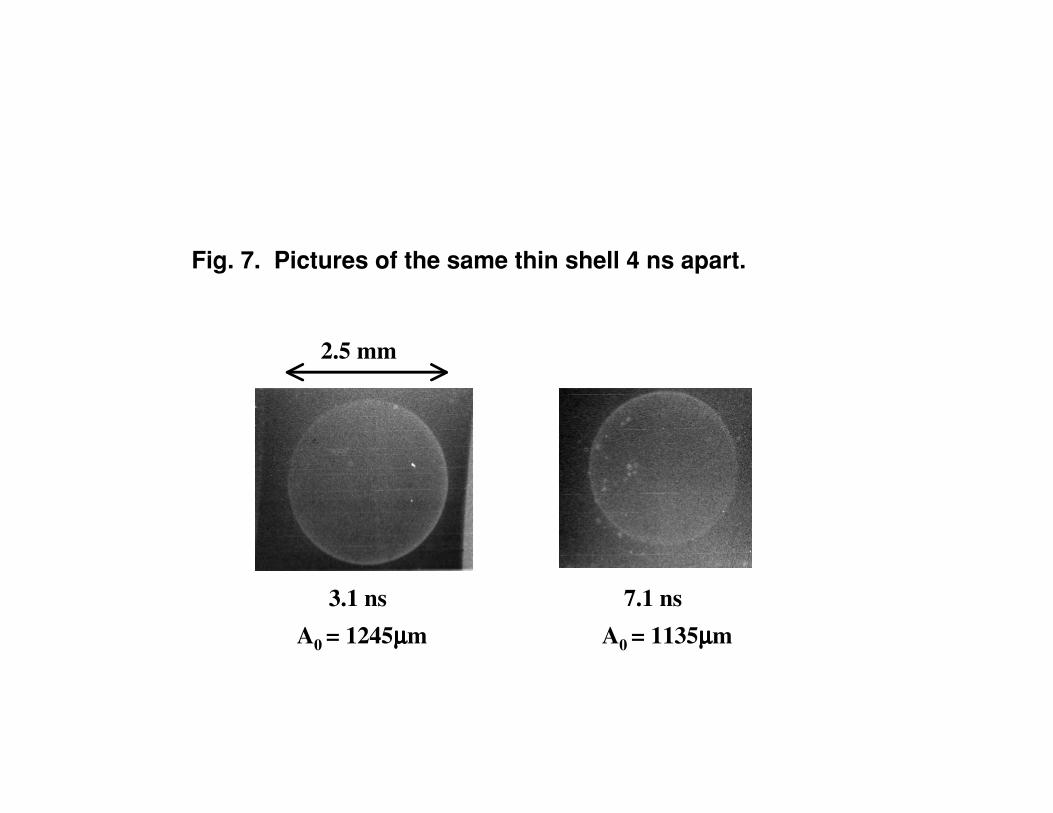
Over the past two years, we have improved our image quality. Backlit pinholes
produce a much higher signal/noise ratio than area backlighters [11], because one can use
a smaller backlighter spot size, which in turn allows for a much higher backlighter
intensity for a given laser power. By dividing our images by the flat field of the detector,
we have gained an additional 20% improvement in the measurement of the position of the
limb. Fig. 7 shows two pictures of one capsule taken 4 ns apart.
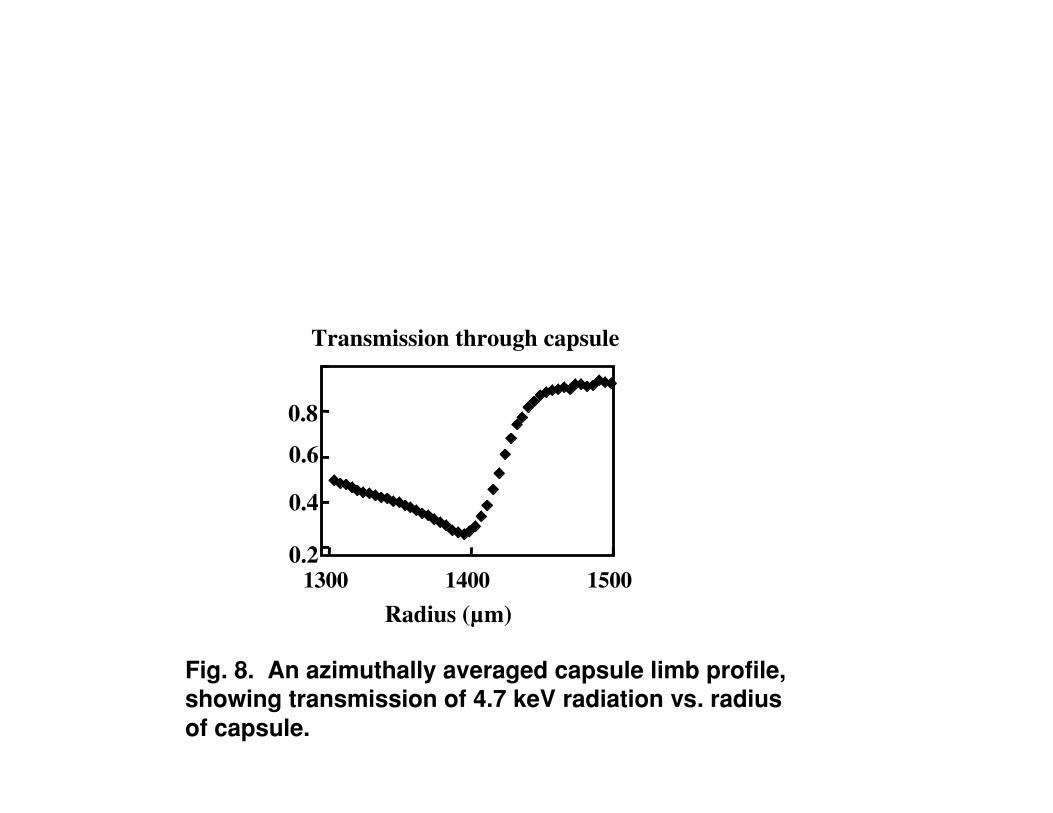
The limb position is analyzed as a function of angle. The polar averaged observed
width of the limb, shown in Fig. 8, is consistent with our simulation with 50 µm pinholes.
We extract the minimum position of the limb as a function of angle, as shown in Fig. 9.
This figure shows early (3.7 ns) and late-time (6.7 ns) limb position data vs. angle from a
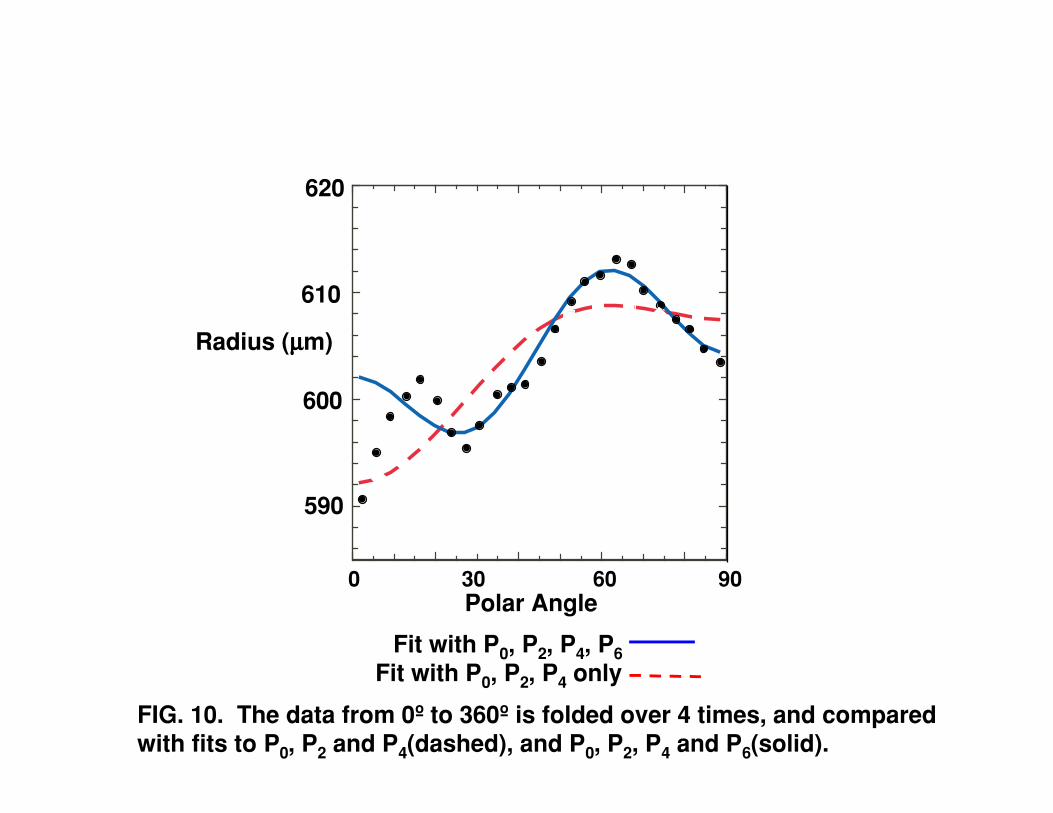
15 µm shell (shot 19083). Fig. 10 displays the 6.7 ns data with Legendre fits with and
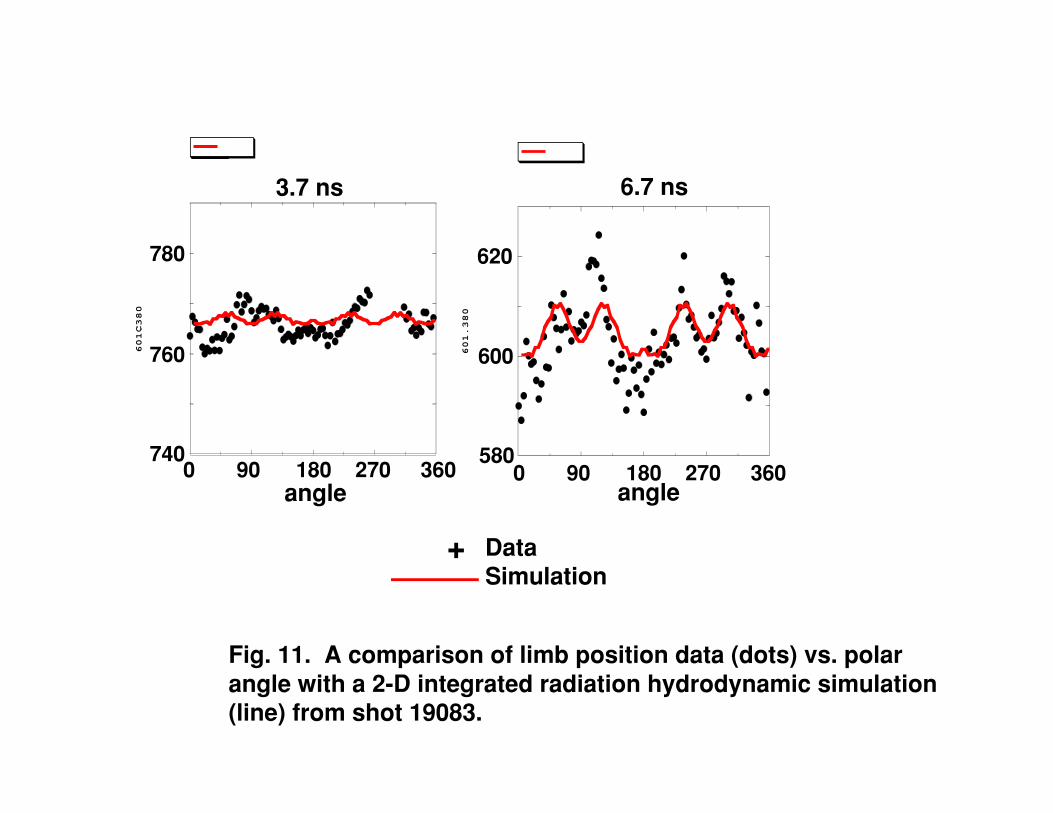
without mode 6 included. Clearly, including mode 6 improves the fit. Fig. 11 compares
late-time (6.7 ns) limb position data vs. angle with a 2-D integrated radiation-
hydrodynamic simulation [3]. There is good qualitative correspondence of various
features between experiment and simulation, and in particular, both show a 5-10 µm
positive a6 component corresponding to a –2.5 to -5% average P6. The data and
simulation show the following coefficients, in mm, in table 2 below.
V. Error analysis
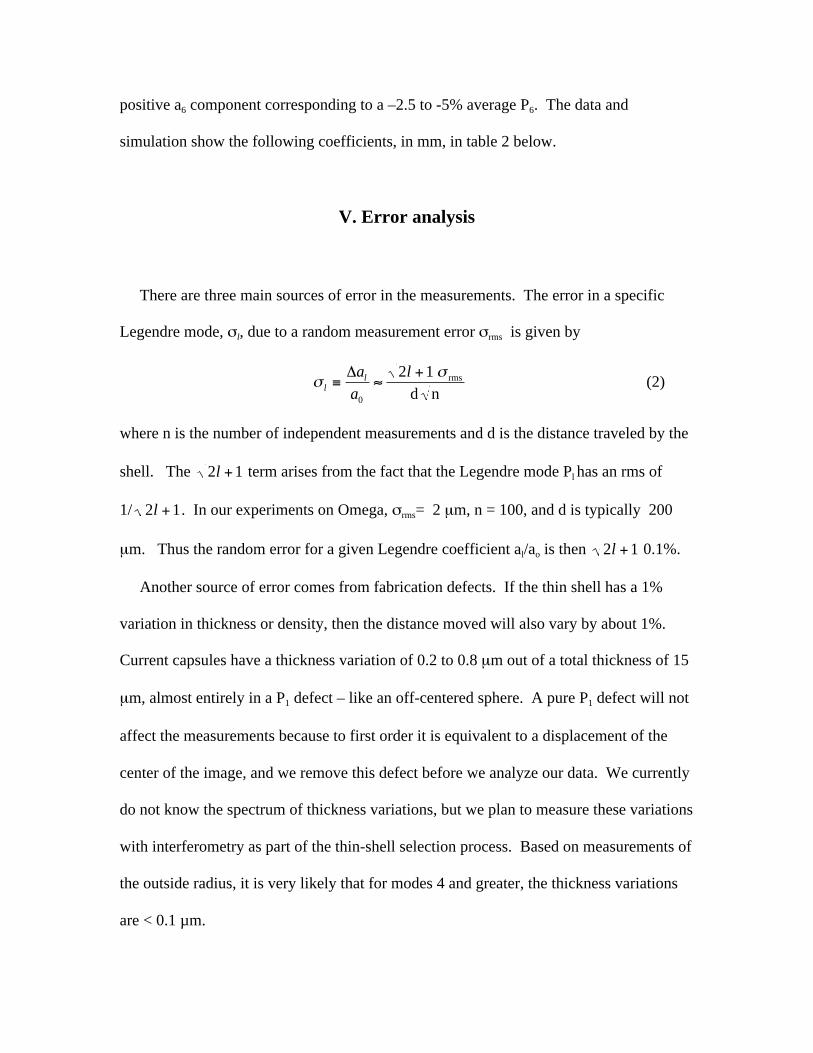
There are three main sources of error in the measurements. The error in a specific
Legendre mode, σl, due to a random measurement error σrms is given by
σσ
lla
a
l≡ ≈
+∆
0
2 1 rms
d n (2)
where n is the number of independent measurements and d is the distance traveled by the
shell. The 2 1l + term arises from the fact that the Legendre mode Pl has an rms of
1/ 2 1l + . In our experiments on Omega, σrms= 2 µm, n = 100, and d is typically 200
µm. Thus the random error for a given Legendre coefficient al/ao is then 2 1l + 0.1%.
Another source of error comes from fabrication defects. If the thin shell has a 1%
variation in thickness or density, then the distance moved will also vary by about 1%.
Current capsules have a thickness variation of 0.2 to 0.8 µm out of a total thickness of 15
µm, almost entirely in a P1 defect – like an off-centered sphere. A pure P1 defect will not
affect the measurements because to first order it is equivalent to a displacement of the
center of the image, and we remove this defect before we analyze our data. We currently
do not know the spectrum of thickness variations, but we plan to measure these variations
with interferometry as part of the thin-shell selection process. Based on measurements of
the outside radius, it is very likely that for modes 4 and greater, the thickness variations
are < 0.1 µm.
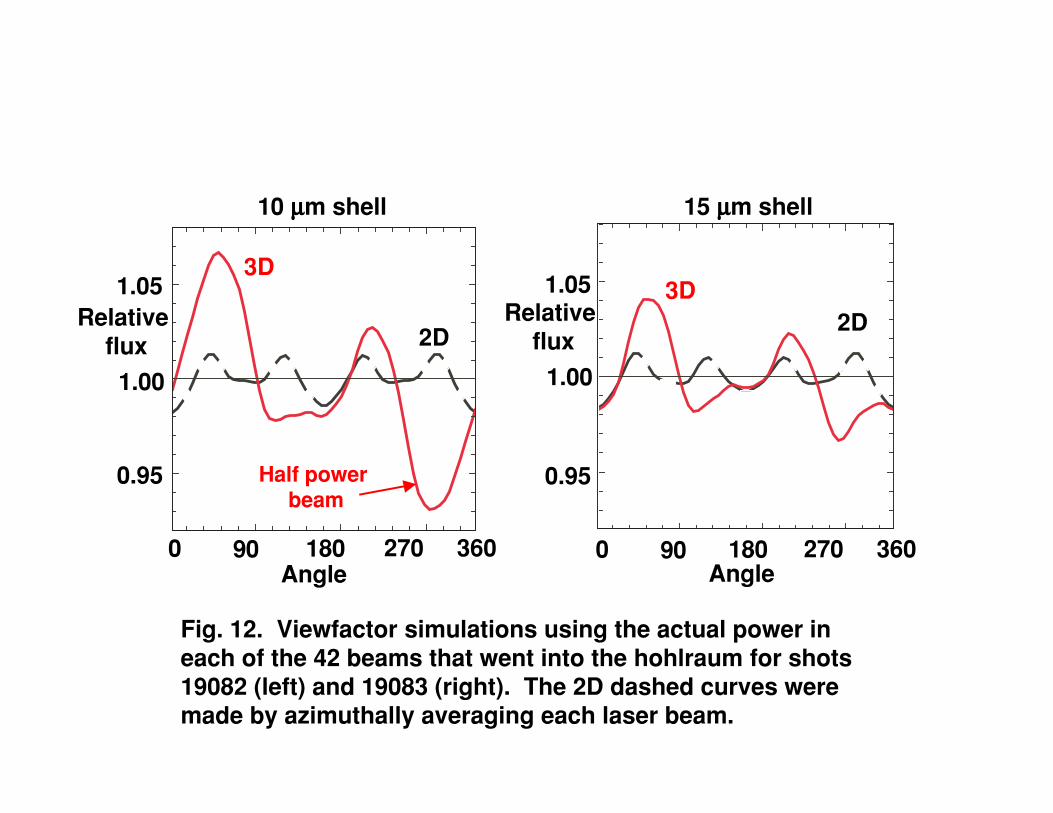
A third source of error comes from laser pointing errors and laser power imbalance.
Fig. 12 shows the results of calculations made with the 3-D viewfactor code GERTIE.
For two of the Omega shots in February 2000, a 10 µm shell (shot 19082) and a 15 µm
shell (shot 19083), the actual beam energies of each of the 42 beams entering the
hohlraum were taken and used to modulate the power going to the hohlraum wall
proportionately. The viewfactor code then calculated the resulting flux on the capsule.
The line of sight from the pinhole to the detector defines a great circle around the
capsule, which corresponds to the limb as seen in the images. The flux along this limb
was then compared in two cases: (1) the full 3-D version and (2) a 2-D version in which
each beam became an azimuthally symmetric ring. Fig. 12 compares the 2-D with the 3-
D version of the code at 3 ns, near the most sensitive time for the thin shells. Note that
the 2-D and 3-D versions are similar for shot 19083, but not for shot 19082. In shot
19082, one of the beams had only 130 J, compared to the average of all the other beams
of 248 J. This particular beam, unfortunately, was on the limb relative to the line of
sight, at an angle of 316°. This accounts for the large negative feature at around 300°
seen in the 3-D calculation. Thus the thin-shell technique requires decent power balance,
which of course will also be a requirement for ignition on NIF.
The two shots differed in one other significant way as well. Shot 19083, with the 15
µm thick shell, showed a random measurement error of 3.0 µm at 6.7 ns, whereas shot
19082, with the 10 µm thick shell, showed a random measurement error of 7.3 µm at 6.7
ns. We believe this suggests that the thinner shell started breaking up due to the
Rayleigh-Taylor instability [12], whereas the thicker shell remained intact.

VI. Extension to NIF
To apply Eq. (2) to the effect of random measurement errors on NIF, we need to
calculate how the shell travel distance d scales with different drives. To calculate a rough
value for d, we employ a simple model in which the acceleration g is constant. Then d =
0.5 gt2, with g proportional to ablation pressure / ρh, with h the thickness of the shell.
The ablation pressure is proportional to the radiation drive temperature to the 3.5 power
[13]. Finally, note that the shell thickness h must be thick enough to avoid Rayleigh-
Taylor breakup of the shell; thus d/h must be some fixed value c [12]. Substituting
d= c h yields the relation d ~T1.75 t. Table 3 below makes use of this relationship to give
the expected sensitivity of the thin shell technique on NIF. On the foot (peak), d = 240
(715) µm. This means that if we have the same random measurement error of 2 µm on
NIF, we have an expected measurement accuracy on the foot (peak) of
2 1l + 0.1 (0.03) %. This is a factor of two better than what is required for meeting the
NIF specification of 0.25% for P8, the most stringent case.
Since the sensitivity of the thin shell is peaked near shock break-out time, one would
sample different episodes of the NIF drive by using a variety of shell thicknesses h
spanning the range one can infer from Table 3 (i.e. from ≈15 to ≈ 60 µm).
With perfect power balance and pointing, NIF will have 16 beams evenly spaced in
azimuth in three planes: the hohlraum symmetry plane at the center, and one halfway
between the symmetry plane and the laser entrance hole on each side. We expect roughly
50% modulation of intensity on the hohlraum wall, which (from viewfactor calculations)
translates to less than 0.2% modulation on the capsule. This is good enough that we can
consider the illumination to be 2-D. Then our measurements of the Legendre coefficients
will be meaningful. The expected 10% power imbalance per beam and 50 µm pointing
errors results in a flux asymmetry on the capsule of 0.9, 0.8, 0.7, 0.4, and 0.15% rms for
modes 1-5, and less than 0.07% for all remaining modes. This will limit our
measurements of the “intrinsic” a2 and a4 Legendre coefficients to these values of 0.8%
and 0.4%. If the power balance and pointing errors are much worse than expected, we
will see the effect of these errors in our measurements.
VII. Conclusions
Our current OMEGA experimental campaign is developing the thin shell diagnostic
for use on NIF with the needed accuracy. The thin shell diagnostic has the advantage of
linearity over alternative measurement techniques, so low-order modes will not corrupt
the measurement of high-order modes. As a demonstration of the utility of the technique,
we have successfully designed an experiment to detect the higher order P6 mode.
Although our current random measurement errors are adequate, better comparisons of
current data with simulations would require 3D codes. A better approach planned for the
future is to take advantage of improvements in power balance at Omega to gather better
data for which 2D modeling is sufficient. In addition, we will step up efforts for more
thorough characterization of thin shell thickness uniformity. Other planned
improvements include switching to a single gated frame per shot to provide more signal
and more magnification, leading to better signal-to-noise; switching to a Gd patch instead
of a Au patch for a 3x increase in Ti backlighter throughput; and implementing an
improved alignment strategy for the backlit pinhole technique. We also hope to use the
thin shell technique to quantify shifts and improvements in symmetry from using higher
albedo hohlraum wall mixtures [14].
VIII. Appendix: Spectrum Scaling
Fig. 13 shows the flux from the hohlraum wall of a typical NIF simulation at 5 ns,
towards the end of the foot, as a function of angle as seen from the hohlraum center. The
lack of flux near 0° comes from the laser entrance hole, and the peak around 40° is x-ray
emission resulting from the outer ring of laser beams. Fig. 14 shows the spectrum of this
wall flux as Legendre coefficient vs. mode number. This spectrum scales roughly as
mode number 1/2, at least to mode numbers of 100 or so. Fig. 15 shows the radiation
transfer function for a capsule/case ratio of 0 and 0.4. This function scales like mode
number–5/2. Fig. 16 shows the expected flux asymmetry spectrum on the capsule, which
is the hohlraum wall spectrum times the radiation transfer function. This spectrum scales
roughly as mode number–3. Fig. 16 also shows the NIF specifications, which scales more
slowly as mode number–1. This comparison shows that we need only be concerned with
mode numbers less than or equal to 8.
Acknowledgements
We thank the Laboratory for Laser Energetics, University of Rochester, for the use of the
Omega laser. We also thank the referee for his clarifying comments.
This work was performed under the auspices of the U.S. Department of Energy by the
Lawrence Livermore National Laboratory under Contract No. W-7405-ENG-48.
References
[1] J.D. Kilkenny, T.P. Bernat, B.A. Hammel et al, “Lawrence Livermore National
Laboratory’s Activities to Achieve Ignition by X-Ray Drive on the National Ignition
Facility”, Laser and Part. Beams 17(2), 159-171 (1999), and J.D. Kilkenny, E.M.
Campbell, J.D. Lindl et al, “The Role of the National Ignition Facility in Energy
Production From Inertial Fusion”, Phil. Trans. Royal Soc. of London 357(1752), 533-553
(1999); and J.A. Paisner, J.D. Boyes, S.A. Kumpan, jW.H. Lowdermilk, M.S. Sorem,
Laser Focus World 30, 75 (1994).
[2] S.M. Pollaine, “Radiation Transport Between Two Concentric Spheres”, Nuclear
Fusion 40, 2061 (2000).
[3] G.B. Zimmerman and W.L. Kruer, “Numerical Simulation of Laser-Initiated
Fusion”, Comments Plasma Phys. Control. Fusion 2, 51-61 (1975).
[4] S.W. Haan, private communication.
[5] N.D. Delamater, G.R. Magelssen and A.A. Hauer, “Reemission technique for
symmetry measurements in Hohlraum targets containing a centered high-Z ball”, Phys.
Rev. E 53, 5240 (1996).
[6] P. Amendt, S.G. Glendinning, B.A. Hammel, O. Landen, and L.J. Suter, “Direct
Measurement of X-Ray drive from Surrogate Targets in Nova Hohlraums”, Phys. Rev.
Lett. 77, 3815 (1996).
[7] S.M. Pollaine, M.M. Marinak and D.H. Munro, “3-D Simulations of Tetrahedral
Hohlraums”, Bull. Am. Phys. Soc. 42, 1993 (1997).
[8] A. Hauer, N. Delamater, D. Ress et al., “Review of drive symmetry
measurement and control experiments on the Nova laser system”, Rev. Sci.
Instrum. 66, 672-7 (1995); and N. D. Delamater, T. J. Murphy, A. A. Hauer et al.,
“Symmetry experiments in gas-filled hohlraums at NOVA”, Physics of Plasmas 3, 2022-
8 (1996); R. Turner, P. Amendt, O.L. Landen, S.G. Glendinning, P. Bell, C. Decker, B.A.
Hammel, D. Kalantar, D. Lee, et. al., “Demonstration of time-dependent symmetry
control in hohlraums by drive-beam staggering”, Physics of Plasmas 7, 333-337, (2000).
[9] K.O. Mikaelian,”Simple model for ablative stabilization”, Phys. Rev. A 46, 6621
(1992); D. Colombant, W. Manheimer, and E. Ott, “Three-Dimensional, Nonlinear
Evolution of the Rayleigh-Taylor Instability of a Thin Layer”, Phys. Rev. Lett. 53, 446.
(1984).
[10] P. Amendt, A. Shestakov, O. Landen, S. Pollaine, D.K. Bradley, L. Suter and R.E.
Turner, “Implosion target surrogacy studies on Omega for the National Ignition Facility:
backlit thinshells”, submitted to Phys. PLasmas (2001).
[11] O. L. Landen, D.R. Farley, S.G. Glendinning, L.M. Logory, P.M. Bell, J.A. Koch,
F.D. Lee, D.K. Bradley, D.H. Kalantar, C.A. Back, and R.E. Turner, “X-Ray
Backlighting for the National Ignition Facility”, Rev. Sci. Instrum. 72, 627-634 ( 2001);
A. B. Bullock, O.L.Landen, and D.K. Bradley, “10 µm and 5 µm Pinhole-Assisted Point-
Projection Backlit Imaging for the National Ignition Facility”, Rev. Sci. Instrum. 72, 690-
693 (2001).
[12] D.L. Youngs, “Numerical Simulation of turbulent Mixing by Rayleigh-Taylor
Instability”, Physica 12D, 32-44 (1984); K.I. Read, “Experimental Investigation of
Turbulent Mixing by Rayleigh-Taylor Instability”, Physica 12D, 45-48 (1984).

[13] J. Lindl, “Development of the indirect-drive approach to intertial confinement fusion
and the target physics basis for ignition and gain”, Physics of Plasmas 2(11), 3933-4024
(1995).
[14] H. Nishimura, T Endo, H. Shiraga, Y. Kato and S. Nakai, “X-ray emission from
high-Z mixture plasmas generated with intense blue laser light”, Appl. Phys. Lett. 62(12),
1344-1346 (1993); and T.J. Orzechowski, M.D. Rosen, H.N. Kornblum et al, “The
Rosseland Mean Opacity of a Mixture of Gold and Gadolinium at High Temperatures”,
Phys. Rev. Lett. 77, 3545 (1996).

Table 1. Experimental accuracy demonstrated at Nova/Omega, scaled to NIF, for the
four asymmetry diagnostics discussed in this paper. The first column is the accuracy to a
P2 perturbation that lasts for 2 ns, either on the foot or at the peak. The remaining
columns show both the accuracy to a perturbation that lasts for the entire length of the
XSfoot (top value), and the response to the perturbation being constant for all time
(bottom value in parenthesis).
P2,2 ns
Foot
(peak)
P2
Foot only
(all time)
P4
Foot only
(all time)
P6
Foot only
(all time)
P8
Foot only
(all time)
NIF ignition requirement 10%
(10%)
2%
(1%)
1%
(0.5%)
0.7%
(0.33%)
0.5%
(0.25%)
Reemission ball 3%
Foam Ball 5%
(2.5%)
0.5%
(0.5%)
0.6%
(0.6%)
Imploded Core NA 0.25%
(0.25%)
Thin Shell NA 0.5% 0.6% 0.7% 0.8%
Table 2. Comparison of Legendre coefficients in microns between data and simulation.
data simulation
a2 -7.6 -2.7

a4 -6.2 -7.7
a6 10.0 5.0
a8 -2.7 0.0
Table 3. An extension of the Omega parameters to NIF for similar-density shells shows
that if we eliminate systematic errors, and can maintain 2 µm accuracy in each
measurement of limb position, then we can accurately measure asymmetry to better than
NIF specifications.
Omega NIF foot / spec NIF peak / spec
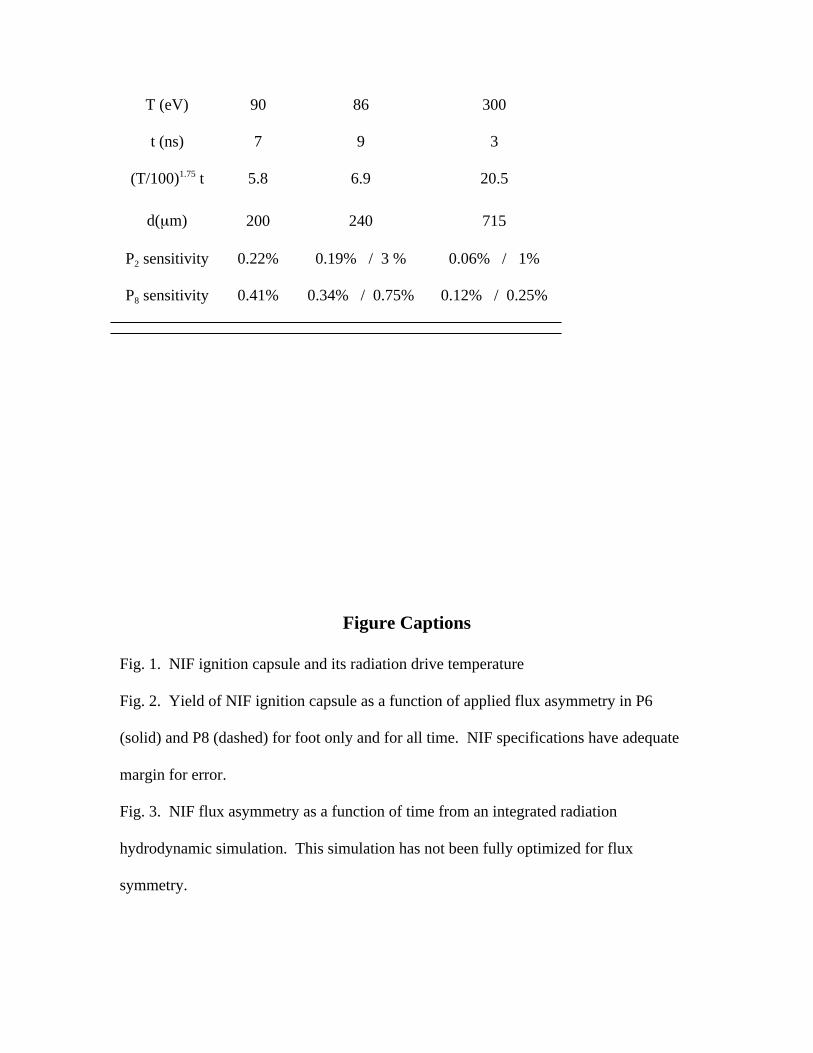
T (eV) 90 86 300
t (ns) 7 9 3
(T/100)1.75 t 5.8 6.9 20.5
d(µm) 200 240 715
P2 sensitivity 0.22% 0.19% / 3 % 0.06% / 1%
P8 sensitivity 0.41% 0.34% / 0.75% 0.12% / 0.25%
Figure Captions
Fig. 1. NIF ignition capsule and its radiation drive temperature
Fig. 2. Yield of NIF ignition capsule as a function of applied flux asymmetry in P6
(solid) and P8 (dashed) for foot only and for all time. NIF specifications have adequate
margin for error.
Fig. 3. NIF flux asymmetry as a function of time from an integrated radiation
hydrodynamic simulation. This simulation has not been fully optimized for flux
symmetry.
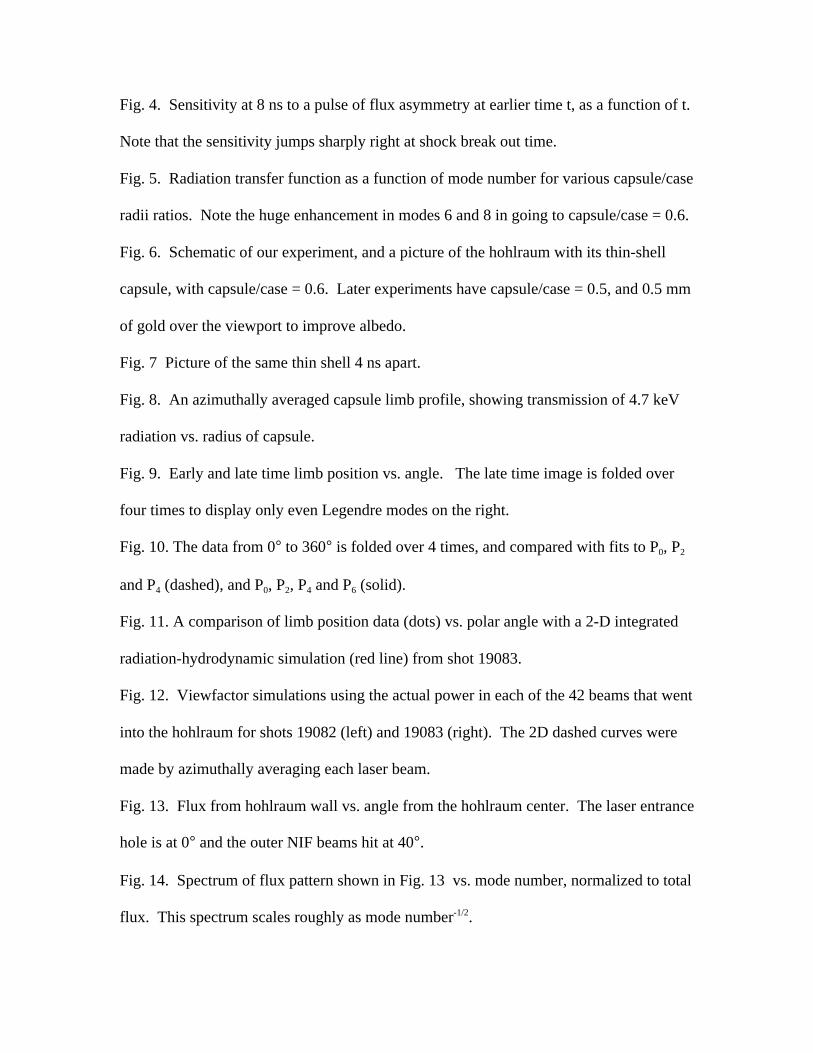
Fig. 4. Sensitivity at 8 ns to a pulse of flux asymmetry at earlier time t, as a function of t.
Note that the sensitivity jumps sharply right at shock break out time.
Fig. 5. Radiation transfer function as a function of mode number for various capsule/case
radii ratios. Note the huge enhancement in modes 6 and 8 in going to capsule/case = 0.6.
Fig. 6. Schematic of our experiment, and a picture of the hohlraum with its thin-shell
capsule, with capsule/case = 0.6. Later experiments have capsule/case = 0.5, and 0.5 mm
of gold over the viewport to improve albedo.
Fig. 7 Picture of the same thin shell 4 ns apart.
Fig. 8. An azimuthally averaged capsule limb profile, showing transmission of 4.7 keV
radiation vs. radius of capsule.
Fig. 9. Early and late time limb position vs. angle. The late time image is folded over
four times to display only even Legendre modes on the right.
Fig. 10. The data from 0° to 360° is folded over 4 times, and compared with fits to P0, P2
and P4 (dashed), and P0, P2, P4 and P6 (solid).
Fig. 11. A comparison of limb position data (dots) vs. polar angle with a 2-D integrated
radiation-hydrodynamic simulation (red line) from shot 19083.
Fig. 12. Viewfactor simulations using the actual power in each of the 42 beams that went
into the hohlraum for shots 19082 (left) and 19083 (right). The 2D dashed curves were
made by azimuthally averaging each laser beam.
Fig. 13. Flux from hohlraum wall vs. angle from the hohlraum center. The laser entrance
hole is at 0° and the outer NIF beams hit at 40°.
Fig. 14. Spectrum of flux pattern shown in Fig. 13 vs. mode number, normalized to total
flux. This spectrum scales roughly as mode number-1/2.

Fig. 15. Radiation transfer function from wall to capsule for sphere within a sphere for
capsule/case ratios of 0 (straight line) and 0.4. Transfer function for sphere in cylinder
mixes modes, but the decrease follows same power law, namely mode number-2.5.
Fig. 16. Flux asymmetry spectrum on capsule is roughly the product of the wall
spectrum (Fig. 14) times the radiation transfer function (Fig. 15), and goes like mode
number –3. The NIF specifications (straight line) go like mode number-1.
Radiation Temperature (eV)
Time (ns)Time (ns)
Fig. 1. NIF ignition capsule and itsradiation drive temperature
Polyimide
CH
DT ice
DT gas
1.1 mm
0.980.965
0.885
0 1 2 3 40
5
10
15
Yield (MJ)
NIF time-averaged specifications
a8a6
a8, foot only
a6, foot only
an asymmetry (%)
Fig. 2. Yield of NIF ignition capsule as a function of applied fluxasymmetry in P6 (solid) and P8 (dashed) for foot only and for all time.NIF specifications have adequate margin for error.
0 2 4 6 8
Fig. 4. Sensitivity at 8 ns to a pulse of flux asymmetry at earliertime t, as a function of t. The sensitivity jumps sharply right atshock breakout time (1.4 ns).
Time (ns)
Relativesensitivity

Fig. 5. Radiation transfer function as a function ofmode number for various capsule/case radii ratios.Note the huge enhancement in modes 6 and 8 withcapsule/case = 0.6.
0 2 4 6 8
0.0
0.5
1.0
A: plg, u(,1), nB: plg, u(,2), nC: plg, u(,3), nD: plg, u(,4), n0
Mode
Radiation transfer function
0
0.40.2
0.6
NIF-like
8 mm
4.8mm
12 cm 2.2 cm
Backlit pinholes
t
t
Gated detector
Hohlraum and shell
a)
1
2
15.4 cm
Pinholes
Fig. 6. Schematic of our experiment, and a pictureof the hohlraum with its thin-shell capsule, withcapsule/case = 0.6. Later experiments havecapsule/case = 0.5, and 0.5 µµµµm of gold over theviewport to improve albedo.
3.1 ns 7.1 ns
2.5 mm
A0 = 1245µµµµm A0 = 1135µµµµm
Fig. 7. Pictures of the same thin shell 4 ns apart.
Radius (µm)1300 1400 1500
Transmission through capsule
Fig. 8. An azimuthally averaged capsule limb profile,showing transmission of 4.7 keV radiation vs. radiusof capsule.
0.2
0.4
0.8
0.6

0 90 180 270 360580
620
600
6.7 ns
0 90 180 270 360740
760
780
3.7 ns
C
Polar angle0 30 60 90
590
600
610
C
620
Fig. 9. Early and late time limb positions vs. angle. The latetime image is folded over four times to display only even Legendre modes on the right.
�� ��� ��� ��� ���
����
����
���
����
o: plg, y83b4(,1), ang4B: plg, m4, ang4C: plg, m6, ang4Fit with P0, P2, P4, P6
Fit with P0, P2, P4 only
0 30 60 90Polar Angle
590
610
600
Radius (µµµµm)
620
FIG. 10. The data from 0º to 360º is folded over 4 times, and comparedwith fits to P0, P2 and P4(dashed), and P0, P2, P4 and P6(solid).
C
0 90 180 270 360740
760
780
3.7 ns
angle
601.380
Fig. 11. A comparison of limb position data (dots) vs. polarangle with a 2-D integrated radiation hydrodynamic simulation(line) from shot 19083.
0 90 180 270 360
600
620
580
6.7 ns
angle601.380
DataSimulation
+
0 90 180 270 360
1.00
1.05
0.95
Angle
1.00
1.05
0.95
0 90 180 270 360Angle
10 µµµµm shell 15 µµµµm shell
2D
3D3D
2DRelative flux
Relative flux
Half power beam
Fig. 12. Viewfactor simulations using the actual power ineach of the 42 beams that went into the hohlraum for shots19082 (left) and 19083 (right). The 2D dashed curves weremade by azimuthally averaging each laser beam.
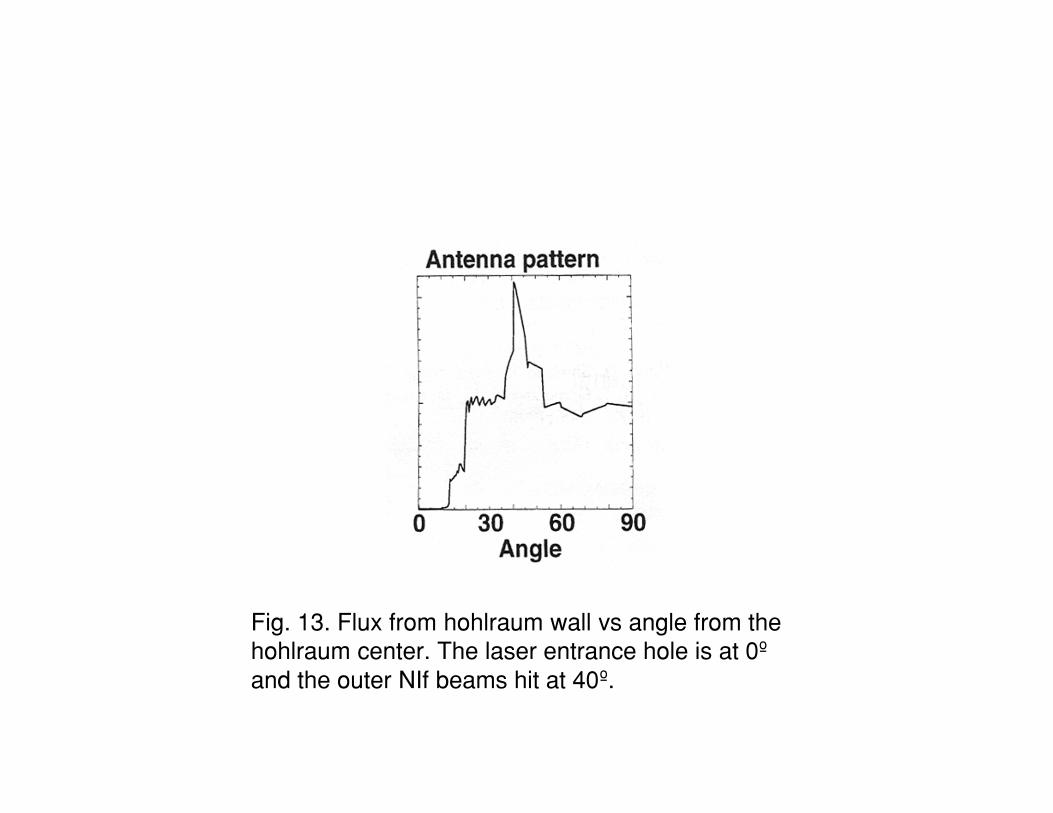
Fig. 13. Flux from hohlraum wall vs angle from thehohlraum center. The laser entrance hole is at 0ºand the outer NIf beams hit at 40º.

Fig. 14. Spectrum of flux pattern shown in Fig. 13vs mode number, normalized to total flux. Thisspectrum scales roughly as mode number –1/2.
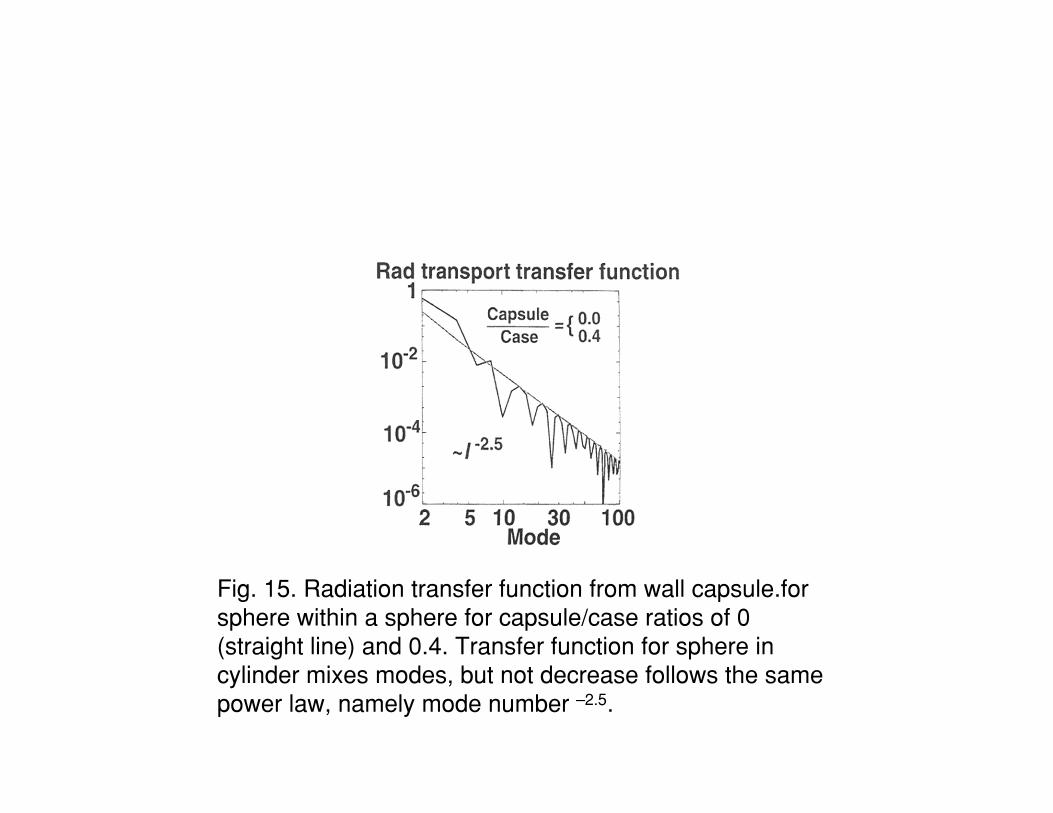
Fig. 15. Radiation transfer function from wall capsule.forsphere within a sphere for capsule/case ratios of 0(straight line) and 0.4. Transfer function for sphere incylinder mixes modes, but not decrease follows the samepower law, namely mode number –2.5.

Fig. 16. Flux asymmetry spectrum on capsule is roughlythe product of the wall spectrum (Fig. 14) times theradiation transfer function (Fig. 15), and goes like modenumber –3. The NIF specifications (straight solid line) golike mode number –1.