Embed Size (px)
Citation preview

NigeriaBeyond GDP

What does the rebasing of

Beyond GDP 1
Similar to a company which has posted better than expected returns for the year, Nigeria has raised the eye of many in the global investor community. The rebasing of its gross domestic product (GDP) figure has catapulted the emerging giant to the top of the sub-Saharan African GDP pile, with its counterpart South Africa (the entrenched number one for many decades) moving to second place. Nigeria’s GDP figures rose by 89% in light of the rebasing year changing from 2003 to 2010 and the inclusion of a number of previously unaccounted for sectors, such as the successful Nollywood film industry and telecommunication. Bolstered by a large population, a growing middle class and forecasted economic growth for the next 5 years of 7%, many international companies have thus redoubled their efforts and interests to enter Nigeria.
But what does the rebasing mean for the Nigerian people? And specifically, what strategies have the Nigerian government employed in order to pass on the benefits of economic growth to its citizens? In this paper, we explore the relevance of using economic indicators in measuring social development. We then assess Nigeria’s performance, utilising the newly created Social Progress Index (SPI), in addressing its social challenges. Our next step is to contextualise this performance in relation to other emerging markets in Africa and lastly we highlight key areas of improvement and potential strategies for the Nigerian government to consider.
GDP mean?

2

Beyond GDP 3
Two of the most visible metrics to measure economic output, and the wealth created by this output, are GDP and GDP per capita. These are widely used as an initial comparative measure of countries’ performance. However, several problems arise when analysts, policy makers and academics over-emphasise their use. For one, GDP and GDP per capita are aggregate measures of output, and may mask the economic differences across various sectors within a country – making it more complex to understand the origin of output and parties responsible for the output. Secondly, it masks the negative externalities attributed to output, such as pollution and emission of greenhouse gases; and lastly, aggregate measurements of a country’s wealth may over-emphasise the wealth of the individuals living in the country – and potentially over or under-estimate the wealth of a certain region within the country.
To demonstrate this, Figure 1 plots GDP per capita in sub-Saharan Africa against the corresponding Gini coefficient – a measurement of the difference in income distribution amongst a country’s residents. A Gini coefficient of 0 represents pure equality, whilst a coefficient of 100 represents pure inequality. Conventional wisdom suggests that the higher the aggregate level of wealth (measured as GDP per capita) in a country, the higher proportion of the population have access to that wealth and thus the lower the Gini coefficient.
However, Figure 1 suggests the opposite for sub-Saharan African countries. Here the higher the aggregate level of wealth in the population, the higher level of inequality or Gini coefficient. Nigeria, through all the gains it has made through increased GDP, has not significantly improved the distribution of its wealth, and its Gini coefficient remains high in comparison to other countries in the region. This is not a unique problem for the sub-Saharan region as a whole (South Africa has the second highest Gini coefficient).
Figure 1: GDP per capita vs. Gini coefficient in Sub-Saharan Africa
Source: World Economic Outlook, World Bank
BWA
MUS
ZAF NAM
ANG
SWZ
COG NGA
CMR DJI
SDN
GHA
LSO
SEN
KEN
ZMB
TZA BKF
RWA
UGA
MLI
CAF
GIN TGO
MOZ MDG
NER
MWI
LBR
BUR
0
10
20
30
40
50
60
70
0 2000 4000 6000 8000 10000 12000 14000 16000 18000
Gin
i Coe
ffici
ent
GDP per capita (current interna2onal USD)
GDP per capita vs. Gini Coefficient in Sub-‐Saharan Africa

4
1,80%
6,80%
19,30%
25,10%
34,90%
12,10%
0,00%
5,00%
10,00%
15,00%
20,00%
25,00%
30,00%
35,00%
40,00%
0
2
4
6
8
10
12
14
A Upper Class
USD 140k p.a.
B Lower-upper
Class
USD 90k p.a.
C1 Upper-middle
Class
USD 50k p.a.
C2 Lower-middle
Class
USD 14k p.a.
D Lower Class
USD 1.4 k p.a.
E The Poor
Income typically lower than
USD 600 p.a.
Num
ber
of
ho
use
ho
lds
(mill
ions)
Number of households by social class 2012 millions (LHS)
% of population (RHS)
Source: Nigeria AMPS (2012)
Figure 2 highlights results from the 2012 Nigerian All Media and Product Survey (AMPS1) which estimates households earnings per annum within Nigeria and further contextualises the GDP per capita indicator. The survey estimates that of the estimated 169 million people in Nigeria only 3.3 million people are classified as upper class (earning above USD 140,000 p.a.) whilst more than 49 million people earn less than USD 1,400 per annum (p.a.). Approximately 34% of the population are classified as middle class and earn between USD 14,000 and USD 50,000 p.a., whilst 47% of the population are classified as either poor or lower class and earn less than USD 1,400 p.a.
Figure 2: Living Standards Measures A-E in Nigeria (millions of households2)
1 The purpose of the AMPS of Nigeria is to identify possible prospects for products and services and to determine which media to use to reach specific target markets.2 HH Income defined as per 2008 social class classifications. Exchange rate of Naira 170.85 / USD 1 is used for incomes.

Beyond GDP 5
In light of the challenges in utilising conventional economic indicators to assess social progress, the use of alternative indicators has become increasingly popular. The Africa Competitiveness Report, the Corruption Index, the Ease of Doing Business Report and Deloitte’s own-PESTLE model are to name a few that attempt to holistically assess countries performance relative to each other. However, several complications have arisen from using these indices:
1) Depending on the popularity of the index, countries are incentivised to “game” the results by focusing efforts on improving one or more indicators to better enhance their position against neighbouring countries. These enhancements may not necessarily further the development progress of the nation, but could convince uninformed investors that the country has made progress when in reality, little has changed; and
2) These indicators generally focus on one key theme of performance (such as the Ease of Doing Business) and may need to be supplemented with other indices to contextualise the situation on the ground.
Of these, the latest to join the basket of indicators is the Social Progress Index (SPI), supported by Michael Porter from the Social Progress Initiative, and it has gained significant popularity and success in measuring and monitoring countries performance against social objectives. The index provides for a robust measurement of social progress based on integral components necessary for a country’s sustainable development and includes results from publically available data and surveys. Figure 3 provides a visual comparison between the SPI and other relevant indices to show the relative number of environmental and societal indicators used to build the index.

6
Global Competiveness Index
Legatum Prosperity Index
Human Development Index
Social Progress Index
Happy Planet Index
0
5
10
15
20
0% 20% 40% 60% 80% 100%
Num
ber o
f com
pone
nts
% total environmental and societal indicators
Circle size = number of indicators
Higher proportion of social and environmental indicators = lesser focus on GDP and economic trends
Higher level of disaggregation =
more action orientated index
Figure 3: Comparison of SPI to other indices
Source: Social Progress Initiative (2014)
The SPI comprises three dimensions necessary for social progress, which combined comprises the index:1) Basic human needs, which measures a country’s nutrition and basic
medical care, sanitation and water, shelter and personal safety;2) Foundations of well-being, which measure literacy, education,
health and wellness, access to information and ecosystem sustainability; 3) Opportunity, which measures citizens’ access to personal and political
rights.
These three dimensions each have four components, which in turn are cumulatively comprised of well over 100 indicators. The indicators are wide ranging and cover outcomes from maternal mortality rate and primary school enrolment to access to improved sanitation and greenhouse gas emissions – thereby correcting for most of the blind spots in conventional economic indicators. The index is intended to look “beyond GDP” and identifies the social and environmental components a country requires to perform.

Beyond GDP 7

8

Beyond GDP 9
10
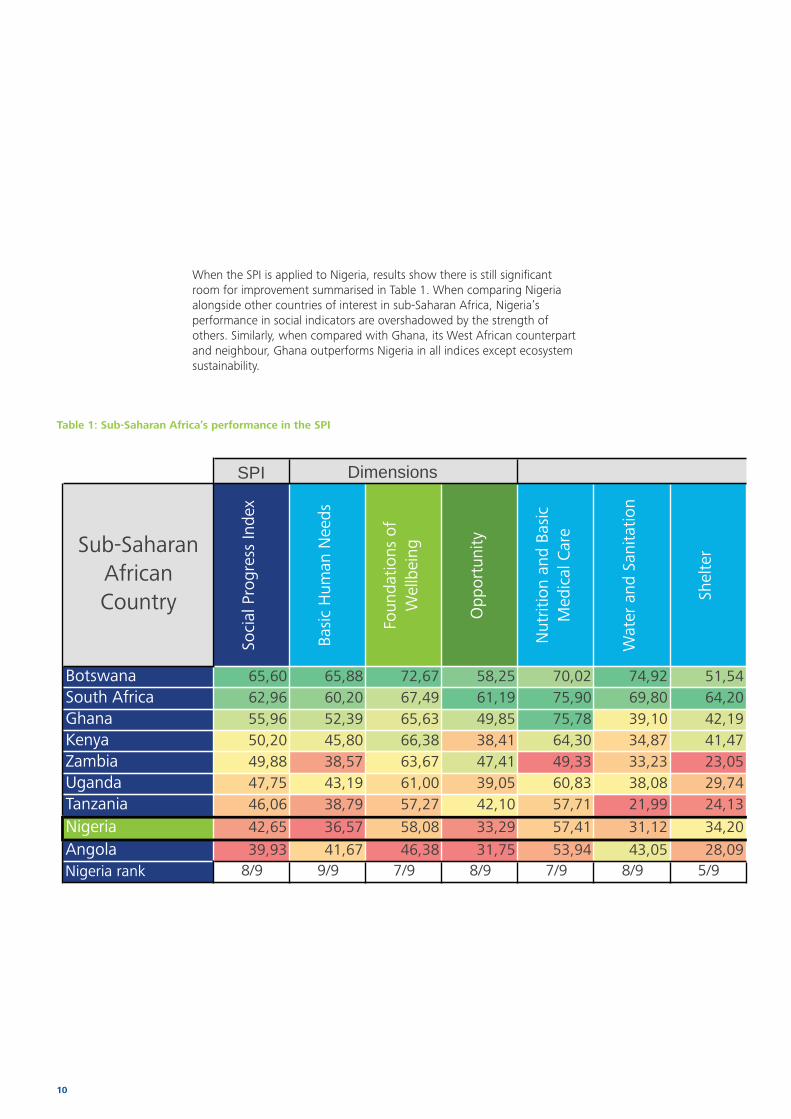
When the SPI is applied to Nigeria, results show there is still significant room for improvement summarised in Table 1. When comparing Nigeria alongside other countries of interest in sub-Saharan Africa, Nigeria’s performance in social indicators are overshadowed by the strength of others. Similarly, when compared with Ghana, its West African counterpart and neighbour, Ghana outperforms Nigeria in all indices except ecosystem sustainability.
Table 1: Sub-Saharan Africa’s performance in the SPI
SPI
Sub-Saharan African Country
Soci
al P
rogr
ess
Inde
x
Basi
c H
uman
Nee
ds
Foun
datio
ns o
f W
ellb
eing
Opp
ortu
nity
Nut
ritio
n an
d Ba
sic
Med
ical
Car
e
Wat
er a
nd S
anita
tion
Shel
ter
Botswana 65,60 65,88 72,67 58,25 70,02 74,92 51,54South Africa 62,96 60,20 67,49 61,19 75,90 69,80 64,20Ghana 55,96 52,39 65,63 49,85 75,78 39,10 42,19Kenya 50,20 45,80 66,38 38,41 64,30 34,87 41,47Zambia 49,88 38,57 63,67 47,41 49,33 33,23 23,05Uganda 47,75 43,19 61,00 39,05 60,83 38,08 29,74Tanzania 46,06 38,79 57,27 42,10 57,71 21,99 24,13
Nigeria 42,65 36,57 58,08 33,29 57,41 31,12 34,20
Angola 39,93 41,67 46,38 31,75 53,94 43,05 28,09Nigeria rank 8/9 9/9 7/9 8/9 7/9 8/9 5/9
Dimensions
Beyond GDP 11
Source: Social Progress Index (2014)
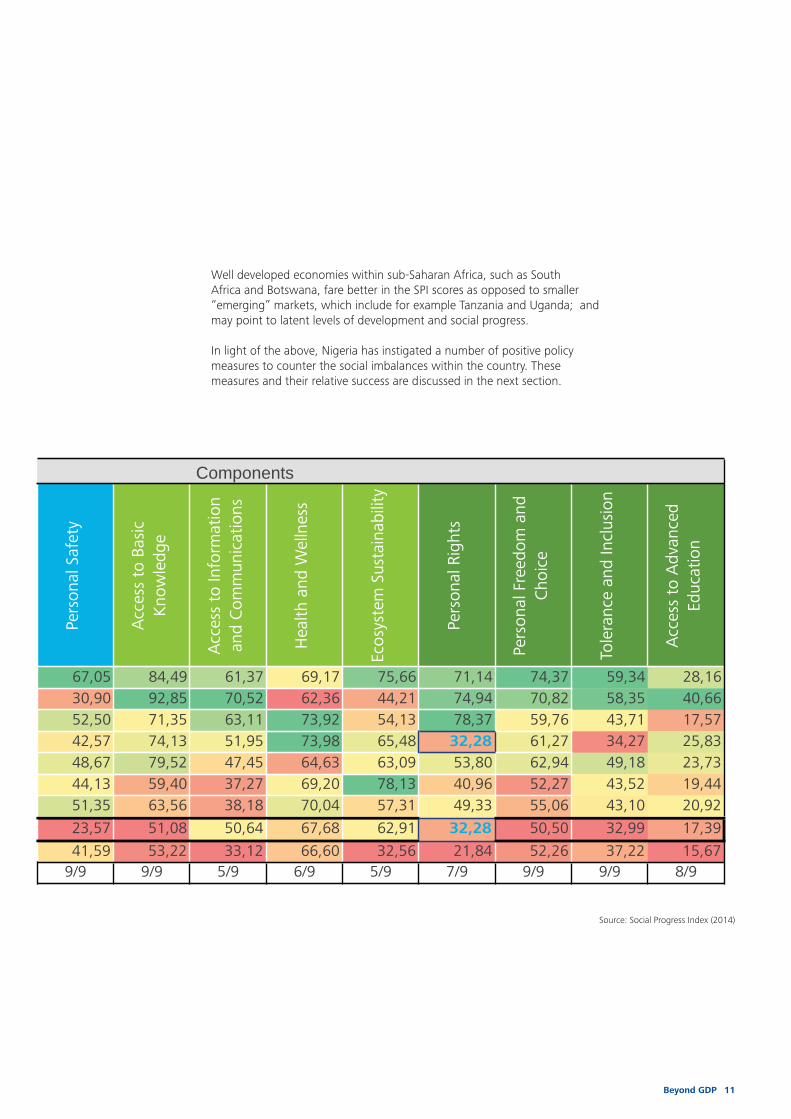
Well developed economies within sub-Saharan Africa, such as South Africa and Botswana, fare better in the SPI scores as opposed to smaller “emerging” markets, which include for example Tanzania and Uganda; and may point to latent levels of development and social progress.
In light of the above, Nigeria has instigated a number of positive policy measures to counter the social imbalances within the country. These measures and their relative success are discussed in the next section.
Pers
onal
Saf
ety
Acc
ess
to B
asic
K
now
ledg
e
Acc
ess
to In
form
atio
n an
d C
omm
unic
atio
ns
Hea
lth a
nd W
elln
ess
Ecos
yste
m S
usta
inab
ility
Pers
onal
Rig
hts
Pers
onal
Fre
edom
and
C
hoic
e
Tole
ranc
e an
d In
clus
ion
Acc
ess
to A
dvan
ced
Educ
atio
n67,05 84,49 61,37 69,17 75,66 71,14 74,37 59,34 28,1630,90 92,85 70,52 62,36 44,21 74,94 70,82 58,35 40,6652,50 71,35 63,11 73,92 54,13 78,37 59,76 43,71 17,5742,57 74,13 51,95 73,98 65,48 32,28 61,27 34,27 25,8348,67 79,52 47,45 64,63 63,09 53,80 62,94 49,18 23,7344,13 59,40 37,27 69,20 78,13 40,96 52,27 43,52 19,4451,35 63,56 38,18 70,04 57,31 49,33 55,06 43,10 20,92
23,57 51,08 50,64 67,68 62,91 32,28 50,50 32,99 17,39
41,59 53,22 33,12 66,60 32,56 21,84 52,26 37,22 15,679/9 9/9 5/9 6/9 5/9 7/9 9/9 9/9 8/9
Components

12

Beyond GDP 13
There are considerable overlaps in indicators covered by the SPI and that of the Millennium Development Goals (MDGs), which Nigeria has adopted at a national level. Although the SPI goes above and beyond the main drivers of the MDGs, understanding Nigeria’s performance against the eight MDGs may indicate its relative progress in improving its SPI scores. Whilst the government has not formally adopted the SPI as a measure of success, it has openly confirmed improving on their MDGs.
Since 2005, when the Federal Government pledged to allocate savings from debt relief gains such as the Paris Club Debt Relief, progress in achieving the MDGs has been a high priority for Nigeria. Table 2 depicts the status of these programmes by 2010 and the relative implementation success. The table also maps out the corresponding SPI indicator affected and Nigeria’s world ranking. Sections highlighted in green indicate where Nigeria has performed relatively well , as opposed to relatively poorly – marked in red. Areas that require constant monitoring and attention are marked in orange.

14
Millenium Development Goal
Status (2010)SPI Index
ComponentSPI
RatingSPI
Ranking
1. Eradicate extreme poverty and hunger
Slow: There is less poverty than in 2000 but the data is not clera. Five out of every ten Nigerians still live in poverty. Growth has not been sufficiently equitable or generated enough jobs to reduce poverty further. Nutrition has improved significantly.
Undernourisment % of population
8.5 56/132
Depth of food deficit 50 61/132
2. Achieve universal primary education
Average: Many more children are in school. Nine out of every ten eligible children attend school as a restult of Universal Basci Education Programme interventions and enrolment in private schools. However, disadvantaged groups are still excluded and the quality of education remains poor.
Adult literacy rate 51.07 123/132
Primary school enrollment
56.22 131/132
3. Promote gender equality and empower women
Average: Some improvements in gender parity. Nine girls attend school for every ten boys. Economic and policitical empowerment remains elusive. A common reaosn for the disparity in rates of girls and boys completing schooling, especially at secondary level, is poor or non-existant.
Women’s mean years in school
6.6 100/132
Gender parity in secondary enrollment
0.89 106/132
Women treated with respect
51 94/132
4. Reduce child mortality Average: Significant reductions in but progress needs to be accelerated.
Stillbirth rate 42 2/132
Child mortality rate 124 5/132
5. Improve maternal health
Slow: Data for 2008 show a significant improvement, but the gap between the current situation and the target is still very large
Maternal mortality rate
630 7/132
6. Combat HIV/AIDS, malaria and other diseases
Average: The prevalence of HIV/AIDS in the population has fallen from 5 per cent to under 5 per cent. Rates of malaria infection have dropped, but still account for 300,000 deaths a year, on average. The hard work is still to come. Impressive progress against polio.
Satisfied demand for contraception (% of women)
40.4 118/132
Infectious diseases 832 11/132
7. Ensure environmental sustainability
Slow: Access to safe water and sanitation has not improved significantly and other environmental challenges, such as erosion, coastal flooding and climate change, are growing
Access to improved sanitation facilities
30.6 115/132
Outdoor pollution attributable deaths
17 39/132
Access to piped water 3.93 127/132
Indoor air pollution attributable deaths
2 70/132
8. Develop a global partnership for development
Average: The benefits of debt relief have not been matched by an increase in aid. Trade and access to markets is still unequal. Rapid increase in access to information and communication technologies, teledensity and regional intitiaves (New Partnerships for Africa’s Development, Econoimc Communicty of West African States, etc.)
Mobile telephone subscriptions
66.8 109/132
Internet users 32.87 80/132
Table 2: Progress towards MDG targets and current status (June 2010)
Source: OSSAP-MDGs 2010c, SPI Initiative, Adapted from Countdown Strategy on MDG (2010)

Beyond GDP 15
From Table 2 it appears that Nigeria has made significant gains in addressing air pollution and improving access to telecommunications. However, indicators of health and wellness and basic human needs may require renewed attention.
Table 3 highlights the potential to achieve the MDGs and whether the resultant policies are in place for this to occur. It appears that Nigeria has the potential to reach all the targets of the MDGs and has had specific success in reducing the HIV/AIDS burden. However, the country has not had much success in reducing the water and basic sanitation conditions for the country. The policies adopted by Nigeria have the potential to assist in reaching these targets and we will discuss these below in light of the SPI.

16
MDG 1: Extreme povertyPotential to meet target
Supportive policy environment
Target 1:Halve, between 1990 and 2015, the proportion of people living in extreme poverty.
Target 2:Halve, between 1990 and 2015, the proportion of people who suffer from hunger
MDG 2: Universal primary education
Target 3:Ensure that, by 2015, children everywhere, boys and girls alike, will be able to complete a full course of primary schooling.
MDG 3: Gender Equality
Target 4:Eliminate gender disparity in primary and secondary education, preferably by 2005 and to all levels of education no later than 2015.
MDG 4: Child mortality
Target 5:Reduce by two-thirds, between 1990 and 2015, the under-five mortality rate
MDG 5: Maternal mortality
Target 6:Reduce by two-thirds, between 1990 and 2015, the maternal mortality rate
MDG 6: HIV/AIDS
Target 7:Have halved, by 2015, and begun to reverse the spread of HIV/AIDS
Target 8:Have halted, by 2015, and begun to reverse, the incidence of malaria and other major diseases.
MDG 7: Environmental sustainability
Target 9:Integrate principles of sustainable development into country policies and programmes and reverse the loss of environmental resources.
Target 10:Halve by 2015, the proportion of the population without sustainable access to safe drinking water and basic sanitation
Source: Adapted from Countdown Strategy on MDGs and Nigeria MDGa Report 2010 (Federal Republic of Nigeria 2010a)
Table 3: Potential* to achieve MDG targets
*Key to achievable potentials
Meet target: Good potential Average potential Weak potential
Policy environment:
Strong Good/Fair Weak but improving

Beyond GDP 17

18

Beyond GDP 19
Nigeria’s Vision 20:2020
The Nigeria Vision 20:2020 adopted in late 2009 integrated the MDGs, the National Economic Empowerment and Development Strategy (NEEDS) and the Seven Point Agenda into an overarching strategy for Nigeria. This blueprint aims at placing Nigeria in the top 20 economies in the world with a GDP of $900 billion and per capita income of no less than $4000 per annum. The vision is anchored on three main pillars, notably:1) Guaranteeing the productivity and wellbeing of the people;2) Optimising the key sources of economic growth; and3) Fostering sustainable social and economic development.
The Nigeria 20:2020 vision therefore aims to improve Nigeria’s SPI score in by aspects of each of the three dimensions of the SPI index. Within each dimension, the vision details specific plans upon which the government intends to improve: i) Under the first pillar SPI components prioritised for improvement
include: nutrition and basic medical care, access to basic knowledge and improving personal freedom;
ii) The second pillar highlights improvement on access to information and communication; and lastly
iii) Under the third pillar focus is placed on improvement of Nigeria’s ecosystem and sanitation.

20
The Seven Point AgendaThe Seven Point Agenda (Medium Term Development Strategy 2009-2011) relies on seven key points in which the economy of Nigeria may improve:1. Sustainable growth in the real sector of the economy2. Physical infrastructure, including power, energy and transportation3. Agriculture4. Human capital development, including education and health5. Security, law and order6. Combating corruption7. Niger Delta development
The Seven Point Agenda (7-Point Agenda) also aligns Nigeria’s strategic priorities to that of the MDG and in turn with components of the SPI index. Specifically the 7-Point Agenda relies on reducing maternal and child mortality rates, eradicating undernourishment and the depth of the food deficit and increasing the level of literacy and sustainability of the ecosystem.
Whilst a complete review of these strategies is beyond the scope of this paper, some initial insights can be garnered: 1. All economic principles for driving increased social progress
seem to be in place. The components for achieving growth and the strategies on how to do so are well intentioned and encourage social progress by addressing infrastructure bottlenecks, health and educational outcomes and supporting the MDGs. However, it appears that a lack of cohesion between government departments has slowed down the implementation of these strategies. In addition, emphasis is placed on targeting conventional economic indicators such as GDP, instead of focusing on social outcomes;
2. The quality of economic and statistical data has made it difficult for policy makers as well as investors to make informed decisions regarding Nigeria. This makes monitoring and measuring the effect of any policy for both the public and private sector untenable
3. Corruption has hindered the progress that government policies surrounding private expansion have made and has constrained appetite for foreign investors to engage in business in Nigeria. Similarly, benefits that would normally accrue to communities from resulting projects may never materialise.

Beyond GDP 21
Nigeria is on the cusp of driving its own developmental agenda for improving social progress. The SPI suggests that improvements need to be made on addressing basic human needs and health and wellness in Nigeria. Economic theory suggests that these can be improved through increased government expenditure on social programs and infrastructure.
Improving infrastructure to address social issues can be supplemented with the infrastructure already planned for attracting greater investment in the region. Government investment in improving school, hospital and water and sanitation infrastructure should be critical. Infrastructure programs which improve on social outcomes should run concurrently and interlink with infrastructure programs to develop telecommunications, transport and power generation generally required by the private sector.
In addition, social outcomes will be improved, by addressing the large scale corruption and mismanagement of state funds as reported recently. Encouraging and managing state run controls, as seen recently in the introduction of the Fiscal Responsibility Act of 2007, need to be re-emphasised at the state level. This will reduce the inequity in distribution and allocation of tax payers’ funds which can be used to improve health and wellness of disadvantaged communities.
Lastly, adopting alternative target measures of social progress (such as the SPI) may be of considerable benefit to both government and private sector in measuring government’s success in improving social development outcomes.

22
Beyond GDP 23
In conclusion, while using conventional economic indicators is one of many ways to assess a country’s progress in comparison to other countries on the global scale, there are some drawbacks to its use for policy makers and investors. As indicated, conventional indicators may mask economic imbalances and overemphasise the role that output plays in delivering social progress, and therefore makes a good case for the use of alternative indicators.
We would advise governments (and our clients) to consider a holistic view, taking into account an index such as the SPI, when making important decisions. It will enable one to measure and monitor the success of implementing various micro- and macroeconomic policies as well as contextualise the environment in which one operates. We forecast that as social imperatives start to drive economic policies, more and more governments will be encouraged to utilise alternative indices such as the SPI in formulating their long term economic policies. We encourage private players operating in these areas to take heed of these indices and align their interests with those of government to drive social progress.

Beyond GDP 25

Deloitte refers to one or more of Deloitte Touche Tohmatsu Limited, a UK private company limited by guarantee, and its network of member firms, each of which is a legally separate and independent entity. Please see www.deloitte.com/about for a detailed description of the legal structure of Deloitte Touche Tohmatsu Limited and its member firms.
Deloitte provides audit, tax, consulting and financial advisory services to public and private clients spanning multiple industries. With a globally connected network of member firms in more than 150 countries, Deloitte brings world-class capabilities and high-quality service to clients, delivering the insights they need to address their most complex business challenges. The more than 200 000 professionals of Deloitte are committed to becoming the standard of excellence.
This communication contains general information only, and none of Deloitte Touche Tohmatsu Limited, its member firms, or their related entities (collectively, the “Deloitte Network”) is, by means of this communication, rendering professional advice or services. No entity in the Deloitte Network shall be responsible for any loss whatsoever sustained by any person who relies on this communication.
© 2014 Deloitte & Touche. All rights reserved. Member of Deloitte Touche Tohmatsu Limited
Designed and produced by Creative Services at Deloitte, Johannesburg. (000000/dbn)