Embed Size (px)
Citation preview
NIGERIA
June 2017
WAVE 4 REPORTFII TRACKER SURVEYConducted August – October 2016

PUTTING THE USER FRONT AND CENTER
2
NIGERIA
The Financial Inclusion Insights (FII) program responds to the need identified by multiple stakeholders for timely demand-side data and practical insights into digital financial services (DFS), including mobile money, and the potential for their expanded use among the poor.
The FII team implements nationally representative population surveys and qualitative research studies in Bangladesh, India, Indonesia, Kenya, Nigeria, Pakistan, Tanzania and Uganda to:
• Track access to and demand for financial services, especially DFS;
• Measure adoption and use of DFS among key underserved groups (females, poor, rural, etc.);
• Identify drivers and barriers to further adoption of DFS;
• Evaluate the agent experience and the performance of mobile money agents; and
• Produce actionable, forward-looking insights based on rigorous data to support product and service development and delivery.
The FII program is managed by InterMedia. Visit the FII Resource Center to learn more: www.finclusion.org.

CONTENTS
3
Executive Summary 4
Customer Journey 12
Preconditions 16
Access & Trial 23
Registration 26
Active Use 32
Advanced Active Use 35
Special Topic: Financial Lives 40
Key Indicators Summary 48
Methodology & Research Description 50
Glossary 52
NIGERIA

EXECUTIVE SUMMARY
4
NIGERIA

What is financial inclusion?
Financial inclusion means that individuals and businesses have access to useful and affordable financial products and services that meet their needs – transactions, payments, savings, credit and insurance – delivered in a responsible and sustainable way (The World Bank). Financially included individuals are those who have an account in their name with a full-service financial institution.
How is it measured?
We measure financial inclusion as the percentage of adults (15+ years old) who report having at least one account in their name with an institution that offers a full suite of financial services, and comes under some form of government regulation.
How is it created?
Financial inclusion is created through the uptake and use of individual accounts with institutions that offer a full suite of financial services – savings, credit, moneytransfers, insurance and investment. Full-service financial institutions include banks, mobile money service providers, and nonbank financial institutions (NBFIs), such as deposit-taking microfinance institutions (MFIs) and financial cooperatives.
What institutions and services do not count?
Individuals who own accounts with institutions that are not full service, such as credit-only microfinance institutions (MFIs), are not considered financially included. Individuals who do not have their own full-service account or use someone else’s account are not considered financially included. Individuals who only use services,such as money guards, savings collectors, and digital recharge cards that are not attached to a bank or MFI account are also considered financially excluded.
UNDERSTANDING FINANCIAL INCLUSIONNIGERIA – EXECUTIVE SUMMARY
5

Adult population(15+)
Adult population(15+)
Gender Age
Male 51% 15-24 27%
Female 49% 25-34 27%
Geography 35-44 19%
Urban 38% 45-54 12%
Rural 62% 55+ 14%
Income Aptitude
Above the $2.50/day poverty line 54% Basic literacy 73%
Below the $2.50/day poverty line 46% Basic numeracy 97%
SURVEY DEMOGRAPHICS
6
NIGERIA - EXECUTIVE SUMMARY
Figures are weighted to reflect national census data demographics.
Source: InterMedia Nigeria FII Tracker survey Wave 4 (N=6,352, 15+), August-October 2016.

Nigeria remains a bank-led financial services market where mobile money has very little market share, but digital services are numerous. To raise government revenues, new transaction taxes and fees were introduced in 2016 that make financial services more expensive, and, therefore, further out of reach for the poor.
• In January 2016, the Central Bank of Nigeria (CBN) enacted regulations that imposed stamp duty (tax) on money transfers into customers’ bank accounts.
• The CBN imposed a charge of N50 (USD 0.20) on every check obtained and used at the deposit money bank’s counter.
• Cash withdrawals on ATMs, previously free of charge, now cost N65 (USD 0.25) beginning with the third withdrawal.
• Customers also pay about N1000 (USD 3.20) for debit card issuances and renewals and N105 (USD 0.40) for every online transfer. An additional N105 (USD 0.40) annual maintenance fee is also charged on debit cards.
The inflation rate in Nigeria increased monthly from January 2016 to June 2016, when the inflation rate reached a nearly 11-year high of 16.5 percent. High inflation rates have persisted since then. In March 2017, the National Bureau of Statistics (NBS) reported an inflation rate of 17.3 percent, dropping from 17.8 percent in February 2017.
• 2016 saw the CBN increase interest rates in response to higher inflation, increasing the cost of borrowing.
• Increasing inflation rates can impact consumers’ financial behaviors and their choices of goods and services. With the increase in the cost of living, Nigerians may be forced to spend more and save less to meet their daily needs.
In October 2016, the Nigeria Interbank Settlement Scheme (NIBSS), in collaboration with all of the Nigerian money deposit banks and the four major telecommunications operators (Etisalat, MTN, Airtel and Globacom), launched mCash, a new mobile money payment solution.
• mCash facilitates low-value retail payments and encourages e-payments by providing accessible electronic channels to a wider range of users. To further enhance financial inclusion in Nigeria, mCash extends e-payment benefits to payers and merchants at the bottom of the pyramid where cash transactions predominate.
In 2016, the National Association of Microfinance Banks (NAMB) began issuing its version of bank verification numbers (BVN) to microfinance bank customers in Nigeria.
• The BVN is a unique digital identity that can be verified across the Nigerian banking industry and protects customers’ accounts from unauthorized access. It also serves as a standard form of identification across multiple accounts owned by individuals in all banks in the country.
COUNTRY CONTEXT
7
NIGERIA – EXECUTIVE SUMMARY
Source: InterMedia Nigeria FII Tracker survey Wave 4 (N=6,352, 15+), August-October 2016.

NOTABLE STATISTICS
8
NIGERIA - EXECUTIVE SUMMARY
34%Financially
included
2% have a full-
service NBFI account
34% have a full-
service bank account
2% have a registered
mobile money account
35% Financially included
2016: Financial Inclusion*(Shown: Percentage of Nigerian adults, N=6,352)
*Overlap representing those who have multiple kinds of financial accounts is not shown.
Source: InterMedia Nigeria FII Tracker survey Wave 4 (N=6,352, 15+), August-October 2016.
• Fewer Nigerians are financially included in 2016 vs. 2015, mostly driven by a decline in bank account ownership. Some of
the decline in bank account ownership is likely due to the government’s requirement that bank account holders obtain a
bank verification number (BVN). Non-compliance with this new requirement led to the closure of some accounts, while
other customers faced difficulties linking their BVN to their bank accounts.
o Thirty-five percent of Nigerian adults now have a registered financial account (vs. 37 percent in 2015).
o In 2016, bank account ownership declined to 34 percent from 37 percent in 2015 and 42 percent in 2014, with
the most notable attrition from among the lower-income groups. The government regulation enacted in March
2016 imposing a stamp duty of N50 (USD 0.20) on bank customers for money received into their accounts might
be an additional factor.
o Despite the decline in bank account ownership, active bank account holders were more engaged in advanced
activities in 2016 than they were in the previous three years.
o Nigerians’ access to any financial service in 2016 was 42 percent, consistent with 2015.
o NBFI account access was static in 2016 (3 percent) versus 2015, while registered use declined slightly from 3
percent in 2015 to 2 percent in 2016.
• Mobile money access and use continues to be minimal. Only 2 percent of the adult population had ever accessed a mobile
money service in 2016.
o Despite the overall low usage levels, the use of mobile money registered accounts showed a slight increase from
0.6 percent in 2015 to 2 percent in 2016.
o Awareness of mobile money providers also showed an increase from 12 percent in 2015 to 20 percent in 2016.
o Fewer Nigerian adults were as aware of the concept of mobile money (16 percent) as they were of at least one
mobile money service provider (20 percent) in 2016.
FINANCIAL AND DIGITAL INCLUSION
9Source: InterMedia Nigeria FII Tracker survey Wave 4 (N=6,352, 15+), August-October 2016.
(Percentage of Nigerian adults, N=6,352)
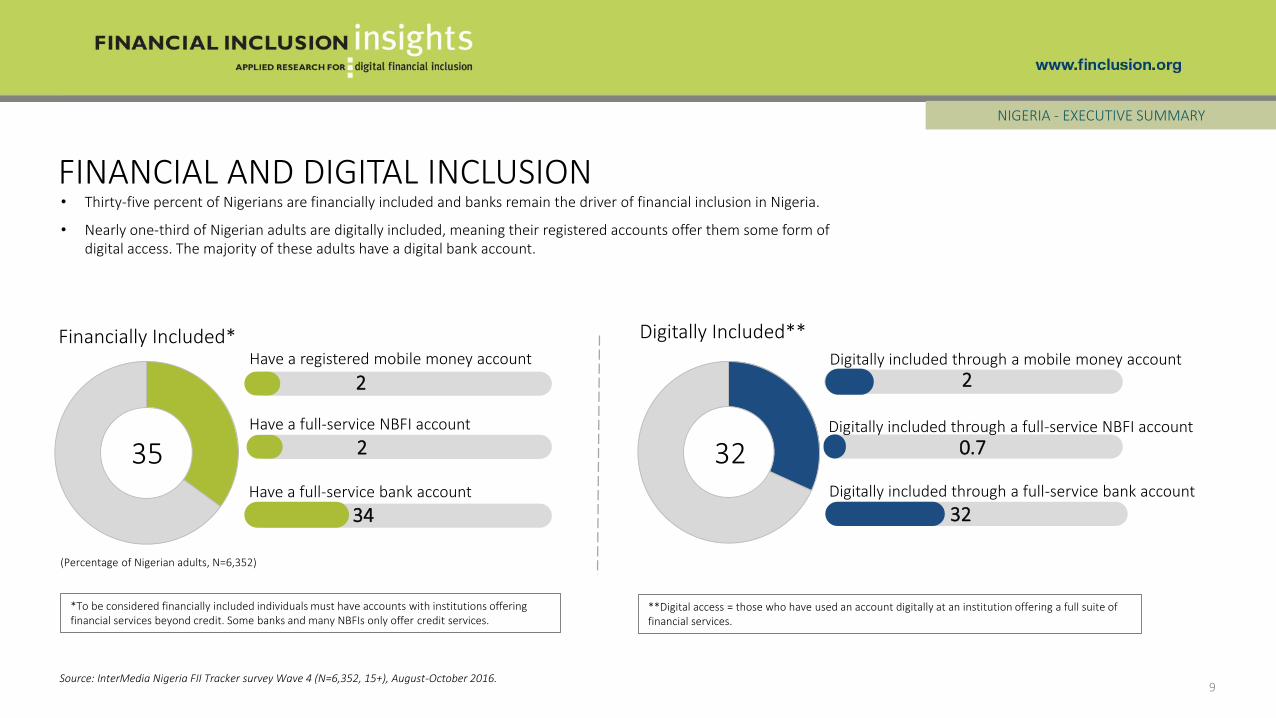
• Thirty-five percent of Nigerians are financially included and banks remain the driver of financial inclusion in Nigeria.
• Nearly one-third of Nigerian adults are digitally included, meaning their registered accounts offer them some form of digital access. The majority of these adults have a digital bank account.
35 32
2
0.7
32
Financially Included* Digitally Included**Have a registered mobile money account
2
Have a full-service bank account
2
34
Have a full-service NBFI account
NIGERIA - EXECUTIVE SUMMARY
*To be considered financially included individuals must have accounts with institutions offering financial services beyond credit. Some banks and many NBFIs only offer credit services.
Digitally included through a mobile money account
Digitally included through a full-service bank account
Digitally included through a full-service NBFI account
**Digital access = those who have used an account digitally at an institution offering a full suite of financial services.
ACCESS AND REGISTRATION AT A GLANCE
10
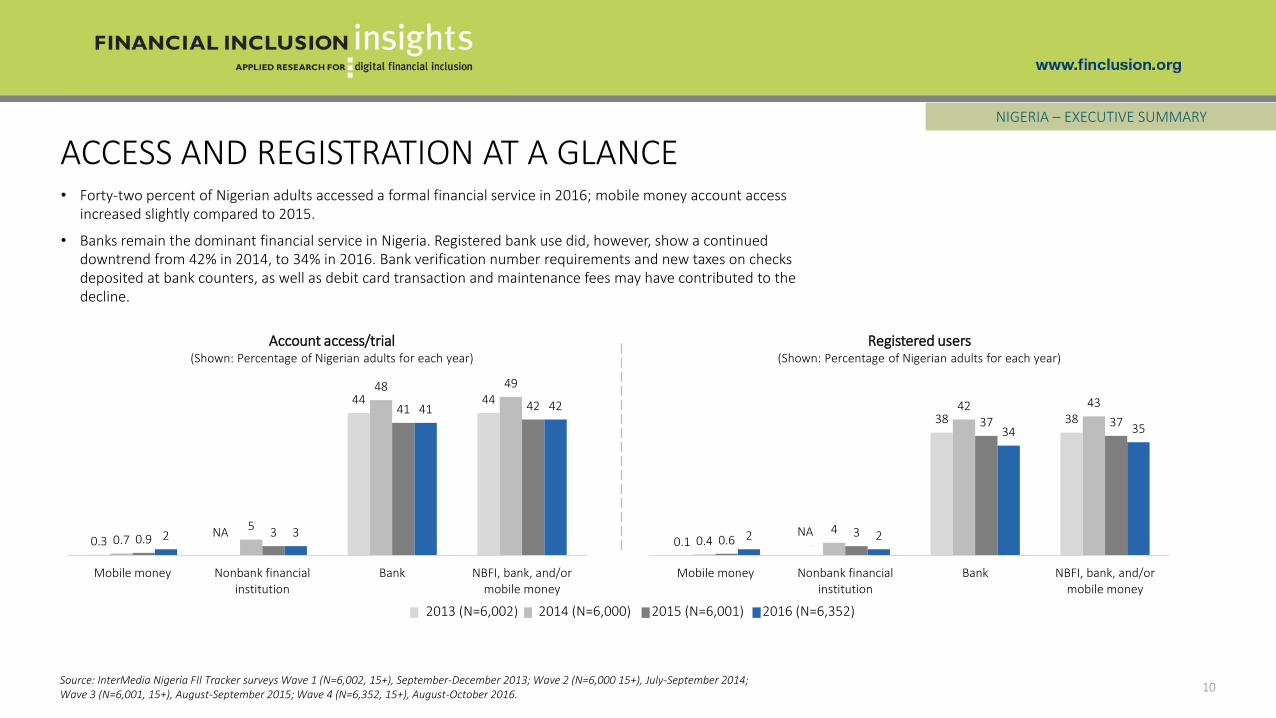
• Forty-two percent of Nigerian adults accessed a formal financial service in 2016; mobile money account access increased slightly compared to 2015.
• Banks remain the dominant financial service in Nigeria. Registered bank use did, however, show a continued downtrend from 42% in 2014, to 34% in 2016. Bank verification number requirements and new taxes on checks deposited at bank counters, as well as debit card transaction and maintenance fees may have contributed to the decline.
NIGERIA – EXECUTIVE SUMMARY
0.1 0
38 38
0.44
42 43
0.63
37 37
2 2
34 35
Mobile money Nonbank financialinstitution
Bank NBFI, bank, and/ormobile money
0.3
44 44
0.75
48 49
0.93
41 42
2 3
41 42
Mobile money Nonbank financialinstitution
Bank NBFI, bank, and/ormobile money
Account access/trial(Shown: Percentage of Nigerian adults for each year)
Registered users(Shown: Percentage of Nigerian adults for each year)
NA NA
2016 (N=6,352)2015 (N=6,001)2014 (N=6,000)2013 (N=6,002)
Source: InterMedia Nigeria FII Tracker surveys Wave 1 (N=6,002, 15+), September-December 2013; Wave 2 (N=6,000 15+), July-September 2014;Wave 3 (N=6,001, 15+), August-September 2015; Wave 4 (N=6,352, 15+), August-October 2016.

0
11 11
0.2 2
20 22
0.2 0.7
19 19
0.6 0.7
20 20
Mobile money Nonbank financialinstitution
Bank NBFI, bank, and/ormobile money
NA
ACTIVE USE AND ADVANCED USE AT A GLANCE
11
• Active use of financial accounts declined among Nigerian adults in 2016 compared to previous years. Part of the decline in active use is likely the result of bank customers reducing the number of transactions they complete to minimize the added expense of using their accounts as a result of new charges on transfers and ATM withdrawals.
• Active users continue to use advanced services at the same rate as in previous years, showing that the group of advanced users is relatively insensitive to increased transaction costs.
NIGERIA – EXECUTIVE SUMMARY
NA0.1
35 35
0.43
38 39
0.5 2
33 34
1 2
31 32
Mobile money Nonbank financialinstitution
Bank NBFI, bank, and/ormobile money
Active registered users(Shown: Percent of Nigerian adults for each year)
Advanced active registered users(Shown: Percent of Nigerian adults for each year)
2016 (N=6,352)2015 (N=6,001)2014 (N=6,000)2013 (N=6,002)
Source: InterMedia Nigeria FII Tracker surveys Wave 1 (N=6,002, 15+), September-December 2013; Wave 2 (N=6,000 15+), July-September 2014;Wave 3 (N=6,001, 15+), August-September 2015; Wave 4 (N=6,352, 15+), August-October 2016.

CUSTOMER JOURNEY
12
PRECONDITIONS ACCESS & TRIAL REGISTRATION ACTIVE USE ADVANCED ACTIVE USE
NIGERIA

• Financial inclusion may be conceived as a process through which an individual’s needs are met by advancing step-by-step toward increasingly active engagement with a growing range of financial services.
• Understanding how different demographic groups advance on the customer journey is useful for developing strategies and interventions to assist more individuals with becoming users of financial services that meet their needs.
• Five major stages in the customer journey are described in the figure below. The registration stage is where the FII program counts an individual as financially included, but the journey begins before and extends after registration.
CUSTOMER JOURNEY
13
NIGERIA – CUSTOMER JOURNEY
PRECONDITIONS ACCESS & TRIAL REGISTRATION ACTIVE USE ADVANCED ACTIVE USE
Preconditions are the set of skills and resources necessary to progress on the customer journey for a specific type of financial account. Differentpreconditions are required to start the customer journey fordifferent types of financial accounts.
Access & trial is the use of a full-service bank or NBFI account, or a mobile money account, registered in the individual’s name or in someone else’s name, including over-the-counter transactions completed via mobile money agents.
Registration of a full-service bank, mobile money, or NBFI account is the point in the customer journey where individuals are counted as financially included.
Active use means that an individual has used his/her registered account to transfer money, save, or borrow within the previous 90 days.
Advanced active use includes saving, borrowing, bill payment, merchant payment, receiving wages, and/or receiving government payments using a financial account registered in the user’s name within the previous 90 days.
Source: InterMedia Nigeria FII Tracker survey Wave 4 (N=6,352, 15+), August-October 2016.
Banks
NBFIs
ACCESS & TRIAL REGISTRATION ACTIVE USE ADVANCED ACTIVE USE
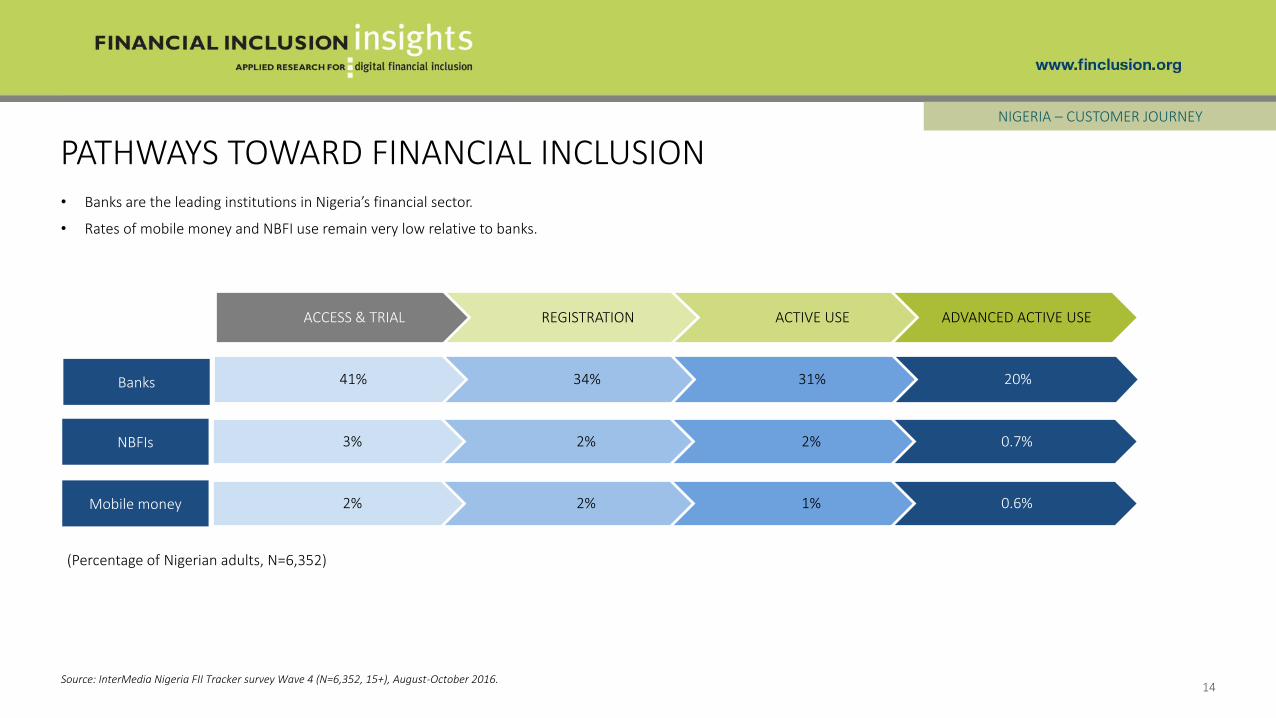
41% 34% 31% 20%
3% 2% 2% 0.7%
Mobile money 2% 2% 1% 0.6%
PATHWAYS TOWARD FINANCIAL INCLUSION
14
NIGERIA – CUSTOMER JOURNEY
(Percentage of Nigerian adults, N=6,352)
• Banks are the leading institutions in Nigeria’s financial sector.
• Rates of mobile money and NBFI use remain very low relative to banks.

THE BANKING CUSTOMER JOURNEY
15
NIGERIA – CUSTOMER JOURNEY
ACCESS & TRIAL 41%** REGISTRATION 34%** ACTIVE USE 31%** ADVANCED
ACTIVE USE 20%**
83%* 91%* 65%*
• Forty-one percent of Nigerian adults have access to bank services; fewer (34%) own registered bank accounts. This represents a conversion ratio of 83%, meaning that just over eight in 10 users advanced along the customer journey from access to account ownership.
• Nigerian bank account holders tend to be active users; 91% of registered account holders use their accounts actively on a 90-day basis. Only 65% of active users have converted to advanced use, meaning they have ever used a bank account for at least one advanced service.
2016: Conversion rate for each step in the banking customer journey(Shown: Percentage of Nigerian adults)
Source: InterMedia Nigeria FII Tracker survey Wave 4 (N=6,352, 15+), August-October 2016.
**Proportion of the total population at each stage in the journey*Proportion that progressed to the next stage in the journey

PRECONDITIONS ACCESS & TRIAL REGISTRATION ACTIVE USE ADVANCED ACTIVE USE
PRECONDITIONS
16
NIGERIA

PRECONDITIONS FOR FINANCIAL INCLUSION
17
NIGERIA - PRECONDITIONS
• Certain resources and skills are preconditions for advancing on the customer journey.
• While some of the following preconditions are necessary to access a financial account, others are not strictly necessary, but enable a consumer to register a financial account and use it in a meaningful manner to reap the benefits of financial inclusion.
Resources
Having the necessary ID
Mobile phone access
SIM card ownership
Geographical access
Financial literacy
Numeracy
Ability to send/receive text
Knowledge and skillsPreconditions for financial
inclusion
Mobile money awareness
Source: InterMedia Nigeria FII Tracker survey Wave 4 (N=6,352, 15+), August-October 2016.

PRECONDITIONS: KEY INDICATOR TRENDS
18
NIGERIA - PRECONDITIONS
2016: Key indicators of preparedness for digital financial services (Shown: Percentage of Nigerian adults)
2015 79% 93% 86% 12% NA 96% 80%
2014 72% 93% 88% 11% NA 89% 81%
2013 71% 96% 91% 12% NA 83% 79%
97%
Have basic numeracy
79%
Have the necessary ID*
20%
Mobile money awareness
16%
Financial literacy
79%
Own a SIM card
93%
Mobile phone access
78%
Ability to send or receive a text message
Source: InterMedia Nigeria FII Tracker surveys Wave 1 (N=6,002, 15+), September-December 2013; Wave 2 (N=6,000 15+), July-September 2014; Wave 3 (N=6,001, 15+), August-September 2015; Wave 4 (N=6,352, 15+), August-October 2016.
*Identification documents (ID) necessary for registering a mobile money or a bank account include one of the following: a national ID, passport, voter’s card or driver’s license.
• Most Nigerians meet the preconditions (readiness) for financial inclusion. A high proportion of the population meets preconditions across most indicators; numeracy and mobile phone access reflect the highest percentages. Having a valid identification remained static versus 2015, while owning a SIM card showed a decline.
• Compared to other indicators of preparedness, mobile money awareness has remained low since 2013, pointing to a need for marketing interventions by mobile money stakeholders. Financial literacy is also low.

48
31 31
15
8 6 74
1518 18
3 36 5 4
17
27 26
6 711 11
8
2024 26
7682
78 7783
Any POS Bank branch ATM Semi-formal/informalgroup
Retail store with an MMagent
MFI Banking agent MM agent
Less than 1 km from home 1-5 km from home More than 5 km from home Don't know
GEOGRAPHICAL ACCESS
19
2016: Proximity to points of service for financial institutions(Shown: Percentage of Nigerian adults, N=6,352)
NIGERIA - PRECONDITIONS
Source: InterMedia Nigeria FII Tracker survey Wave 4 (N=6,352, 15+), August-October 2016.
• Less than one-third of adults know of a bank branch or ATM within one kilometer of where they live.
• Most Nigerians do not know of a mobile money (MM) point of service (POS).

AWARENESS OF MOBILE MONEY
20
NIGERIA - PRECONDITIONS
2014 2015 2016
1112
20
Mobile money provider awareness(Shown: Percentage of Nigerian adults)
• Awareness of mobile money providers in Nigeria increased vs. previous years, from 12% in 2015, to 20% in 2016. Awareness remains low compared to the East African markets of Kenya, Uganda and Tanzania.
• Those who are unaware tend to lack basic literacy (32%).
Source: InterMedia Nigeria FII Tracker surveys Wave 2 (N=6,000 15+), July-September 2014; Wave 3 (N=6,001, 15+), August-September 2015; Wave 4 (N=6,352, 15+), August-October 2016.
2016: Awareness by poverty level (Shown: Percentage of Nigerian adults)
of adults living below $2.5/day poverty line
of adults living above $2.5/day poverty line
10%
28%
2016: Unaware of mobile money (n=5,406)
lack basic numeracy
lack basic literacy
4%
32%
have no access to a phone9%
14% of females
25% of males
2016: Awareness by gender(Shown: Percentage of Nigerian adults

• There is still room for growth in the percentage of adults who meet the mobile phone related preconditions to financial inclusion, particularly among women. In 2016, SIM card ownership declined significantly among both women and men.
• There is a 5-percentage-point gender gap (male minus female percentage) in the rate of phone access, and a 10-point gap in ability to text – the key precondition for using financial services on a mobile phone. This gap must be addressed to increase the rate of financial inclusion among women.
MOBILE PHONE RELATED PRECONDITIONS
21
NIGERIA - PRECONDITIONS
Source: InterMedia Nigeria FII Tracker surveys Wave 1 (N=6,002, 15+), September-December 2013; Wave 2 (N=6,000 15+), July-September 2014; Wave 3 (N=6,001, 15+), August-September 2015; Wave 4 (N=6,352, 15+), August-October 2016.
2016 201520142013
Mobile phone access (Shown: Percentage of Nigerian adults, by gender)
SIM card ownership (Shown: Percentage of Nigerian adults, by gender)
Ability to send or receive texts(Shown: Percentage of Nigerian adults, by gender)
97 9694 939590
9590
Men Women
938891
8691
8184
73
Men Women
8177
8477
84
75
83
73
Men Women
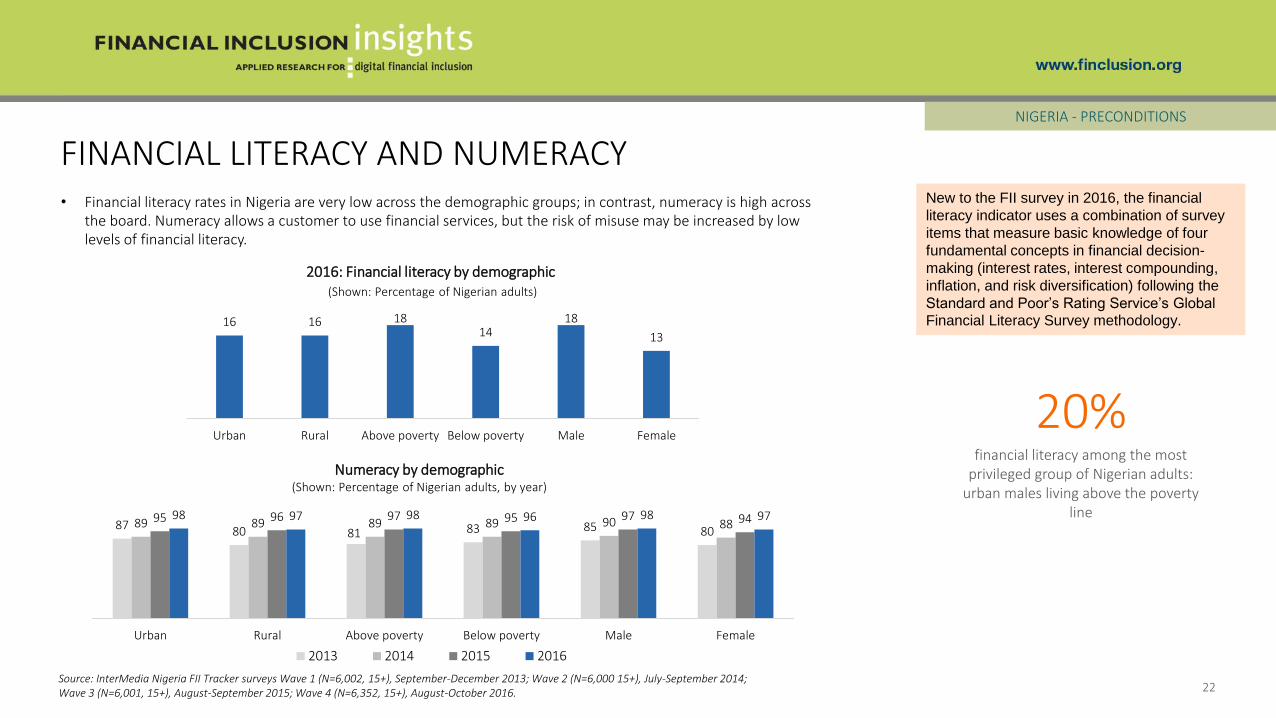
• Financial literacy rates in Nigeria are very low across the demographic groups; in contrast, numeracy is high across the board. Numeracy allows a customer to use financial services, but the risk of misuse may be increased by low levels of financial literacy.
FINANCIAL LITERACY AND NUMERACY
22
NIGERIA - PRECONDITIONS
20%financial literacy among the most
privileged group of Nigerian adults: urban males living above the poverty
line
Source: InterMedia Nigeria FII Tracker surveys Wave 1 (N=6,002, 15+), September-December 2013; Wave 2 (N=6,000 15+), July-September 2014; Wave 3 (N=6,001, 15+), August-September 2015; Wave 4 (N=6,352, 15+), August-October 2016.
87 80 81 83 85 8089 89 89 89 90 8895 96 97 95 97 9498 97 98 96 98 97
Urban Rural Above poverty Below poverty Male Female
2013 2014 2015 2016
Numeracy by demographic(Shown: Percentage of Nigerian adults, by year)
2016: Financial literacy by demographic(Shown: Percentage of Nigerian adults)
16 16 1814
18
13
Urban Rural Above poverty Below poverty Male Female
New to the FII survey in 2016, the financial
literacy indicator uses a combination of survey
items that measure basic knowledge of four
fundamental concepts in financial decision-
making (interest rates, interest compounding,
inflation, and risk diversification) following the
Standard and Poor’s Rating Service’s Global
Financial Literacy Survey methodology.

ACCESS & TRIAL
NIGERIA
23
PRECONDITIONSACCESS &
TRIALREGISTRATION ACTIVE USE
ADVANCED ACTIVE USE

ACCESS AND TRIAL OF FINANCIAL SERVICES
24
NIGERIA – ACCESS & TRIAL
0.3 0
44 44
0.75
48 49
0.93
41 42
2 3
41 42
Mobile money Nonbank financial institution Bank Any financial service
2013 (N=6,002) 2014 (N=6,000) 2015 (N=6,001) 2016 (N=6,352)
Access to financial services(Shown: Percentage of Nigerian adults for each year)
N/A
• Four in 10 Nigerians have accessed at least one type of full-service financial account (either their own or one belonging to someone else). Compared to other financial services, banks serve as the main pillar of access in this market.
• Mobile money and NBFIs still lag behind banks in access.
42% of adults have access to at least one
type of financial service
Source: InterMedia Nigeria FII Tracker surveys Wave 1 (N=6,002, 15+), September-December 2013; Wave 2 (N=6,000 15+), July-September 2014; Wave 3 (N=6,001, 15+), August-September 2015; Wave 4 (N=6,352, 15+), August-October 2016.

• One-third of women and one-third of those living in rural areas have access to at least one form of full-service financial account (either their own; one belonging to someone else or the use of an agent’s account).
• Nigerians have limited access to NBFI and mobile money accounts with more women than men relying on NBFIs. Only 1% of poor, women and rural groups have access to mobile money services, a relatively small number but proportionally similar to that of their counterparts.
ACCESS TO FINANCIAL SERVICES
25
NIGERIA – ACCESS & TRIAL
34percentage points
is the biggest gap in access to any type of financial service by
demographic characteristic – the gap between those living above and
below the poverty line
Rural
(n=4,569)
24%
22%
36%
35%
34%
33%
2%
1%
4%
1%
3%
1%2
3
41
42
Mobile money
Nonbank financial institution
Bank
Any financial service
Women
(n=2,992)Poor
(n=3,741)2016: Access to financial services, by demographics
(Shown: Percentage of Nigerian adults)
Source: InterMedia Nigeria FII Tracker survey Wave 4 (N=6,352, 15+), August-October 2016.

REGISTRATION
26
PRECONDITIONS ACCESS & TRIAL REGISTRATION ACTIVE USE ADVANCED ACTIVE USE
NIGERIA

REGISTERED FINANCIAL ACCOUNT OWNERSHIP
27
NIGERIA - REGISTRATION
Rural
Below $2.5/day poverty line
Urban
Female
Male
Above $2.5/day poverty line
42%
17%
28%
51%
46%
28%
2016: Registered financial account owners, by demographic(Shown: Percentage of Nigerian adults by each demographic)
0.1 0
38 38
0.44
42 43
0.63
37 37
2 2
34 35
Mobile money Nonbank financialinstitution
Bank Any financial service
2013 (N=6,002) 2014 (N=6,000) 2015 (N=6,001) 2016 (N=6,352)
Registered financial account owners(Shown: Percentage of Nigerian adults for each year)
• In 2016, bank account ownership declined to 34% from 37% in 2015 and 42% in 2014, due in part to the closure of accounts that were non-compliant with new requirements for bank verification numbers (BVNs).
• Most of the registered users are male, those who live above the poverty line and those who live in urban areas.
Source: InterMedia Nigeria FII Tracker surveys Wave 1 (N=6,002, 15+), September-December 2013; Wave 2 (N=6,000 15+), July-September 2014; Wave 3 (N=6,001, 15+), August-September 2015; Wave 4 (N=6,352, 15+), August-October 2016.
N/A

FINANCIAL ACCOUNT REGISTRATION AND PRECONDITIONS
28
NIGERIA - REGISTRATION
14 1316 18 16 1817
28 28
4246
51
Belowpoverty
Female Rural Male Urban Abovepoverty
Financial literacy Registration
2016: Financial literacy and account registration 2016: Mobile phone ownership and account registration 2016: Ability to send or receive text and account registration(Shown: Percentage of Nigerian adults, by demographic) (Shown: Percentage of Nigerian adults, by demographic) (Shown: Percentage of Nigerian adults, by demographic)
• Mobile phone ownership and the ability to send or receive text messages are more highly correlated with account registration than financial literacy.
• Financial literacy is not significantly higher among the demographic groups that hold registered accounts at higher rates, which suggests there may be some risk of misuse of financial services such as credit.
6471 73
84 8489
17
28 28
4246
51
Belowpoverty
Female Rural Male Urban Abovepoverty
Mobile phone ownership Registration
64
73 73
8386
89
17
28 28
4246
51
Belowpoverty
Female Rural Male Urban Abovepoverty
Ability to text Registration
Source: InterMedia Nigeria FII Tracker survey Wave 4 (N=6,352, 15+), August-October 2016.
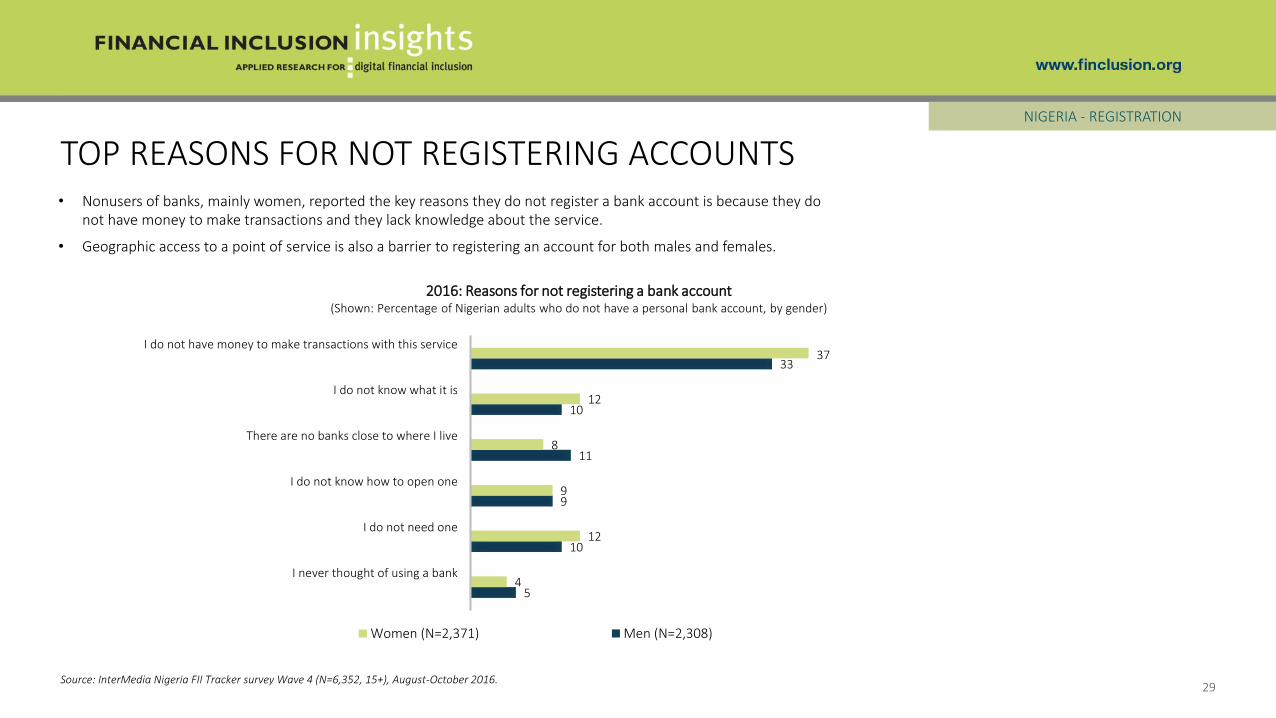
• Nonusers of banks, mainly women, reported the key reasons they do not register a bank account is because they do not have money to make transactions and they lack knowledge about the service.
• Geographic access to a point of service is also a barrier to registering an account for both males and females.
TOP REASONS FOR NOT REGISTERING ACCOUNTS
29
NIGERIA - REGISTRATION
2016: Reasons for not registering a bank account(Shown: Percentage of Nigerian adults who do not have a personal bank account, by gender)
5
10
9
11
10
33
4
12
9
8
12
37
I never thought of using a bank
I do not need one
I do not know how to open one
There are no banks close to where I live
I do not know what it is
I do not have money to make transactions with this service
Women (N=2,371) Men (N=2,308)
Source: InterMedia Nigeria FII Tracker survey Wave 4 (N=6,352, 15+), August-October 2016.
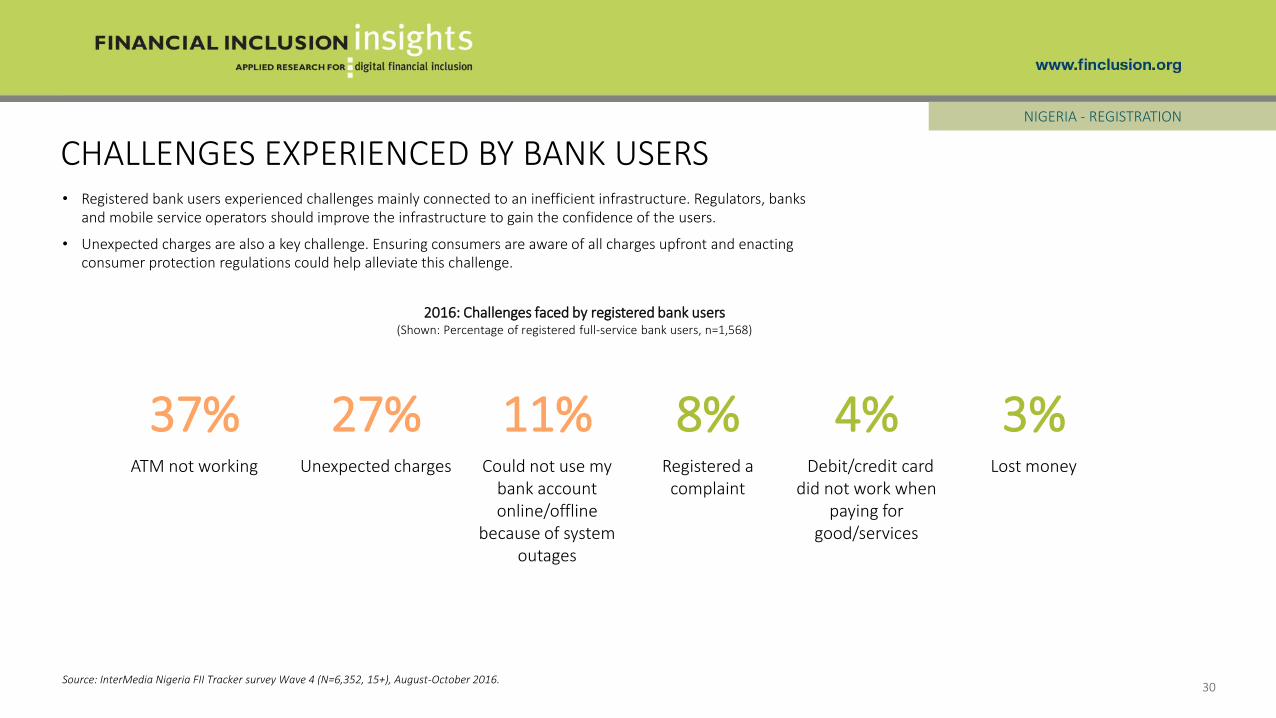
• Registered bank users experienced challenges mainly connected to an inefficient infrastructure. Regulators, banks and mobile service operators should improve the infrastructure to gain the confidence of the users.
• Unexpected charges are also a key challenge. Ensuring consumers are aware of all charges upfront and enacting consumer protection regulations could help alleviate this challenge.
CHALLENGES EXPERIENCED BY BANK USERS
30
NIGERIA - REGISTRATION
Source: InterMedia Nigeria FII Tracker survey Wave 4 (N=6,352, 15+), August-October 2016.
37% 27% 11% 8% 4% 3%ATM not working Unexpected charges Could not use my
bank account online/offline
because of system outages
Registered a complaint
Debit/credit card did not work when
paying for good/services
Lost money
2016: Challenges faced by registered bank users(Shown: Percentage of registered full-service bank users, n=1,568)

NBFI ACCOUNT HOLDERS
31
NIGERIA - REGISTRATION
• Few Nigerians have accounts with any NBFI. There is a need to develop a broad range of relevant products and services under the NBFI platform to spur uptake.
• While the sample of NBFI users is too small for analysis, the data show NBFI account holders use their accounts largely for savings, loans and basic activities.
Source: InterMedia Nigeria FII Tracker survey; Wave 4 (N=6,352, 15+), August-October 2016.
2016: Full-service nonbank financial institution usage(Shown: Percentage of Nigerian adults, N=6,352)
1
0.4
2
2
0.8
2
2
2
3
Cooperative
MFI
Any NBFI
Active registered user Registered user Ever used
2016: Use of nonbank financial institution accounts(Shown: Percentage of account holders for each institution)
8578
21 1915
8278
12
20
10
Deposit money Withdraw money Take a loan Save money for afuture purchase or
payment
Send money tofamily
members/friends
MFI (n=34) Cooperative (n=84)

ACTIVE USE
32
PRECONDITIONS ACCESS & TRIAL REGISTRATION ACTIVE USE ADVANCED ACTIVE USE
NIGERIA

ACTIVE USE
33
NIGERIA – ACTIVE USE
0.1
35 35
23
38 39
0.52
33 34
1 2
31 32
Mobile money Nonbank financialinstitution
Bank Any financial service
2013 (N=6,002) 2014 (N=6,000) 2015 (N=6,001) 2016 (N=6,352)
Active registered users(Shown: Percentage of Nigerian adults for each year)
N/A
11% of active mobile money users only use mobile money for CICO and P2P transfers
7%
39%
• Active registered account use is highest for bank account holders, and lowest among mobile money account holders.
• Most mobile money active users do not utilize the full capabilities of this financial service because they only turn to mobile money for cash-in/cash-out (CICO) and P2P transfers.
of active mobile money users only use mobile money for depositing and/or withdrawing money
of active mobile money users never deposit or withdraw money to/from mobile money accounts
Source: InterMedia Nigeria FII Tracker surveys Wave 1 (N=6,002, 15+), September-December 2013; Wave 2 (N=6,000 15+), July-September 2014; Wave 3 (N=6,001, 15+), August-September 2015; Wave 4 (N=6,352, 15+), August-October 2016.

ACTIVE USE
34
NIGERIA – ACTIVE USE
12 12
0.3 0.9
19 19
0.7 0.9
Any financialservice
Bank MM NBFI
Female Male
2016: Active use of registered financial accounts(Shown: Percentage of Nigerian adults, by gender)
Bank active use, by demographic
0.1
0.3 0.3
0.7
0.10.2
0.3
0.8
0.1
0.4 0.4
0.2
2013 2014 2015 2016
Female
Rural
Poor
Mobile money active use, by demographic
NBFI active use, by demographic
32 2
32
1NA
32
0.8
2013 2014 2015 2016
Female
Rural
Poor
30 3126 24
2832
26 25
35 3630
13
2013 2014 2015 2016
Female
Rural
Poor
• Apart from banks, active use of financial services remained very low in 2016. Active users of NBFIs and mobile money also rely heavily on banks; as a result, they may not be motivated to expand active use with other financial institutions.
• The apparently large declines in active use among the poor were largely caused by a large population movement from below to above the poverty line due to a change in the methodology used by the Progress out of Poverty Index, which is used to measure the poverty line in Nigeria.
Source: InterMedia Nigeria FII Tracker surveys Wave 1 (N=6,002, 15+), September-December 2013; Wave 2 (N=6,000 15+), July-September 2014; Wave 3 (N=6,001, 15+), August-September 2015; Wave 4 (N=6,352, 15+), August-October 2016.

ADVANCED ACTIVE USE
35
PRECONDITIONS ACCESS & TRIAL REGISTRATION ACTIVE USE ADVANCED ACTIVE USE
NIGERIA

• Advanced active use is highest for bank accounts suggesting that compared to mobile money accounts, banks fit well with consumers’ routine activities in the current market ecosystem.
• Most advanced active bank users tend to use their accounts on a monthly basis.
ADVANCED ACTIVE USE
36
NIGERIA – ADVANCED ACTIVE USE
Advanced active registered users*(Shown: Percentage of Nigerian adults for each year)
* Individuals who ever used advanced financial services
Source: InterMedia Nigeria FII Tracker surveys Wave 1 (N=6,002, 15+), September-December 2013; Wave 2 (N=6,000 15+), July-September 2014; Wave 3 (N=6,001, 15+), August-September 2015; Wave 4 (N=6,352, 15+), August-October 2016.
30-day active use 90-day active use
0.5% Mobile money 0.5%
14.2% Bank 16.9%
2016: Thirty- and 90-day active users of advanced services(Shown: Percentage of Nigerian adults, N=6,000)
0.0
11 11
0.2
2
20
22
0.2 0.7
19 19
0.6 0.7
20 20
Mobile money NBFI Bank Any financial institution
2013 (N=6,002) 2014 (N=6,000) 2015 (N=6,001) 2016 (N=6,352)
N/A

• Financial practices often take place in Nigeria outside of full-service financial institutions. There is a clear demand for advanced services that is not being met by the products offered by formal institutions.
• Four in 10 Nigerians have performed at least one financial transaction, which could help the uptake of a service and motivate potential users to obtain the skills and equipment needed to use advanced financial services.
• Insurance services uptake is very low in this market. Most Nigerians save money and invest (2016 shows the highest score among those who have ever invested).
NEED FOR ADVANCED FINANCIAL TOOLS
37
NIGERIA – ADVANCED ACTIVE USE
43% performed at least one financial
transaction
Advanced financial activities of Nigerian adults(Shown: Percentage of Nigerian adults, by year)
Source: InterMedia Nigeria FII Tracker surveys ; Wave 2 (N=6,000 15+), July-September 2014; Wave 3 (N=6,001, 15+), August-September 2015; Wave 4 (N=6,352, 15+), August-October 2016.
64% 62%58%
14%
25% 23%
8%6% 4%
41% 39%
52%
2014 2015 2016
Save money (ever) Borrow money (ever) Have insurance (ever) Invest (ever)

38
NIGERIA – ADVANCED ACTIVE USE
• More than half of households with school-age children paid school fees in 2016 and a few paid fees through banks. School fees could serve as a good use case for expanding digital financial products and services.
• Lack of funds is the key challenge to paying school fees.
SCHOOL FEE PAYMENTS
Source: InterMedia Nigeria FII Tracker survey Wave 4 (N=6,352, 15+), August-October 2016.
60% 56% 62%of Nigerians have
school-age childrenhave children
enrolled in schoolpaid school fees
2016: Households with school-age children
7% of adults who paid school fees for their children paid fees through banks
2016: Challenges faced when paying school fees(Shown: Percentage of adults with school-age children [3+] , n=1,781)
N=6,352 n=3,434N=6,352
8%
39%
41%
Bank issues (high fees or long lines)
Lack of funds, could not pay at all
Lack of funds, could only pay a portion

39
NIGERIA – ADVANCED ACTIVE USE
• Twenty-eight percent of adults are unaware of mobile money and are paying school fees, suggesting a potential channel for introducing this segment to digital payments.
• Most of those unaware nonusers who pay fees are young, female, educated and living in rural areas.
UNAWARE NONUSERS AND SCHOOL FEE PAYMENTS
Source: InterMedia Nigeria FII Tracker survey Wave 4 (N=6,352, 15+), August-October 2016.
2016: Profile of unaware nonusers who pay school fees (Shown: Percentage of unaware nonusers of mobile money who pay school fees, n=1,448)
2016: Unaware nonusers of mobile money (MM) who pay school fees (Shown: Percentage of Nigeria adults, N=6,352)
28%, unaware of MM
and paying school fees
None/primary education
28%
Secondary education and
above
70%
Urban
43%
Rural
57%
Literacy
75%
Numeracy
96%
Younger than 35 years
51%
35 years and older
49%
Above poverty line
51%
Below poverty line
49%
Male
43%
Female
57%
SPECIAL TOPIC I: FINANCIAL LIVES
NIGERIA
40

41
SOURCES OF INCOMENIGERIA – FINANCIAL LIVES
• Six in 10 Nigerian adults are gainfully employed, 8% are unemployed.
24%Housewife or student
4% Retired or disabled
5% Others/Don’t know
8% Unemployed, seeking jobs
60%Gainfully employed
Source: InterMedia Nigeria FII Tracker survey Wave 4 (N=6,352, 15+), August-October 2016.
2016: Sources of income(Shown: Percentage of Nigerian adults, N=6,352)
42
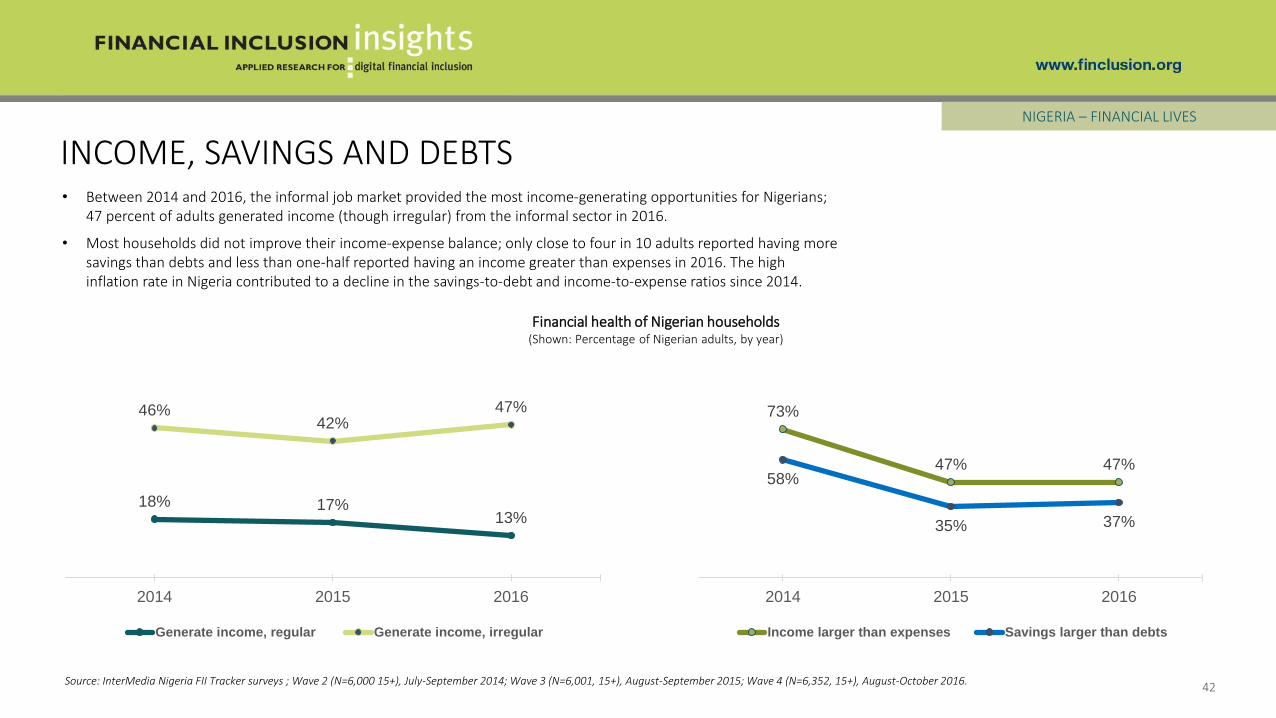
INCOME, SAVINGS AND DEBTSNIGERIA – FINANCIAL LIVES
Financial health of Nigerian households(Shown: Percentage of Nigerian adults, by year)
• Between 2014 and 2016, the informal job market provided the most income-generating opportunities for Nigerians; 47 percent of adults generated income (though irregular) from the informal sector in 2016.
• Most households did not improve their income-expense balance; only close to four in 10 adults reported having more savings than debts and less than one-half reported having an income greater than expenses in 2016. The high inflation rate in Nigeria contributed to a decline in the savings-to-debt and income-to-expense ratios since 2014.
Source: InterMedia Nigeria FII Tracker surveys ; Wave 2 (N=6,000 15+), July-September 2014; Wave 3 (N=6,001, 15+), August-September 2015; Wave 4 (N=6,352, 15+), August-October 2016.
18% 17%13%
46%42%
47%
2014 2015 2016
Generate income, regular Generate income, irregular
73%
47% 47%58%
35% 37%
2014 2015 2016
Income larger than expenses Savings larger than debts

43
BUDGETING BEHAVIORSNIGERIA – FINANCIAL LIVES
2016: How often do you make a plan for how to spend your income?(Shown: Percentage of Nigerian adults)
(Shown: Percentage of Nigerian adults who budget
income, n=4,541)
How often do you stick to your budget?
For what period do you budget?
(Shown: Percentage of Nigerian adults who
budget income, n=4,541)
• The majority of Nigerians budgeted their incomes and expenses – more than three-quarters of adults reported budgeting their incomes “at least sometimes” and a majority of them adhered to their budgets “at least sometimes.”
• More than one-quarter of Nigerians budgeted one day at a time because they were only certain of that day’s income.
Source: InterMedia Nigeria FII Tracker survey Wave 4 (N=6,352, 15+), August-October 2016.
Rarely or never, 23%
At least sometimes
77%
At least sometimes
92%
Rarely or never, 8%
More than a week, 32%
One week, 34%
One day, 27%
Do not plan, 7%
44
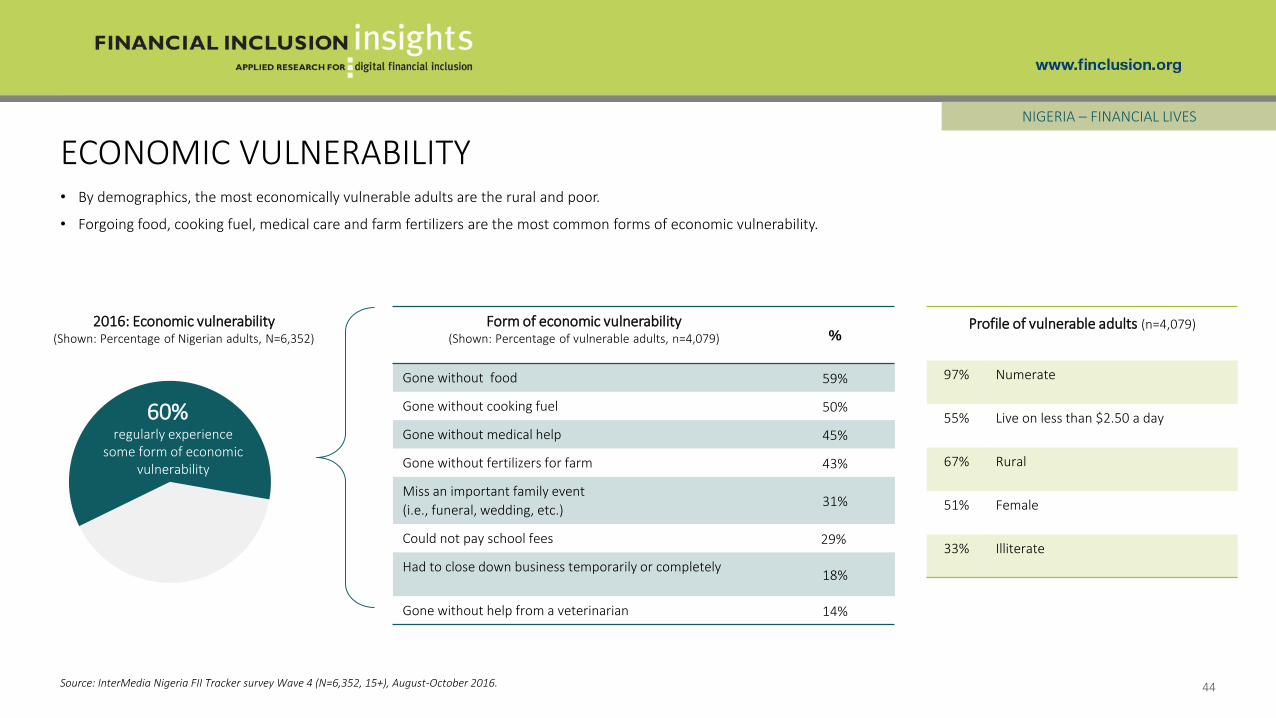
ECONOMIC VULNERABILITYNIGERIA – FINANCIAL LIVES
Form of economic vulnerability (Shown: Percentage of vulnerable adults, n=4,079) %
Gone without food 59%
Gone without cooking fuel 50%
Gone without medical help 45%
Gone without fertilizers for farm 43%
Miss an important family event
(i.e., funeral, wedding, etc.)31%
Could not pay school fees 29%
Had to close down business temporarily or completely18%
Gone without help from a veterinarian 14%
regularly experience some form of economic
vulnerability
2016: Economic vulnerability(Shown: Percentage of Nigerian adults, N=6,352)
60%
• By demographics, the most economically vulnerable adults are the rural and poor.
• Forgoing food, cooking fuel, medical care and farm fertilizers are the most common forms of economic vulnerability.
Source: InterMedia Nigeria FII Tracker survey Wave 4 (N=6,352, 15+), August-October 2016.
Profile of vulnerable adults (n=4,079)
97% Numerate
55% Live on less than $2.50 a day
67% Rural
51% Female
33% Illiterate

45
ECONOMIC VULNERABILITY AND FINANCIAL INCLUSIONNIGERIA – FINANCIAL LIVES
• The proportion of economically vulnerable adults rose significantly vs. 2015 (60% in 2016 up from 42% in 2015). The increasing inflation rate contributed to increases in food prices. Fewer Nigerian adults have a plan for unexpected events.
• There is less economic vulnerability within the financially included group.
Source: InterMedia Nigeria FII Tracker survey Wave 4 (N=6,352, 15+), August-October 2016.
21
43
60
2016: Financial responsibility, vulnerability(Shown: Percentage of Nigerian adults, N=6,352)
Financially included(n=1,638)
Financially excluded(n=4,714)
Able to pay bills on time
Regularly experience economic vulnerability (i.e., can’t afford food, medical expenses)
Have a financial plan for unexpected events
59% 34%
23% 20%
48% 67%

46
NIGERIA – FINANCIAL LIVES
• Saving and borrowing from both formal and semi-formal financial tools declined from 2014 to 2016, a sign of the hard economic times in Nigeria.
Financial state of Nigerian households*(Shown: Percentage of Nigerian adults, by year)
FORMAL AND INFORMAL FINANCIAL TOOLS
Source: InterMedia Nigeria FII Tracker surveys Wave 2 (N=6,000 15+), July-September 2014; Wave 3 (N=6,001, 15+), August-September 2015; Wave 4 (N=6,352, 15+), August-October 2016.
41
14
38 3936
9
33 3435
6 5
20
Saving with formal andsemi-formal financial tools
Saving with informalfinancial tools
Borrowing with formal andsemi-formal financial tools
Borrowing with informalfinancial tools
2014 2015 2016
*Questions were asked slightly differently in 2014 compared to 2015 and 2016.
Formal and semi-formal financial tools include
banks, mobile money, microfinance institutions,
cooperatives and digital cards.
Informal financial tools include a village saving
and loan association, ROSCA, merry-go-round,
assets and in-kind goods, other people, and
safe places.

47
SAVING/BORROWING AND TYPES OF INSURANCE NIGERIA – FINANCIAL LIVES
• Most Nigerians borrow from family and friends and few have insurance.
• Notably, after banks, saving money at home is considered the next best option, suggesting ease of fungibility, or financial uncertainty and suspicion of formal financial institutions.
2
4
5
6
23
35
2
4
7
9
20
36
9
14
17
41
Savings via asset purchase
Savings account an informal saving-lending group
Other people (e.g., family, friends,neighbors, shopkeepers, etc.)
Savings with a ROSCA/Esusu/merry-go-round
In a safe place at home or onyourself in cash
Bank
Saving channels(Shown: Percentage of Nigerian adults, by year)
Borrowing channels(Shown: Percentage of Nigerian adults, by year)
Types of insurance(Shown: Percentage of Nigerian adults, by year)
Source: InterMedia Nigeria FII Tracker surveys Wave 1 (N=6,002, 15+), September-December 2013; Wave 2 (N=6,000 15+),July-September 2014; Wave 3 (N=6,001, 15+), August-September 2015; Wave 4 (N=6,352, 15+), August-October 2016.
0.3
0.9
2
3
16
0
1
2
4
17
0
1
1
4
10
Mobile money account
MFI
Bank
Esusu
Family and friends
2014 2015 2016
0.4
0.5
0.5
0.9
1
2
1
2
3
0.6
2
2
3
4
2
Property/asset
Agriculture
Life
Medical
Vehicle
KEY INDICATORS SUMMARY
NIGERIA
48
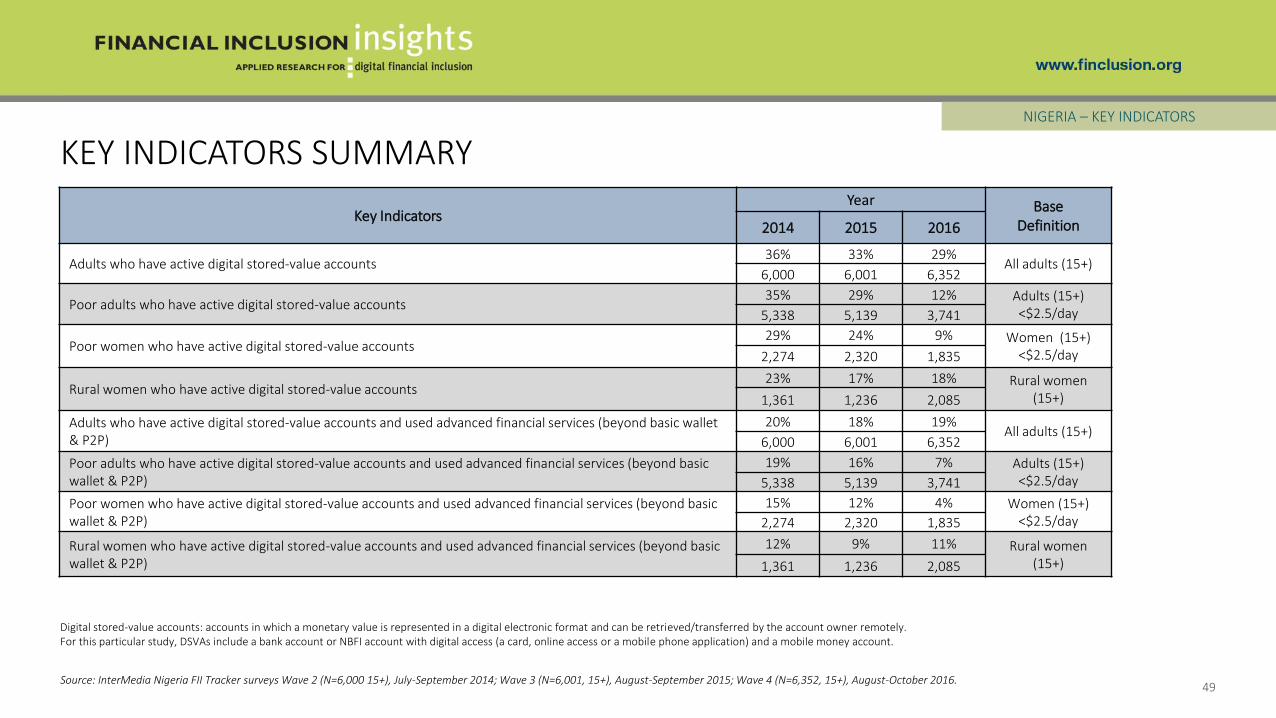
49
Key IndicatorsYear Base
Definition2014 2015 2016
Adults who have active digital stored-value accounts36% 33% 29%
All adults (15+)6,000 6,001 6,352
Poor adults who have active digital stored-value accounts35% 29% 12% Adults (15+)
<$2.5/day5,338 5,139 3,741
Poor women who have active digital stored-value accounts29% 24% 9% Women (15+)
<$2.5/day2,274 2,320 1,835
Rural women who have active digital stored-value accounts 23% 17% 18% Rural women
(15+)1,361 1,236 2,085
Adults who have active digital stored-value accounts and used advanced financial services (beyond basic wallet & P2P)
20% 18% 19%All adults (15+)
6,000 6,001 6,352
Poor adults who have active digital stored-value accounts and used advanced financial services (beyond basic wallet & P2P)
19% 16% 7% Adults (15+) <$2.5/day5,338 5,139 3,741
Poor women who have active digital stored-value accounts and used advanced financial services (beyond basic wallet & P2P)
15% 12% 4% Women (15+) <$2.5/day2,274 2,320 1,835
Rural women who have active digital stored-value accounts and used advanced financial services (beyond basic wallet & P2P)
12% 9% 11% Rural women (15+)1,361 1,236 2,085
Digital stored-value accounts: accounts in which a monetary value is represented in a digital electronic format and can be retrieved/transferred by the account owner remotely. For this particular study, DSVAs include a bank account or NBFI account with digital access (a card, online access or a mobile phone application) and a mobile money account.
KEY INDICATORS SUMMARYNIGERIA – KEY INDICATORS
Source: InterMedia Nigeria FII Tracker surveys Wave 2 (N=6,000 15+), July-September 2014; Wave 3 (N=6,001, 15+), August-September 2015; Wave 4 (N=6,352, 15+), August-October 2016.

METHODOLOGY & RESEARCH DESCRIPTION
50
NIGERIA
SURVEY SUMMARY
• Annual, nationally representative survey (N=6,352) of Nigerian adults aged 15+
• Face-to-face interviews lasting, on average, 69 minutes
• Fourth survey (Wave 4) conducted from August 2 to October 4, 2016
• Tracks trends and market developments in DFS based on the information gathered in the first survey, conducted in 2013, the second survey, conducted in 2014, and the third survey, conducted in 2015.
DATA COLLECTION
• Basic demographics and poverty measurement using the Grameen Progress Out of Poverty Index (PPI). A new set of country-specific survey questions was introduced for Nigeria by the Grameen Foundation in July 2015 guided by Nigeria’s 2012/13 General Household Panel Survey.
• Access/use of mobile devices
• Access/use of mobile money
• Access/use of formal financial services (e.g., bank accounts)
• Access/use of semi-formal and informal financial services (e.g., microfinance institutions and self-help groups like Esusu)
• Financial literacy and preparedness
• General financial behaviors
FII NIGERIA TRACKER SURVEY DETAILS
51
NIGERIA – METHODOLOGY & RESEARCH
Source: InterMedia Nigeria FII Tracker survey Wave 4 (N=6,352, 15+), August-October 2016.

GLOSSARYAccess to banks – Counts individuals who have a full-service bank account registered in their name or report use of a full-service bank account that belongs to someone else.
Access to mobile money or an NBFI – Counts individuals who have ever used a mobile money service or a full-service NBFI account.
Active registered user – An individual who has an account registered in their name and has used it in the last 90 days.
Adults with DFS access – Adults (15+) who either own a DFS account or have access to someone else’s account.
Advanced active registered user – An active registered user who has ever used at least one advanced financial service.
Advanced DFS use – Advanced use of digital financial services includes activities other than basic cash-in, cash-out and person-to-person transfers, such as savings, bill pay, investment, and insurance.
Basic use – The use of an account to cash-in (deposit) or cash-out (withdraw), transfer money to another individual, or conduct account maintenance.
Below the poverty line – In this particular study, adults living on less than $2.50 per day, as classified by the Grameen Foundation’s Progress out of Poverty Index.
Cooperative – Typically, a business or other professional organization that is owned and run jointly by its members, who share profits or benefits. Cooperatives may release some of the profits/funds as loans to its members.
Customer journey – An illustration of progressive stages through which consumers become more active users of more sophisticated financial services.
Credit-only nonbank financial institutions – Financial institutions that only disburse loans to their customers.
Digital financial services (DFS) – Financial services provided through an electronic platform (e.g., mobile phones, debit or credit electronic cards, internet).
Financial inclusion – Individuals who have an account with an institution that provides a full suite of financial services and comes under some form of government regulation. Services include savings, money transfers, insurance or investment. Institutions that only offer loans to consumers, such as some MFIs, are not considered to be full-service institutions.
Financial literacy – Basic knowledge of four fundamental concepts in financial decision-making (interest rates, interest compounding, inflation, and risk diversification) as measured by the Standard and Poor’s Rating Service’s Global Financial Literacy Survey.
Full-service financial institutions – Financial institutions that offer loans to their customers and at least one of the followingadditional services: savings, money transfers, insurance, or investments.
Grameen Progress out of Poverty Index (PPI) – A poverty measurement tool from the Grameen Foundation wherein a set of country-specific questions are used to compute the likelihood that a household is living below a specific income threshold.
Microfinance institution (MFI) – An organization that offers financial services to low-income populations. Almost all give loans to their members, and many offer insurance, deposit and other services.
Mobile money (MM) – A service in which a mobile phone is used to access financial services.
Nonbank financial institution (NBFI) – A financial organization that is not formally licensed as a bank or a mobile money provider, but whose activities are regulated, at least to some extent, by the central bank within the country. Such financial institutions include microfinance institutions (MFI), cooperatives, Post Office (Savings) Banks and savings and credit cooperatives (SACCOs).
Numeracy – The ability to use basic math skills, including counting, addition, division, multiplication and computing short-and long-term interest rates.
Post Office (Savings) Bank – A bank that offers savings and money transfers and has branches at local post offices.
Registered user – Counts individuals who have a financial account registered in their name.
Savings and credit cooperative (SACCO) – A unique member-driven, self-help group owned and managed by its members, who have a common bond. Its main purpose is to build up funds through regular contributions by each member, with the aim of providing affordable credit and collective investments for its members.
Unregistered/over-the-counter (OTC) user – An individual who has used DFS through someone else’s account, including a mobile money agent’s account or the account of a family member or a neighbor.
Urban/rural – Urban and rural persons are defined according to their residence in urban or rural areas as prescribed by the national bureau of statistics.
52
TANZANIA
For more information, contact:
Charles Wanga, Research Manager [email protected]
Samuel Schueth, Director of Research [email protected]