Embed Size (px)
Citation preview
1 E-SEE Main Trial Statistical Analysis Plan v1
Study title: E-SEE Main trial
Enhancing Social-Emotional Health and Wellbeing in the Early Years (E-SEE): A
Community-based Randomised Controlled Trial and Economic Evaluation of the
Incredible Years Infant and Toddler (0-2) Parenting Programmes
NIHR 13/93/10 ISRCTN11079129
Statistical Analysis Plan v1 06/02/2020
Authored by Laura Mandefield & Dr Matthew Bursnall (signatory) E-SEE Statisticians Clinical Trials Research Unit, University of Sheffield __________________________________ ___/___/_____ Date Approved by Professor Tracey Bywater Chief Investigator Department of Health Sciences, University of York __________________________________ ___/___/_____ Date Dr Dawn Teare Senior Trial Statistician University of Sheffield __________________________________ ___/___/_____ Date Dr Mike Robling Chair, Trial Steering Committee South East Wales Trials Unit, Cardiff University _________________________________ ___/___/_____ Date Professor Stavros Petrou Chair, Data Monitoring Committee Nuffield Department of Primary Care Health Sciences, University of Oxford __________________________________ ___/___/_____ Date
2 E-SEE Main Trial Statistical Analysis Plan v1
Contents 1 Introduction ....................................................................................................................... 5
1.1 Study Outline .............................................................................................................................................. 5 1.2 Objectives .................................................................................................................................................... 6
2 Outcome measures ........................................................................................................... 6
2.1 Primary outcome measure ................................................................................................................... 6 2.2 Secondary outcome measures ........................................................................................................... 7
2.2.1 Child secondary outcome measures ................................................................... 7 2.2.2 Primary care-giver and co-parent secondary outcomes ...................................... 7 2.2.3 Parent-child dyad secondary outcome measures ................................................ 7
3 Sample Size Estimation .................................................................................................... 8
4 Randomisation, Inclusion in the Intervention Arm & Blinding ............................................. 8
4.1 Sequence generation .............................................................................................................................. 8 4.2 Inclusion in the Intervention arm........................................................................................................ 8 4.3 Blinding ......................................................................................................................................................... 9
5 Interim Analysis & Study Monitoring .................................................................................. 9
6 Data Collection ............................................................................................................... 10
6.1 Data Sources ............................................................................................................................................10 7 Statistical Analysis .......................................................................................................... 10
7.1 General Considerations ........................................................................................................................10 7.2 Participant flow .......................................................................................................................................... 11
7.2.1 Attrition ............................................................................................................. 11 7.3 Baseline Characteristics ........................................................................................................................ 11 7.4 Intervention Adherence & Fidelity ..................................................................................................... 12 7.5 Analysis Populations .............................................................................................................................. 12
7.5.1 Intention to treat (ITT) ....................................................................................... 12 7.5.2 Per protocol ...................................................................................................... 13
7.6 Analysis of the primary outcome ....................................................................................................... 13 7.6.1 Primary Analysis of the primary outcome .......................................................... 13 7.6.2 Sensitivity Analysis of the primary outcome ...................................................... 14
7.7 Analysis of key secondary outcomes ................................................................................................ 15 7.8 Analysis of other secondary outcomes ........................................................................................... 15 7.9 Safety............................................................................................................................................................ 16 7.10 Changes from analysis specified in the Protocol ......................................................................... 16
8 Detailed Statistical Methods and Calculations ................................................................. 17
8.1 Missing Spurious & Unused Data ...................................................................................................... 17 8.1.1 Missing data ..................................................................................................... 17 8.1.2 Missing items within questionnaires .................................................................. 17
9 Data manipulations and definitions ................................................................................. 17
9.1 Primary outcome ..................................................................................................................................... 17 9.1.1 Combining ASQ:SE-2 scores ............................................................................ 17
9.2 Patient reported outcomes .................................................................................................................. 19 9.3 CARE Index ................................................................................................................................................ 28
10 Additional Analyses ..................................................................................................... 28
10.1 Subgroup analyses ................................................................................................................................ 28
3 E-SEE Main Trial Statistical Analysis Plan v1
10.2 Breastfeeding ........................................................................................................................................... 29 11 Implementation of the Analysis Plan ............................................................................ 29
12 References .................................................................................................................. 29
13 Appendix ..................................................................................................................... 32
A. Appendix A Dummy Tables .................................................................................................................... 32 i. Participant flow ........................................................................................................ 32 ii. Baseline characteristics ........................................................................................... 33 iii. Analysis of primary outcomes results ....................................................................... 36 iv. Analysis of secondary outcomes results ............................................................... 40 v. Subgroup analysis results ........................................................................................ 42 vi. Safety analysis results .......................................................................................... 43 vii. Adherence to intervention ..................................................................................... 44

4 E-SEE Main Trial Statistical Analysis Plan v1
List of abbreviations used
AE Adverse Event ASQ:SE-2 Ages and stages questionnaire: social and emotional, 2nd edition CI Confidence Interval CTRU Clinical Trials Research Unit DMEC Data Monitoring and Ethics Committee E-SEE Enhancing Social and Emotional health in the Early years FU Follow-up ICC Intraclass Correlation Coefficient IQR Inter Quartile Range ITT Intention to treat IY The Incredible Years programme IY-I Incredible Years Infant programme IY-T Incredible Years Toddler programme LA Local Authority NIHR National Institute for Health Research PHQ-9 Patient Health Questionnaire RCT Randomised Controlled Trial SAE Serious Adverse Event SAP Statistical Analysis Plan SAU Services as usual SD Standard Deviation SE Standard Error SOP Standard Operating Procedure TMG Trial management group TSC Trial steering committee
Summary table
Trial title Enhancing Social-Emotional Health and Wellbeing in the Early Years (E-SEE):
A Community-based Randomised Controlled Trial and Economic Evaluation of
the Incredible Years Infant and Toddler (0-2) Parenting Programmes
Trial design A parallel, two arm, individually randomised controlled trial. Participants
randomly allocated to intervention or control in a 5:1 ratio. Intervention parents
receive an IY-B book (universal level). Dependent on level of need at data
collection points 2 and 3, intervention parents may be invited to join a IY-I
programme (10 weeks; 2 hours/ week) and/or IY-T (12 weeks; 2 hours/ week).
Control parents receive services as usual. IY-I and IY-T are not offered as part
of SAU in participating LAs.
Trial participants Parents of children aged 0 to 2 months at baseline, identified by children’s
centre staff, self-referral, Health Visitors and parent advisory committee. Level
of need is assessed by completion of a self-report mental health questionnaire
(parent) and a parent-report measure of child social and emotional
development. Co-parents are included in measure completion (and in parent
programmes if parent is allocated to intervention condition at each level of
intervention dose).
Sample size 606 participants allocated in a ratio of 5:1 (intervention:control)
5 E-SEE Main Trial Statistical Analysis Plan v1
Follow-up Measures are administered during home or community based visits at four
intervals; baseline and three follow-ups (2, 9 and 18 months post baseline
assessment).
Primary analysis Repeated measures analysis on ASQ:SE-2 scores, comparing treatment and
control groups to investigate the effectiveness of the proportionate delivery of
the IY E-SEE steps/model overall on child social and emotional wellbeing.
Key Secondary
analyses
Repeated measures analysis on PHQ-9 scores, comparing treatment and
control groups to investigate the effectiveness of the proportionate delivery of
the IY E-SEE steps/model overall on parent depression levels
1 Introduction
This document outlines the detailed statistical analysis plan (SAP) for the E-SEE main trial and
is intended to be read in conjunction with the current study protocol (v10. This SAP is written in
conjunction with the International Conference on Harmonisation topic E9 (ICH E9 Expert
Working Group, 1999), guidance for the content of SAPs in clinical trials (Gamble et al., 2017),
applicable statistical standard operating procedures (SOPs) from the University of Sheffield
Clinical Trials Research Unit (CTRU) and trial documents (Protocol and Data Validation
Specification). The trial is conducted in accordance with Good Clinical Practice in Clinical Trials
(ICH Harmonised Tripartite Guideline, 1996) and Medicine for Human Use (Clinical Trials)
Regulations (UK Statutory Instruments, 2004).
This SAP will guide the Trial Statistician during the statistical analysis of all quantitative
outcomes in order to answer the objectives of the study. It excludes the health economic and
process evaluations (which will be described elsewhere).
All analysis will be performed in a validated statistical software package such as R (Team,
2012).
1.1 Study Outline
E-SEE is a community based randomised controlled trial (RCT) designed to assess the
effectiveness of the Incredible Years (IY) parent programme when compared to service as
usual (SAU). The IY intervention comprises of three levels: the Incredible Babies book, and
two group-based programmes IY-Infant (IY-I) and IY-Toddler (IY-T). Detailed descriptions of
these components can be found in the study protocol (v10). Control condition parents/co-
parents receive SAU; IY-I and IY-T do not form part of SAU in the participating local
authorities (LAs), although other parenting programmes – including IY for older children - may
be available.

6 E-SEE Main Trial Statistical Analysis Plan v1
The E-SEE study comprises of two stages, phase 1 is an 18-month pilot study conducted in
two LAs and phase 2 is a 30-month main trial conducted in four LAs. The statistical analysis of
phase 1 has been outlined in a separate statistical analysis plan (see study documentation
table in references section.)
1.2 Objectives
a) Main effectiveness analyses of the intervention (compared to SAU) will be established
at the follow-up 18-months post-baseline to address the key research questions relating to
clinical outcomes.
b) Economic evaluation: Establish cost-effectiveness using health, quality of life and
service use data and IY intervention cost data, and explore the potential for long-term
modelling of costs and benefits by extrapolating from trial outcomes.
c) Comparative work: (1) Match and compare intervention participant outcomes with
cohort general population data (e.g. Millennium Cohort Study); and (2) Conduct international
comparison of outcomes with the complementary Irish trial, with IY-I and IY-T delivered in a
non-proportionate universalism model, and explore potential opportunity (pending agreement
from key stakeholders) to pool data from both studies to facilitate a meta-analysis.
d) Establishing the importance of process: engagement, referral, and implementation
fidelity rates will be at appropriate levels and effects of process, particularly fidelity, on
outcome will be examined. Qualitative work objectives include establishing parent and co-
parent perception of programmes and exploring the facilitative and inhibitive factors in service
delivery.
e) Establishing for whom the programme works best and how by exploring mediators and
moderators of change.
This SAP is concerned with the main effectiveness analysis (objective A). Objective B is
covered by the Health Economics Analysis; objective C is covered in an ancillary sub-study
(ancillary sub-study D in the protocol); objective D is covered by the process evaluation and
objective E will be covered in an additional ancillary sub-study following submission of the trial
manuscript. The protocol also outlines ancillary sub-studies A to C (See page 24 in Protocol
V10 11.06.2019). These ancillary sub-studies are covered in the appropriate sub-study
reports.
2 Outcome measures
2.1 Primary outcome measure
The following are measured at all time-points (baseline, 2, 9, and 18 months post-baseline),
unless otherwise stated:
7 E-SEE Main Trial Statistical Analysis Plan v1
a) Social and emotional wellbeing – to establish effectiveness of the proportionate delivery
of the IY E-SEE steps/model overall i.e. three levels of IY- the book, IY-I and IY-T, using
parent report Ages & Stages Questionnaire – Social Emotional (ASQ:SE-2). The co-
parent is not asked to complete this questionnaire.
2.2 Secondary outcome measures
2.2.1 Child secondary outcome measures1
The following measures are completed independently by parent and co-parent at all three
timepoints unless otherwise stated.
a) Behaviour – measured at 18-month follow-up using parent/co-parent report Strengths
and Difficulties Questionnaire (SDQ).
b) Cognitive development – measured at 18-month follow-up using parent/co-parent report
PedsQL Infant Scale.
c) Health (quality of life) – measured at 18-month follow-up using parent/co-parent report
PedsQL Infant Scale.
d) Service use –using parent report: Client Service Receipt Inventory (CSRI).
2.2.2 Primary care-giver and co-parent secondary outcomes
Key Secondary Outcome2 for primary care-giver and co-parent
a) Depression – to establish overall effectiveness of the IY programme, using the
parent/co-parent report Patient Health Questionnaire (PHQ-9).
Other Secondary outcomes for primary care-giver and co-parent
b) Carer-child attachment/interaction – measured at 18-month follow-up using parent/co-
parent report Maternal Postnatal Attachment Scale (MPAS) and/or Paternal Postnatal
Attachment Scale (PPAS).
c) Parenting skill – using parent/co-parent report Parent Sense of Competence (PSoC).
d) Health Related Quality of Life (HRQoL) –using parent/co-parent report EQ5D5L
e) Service use – using parent report CSRI.
2.2.3 Parent-child dyad secondary outcome measures
a) child feeding methods
1 The original intention was to use the Eyberg child behaviour inventory. This was replaced with the SDQ in the early stages of the trial and a protocol amendment made. [See version 5 amendments in ‘Protocol amendments since Version 1’ in version 10 of the protocol.] 2 In protocol v10 the PHQ-9 is described as the “parent and co-parent primary outcome”. In the published protocol the PHQ-9 is described as the ‘parent primary outcome’. These descriptions are technically incorrect because the trial is powered on ASQ-SE2 alone. PHQ-9 will be described as the key secondary outcome henceforth.
8 E-SEE Main Trial Statistical Analysis Plan v1
b) Dyadic synchrony3 – using the CARE Index, observational report, solely conducted with the parent-child dyad.
3 Sample Size Estimation
A detailed description of the sample size for the E-SEE Main trial can be found in protocol v10.
4 Randomisation, Inclusion in the Intervention Arm & Blinding
4.1 Sequence generation
Randomisation is at the individual level using a web-based randomisation system developed by
Sheffield CTRU in collaboration with a University spin-off company (epiGenesys) and using a
randomisation sequence prepared by the trial statistician. E-SEE participants are randomised
in a 5:1 ratio to intervention and control arms, stratified by:
depression scores (PHQ-9 score >=5) or child social emotional wellbeing (Child
ASQ:SE2 score>= Monitoring Zone);
sex of child;
sex of carer;
recruitment site (see above).
Prior to recruitment starting a test system was made available for training purposes. Any user
comments or suggestions on the usability of the system are fed back to the program developer
before the system is made live.
Randomisation occurs after eligibility has been established, informed consent obtained, and
baseline measures collected from parents to reduce initial attrition. The allocation schedule is
concealed and the intervention arm is only confirmed once eligibility and consent are confirmed
by researchers. A member of the University of York research team inputs participant information
to the online system to enable randomisation, with allocation results returned immediately. The
University of York trial coordinator informs families of allocation to condition.
4.2 Inclusion in the Intervention arm
If a participant is allocated to the intervention arm, they receive the IY-I Book. Following the
first follow up (2 months post baseline), only participants with a Parent PHQ-9 score >=5 OR
Child ASQ:SE2 score>= ‘Monitoring’ in the intervention arm are offered the IY-I programme.
Following the second follow up (9 months post baseline) only participants with Parent PHQ-9
3 In protocol v10 the CARE Index is described as a child attachment measure and listed as a child secondary outcome. Child attachment is just one part of the Index and we will use the overall dyadic synchrony score which is a parent-child dyad measure.
9 E-SEE Main Trial Statistical Analysis Plan v1
score >=5 OR Child ASQ:SE2 score>= ‘Monitoring’ in the intervention arm are offered the IY-T
programme.
Non-research participants may be included in the IY-I and IY-T groups. Parents can be invited
by service staff to join the group based on professional judgement/assessment that they meet
the same eligibility criteria as research participants. We do not collect data for these
participants; they attend as they would for any other parenting intervention delivered at that
site. This is accepted practice in these types of research interventions when there are
concerns about group size.
4.3 Blinding
The trial statistician will remain blind during the study until database freeze. At database
freeze, the statistician will receive unblinded data. Full details of blinding can be found in the
study protocol (v10).
5 Interim Analysis & Study Monitoring
The following committees have been established:
1. Trial Steering Committee (TSC) - consists of an independent chair, a member with
early years expertise, an independent statistician, lay representatives (including a
member of the Parent Advisory Committee) and the chief investigator. The role of the
TSC is to provide supervision of the protocol and statistical analysis plan, to provide
advice on and monitor progress of the study, to review information from other sources
and consider recommendations from the DMEC. The TSC will meet at regular intervals
as outlined in the TSC terms of reference. The TSC can prematurely close the trial
following advice from the sponsor, funder, DMEC or TMG.
2. Trial Management Group (TMG) – The TMG consists of the chief investigator, trial
managers and others as deemed necessary. The CI chairs the meetings at regular
intervals as agreed by the group and oversees the day to day implementation of the
trial in accordance with the terms of reference.
3. Data Monitoring and Ethics Committee (DMEC)- includes an independent chair and
two independent members. The DMEC works in accordance with an agreed Charter,
reviewing reports provided by the CTRU to assess the progress of the study, the safety
data and the critical endpoint data as required.
These committees function in accordance with Sheffield CTRU standard operating procedures.
Membership details of these committees are provided in the protocol (v10).
10 E-SEE Main Trial Statistical Analysis Plan v1
6 Data Collection
6.1 Data Sources
The randomisation list is held on the CTRU’s randomisation system. Trial data are extracted
from source documents and entered onto the CTRU’s in house data management system
(PROSPECT). University of York staff conduct a data entry check on a 10% sample of CRFs.
The data management team in the Sheffield CTRU validate and query electronic data for
inconsistencies during the course of the trial (as stipulated in SOP DM005), The trial statistician
will conduct any additional validation checks where appropriate before database lock (as guided
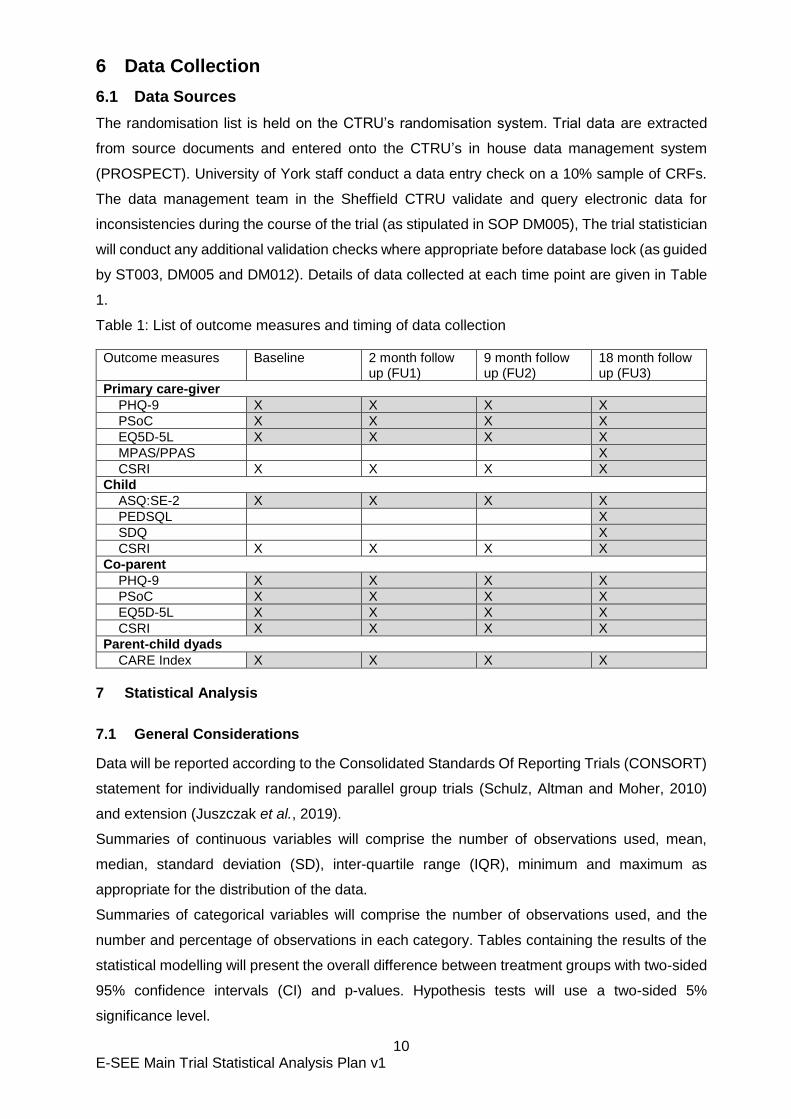
by ST003, DM005 and DM012). Details of data collected at each time point are given in Table
1.
Table 1: List of outcome measures and timing of data collection
Outcome measures Baseline 2 month follow up (FU1)
9 month follow up (FU2)
18 month follow up (FU3)
Primary care-giver
PHQ-9 X X X X
PSoC X X X X
EQ5D-5L X X X X
MPAS/PPAS X
CSRI X X X X
Child
ASQ:SE-2 X X X X
PEDSQL X
SDQ X
CSRI X X X X
Co-parent
PHQ-9 X X X X
PSoC X X X X
EQ5D-5L X X X X
CSRI X X X X
Parent-child dyads
CARE Index X X X X
7 Statistical Analysis
7.1 General Considerations
Data will be reported according to the Consolidated Standards Of Reporting Trials (CONSORT)
statement for individually randomised parallel group trials (Schulz, Altman and Moher, 2010)
and extension (Juszczak et al., 2019).
Summaries of continuous variables will comprise the number of observations used, mean,
median, standard deviation (SD), inter-quartile range (IQR), minimum and maximum as
appropriate for the distribution of the data.
Summaries of categorical variables will comprise the number of observations used, and the
number and percentage of observations in each category. Tables containing the results of the
statistical modelling will present the overall difference between treatment groups with two-sided
95% confidence intervals (CI) and p-values. Hypothesis tests will use a two-sided 5%
significance level.
11 E-SEE Main Trial Statistical Analysis Plan v1
Complete details of data derivations and methods for handling missing data is covered in
sections 8.1 and 9.
All analyses are based on the overall score only unless otherwise stated.
7.2 Participant flow
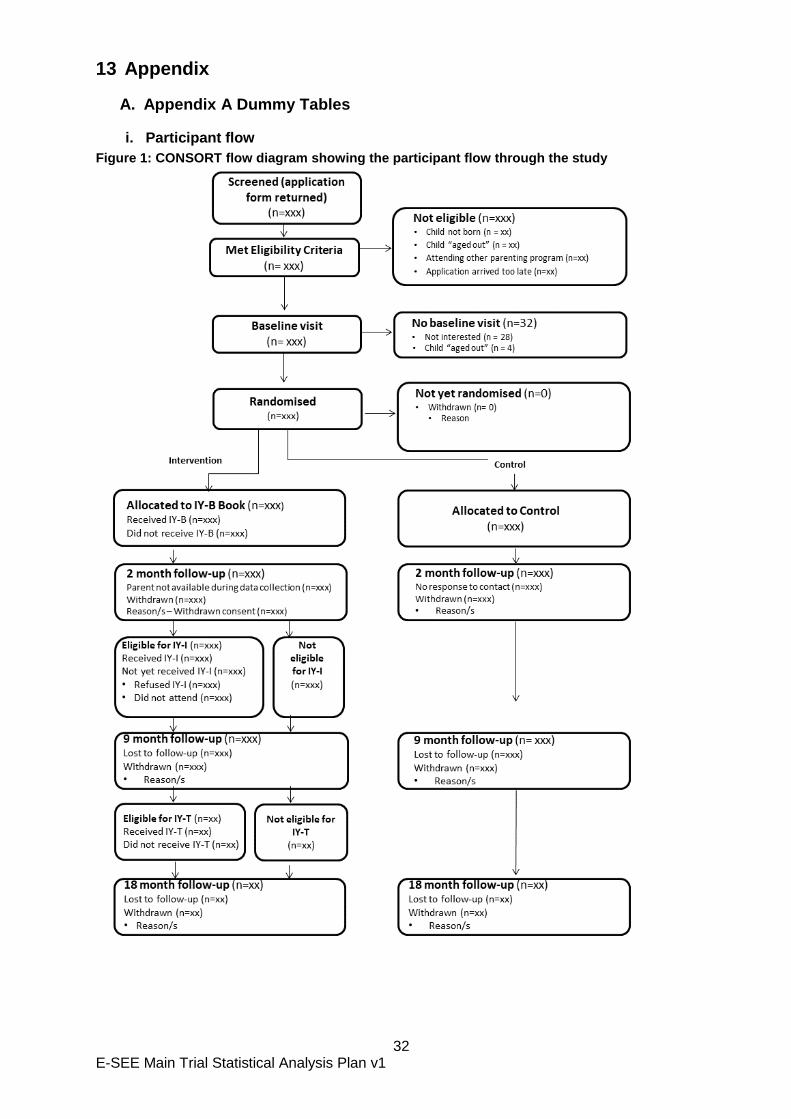
A CONSORT style flow diagram will show the flow of participants through the trial (Figure 1).
In addition to the flow diagram, tables showing more detailed summaries of the reasons for
refused consent and reasons for withdrawal will be presented.
7.2.1 Attrition
There are several reasons that a participant may not complete outcome data collection. These
include withdrawal of consent and loss to follow up. The number and proportion in each
category will be presented by intervention arm.
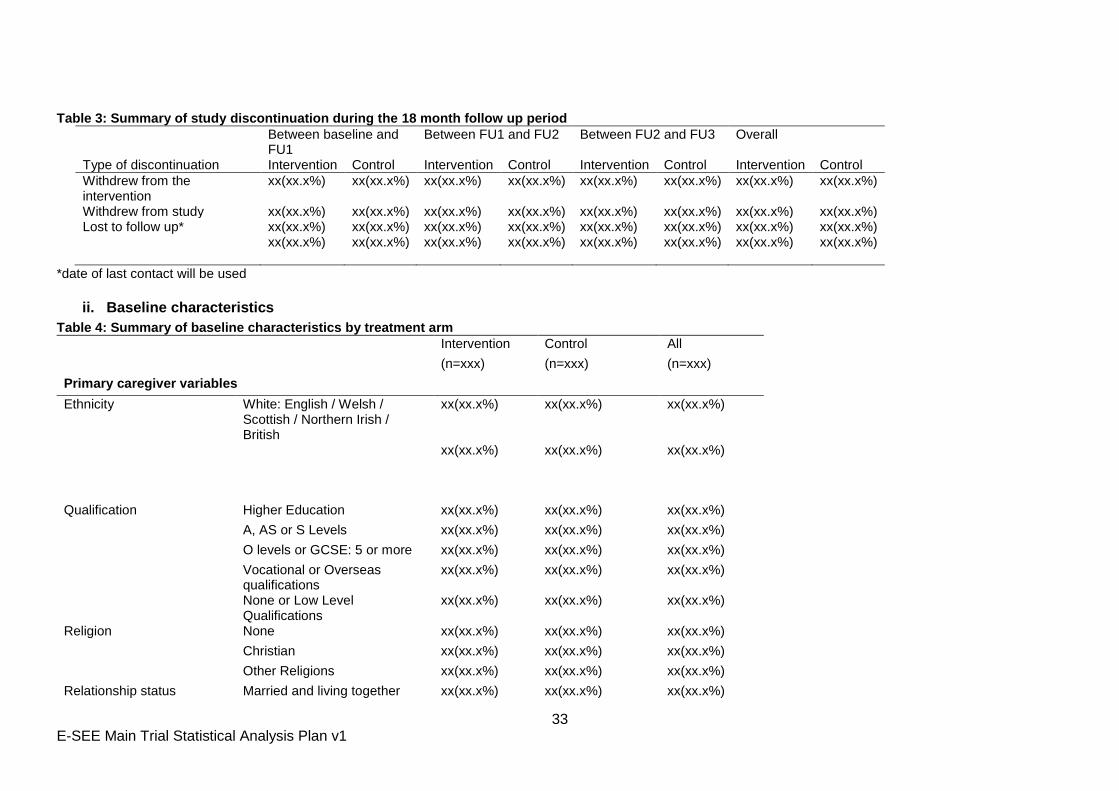
The number of each type of discontinuation will be presented as part of the CONSORT flow
diagram and will be summarised in more detail in a separate table which will include the timing
of discontinuation (between randomisation & FU1, between FU1 & FU2, between FU2 & FU3)
where possible (Appendix, Table 4). Where given, the reasons for withdrawal of consent will be
presented.
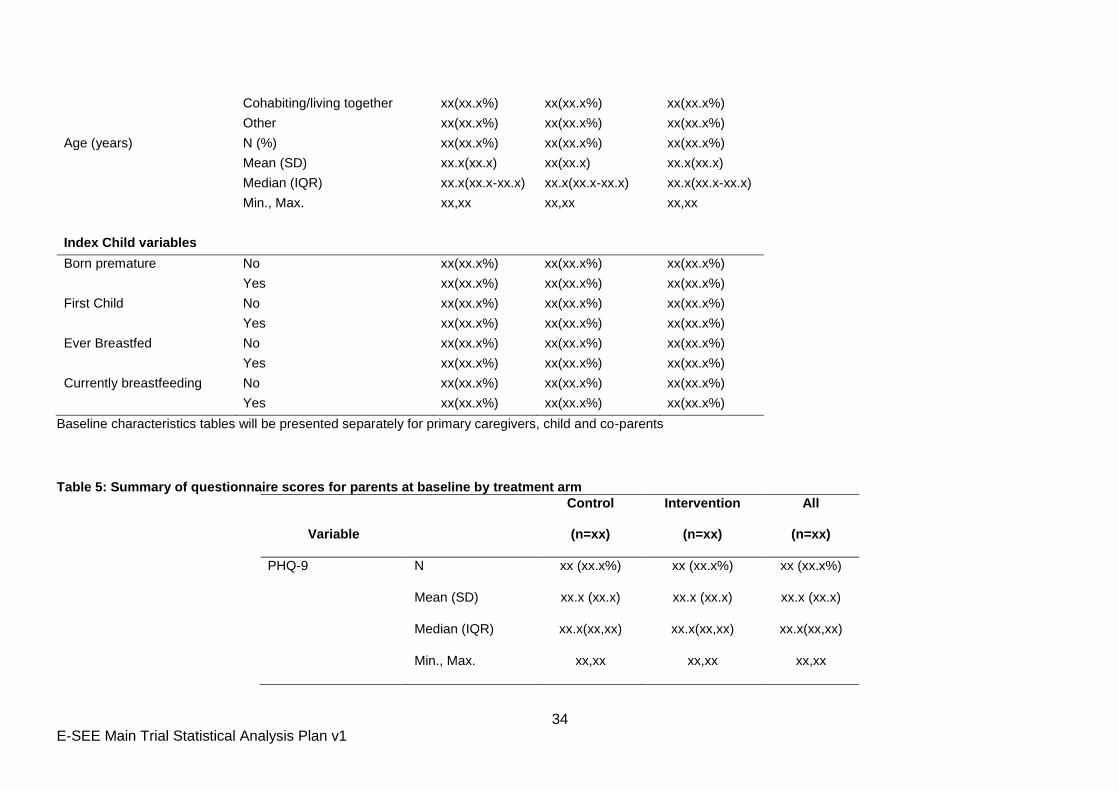
7.3 Baseline Characteristics
The baseline demographics and clinical characteristics of the participants will be reported. For
the continuous variables (e.g. age) mean and SD, median and IQR and minimum and
maximum values will be presented. The number of observations used in each calculation will
be presented alongside the summaries. For the categorical variables, (e.g. ethnicity), the
number and percentage of participants in each of the categories and the total number of
observations will be presented.
All baseline summaries will be presented and reported for each treatment group and in total.
No statistical significance testing will be done to test baseline imbalances between the
intervention arms but any noteworthy differences will be descriptively reported.
The following summaries will be presented:
Demographics
Child: Age (weeks), Sex, Ethnicity
Primary caregiver: Age, Sex, Ethnicity, Religion, Income, Marital Status, Highest qualification
previously achieved
Co-parent: Age, Sex, Ethnicity, Religion, Income, Marital Status, Highest qualification previously
achieved
Outcome measures
12 E-SEE Main Trial Statistical Analysis Plan v1
Child: ASQ:SE-2,
Primary caregiver: PHQ-9, PSoC, EQ5D-5L
Co-parent: PHQ-9, PSoC, EQ5D-5L
Parent-child dyad – CARE Index
Other measures
Child: Premature, Difficulties at birth, Received immunisation
Parent-child dyad – details of child feeding methods
Baseline summaries will be presented separately by child, primary caregiver and co-parent
(Appendix Table 4, Table 5).
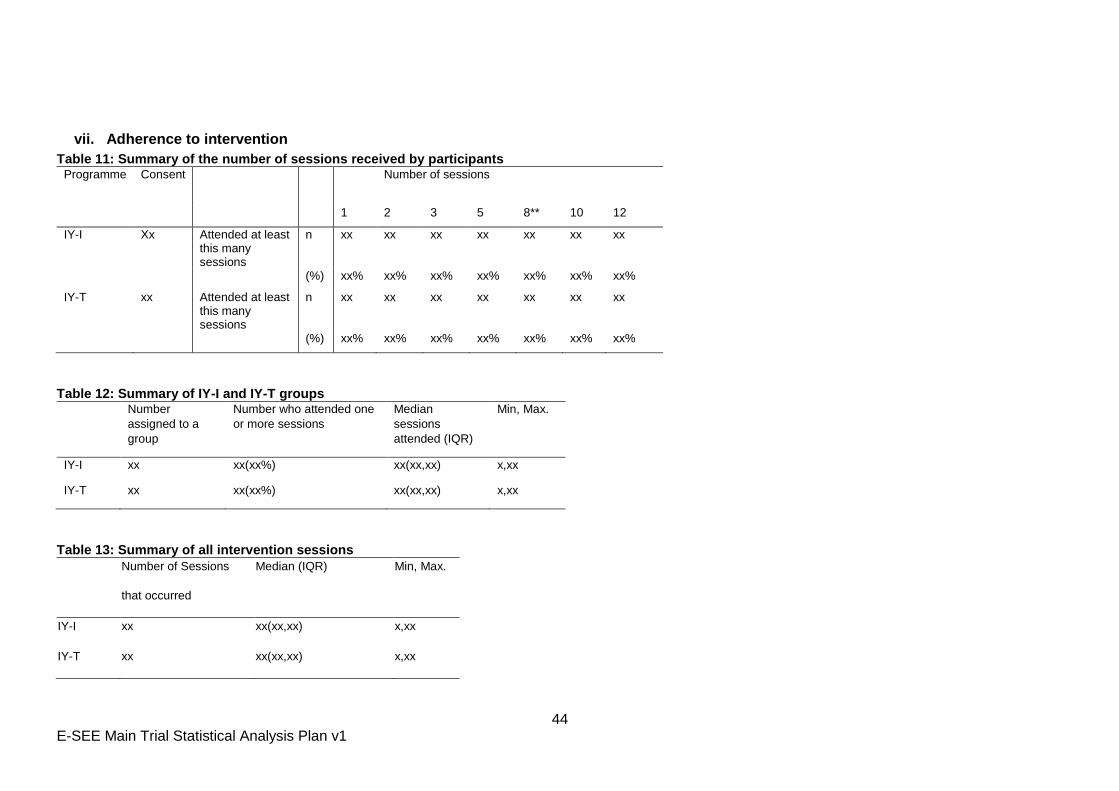
7.4 Intervention Adherence & Fidelity
The number and proportion of participants who received the book will be presented. For the
IY-I and IY-T stages, the following intervention attendance summaries (Appendix Table 11)
will be presented:
Number offered/eligible for IY-I or IY-T at each site
Number of groups at each site
Session size for each group by week
Session size (median, IQR, minimum, maximum)
Number of sessions attended per participant (median, IQR, minimum, maximum)
The proportion of participants attending at least 1/2/3/5/10/12 sessions (denominator to
be all those who attended at least 1 session)
Methods for the assessment of fidelity will be part of the Process Evaluation component of the
study which is described in further detail in the study protocol v10.
7.5 Analysis Populations
7.5.1 Intention to treat (ITT)
To avoid any potential bias in the analysis, the primary outcome analysis will be conducted on
the ITT population unless otherwise stated. Participants will be analysed according to the
treatment arm they were randomised to and analysis will include all participants with outcome
data.
13 E-SEE Main Trial Statistical Analysis Plan v1
7.5.2 Per protocol
The per-protocol analysis will be descriptive because there is no satisfactory way to define a
per-protocol population for those in receipt of IY-B only. If the per-protocol population definition
were based on IY-I and IY-T only we would only be removing people with higher scores at
follow up 2 and 3 which would reduce the effects size compared to the ITT analysis and bias
upwards the estimated impact on compliers because efficacy is demonstrated by a reduction
in primary outcome.
Instead we will undertake a descriptive analysis comparing the characteristics of compliers
compared to non-compliers. For example did compliers tend to be people with the greatest
need (scores just over the eligibility threshold) or those with the higher scores. The
characteristics investigated in this descriptive analysis will be the same as those used for the
subgroups. This descriptive analysis will be an important input to the process evaluation.
7.6 Analysis of the primary outcome
7.6.1 Primary Analysis of the primary outcome
The ASQ:SE-2 is a set of questionnaires with different versions for different age groups.
Consequently, different versions will be completed at each time point. The primary analysis
will use raw ASQ:SE-2 scores as the scoring is the same across treatment arms and
estimates will be easier to interpret. For ASQ:SE-2 either the 2 month or the 6 month
questionnaire is administered at Follow-up 1 dependent upon the developmental age of the
baby. If we observe an imbalance between arms in the number receiving the 2 months and 6
months versions we will adjust the score for those receiving the 2 months version by
multiplying by 1.24. We have based the adjustment on the monitoring thresholds (25 and 30
for the 2 and 6 months surveys) and referral thresholds (35 and 45 for the 2 and 6 months
surveys). The adjustment is midway between those required to preserve the monitoring
threshold (30/25) and the referral threshold (45/35). If participants have completed both
questionnaires, we will use the 6 months version and exclude them from the potential
adjustment procedure.
The overall treatment effect will be estimated using a marginal model fitted using general
estimating equations to account for the repeated measures with a Gaussian family, identity
link, robust standard errors and an autoregressive covariance structure of order 1 AR(1). If the
model does not converge using AR (1) we will use an unstructured correlation structure. The
fixed effects will be stratifying variables (baseline ASQ:SE-2 score, baseline PHQ-9 score,
14 E-SEE Main Trial Statistical Analysis Plan v1
site4 and sex of child); potential confounders ( ethnicity of the primary caregiver, marital status
and highest level of education and follow up time (using an indicator variable for each time
point).
The therapist induced clustering effect will not be fitted because the offer of IY-I and
IY-T is conditional on outcome at FU1 and FU2 so clustering is confounded with
treatment effect leading to biased estimation of the latter.
The repeated measurements will be accounted for using a marginal model fitted using
GEE because accounting for repeated measures using a mixed model inflates the type
1 error (random intercept only model) or gives a biased estimate of the treatment effect
(random intercept and slope model).
These analysis decisions above were based on previous research (Candlish 2019) and
simulation work undertaken during SAP development included in appendix B.
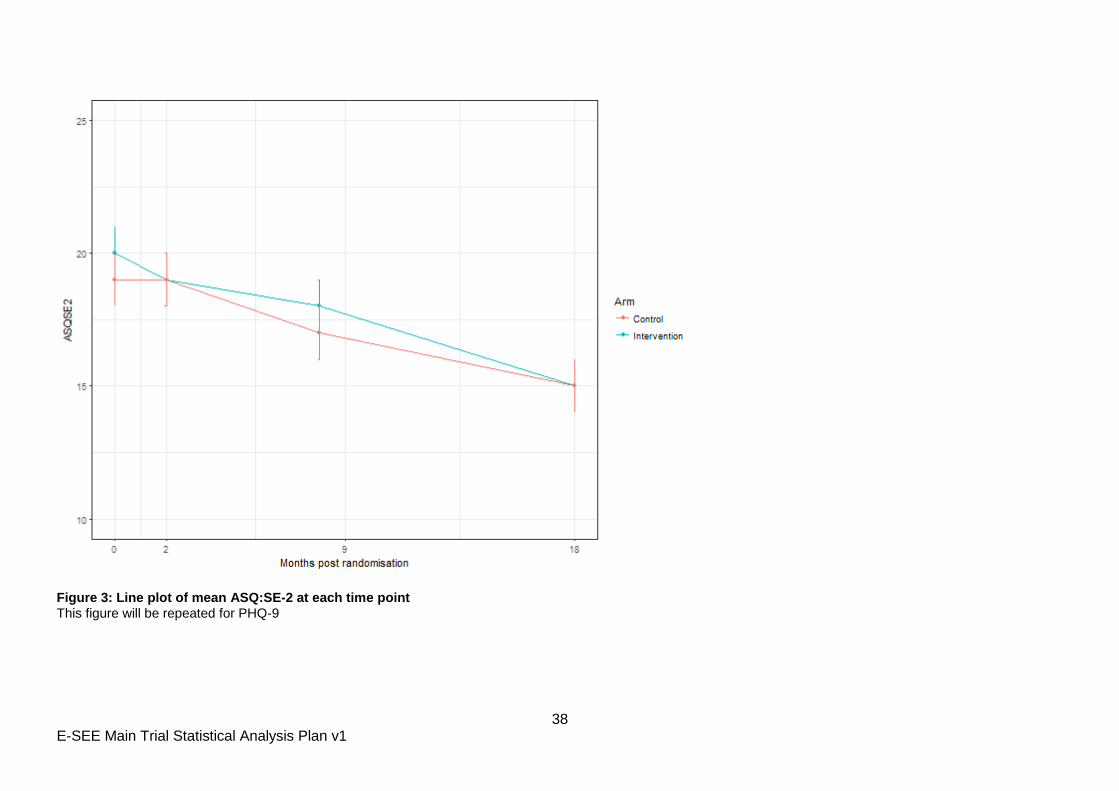
Descriptive statistics will be presented for ASQ:SE-2 and PHQ-9 at each time point (Appendix
Table 6). Mean ASQ:SE-2 and PHQ-9 scores and 95% CIs by treatment arm will be presented
in line plots. Spaghetti plots will also be used to visualise individual changes over time.
The following categories of the categorical variables will be used:
Ethnicity of the primary caregiver: English/Welsh/Scottish/Northern Irish/British/Irish;
Any other White background, Indian, Pakistani and Any Other ethnic group.
Marital status: Married and living together; Cohabiting/living together; Other type of
relationship and Not in a relationship or separated
Highest level of education: Higher Education and Other (see Section 10.1 for details of
how this will be defined).
7.6.2 Sensitivity Analysis of the primary outcome
Further sensitivity analyses will be carried out to assess the impact of not standardising the
raw scores by applying standardisation methods described in detail in section 9.1.1. A missing
data sensitivity analysis will also be conducted and is described in more detail in section 8.1.1.
A per protocol analysis was considered but deemed not to be appropriate as outlined in
section 7.5.2. Similarly, complier average causal effect (CACE) analysis was deemed not to
be appropriate.
4 Blackburn with Darwen, North Yorkshire, Portsmouth and Suffolk
15 E-SEE Main Trial Statistical Analysis Plan v1
7.7 Analysis of key secondary outcomes
The impact of the intervention on PHQ scores will be investigated using the same approach as
the primary analysis of the primary outcome. Descriptive statistics will be presented for PHQ-9
at each time point (Appendix Table 6). Mean PHQ-9 scores and 95% CIs by treatment arm will
be presented in line plots. Spaghetti plots will also be used to visualise individual changes
over time.
The IY intervention in this trial comprises three main components – the IY-I book, IY-I and IY-T
programmes. All participants who meet the eligibility requirement for being stepped up to IY-I
and/or IY-T are given the opportunity to do so and there is no randomisation element in the
step up. As such the following secondary analysis provides a non-randomised indicative
analysis of the possible impact of individual components. The impact of individual components
will be investigated using ASQ:SE-2 and PHQ-9 at the relevant follow up point with those
participants in the control arm who would have been eligible for IY-I or IY-T in each case used
as the control group comparator.
Comparison between intervention and control groups at FU1 will provide an indicative
analysis of IY-B;
Comparison between intervention and control for the subgroup of parents with PHQ-9
score >=5 OR Child ASQ:SE-2 score>= Monitoring Zone at FU2 will provide an
indicative analysis of IY-I;
Comparison between intervention and control in the subgroup of parents with PHQ-9
score >=5 OR Child ASQ:SE-2 score>= Monitoring Zone at FU3 will provide an indicative
analysis of IY-T.
These analyses will be conducted using multiple linear regression models including the same
stratification variables (baseline ASQ:SE-2 score, baseline PHQ-9 score, sex of child and
recruitment site) and potential confounders (ethnicity of the primary caregiver, marital status
and highest level of education) as covariates. The mean difference, 95% confidence interval
and associated p-values will be presented (Appendix Table 7).
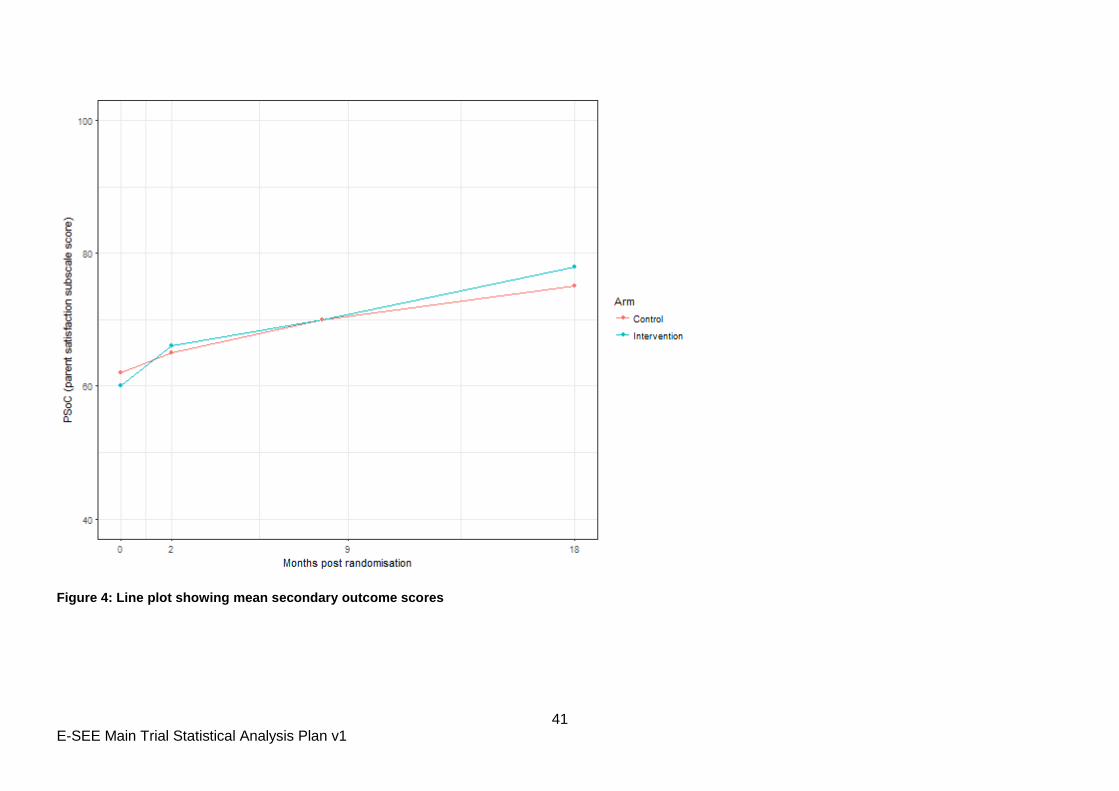
7.8 Analysis of other secondary outcomes
Not all secondary outcomes will be collected at all four time points. For those outcomes that
have been collected at all four time points (PSoC, EQ5D-5L, CARE Index), mean scores by
treatment arm will be presented in line plots (Figure 4) and the impact of the intervention on
these outcomes will be investigated using the same approach as the primary analysis of the
primary outcome.

16 E-SEE Main Trial Statistical Analysis Plan v1
For those outcomes only collected at FU3 (MPAS/PPAS, PEDSQL, SDQ), descriptive
statistics will be presented by treatment arm. A multiple linear regression model will be used to
estimate the adjusted mean difference between treatment arms. Stratification variables
(baseline PHQ-9 score, baseline ASQ:SE-2 score, sex of child and site) will be included in the
model as covariates.
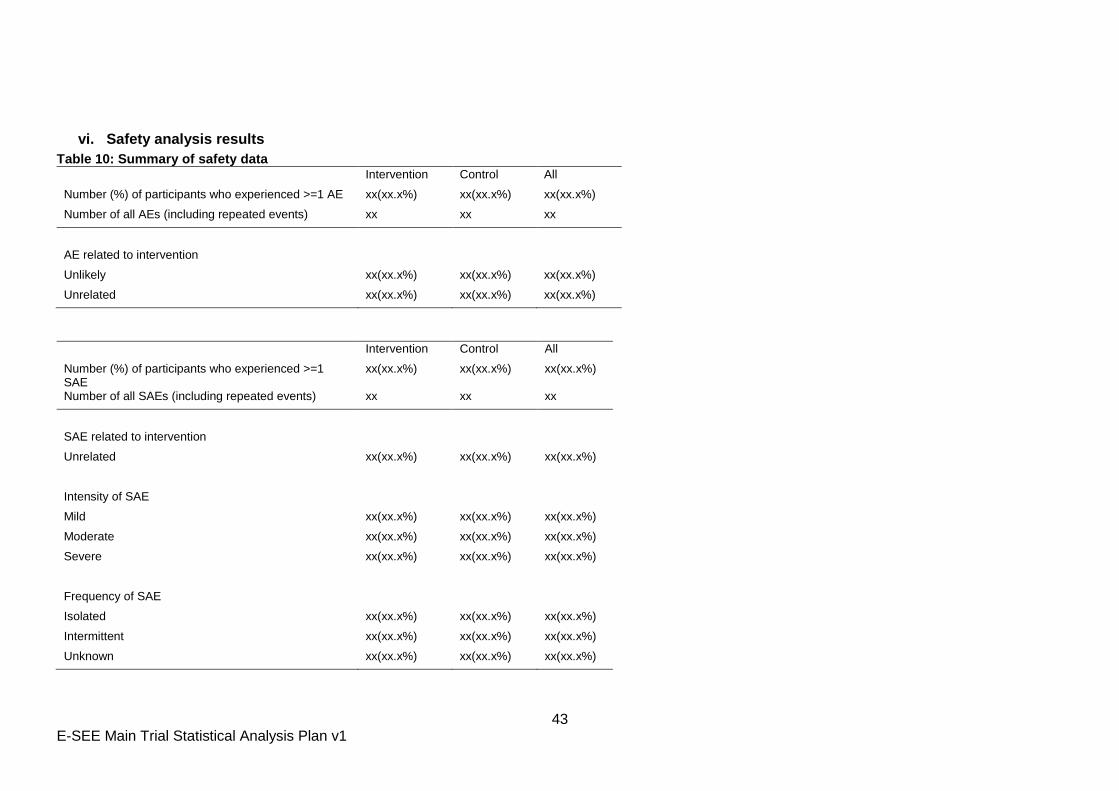
7.9 Safety
Safety will be assessed by recording adverse events (AEs) and serious adverse events
(SAEs). Details of definitions of AEs and SAEs are outlined in the study protocol.
Descriptive statistics of AEs and SAEs will be presented by treatment arm on the ITT
population. The following figures will be included overall; separately for child, primary carer
and co-parent and by type (Appendix Table 10):
The total number of AEs;
The number and percentage of participants reporting at least 1 AE;
The number and percentage of participants reporting a treatment related AE;
The total number of SAEs;
The number and percentage of participants reporting at least 1 SAE;
The number and percentage of participants reporting a treatment related SAE;
The number and percentage of participants reporting each severity and frequency of
SAE.
7.10 Changes from analysis specified in the Protocol
Section 10 of protocol version 10 says “Evaluating the overall effectiveness of the
proportionate delivery of IY will be assessed using a multilevel mixed model to allow for a
treatment and time effect whilst allowing for the clustering by participant and group treatments
and confounding and stratifying variables”. As discussed in section 7.6.1 we will no longer
account for treatment level clustering and will account for repeated measurements using a
marginal model fitted using GEE.
Section 10 of protocol version 10 says “ITT analysis will be conducted at the cluster level
using summary measures” as well as “the individual level with test statistics adjusted for intra-
cluster correlation”. Because participants can get IY-I alone, IY-T alone or both, there is no
way of grouping participants into clusters that remain stable throughout the intervention.
Sex of primary caregiver will no longer be used as a covariate due to the finding from the pilot
that there were too few male primary caregivers for the associated model parameter to be
estimated.
17 E-SEE Main Trial Statistical Analysis Plan v1
Section 10 of protocol version 10 says the ITT analysis will include “predictors of missing
values”. This has been operationalised in this SAP by undertaking sensitivity analysis of the
primary ITT using multiple imputation as described in section 8.1.1.
8 Detailed Statistical Methods and Calculations
8.1 Missing Spurious & Unused Data
8.1.1 Missing data
The primary outcome will be analysed using observed data with imputation for item non-
response (see Table 2 in Section 9.2) but no imputation for missing survey data, and we will
assess the amount and patterns of missing data and test the sensitivity of estimates of
treatment effects using the multiple imputation by chained equation (MICE) technique (Buuren
and Groothuis-Oudshoorn, 2011) implemented in STATA for those variables where a logistic
regression model shows them to be significant predictors of missing-ness. In addition to all
variables in the primary analysis including treatment group, which will all be included the MI,
we will consider the following variables:
Age of primary caregiver;
Eligibility for IY-I
Eligibility for IY-T
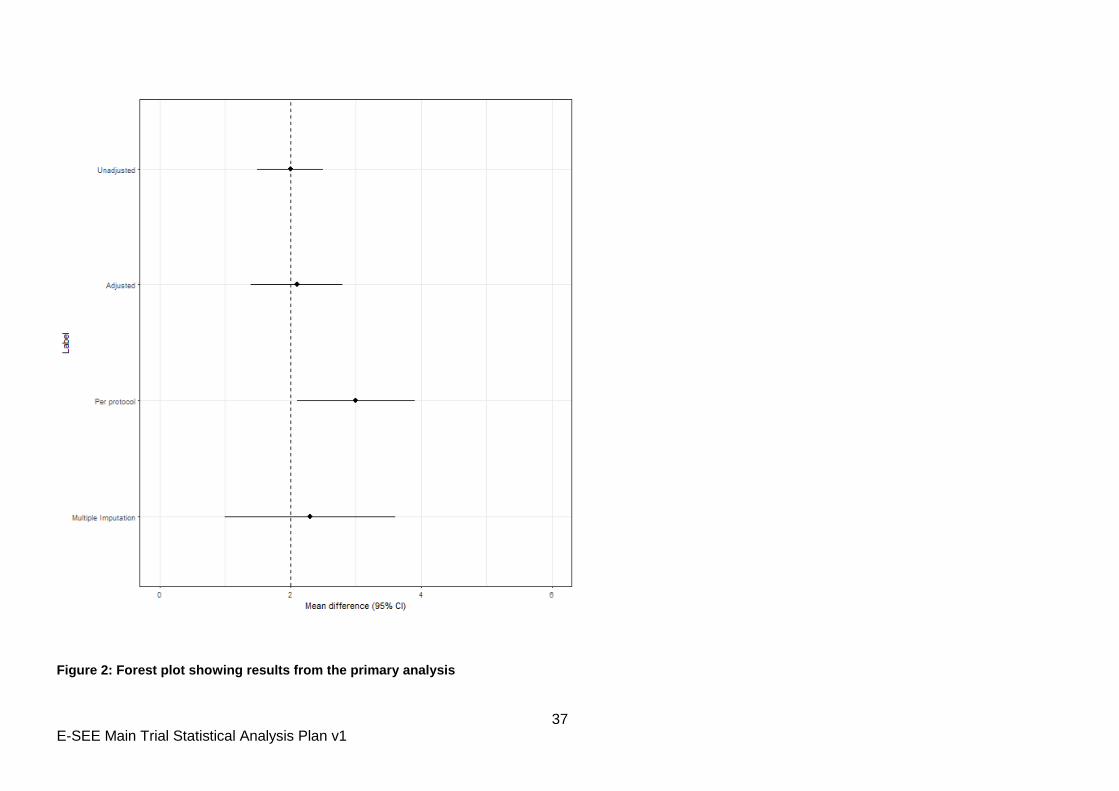
Treatment effects and their 95% CIs will be presented in a forest plot alongside those
produced using the primary analysis methods (section 7.6).
8.1.2 Missing items within questionnaires
The scoring of questionnaires with missing items is described in table 2 for the primary
outcome (ASQ:SE-2), key secondary outcome (PHQ-9) and SDQ. Justification for the
approach taken is also provided in the table.
For other secondary outcomes appropriate guidance does not exist so we will impute up to
25% missing values using the average score of completed items for surveys / time-points
where more than 5% of responses have item non-response. Where questions are subdivided
into groups this rule will be applied at the group level. Where there are no groupings of survey
questions this rule will be applied at the whole survey level.
9 Data manipulations and definitions
9.1 Primary outcome
9.1.1 Combining ASQ:SE-2 scores
The ASQ:SE-2 is a set of questionnaires with different versions for different age groups.
Consequently, different versions are completed at each time point and so scores may be
standardised as part of sensitivity analyses. Four version are used in the study:
ASQ:SE-2 2 month version – used at baseline and FU1 for some participants
ASQ:SE-2 6 month version – used at FU1
ASQ:SE-2 12 month version – used at FU2
18 E-SEE Main Trial Statistical Analysis Plan v1
ASQ:SE-2 18 month version – used at FU3
To standardise the scores, two methods will be applied.
9.1.1.1 Z scores
For each of the four versions, Z scores will be calculated as follows:
Z score= (raw score- mean)/ standard deviation
Control participants will be used to calculate the control population mean and standard
deviation.
9.1.1.2 Percentages
For each of the four versions, percentage scores will be calculated as follows:
Percentage = (raw score-minimum possible score) / maximum possible score
19 E-SEE Main Trial Statistical Analysis Plan v1
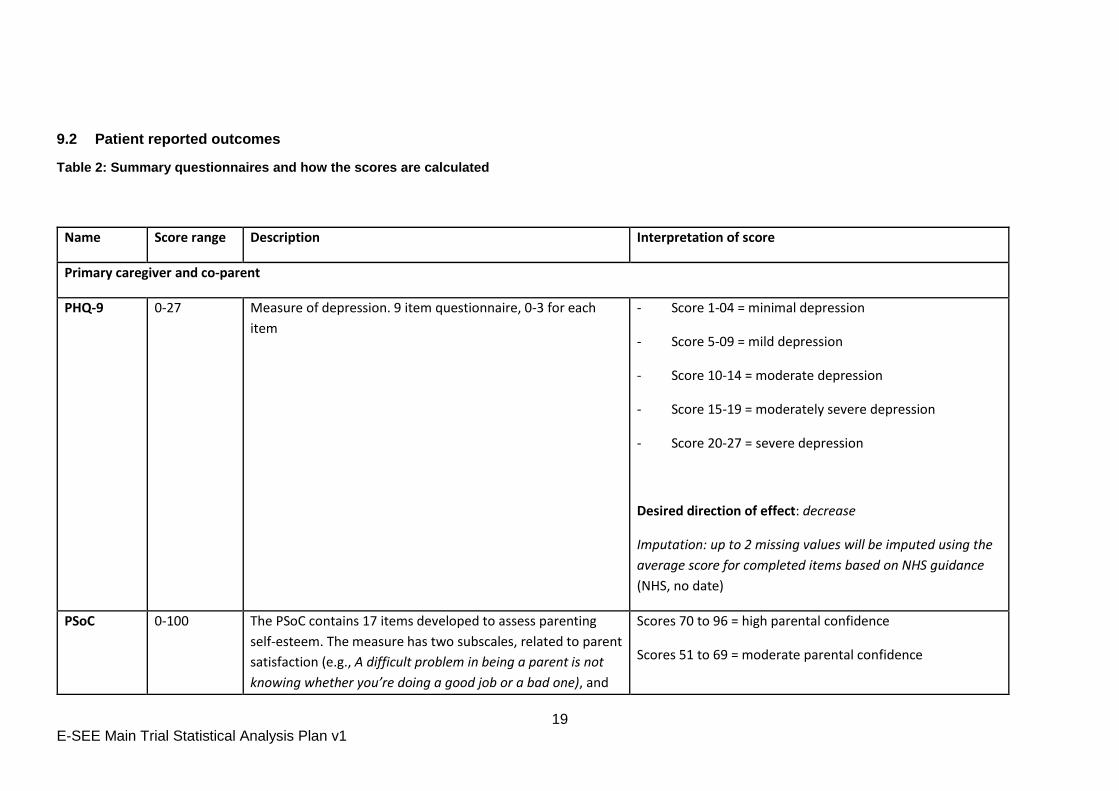
9.2 Patient reported outcomes
Table 2: Summary questionnaires and how the scores are calculated
Name Score range Description Interpretation of score
Primary caregiver and co-parent
PHQ-9 0-27 Measure of depression. 9 item questionnaire, 0-3 for each
item
- Score 1-04 = minimal depression
- Score 5-09 = mild depression
- Score 10-14 = moderate depression
- Score 15-19 = moderately severe depression
- Score 20-27 = severe depression
Desired direction of effect: decrease
Imputation: up to 2 missing values will be imputed using the
average score for completed items based on NHS guidance
(NHS, no date)
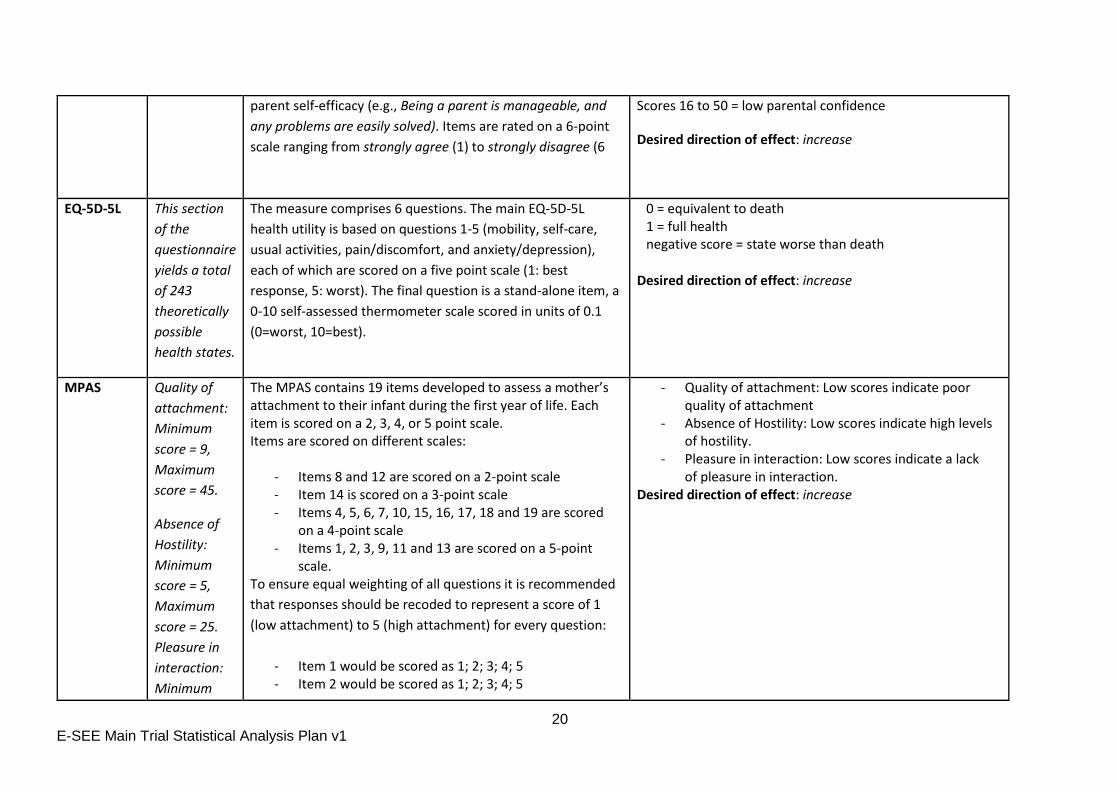
PSoC 0-100 The PSoC contains 17 items developed to assess parenting
self-esteem. The measure has two subscales, related to parent
satisfaction (e.g., A difficult problem in being a parent is not
knowing whether you’re doing a good job or a bad one), and
Scores 70 to 96 = high parental confidence
Scores 51 to 69 = moderate parental confidence
20 E-SEE Main Trial Statistical Analysis Plan v1
parent self-efficacy (e.g., Being a parent is manageable, and
any problems are easily solved). Items are rated on a 6-point
scale ranging from strongly agree (1) to strongly disagree (6
Scores 16 to 50 = low parental confidence
Desired direction of effect: increase
EQ-5D-5L This section
of the
questionnaire
yields a total
of 243
theoretically
possible
health states.
The measure comprises 6 questions. The main EQ-5D-5L
health utility is based on questions 1-5 (mobility, self-care,
usual activities, pain/discomfort, and anxiety/depression),
each of which are scored on a five point scale (1: best
response, 5: worst). The final question is a stand-alone item, a
0-10 self-assessed thermometer scale scored in units of 0.1
(0=worst, 10=best).
0 = equivalent to death 1 = full health negative score = state worse than death
Desired direction of effect: increase
MPAS Quality of
attachment:
Minimum
score = 9,
Maximum
score = 45.
Absence of
Hostility:
Minimum
score = 5,
Maximum
score = 25.
Pleasure in
interaction:
Minimum
The MPAS contains 19 items developed to assess a mother’s attachment to their infant during the first year of life. Each item is scored on a 2, 3, 4, or 5 point scale. Items are scored on different scales:
- Items 8 and 12 are scored on a 2-point scale - Item 14 is scored on a 3-point scale - Items 4, 5, 6, 7, 10, 15, 16, 17, 18 and 19 are scored
on a 4-point scale - Items 1, 2, 3, 9, 11 and 13 are scored on a 5-point
scale. To ensure equal weighting of all questions it is recommended
that responses should be recoded to represent a score of 1
(low attachment) to 5 (high attachment) for every question:
- Item 1 would be scored as 1; 2; 3; 4; 5 - Item 2 would be scored as 1; 2; 3; 4; 5
- Quality of attachment: Low scores indicate poor quality of attachment
- Absence of Hostility: Low scores indicate high levels of hostility.
- Pleasure in interaction: Low scores indicate a lack of pleasure in interaction.
Desired direction of effect: increase
21 E-SEE Main Trial Statistical Analysis Plan v1
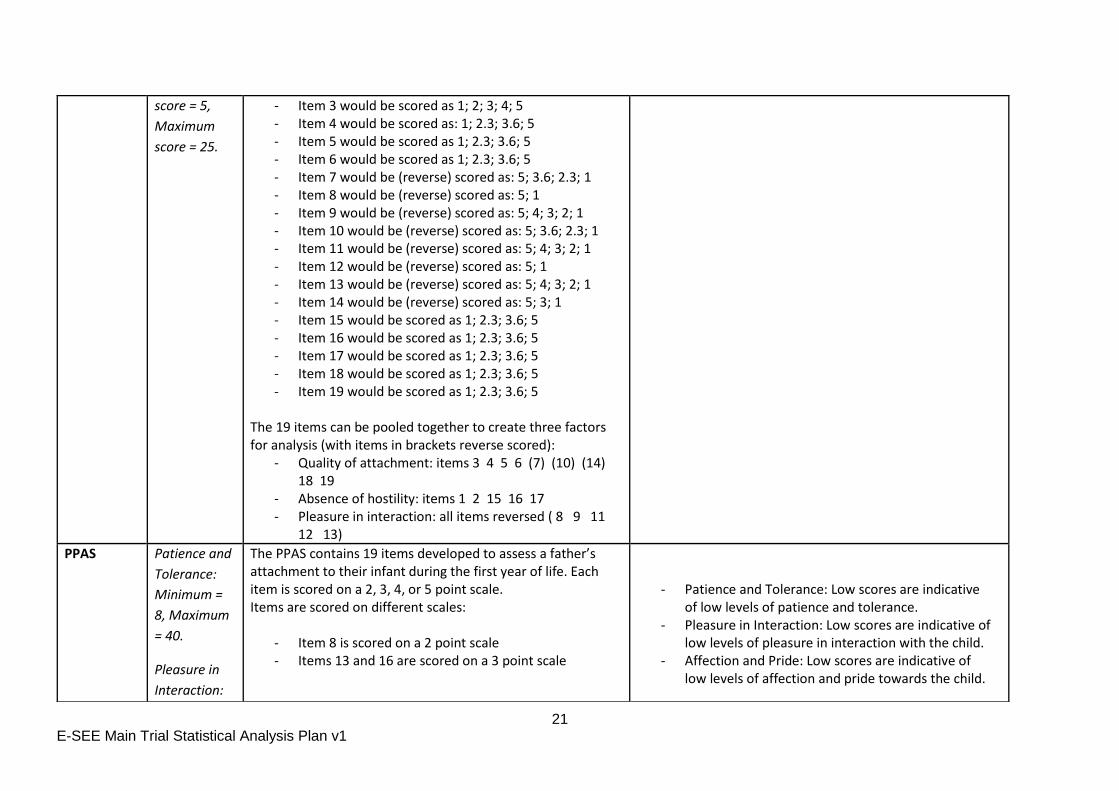
score = 5,
Maximum
score = 25.
- Item 3 would be scored as 1; 2; 3; 4; 5 - Item 4 would be scored as: 1; 2.3; 3.6; 5 - Item 5 would be scored as 1; 2.3; 3.6; 5 - Item 6 would be scored as 1; 2.3; 3.6; 5 - Item 7 would be (reverse) scored as: 5; 3.6; 2.3; 1 - Item 8 would be (reverse) scored as: 5; 1 - Item 9 would be (reverse) scored as: 5; 4; 3; 2; 1 - Item 10 would be (reverse) scored as: 5; 3.6; 2.3; 1 - Item 11 would be (reverse) scored as: 5; 4; 3; 2; 1 - Item 12 would be (reverse) scored as: 5; 1 - Item 13 would be (reverse) scored as: 5; 4; 3; 2; 1 - Item 14 would be (reverse) scored as: 5; 3; 1 - Item 15 would be scored as 1; 2.3; 3.6; 5 - Item 16 would be scored as 1; 2.3; 3.6; 5 - Item 17 would be scored as 1; 2.3; 3.6; 5 - Item 18 would be scored as 1; 2.3; 3.6; 5 - Item 19 would be scored as 1; 2.3; 3.6; 5
The 19 items can be pooled together to create three factors for analysis (with items in brackets reverse scored):
- Quality of attachment: items 3 4 5 6 (7) (10) (14) 18 19
- Absence of hostility: items 1 2 15 16 17 - Pleasure in interaction: all items reversed ( 8 9 11
12 13)
PPAS Patience and
Tolerance:
Minimum =
8, Maximum
= 40.
Pleasure in
Interaction:
The PPAS contains 19 items developed to assess a father’s attachment to their infant during the first year of life. Each item is scored on a 2, 3, 4, or 5 point scale. Items are scored on different scales:
- Item 8 is scored on a 2 point scale - Items 13 and 16 are scored on a 3 point scale
- Patience and Tolerance: Low scores are indicative of low levels of patience and tolerance.
- Pleasure in Interaction: Low scores are indicative of low levels of pleasure in interaction with the child.
- Affection and Pride: Low scores are indicative of low levels of affection and pride towards the child.
22 E-SEE Main Trial Statistical Analysis Plan v1
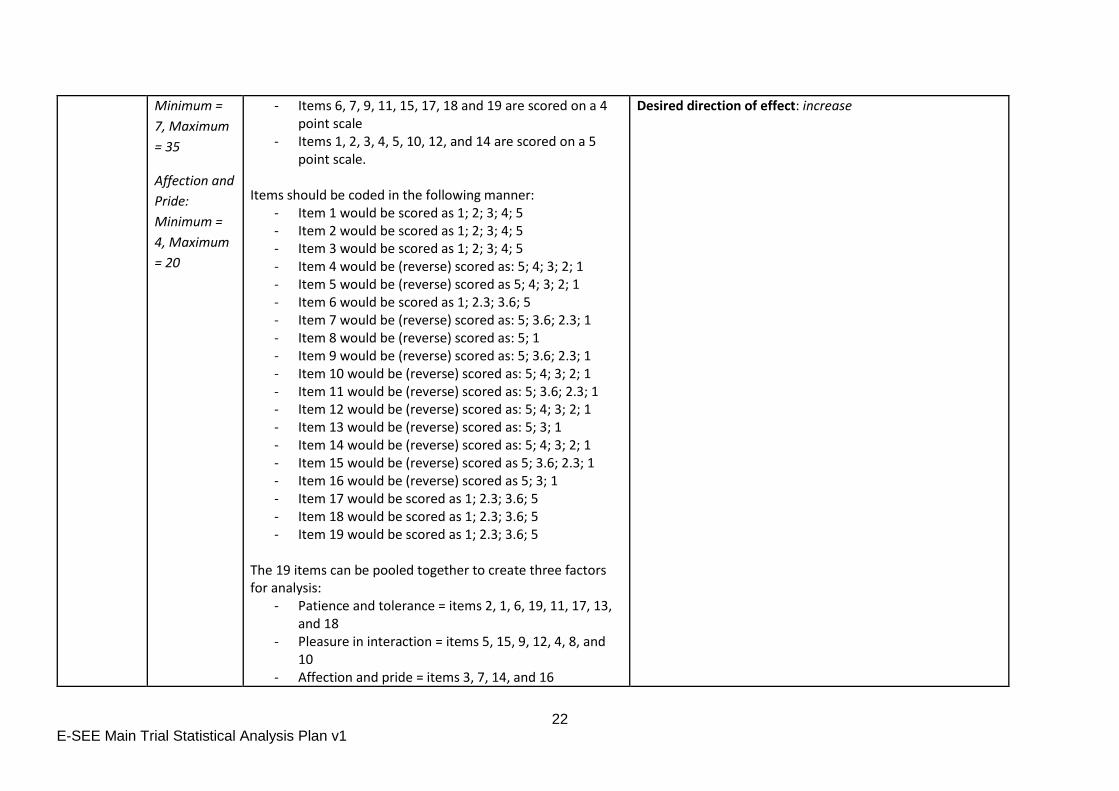
Minimum =
7, Maximum
= 35
Affection and
Pride:
Minimum =
4, Maximum
= 20
- Items 6, 7, 9, 11, 15, 17, 18 and 19 are scored on a 4 point scale
- Items 1, 2, 3, 4, 5, 10, 12, and 14 are scored on a 5 point scale.
Items should be coded in the following manner:
- Item 1 would be scored as 1; 2; 3; 4; 5 - Item 2 would be scored as 1; 2; 3; 4; 5 - Item 3 would be scored as 1; 2; 3; 4; 5 - Item 4 would be (reverse) scored as: 5; 4; 3; 2; 1 - Item 5 would be (reverse) scored as 5; 4; 3; 2; 1 - Item 6 would be scored as 1; 2.3; 3.6; 5 - Item 7 would be (reverse) scored as: 5; 3.6; 2.3; 1 - Item 8 would be (reverse) scored as: 5; 1 - Item 9 would be (reverse) scored as: 5; 3.6; 2.3; 1 - Item 10 would be (reverse) scored as: 5; 4; 3; 2; 1 - Item 11 would be (reverse) scored as: 5; 3.6; 2.3; 1 - Item 12 would be (reverse) scored as: 5; 4; 3; 2; 1 - Item 13 would be (reverse) scored as: 5; 3; 1 - Item 14 would be (reverse) scored as: 5; 4; 3; 2; 1 - Item 15 would be (reverse) scored as 5; 3.6; 2.3; 1 - Item 16 would be (reverse) scored as 5; 3; 1 - Item 17 would be scored as 1; 2.3; 3.6; 5 - Item 18 would be scored as 1; 2.3; 3.6; 5 - Item 19 would be scored as 1; 2.3; 3.6; 5
The 19 items can be pooled together to create three factors for analysis:
- Patience and tolerance = items 2, 1, 6, 19, 11, 17, 13, and 18
- Pleasure in interaction = items 5, 15, 9, 12, 4, 8, and 10
- Affection and pride = items 3, 7, 14, and 16
Desired direction of effect: increase
23 E-SEE Main Trial Statistical Analysis Plan v1
24 E-SEE Main Trial Statistical Analysis Plan v1
Child
ASQ-SE-2 2
month
ASQ-SE-2 6
month
ASQ-SE-2 9
month
ASQ-SE-2 18
month
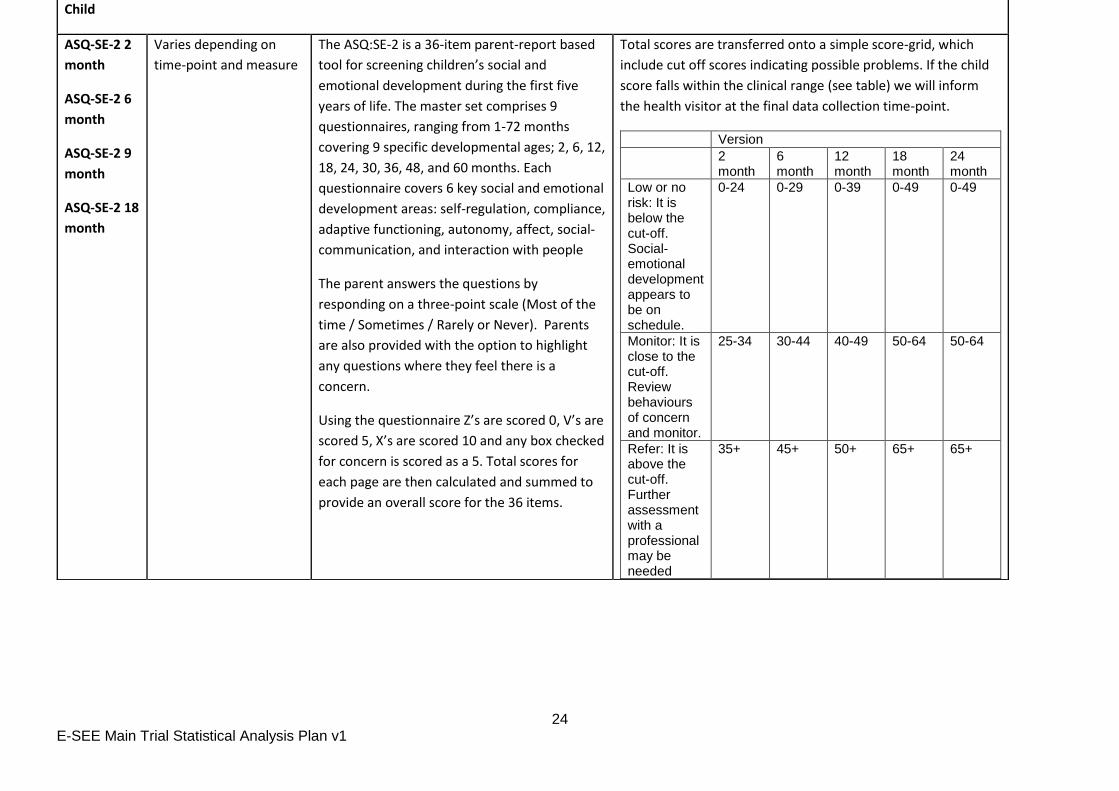
Varies depending on
time-point and measure
The ASQ:SE-2 is a 36-item parent-report based
tool for screening children’s social and
emotional development during the first five
years of life. The master set comprises 9
questionnaires, ranging from 1-72 months
covering 9 specific developmental ages; 2, 6, 12,
18, 24, 30, 36, 48, and 60 months. Each
questionnaire covers 6 key social and emotional
development areas: self-regulation, compliance,
adaptive functioning, autonomy, affect, social-
communication, and interaction with people
The parent answers the questions by
responding on a three-point scale (Most of the
time / Sometimes / Rarely or Never). Parents
are also provided with the option to highlight
any questions where they feel there is a
concern.
Using the questionnaire Z’s are scored 0, V’s are
scored 5, X’s are scored 10 and any box checked
for concern is scored as a 5. Total scores for
each page are then calculated and summed to
provide an overall score for the 36 items.
Total scores are transferred onto a simple score-grid, which
include cut off scores indicating possible problems. If the child
score falls within the clinical range (see table) we will inform
the health visitor at the final data collection time-point.
Version
2 month
6 month
12 month
18 month
24 month
Low or no risk: It is below the cut-off. Social-emotional development appears to be on schedule.
0-24 0-29 0-39 0-49 0-49
Monitor: It is close to the cut-off. Review behaviours of concern and monitor.
25-34 30-44 40-49 50-64 50-64
Refer: It is above the cut-off. Further assessment with a professional may be needed
35+ 45+ 50+ 65+ 65+
25 E-SEE Main Trial Statistical Analysis Plan v1
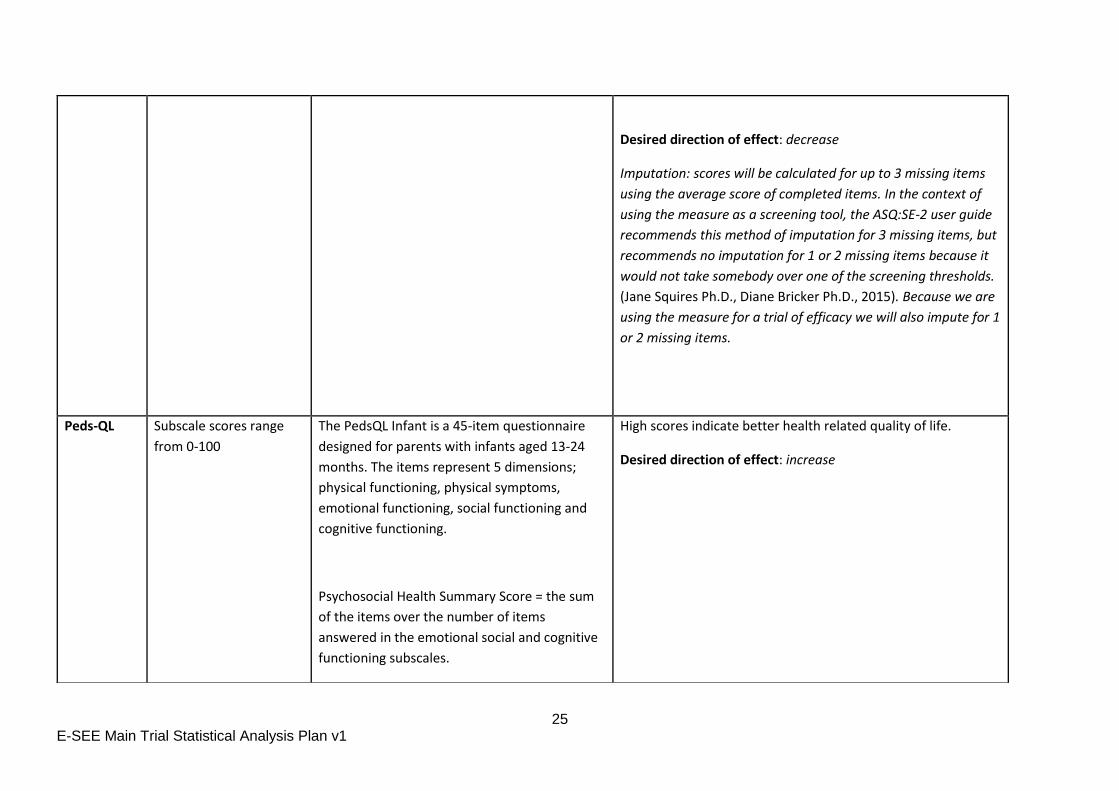
Desired direction of effect: decrease
Imputation: scores will be calculated for up to 3 missing items
using the average score of completed items. In the context of
using the measure as a screening tool, the ASQ:SE-2 user guide
recommends this method of imputation for 3 missing items, but
recommends no imputation for 1 or 2 missing items because it
would not take somebody over one of the screening thresholds.
(Jane Squires Ph.D., Diane Bricker Ph.D., 2015). Because we are
using the measure for a trial of efficacy we will also impute for 1
or 2 missing items.
Peds-QL Subscale scores range
from 0-100
The PedsQL Infant is a 45-item questionnaire
designed for parents with infants aged 13-24
months. The items represent 5 dimensions;
physical functioning, physical symptoms,
emotional functioning, social functioning and
cognitive functioning.
Psychosocial Health Summary Score = the sum
of the items over the number of items
answered in the emotional social and cognitive
functioning subscales.
High scores indicate better health related quality of life.
Desired direction of effect: increase
26 E-SEE Main Trial Statistical Analysis Plan v1
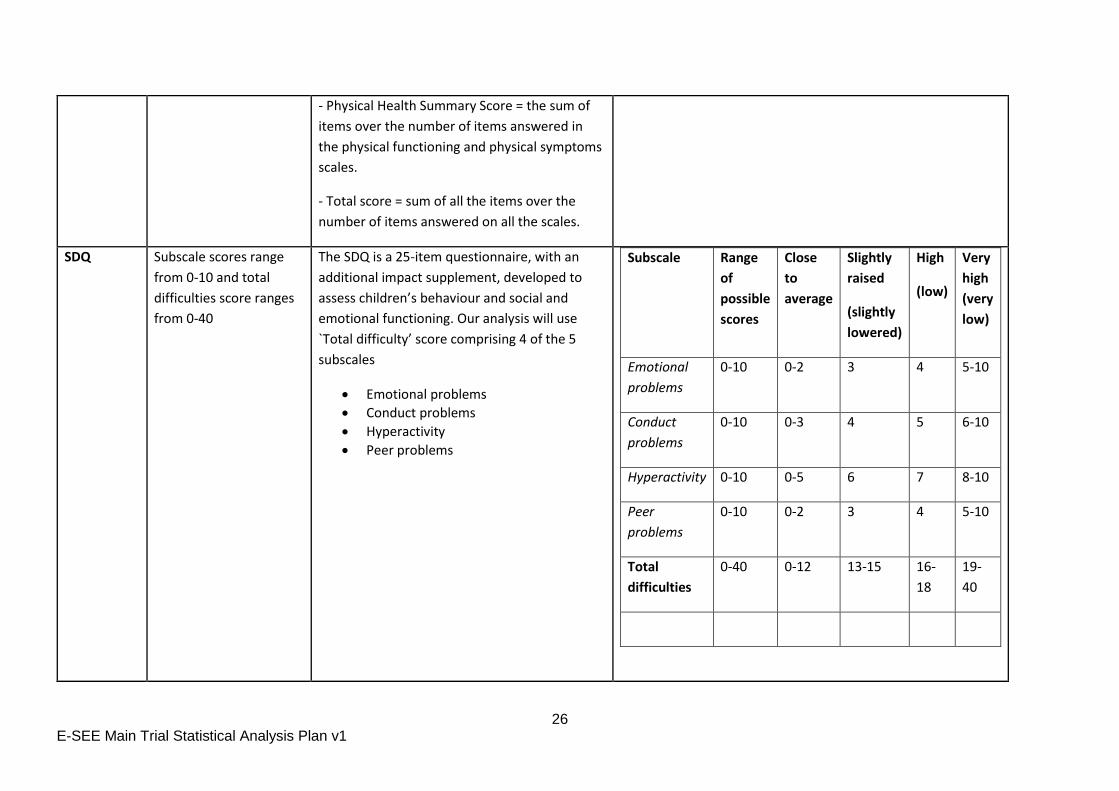
- Physical Health Summary Score = the sum of
items over the number of items answered in
the physical functioning and physical symptoms
scales.
- Total score = sum of all the items over the
number of items answered on all the scales.
SDQ Subscale scores range
from 0-10 and total
difficulties score ranges
from 0-40
The SDQ is a 25-item questionnaire, with an
additional impact supplement, developed to
assess children’s behaviour and social and
emotional functioning. Our analysis will use
`Total difficulty’ score comprising 4 of the 5
subscales
Emotional problems
Conduct problems
Hyperactivity
Peer problems
Subscale Range
of
possible
scores
Close
to
average
Slightly
raised
(slightly
lowered)
High
(low)
Very
high
(very
low)
Emotional
problems
0-10 0-2 3 4 5-10
Conduct
problems
0-10 0-3 4 5 6-10
Hyperactivity 0-10 0-5 6 7 8-10
Peer
problems
0-10 0-2 3 4 5-10
Total
difficulties
0-40 0-12 13-15 16-
18
19-
40
27 E-SEE Main Trial Statistical Analysis Plan v1
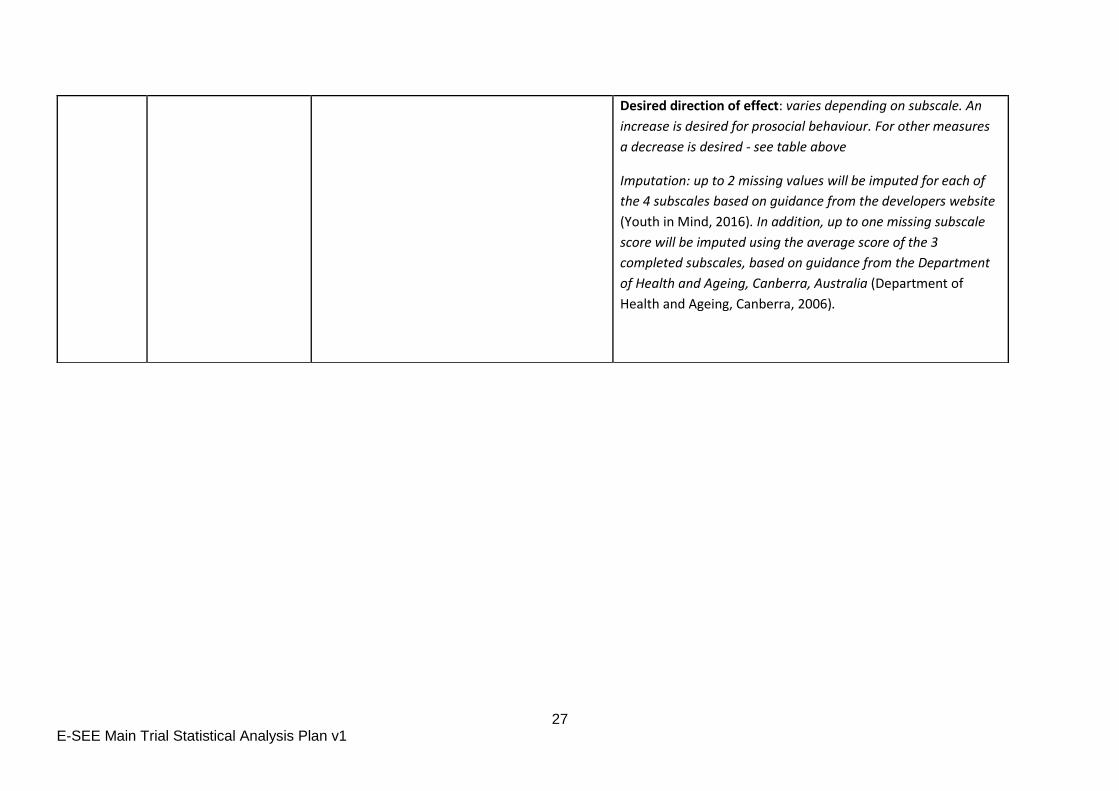
Desired direction of effect: varies depending on subscale. An
increase is desired for prosocial behaviour. For other measures
a decrease is desired - see table above
Imputation: up to 2 missing values will be imputed for each of
the 4 subscales based on guidance from the developers website
(Youth in Mind, 2016). In addition, up to one missing subscale
score will be imputed using the average score of the 3
completed subscales, based on guidance from the Department
of Health and Ageing, Canberra, Australia (Department of
Health and Ageing, Canberra, 2006).
28 E-SEE Main Trial Statistical Analysis Plan v1
9.3 CARE Index
The CARE-Index is an independent observational assessment of parent-child interaction. The
CARE-index assesses interaction over the first four years (infant index = birth to 15 months
and toddler index = 16 to 48 months) based on a short, videotaped play interaction of 3-5
minutes. Once the coder is trained, coding of an interaction takes about 15-20 minutes. The
coding initially focuses on item-by-item scoring of seven aspects of adult and child behaviour,
four affective aspects (facial expression, vocal expression, position and body contact,
expression of affection) and three cognition aspects (the response of one party to the
behavioural signals of the other, turn-taking and control of the activity, developmental
appropriateness of the activity). Each aspect of behaviour is scored separately for the adult
and the child and the scores combined to generate seven scale scores (Farnfield and Holmes,
2016) . The coder then takes a holistic view of the observations and item by item scores and
assigns an overall dyadic synchrony score (0-14). The scoring manual explains that “neither
approach is more accurate than the other” and that dyadic synchrony score “prevent[s]
misalignment of ordinary dyads to the high and low extremes of the scale” but [on its own]
“there is too little detail to permit disagreements between coders to be resolved (Crittenden,
2010). As such, the item-by-item coding and “dyadic synchrony” score will be recorded but
analysis will be based on the overall dyadic synchrony scale alone (range: 0-14) as a
continuous variable.
10 Additional Analyses
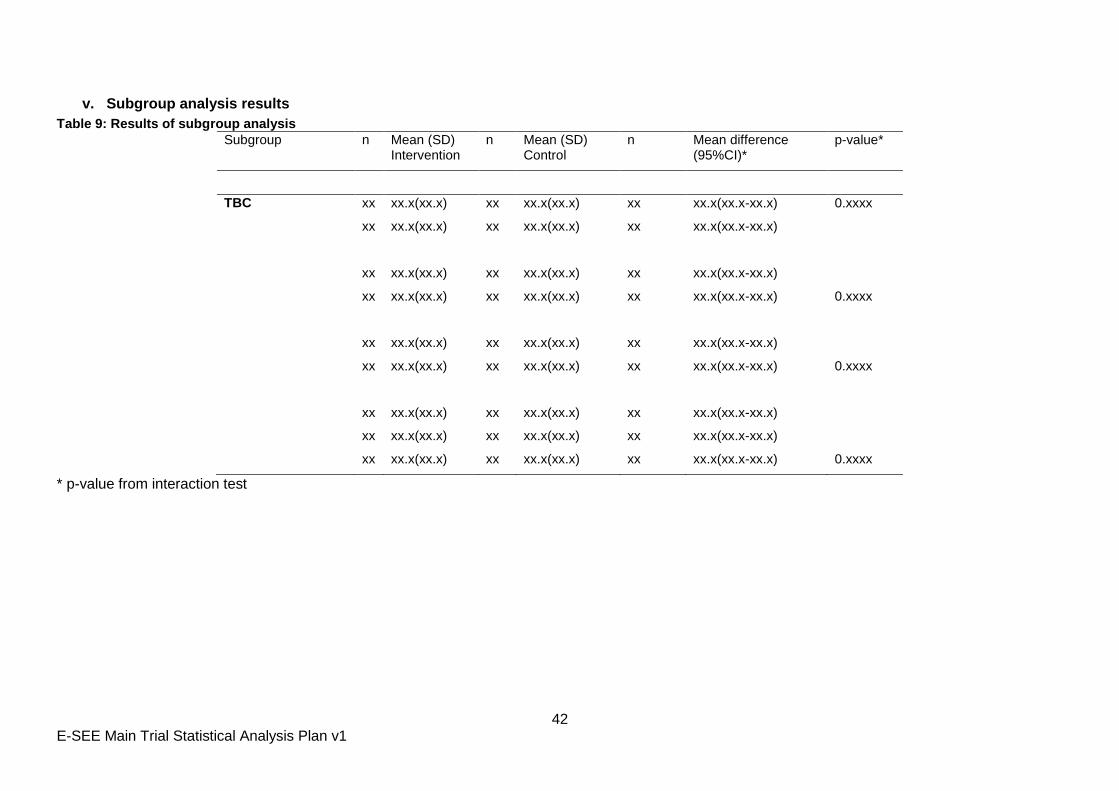
10.1 Subgroup analyses
As suggested by the literature, the subgroup analysis will be restricted to the primary analysis
and subgroups will be defined by baseline data i.e. data that is not dependent on the
intervention. The subgroup analysis will be performed using the primary analysis of the
primary outcome model (ASQ:SE-2). An interaction statistical test between the randomised
treatment group and subgroup will be used to directly examine the strength of evidence for the
difference between treatment arms varying between subgroups. Subgroup analysis will be
performed regardless of the results of the primary analysis. The mean difference and 95% CI
will be computed for each subgroup category and visually displayed using a forest plot. The
regression coefficient for the interaction between treatment group and subgroup will be
presented with the associated confidence interval and P-value. We will not calculate separate
p-values within each subgroup category (Wang et al. 2007). Results will be presented as
shown in Appendix Table 9. The subgroups of interest are described below.
Social and economic background using a binary variable for whether or not the
primary caregiver was educated to degree level as a proxy. In a previous US study
29 E-SEE Main Trial Statistical Analysis Plan v1
(Lavigne et al., 2008) mothers educated to high school level or below (typically left
education aged 17 or 18) responded better to parent training than better educated
mothers. Participants with overseas and vocational qualifications will be allocated to
the higher education group if they left full time education aged 19 or above.
First child (Yes or No). A Netherlands study found that intervention mothers of first-
born children displayed an increase in their use of positive discipline strategies as
compared to first-time mothers in the control group. (Stolk et al., 2008)
Sex of index child (Male or Female) child gender has been found to differentiate
response in previous trials of parenting interventions (Lavigne et al., 2008); (Gardner et
al., 2010).
Site
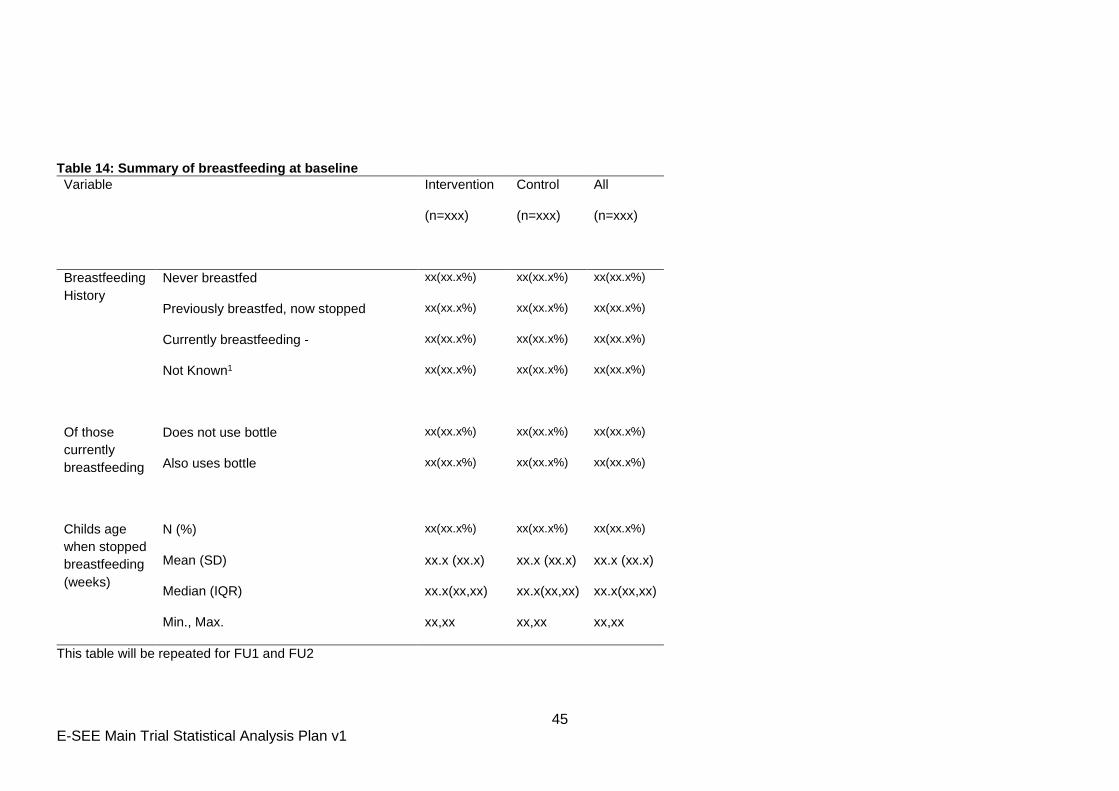
10.2 Breastfeeding
At FU0, FU1 and FU2, participants are asked several questions on feeding their child. For the
categorical variables, (e.g. Ever breastfed), the number and percentage of participants in each
of the categories and the total number of observations will be presented. For the continuous
variables (e.g. child’s age when stopped breastfeeding) either mean and SD will be presented
or median and IQR depending on the distribution of the data. The number of observations
used in each calculation will be presented alongside the summaries.
11 Implementation of the Analysis Plan
This SAP will be used as a work description for the statistician involved in the trial. All analyses
should ideally be performed by the same statistician (under the supervision of senior trial
statistician) and consequently none of the investigators involved in the trial will perform any of
the statistical analyses.
Initially, the data manager will provide blinded data for preliminary checks by the statistician.
Following database freeze, unblinded data will be delivered to the statistician to define analysis
sets and test statistical programs. Any queries will be communicated to the data manager prior
to database lock, and any changes to the database during this time will be documented. The
database will be locked after agreement between the statistician, data manager and study
manager. It is expected that no data amendments should be required following database lock.
However, if an amendment is required, the process is documented in CTRU SOP DM012.
12 References
Buuren, S. van and Groothuis-Oudshoorn, K. (2011) ‘mice:Multivariate Imputation by Chained Equations in R’, Journal of Statistical Software, 45(3), pp. 1–67. doi: 10.18637/jss.v045.i03. Crittenden, P. M. (2010) CARE-Index. Infants. Coding Manual. Miami, FL, USA. Department of Health and Ageing, Canberra, A. (2006) ‘Mental Health Information Development National Outcomes and Casemix Collection’, (April). Farnfield, S. and Holmes, P. (2016) ‘The Routledge Handbook of Attachment :
30 E-SEE Main Trial Statistical Analysis Plan v1
Assessment Mothers and infants Screening for maternal relationships at risk with the CARE-Index’, (11237). doi: 10.4324/9781315770666.ch3. Gamble, C. et al. (2017) ‘Guidelines for the content of statistical analysis plans in clinical trials’, JAMA - Journal of the American Medical Association, 318(23), pp. 2337–2343. doi: 10.1001/jama.2017.18556. Gardner, F. et al. (2010) ‘Who benefits and how does it work? Moderators and mediators of outcome in an effectiveness trial of a parenting intervention’, Journal of Clinical Child and Adolescent Psychology, 39(4), pp. 568–580. doi: 10.1080/15374416.2010.486315. ICH E9 Expert Working Group (1999) ‘ICH Harmonised Tripartite Guideline. Statistical principles for clinical trials. International Conference on Harmonisation E9 Expert Working Group.’, Statistics in medicine, 18(15), pp. 1905–42. doi: 10.1002/(SICI)1097-0258(19990815)18:15<1903::AID-SIM188>3.0.CO;2-F. ICH Harmonised Tripartite Guideline (1996) ‘Guideline for good clinical practice E6(R1)’, ICH Harmonised Tripartite Guideline, 1996(4), p. i-53. doi: 10.1056/NEJMp1012246. Jane Squires Ph.D., Diane Bricker Ph.D., E. T. M. S. (2015) ASQ:SE-2 user guide. Available at: https://products.brookespublishing.com/ASQSE-2-Users-Guide-P851.aspx. Juszczak, E. et al. (2019) ‘Reporting of Multi-Arm Parallel-Group Randomized Trials: Extension of the CONSORT 2010 Statement’, JAMA - Journal of the American Medical Association, 321(16), pp. 1610–1620. doi: 10.1001/jama.2019.3087. Lavigne, J. V. et al. (2008) ‘Predictor and moderator effects in the treatment of oppositional defiant disorder in pediatric primary care’, Journal of Pediatric Psychology, 33(5), pp. 462–472. doi: 10.1093/jpepsy/jsm075. NHS (no date) NHS Business Definitions: Patient Health Questionnaire-9 (PHQ-9), NHS Business Definitions. Available at: https://www.datadictionary.nhs.uk/data_dictionary/nhs_business_definitions/p/patient_health_questionnaire-9_de.asp?shownav=1 (Accessed: 30 January 2020). Schulz, K. F., Altman, D. G. and Moher, D. (2010) ‘CONSORT 2010 Statement: Updated guidelines for reporting parallel group randomised trials’, Journal of Clinical Epidemiology, 63(8), pp. 834–840. doi: 10.1016/j.jclinepi.2010.02.005. Stolk, M. N. et al. (2008) ‘Early parenting intervention: Family risk and first-time parenting related to intervention effectiveness’, Journal of Child and Family Studies, 17(1), pp. 55–83. doi: 10.1007/s10826-007-9136-3. Team, R. C. (2012) ‘R: A language and environment for statistical computing’. R Foundation for Statistical Computing, Vienna, Austria. ISBN. UK Statutory Instruments (2004) ‘The Medicines for Human Use (Clinical Trials) Regulations 2004’, Statutory Instruments, (1031), pp. 1–86. Youth in Mind (2016) Scoring the SDQ. Available at: http://www.sdqinfo.org/py/sdqinfo/c0.py (Accessed: 21 January 2020).
Trial Documents
Title Version Date Location
Study Protocol 10 11/06/2019 X:\ScHARR\PR_ESEE\General\PROJECT DOCUMENTATION\Protocol Development\Final Protocol versions\Version 10
Data Management Plan
2 15/08/2016 X:\ScHARR\PR_ESEE\General\Data Management\Study Documentation\Data management plan
External pilot Statistical Analysis Plan
1 05/11/2018 X:\ScHARR\PR_ESEE\General\Statistics\Revised Pilot Report\Documents\SAP
31 E-SEE Main Trial Statistical Analysis Plan v1
CTRU Standard Operating Procedures
Title Version Date Location
ST001 The Statistical Analysis Plan
5 9 Jan 2018 X:\ScHARR\WG_CTRU_SOPs
ST003 Data Evaluation 5
ST006 Undertaking a Statistical Analysis
2 11 May 2017
ST007 Randomisation
DM005 Central Data Validation
5 21 Jun 2018
DM012 Study database lock and retention
4 28 Mar 2017
32 E-SEE Main Trial Statistical Analysis Plan v1
13 Appendix
A. Appendix A Dummy Tables
i. Participant flow
Figure 1: CONSORT flow diagram showing the participant flow through the study
33 E-SEE Main Trial Statistical Analysis Plan v1
Table 3: Summary of study discontinuation during the 18 month follow up period
Between baseline and FU1
Between FU1 and FU2 Between FU2 and FU3 Overall
Type of discontinuation Intervention Control Intervention Control Intervention Control Intervention Control
Withdrew from the intervention
xx(xx.x%) xx(xx.x%) xx(xx.x%) xx(xx.x%) xx(xx.x%) xx(xx.x%) xx(xx.x%) xx(xx.x%)
Withdrew from study xx(xx.x%) xx(xx.x%) xx(xx.x%) xx(xx.x%) xx(xx.x%) xx(xx.x%) xx(xx.x%) xx(xx.x%) Lost to follow up* xx(xx.x%) xx(xx.x%) xx(xx.x%) xx(xx.x%) xx(xx.x%) xx(xx.x%) xx(xx.x%) xx(xx.x%) xx(xx.x%) xx(xx.x%) xx(xx.x%) xx(xx.x%) xx(xx.x%) xx(xx.x%) xx(xx.x%) xx(xx.x%)
*date of last contact will be used
ii. Baseline characteristics
Table 4: Summary of baseline characteristics by treatment arm
Intervention Control All
(n=xxx) (n=xxx) (n=xxx)
Primary caregiver variables
Ethnicity White: English / Welsh / Scottish / Northern Irish / British
xx(xx.x%) xx(xx.x%) xx(xx.x%)
xx(xx.x%) xx(xx.x%) xx(xx.x%)
Qualification Higher Education xx(xx.x%) xx(xx.x%) xx(xx.x%)
A, AS or S Levels xx(xx.x%) xx(xx.x%) xx(xx.x%)
O levels or GCSE: 5 or more xx(xx.x%) xx(xx.x%) xx(xx.x%)
Vocational or Overseas qualifications
xx(xx.x%) xx(xx.x%) xx(xx.x%)
None or Low Level Qualifications
xx(xx.x%) xx(xx.x%) xx(xx.x%)
Religion None xx(xx.x%) xx(xx.x%) xx(xx.x%)
Christian xx(xx.x%) xx(xx.x%) xx(xx.x%)
Other Religions xx(xx.x%) xx(xx.x%) xx(xx.x%)
Relationship status Married and living together xx(xx.x%) xx(xx.x%) xx(xx.x%)
34 E-SEE Main Trial Statistical Analysis Plan v1
Cohabiting/living together xx(xx.x%) xx(xx.x%) xx(xx.x%)
Other xx(xx.x%) xx(xx.x%) xx(xx.x%)
Age (years) N (%) xx(xx.x%) xx(xx.x%) xx(xx.x%)
Mean (SD) xx.x(xx.x) xx(xx.x) xx.x(xx.x)
Median (IQR) xx.x(xx.x-xx.x) xx.x(xx.x-xx.x) xx.x(xx.x-xx.x)
Min., Max. xx,xx xx,xx xx,xx
Index Child variables
Born premature No xx(xx.x%) xx(xx.x%) xx(xx.x%)
Yes xx(xx.x%) xx(xx.x%) xx(xx.x%)
First Child No xx(xx.x%) xx(xx.x%) xx(xx.x%)
Yes xx(xx.x%) xx(xx.x%) xx(xx.x%)
Ever Breastfed No xx(xx.x%) xx(xx.x%) xx(xx.x%)
Yes xx(xx.x%) xx(xx.x%) xx(xx.x%)
Currently breastfeeding No xx(xx.x%) xx(xx.x%) xx(xx.x%)
Yes xx(xx.x%) xx(xx.x%) xx(xx.x%)
Baseline characteristics tables will be presented separately for primary caregivers, child and co-parents
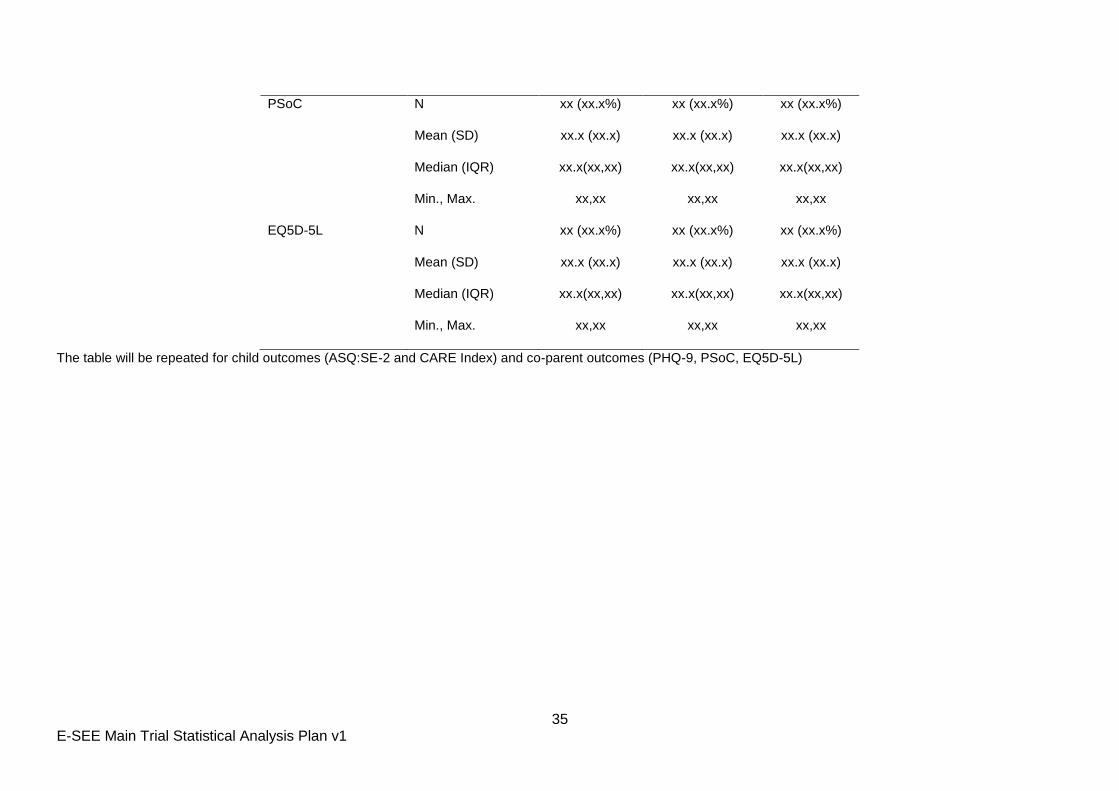
Table 5: Summary of questionnaire scores for parents at baseline by treatment arm
Variable
Control
(n=xx)
Intervention
(n=xx)
All
(n=xx)
PHQ-9 N xx (xx.x%) xx (xx.x%) xx (xx.x%)
Mean (SD) xx.x (xx.x) xx.x (xx.x) xx.x (xx.x)
Median (IQR) xx.x(xx,xx) xx.x(xx,xx) xx.x(xx,xx)
Min., Max. xx,xx xx,xx xx,xx
35 E-SEE Main Trial Statistical Analysis Plan v1
PSoC N xx (xx.x%) xx (xx.x%) xx (xx.x%)
Mean (SD) xx.x (xx.x) xx.x (xx.x) xx.x (xx.x)
Median (IQR) xx.x(xx,xx) xx.x(xx,xx) xx.x(xx,xx)
Min., Max. xx,xx xx,xx xx,xx
EQ5D-5L N xx (xx.x%) xx (xx.x%) xx (xx.x%)
Mean (SD) xx.x (xx.x) xx.x (xx.x) xx.x (xx.x)
Median (IQR) xx.x(xx,xx) xx.x(xx,xx) xx.x(xx,xx)
Min., Max. xx,xx xx,xx xx,xx
The table will be repeated for child outcomes (ASQ:SE-2 and CARE Index) and co-parent outcomes (PHQ-9, PSoC, EQ5D-5L)

36 E-SEE Main Trial Statistical Analysis Plan v1
iii. Analysis of primary outcomes results
Table 6: Summary statistics for the primary outcome at each time point ASQ:SE-2 scores
Intervention Control Overall
FU0 N (%) xx (xx.x%) xx (xx.x%) xx (xx.x%)
Mean (SD) xx.x (xx.x) xx.x (xx.x) xx.x (xx.x)
Median (IQR) xx.x(xx,xx) xx.x(xx,xx) xx.x(xx,xx)
Min, Max. xx,xx xx,xx xx,xx
FU1 N (%) xx (xx.x%) xx (xx.x%) xx (xx.x%)
Mean (SD) xx.x (xx.x) xx.x (xx.x) xx.x (xx.x)
Median (IQR) xx.x(xx,xx) xx.x(xx,xx) xx.x(xx,xx)
Min, Max. xx,xx xx,xx xx,xx
FU2 N (%) xx (xx.x%) xx (xx.x%) xx (xx.x%)
Mean (SD) xx.x (xx.x) xx.x (xx.x) xx.x (xx.x)
Median (IQR) xx.x(xx,xx) xx.x(xx,xx) xx.x(xx,xx)
Min, Max. xx,xx xx,xx xx,xx
FU3 N (%) xx (xx.x%) xx (xx.x%) xx (xx.x%)
Mean (SD) xx.x (xx.x) xx.x (xx.x) xx.x (xx.x)
Median (IQR) xx.x(xx,xx) xx.x(xx,xx) xx.x(xx,xx)
Min, Max. xx,xx xx,xx xx,xx
This table will be repeated for Primary caregiver and co-parent PHQ-9 scores
37 E-SEE Main Trial Statistical Analysis Plan v1
Figure 2: Forest plot showing results from the primary analysis
38 E-SEE Main Trial Statistical Analysis Plan v1
Figure 3: Line plot of mean ASQ:SE-2 at each time point
This figure will be repeated for PHQ-9
39 E-SEE Main Trial Statistical Analysis Plan v1
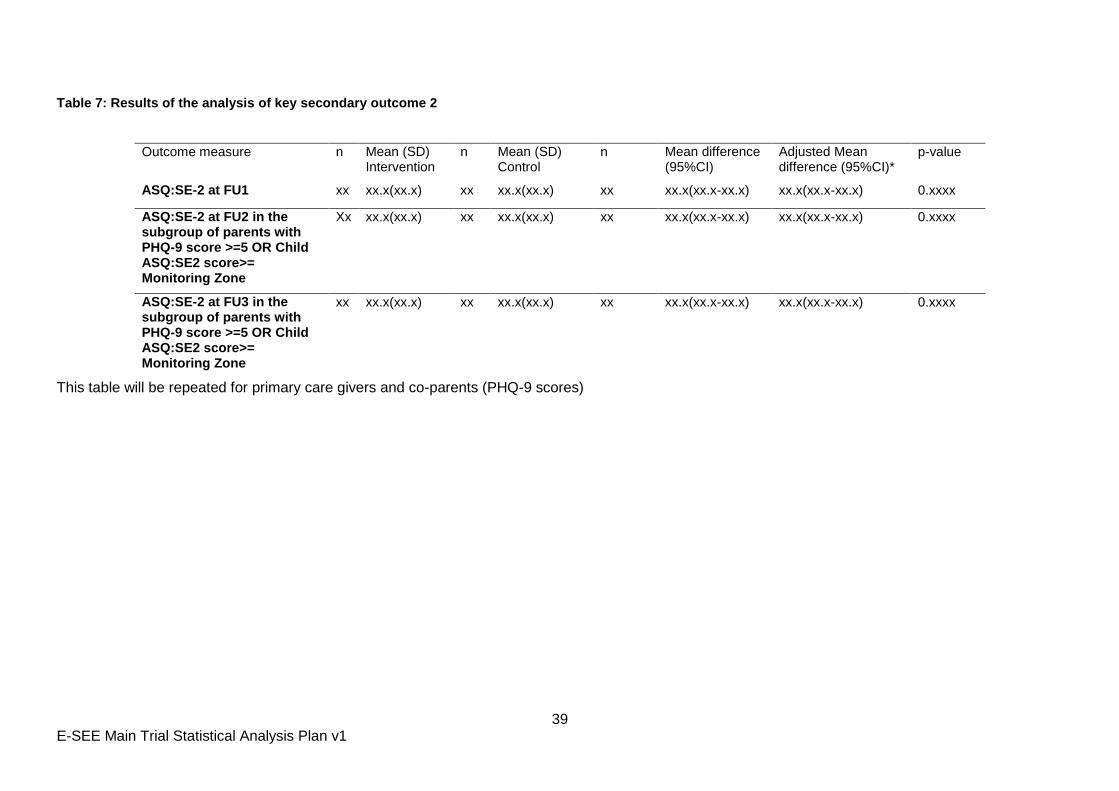
Table 7: Results of the analysis of key secondary outcome 2
Outcome measure n Mean (SD) Intervention
n Mean (SD) Control
n Mean difference (95%CI)
Adjusted Mean difference (95%CI)*
p-value
ASQ:SE-2 at FU1 xx xx.x(xx.x) xx xx.x(xx.x) xx xx.x(xx.x-xx.x) xx.x(xx.x-xx.x) 0.xxxx
ASQ:SE-2 at FU2 in the subgroup of parents with PHQ-9 score >=5 OR Child ASQ:SE2 score>= Monitoring Zone
Xx xx.x(xx.x) xx xx.x(xx.x) xx xx.x(xx.x-xx.x) xx.x(xx.x-xx.x) 0.xxxx
ASQ:SE-2 at FU3 in the subgroup of parents with PHQ-9 score >=5 OR Child ASQ:SE2 score>= Monitoring Zone
xx xx.x(xx.x) xx xx.x(xx.x) xx xx.x(xx.x-xx.x) xx.x(xx.x-xx.x) 0.xxxx
This table will be repeated for primary care givers and co-parents (PHQ-9 scores)
40 E-SEE Main Trial Statistical Analysis Plan v1
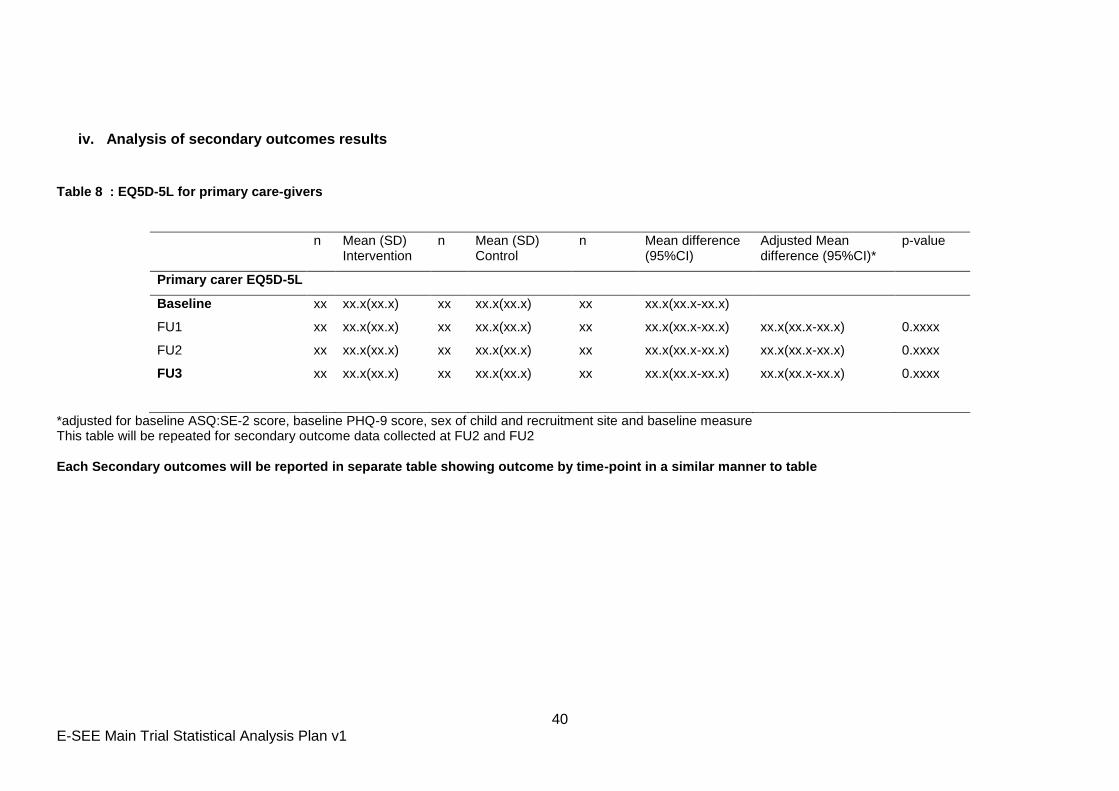
iv. Analysis of secondary outcomes results
Table 8 : EQ5D-5L for primary care-givers
n Mean (SD) Intervention
n Mean (SD) Control
n Mean difference (95%CI)
Adjusted Mean difference (95%CI)*
p-value
Primary carer EQ5D-5L
Baseline xx xx.x(xx.x) xx xx.x(xx.x) xx xx.x(xx.x-xx.x)
FU1 xx xx.x(xx.x) xx xx.x(xx.x) xx xx.x(xx.x-xx.x) xx.x(xx.x-xx.x) 0.xxxx
FU2 xx xx.x(xx.x) xx xx.x(xx.x) xx xx.x(xx.x-xx.x) xx.x(xx.x-xx.x) 0.xxxx
FU3 xx xx.x(xx.x) xx xx.x(xx.x) xx xx.x(xx.x-xx.x) xx.x(xx.x-xx.x) 0.xxxx
*adjusted for baseline ASQ:SE-2 score, baseline PHQ-9 score, sex of child and recruitment site and baseline measure This table will be repeated for secondary outcome data collected at FU2 and FU2 Each Secondary outcomes will be reported in separate table showing outcome by time-point in a similar manner to table
41 E-SEE Main Trial Statistical Analysis Plan v1
Figure 4: Line plot showing mean secondary outcome scores
42 E-SEE Main Trial Statistical Analysis Plan v1
v. Subgroup analysis results
Table 9: Results of subgroup analysis
Subgroup n Mean (SD) Intervention
n Mean (SD) Control
n Mean difference (95%CI)*
p-value*
TBC xx xx.x(xx.x) xx xx.x(xx.x) xx xx.x(xx.x-xx.x) 0.xxxx
xx xx.x(xx.x) xx xx.x(xx.x) xx xx.x(xx.x-xx.x)
xx xx.x(xx.x) xx xx.x(xx.x) xx xx.x(xx.x-xx.x)
xx xx.x(xx.x) xx xx.x(xx.x) xx xx.x(xx.x-xx.x) 0.xxxx
xx xx.x(xx.x) xx xx.x(xx.x) xx xx.x(xx.x-xx.x)
xx xx.x(xx.x) xx xx.x(xx.x) xx xx.x(xx.x-xx.x) 0.xxxx
xx xx.x(xx.x) xx xx.x(xx.x) xx xx.x(xx.x-xx.x)
xx xx.x(xx.x) xx xx.x(xx.x) xx xx.x(xx.x-xx.x)
xx xx.x(xx.x) xx xx.x(xx.x) xx xx.x(xx.x-xx.x) 0.xxxx
* p-value from interaction test
43 E-SEE Main Trial Statistical Analysis Plan v1
vi. Safety analysis results
Table 10: Summary of safety data Intervention Control All
Number (%) of participants who experienced >=1 AE xx(xx.x%) xx(xx.x%) xx(xx.x%)
Number of all AEs (including repeated events) xx xx xx
AE related to intervention
Unlikely xx(xx.x%) xx(xx.x%) xx(xx.x%)
Unrelated xx(xx.x%) xx(xx.x%) xx(xx.x%)
Intervention Control All
Number (%) of participants who experienced >=1 SAE
xx(xx.x%) xx(xx.x%) xx(xx.x%)
Number of all SAEs (including repeated events) xx xx xx
SAE related to intervention
Unrelated xx(xx.x%) xx(xx.x%) xx(xx.x%)
Intensity of SAE
Mild xx(xx.x%) xx(xx.x%) xx(xx.x%)
Moderate xx(xx.x%) xx(xx.x%) xx(xx.x%)
Severe xx(xx.x%) xx(xx.x%) xx(xx.x%)
Frequency of SAE
Isolated xx(xx.x%) xx(xx.x%) xx(xx.x%)
Intermittent xx(xx.x%) xx(xx.x%) xx(xx.x%)
Unknown xx(xx.x%) xx(xx.x%) xx(xx.x%)
44 E-SEE Main Trial Statistical Analysis Plan v1
vii. Adherence to intervention
Table 11: Summary of the number of sessions received by participants Programme Consent Number of sessions
1 2 3 5 8** 10 12
IY-I Xx Attended at least this many sessions
n xx xx xx xx xx xx xx
(%) xx% xx% xx% xx% xx% xx% xx%
IY-T xx Attended at least this many sessions
n xx xx xx xx xx xx xx
(%) xx% xx% xx% xx% xx% xx% xx%
Table 12: Summary of IY-I and IY-T groups Number
assigned to a
group
Number who attended one
or more sessions
Median
sessions
attended (IQR)
Min, Max.
IY-I xx xx(xx%) xx(xx,xx) x,xx
IY-T xx xx(xx%) xx(xx,xx) x,xx
Table 13: Summary of all intervention sessions
Number of Sessions
that occurred
Median (IQR) Min, Max.
IY-I xx xx(xx,xx) x,xx
IY-T xx xx(xx,xx) x,xx
45 E-SEE Main Trial Statistical Analysis Plan v1
Table 14: Summary of breastfeeding at baseline
Variable Intervention Control All
(n=xxx) (n=xxx) (n=xxx)
Breastfeeding
History
Never breastfed xx(xx.x%) xx(xx.x%) xx(xx.x%)
Previously breastfed, now stopped xx(xx.x%) xx(xx.x%) xx(xx.x%)
Currently breastfeeding - xx(xx.x%) xx(xx.x%) xx(xx.x%)
Not Known1 xx(xx.x%) xx(xx.x%) xx(xx.x%)
Of those
currently
breastfeeding
Does not use bottle xx(xx.x%) xx(xx.x%) xx(xx.x%)
Also uses bottle xx(xx.x%) xx(xx.x%) xx(xx.x%)
Childs age
when stopped
breastfeeding
(weeks)
N (%) xx(xx.x%) xx(xx.x%) xx(xx.x%)
Mean (SD) xx.x (xx.x) xx.x (xx.x) xx.x (xx.x)
Median (IQR) xx.x(xx,xx) xx.x(xx,xx) xx.x(xx,xx)
Min., Max. xx,xx xx,xx xx,xx
This table will be repeated for FU1 and FU2
46 E-SEE Main Trial Statistical Analysis Plan v1
Appendix B: E-SEE Primary Outcome – methods comparison
Proposed Primary Analysis
For our primary analysis, we propose to ignore the clustering by treatment group, as it is not possible
to account for it appropriately in the methods we have explored. This is also current practice in the
wider community.
Background
The E-SEE intervention has three distinct phases. In stage 1, all participants in the treatment arm get
a self-help intervention book and in stages 2 and 3, participants with interim outcomes above a
threshold are eligible for a group therapy.
The objective of the primary analysis is to estimate the impact of the intervention as a whole rather
than the specific stages. In many ways, E-SEE is similar to stepped care treatments where higher
intensity treatments are available to those unresponsive to a lower intensity treatment. The
difference here is that the higher intensity E-SEE interventions is group based, which may induce
clustering (“within-arm partial nesting” in the literature). The recent systematic review arising from
the E-SEE sub-study (Candlish et al, 2019) found it is common practice to ignore such treatment
induced clustering in the statistical analysis. This seems to contrast with the recommendation that
trials with single arm treatment induced clustering should account for clustering in the analysis
(Candlish et al. 2018). In Chapter 5 of her PhD thesis Candlish explored a number of approaches to
analyse a simple within-arm partially nested trial. The thesis demonstrated that random assignment
of a treatment group subset to a stepped up group based treatment then adjusting for clustering was
appropriate. However, with targeted allocation (as in a proportionate intervention such as ESEE)
adjusting for clustering gave biased estimates of the treatment effect even under the null. The thesis
also explored linear regression with fixed effects only with and without cluster robust standard errors.
The thesis showed that naïve linear regression not accounting for clustering gives the best coverage
and control of type 1 error rate provided the ICC is below 0.1. Using cluster robust standard errors
always over controlled the type 1 error rate (and hence 95%CI coverage was too high), whereas cluster
bootstrap robust standard errors poorly controlled the type 1 error rate and hence the coverage of
95%Cis was too low. The reason behind these possibly counterintuitive results is because the within
therapy group and within person correlations are confounded with the correlation caused by
selection. Candlish recommended that provided the treatment induced ICC is below 0.05 then ignoring
47 E-SEE Main Trial Statistical Analysis Plan v1
the clustering is the most cautious approach. However, estimating the ICC in proportionate
intervention designs is not generally possible because of the confounding induced by selection.
Approach to justifying our proposal
As we cannot know the true ICC and the E-SEE design is more complex than scenarios simulated by
Candlish, we have used simulations to explore the robustness of four naïve models that do not account
for clustering for a scenario similar to E-SEE. As a simplifying assumption, we simulated data for two
follow up measurements with equal correlation between each time point and a single high intensity
treatment delivered between FU1 and FU2 for those with the highest outcome score at FU1. We then
estimate the impact of treatment using the outcome at FU1 and FU2 using the two models and
compared the approaches by looking at their estimates for treatments effect, treatment effect
standard error and type I and type II error rates. We considered the following models:
1. Mixed effects model with time and clusters as random components.
2. Mixed effect models with time as a random component (random intercept only)
3. Mixed effect models with time as a random component (random intercept and slope) with an
exchangeable correlation structure and Satterthwaite adjusted standard errors.
4. Marginal model estimated using GEE with a Gaussian family, identity link and an exchangeable
correlation structure.
5. Marginal model estimated using GEE with a Gaussian family, identity link, an exchangeable
correlation structure and robust standard errors.
Detailed Method
For various value of intra cluster correlation (𝜌) between 0 and 0.2, we simulated between 100 and
500 samples under both the null and the alternative hypothesis using the following assumptions:
The outcomes under the null at FU1 and FU2 vary according to a normal distribution with
mean 26 and 36 respectively and standard deviation (s) of 10 (before clustering) for each time
point;
An overall effect size of 3.46 (2.5 at FU1 and 15 for those stepped up at FU2);
A correlation () of 0.4 between time points;
13 clusters sized between 2 and 125 as in ESEE (see appendix C);
The number of samples and values of ICC considered was lower for the more complex models because
the time taken to estimate the model for each sample was prohibitively high.
5 Actual cluster sizes were: 2, 2, 2, 3, 6, 6, 6, 6, 7, 7, 8, 9 and 12

48 E-SEE Main Trial Statistical Analysis Plan v1
Outcomes for the three time points are generated using two stages. First by simulating values from a
normal distribution with fixed mean and standard deviation reduced to account for time correlation
[s√(1 − 𝜏) ] and second, by adding an individual component common to each of the individual’s three
time points with mean 0 and standard deviation [s√𝜏 ].
We simulate the assumed intra-cluster correlation (𝜌) by adding a mean cluster effect to each
member of the cluster at FU2 with mean 0 and variance 𝜎𝑢2 such that:
𝜎𝑢2
𝜎𝑢2+𝜎𝑒
2 =𝜌, i.e. 𝜎𝑢 = 𝑠√𝜌√(1 − 𝜏)
The simulations used STATA.
Results
Charts are in appendix D and results are summarised in Table A1. Table A1 shows that selecting the
most appropriate model will require a trade-off between bias and precision. Model 1 gives highly
biased estimates and can be discounted immediately. Model 3 (random intercept and slope with
adjustment for unequal variance) best controls for precision with type I error appropriately controlled
(5%) and type II error increasing as ICC and total variance increases; but gives biased estimates of the
treatment effect. Unbiased estimates are given by models 2, 4 and 5 and while they all exhibit similar
levels of type II error, model 5 gives the best control for type I error and is our preferred model for the
primary analysis because we believe that an unbiased estimate is more important that precision.
Table A1: Results of methods comparison
Effect Type 1 Power Runs
Full mixed model
1 Random effects for time and clusters6; exchangeable correlation, Satterthwaite SE
2.5 (biased)
0.05 0.83 100
Naïve Mixed model
2 Random intercept 3.46 0.08 0.99 500
3 Random intercept and slope; exchangeable correlation, Satterthwaite SE
3.2 (biased)
0.04? Decreases as ICC increases
200
Naïve GEE
4 Exchangeable correlation 3.46 Increases as ICC increases
0.98 200
5 Exchangeable correlation, robust SE 3.46 0.05 0.988 500
Appendix C – reduced consort
6 Random intercept and slope for time. Random intercept and random slope to restrict to stepped up participants for clusters.
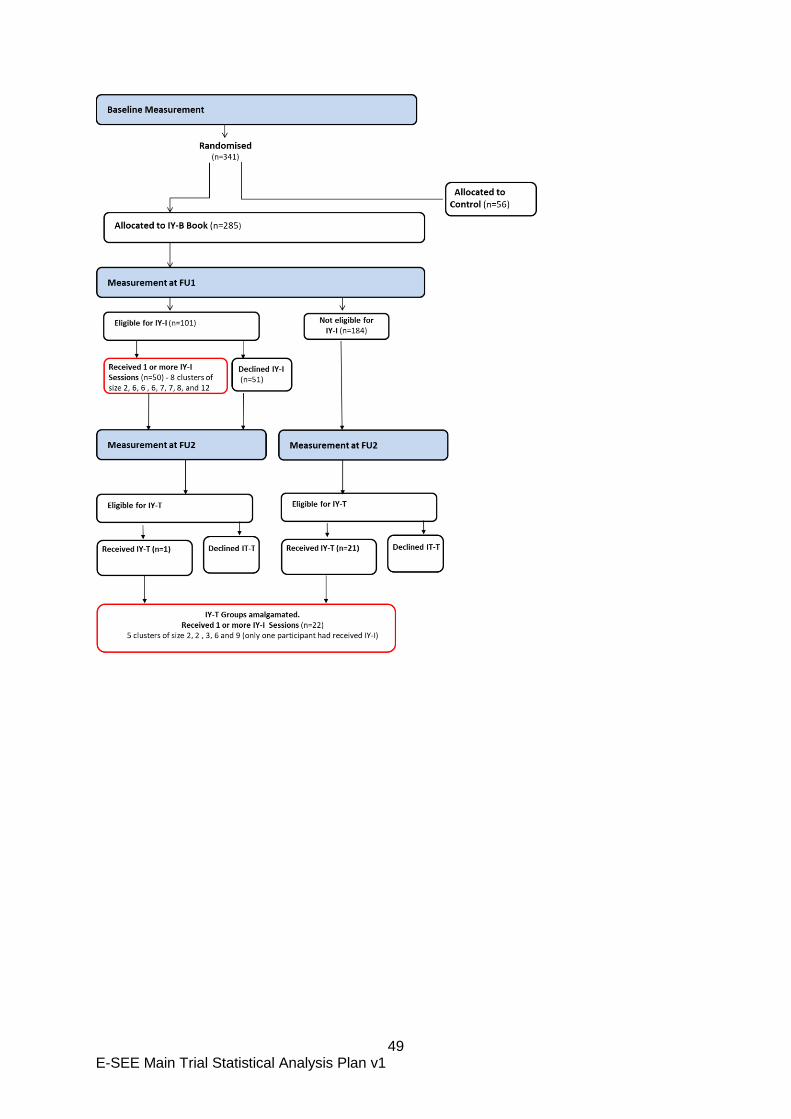
49 E-SEE Main Trial Statistical Analysis Plan v1
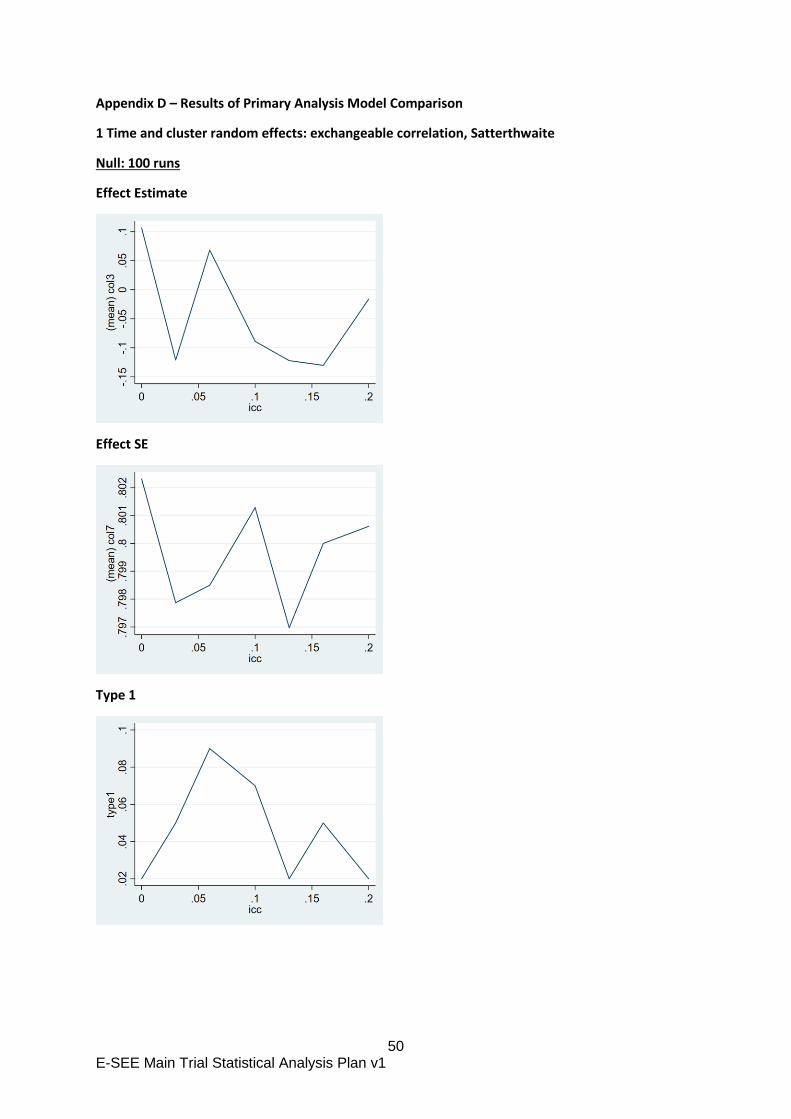
50 E-SEE Main Trial Statistical Analysis Plan v1
Appendix D – Results of Primary Analysis Model Comparison
1 Time and cluster random effects: exchangeable correlation, Satterthwaite
Null: 100 runs
Effect Estimate
Effect SE
Type 1
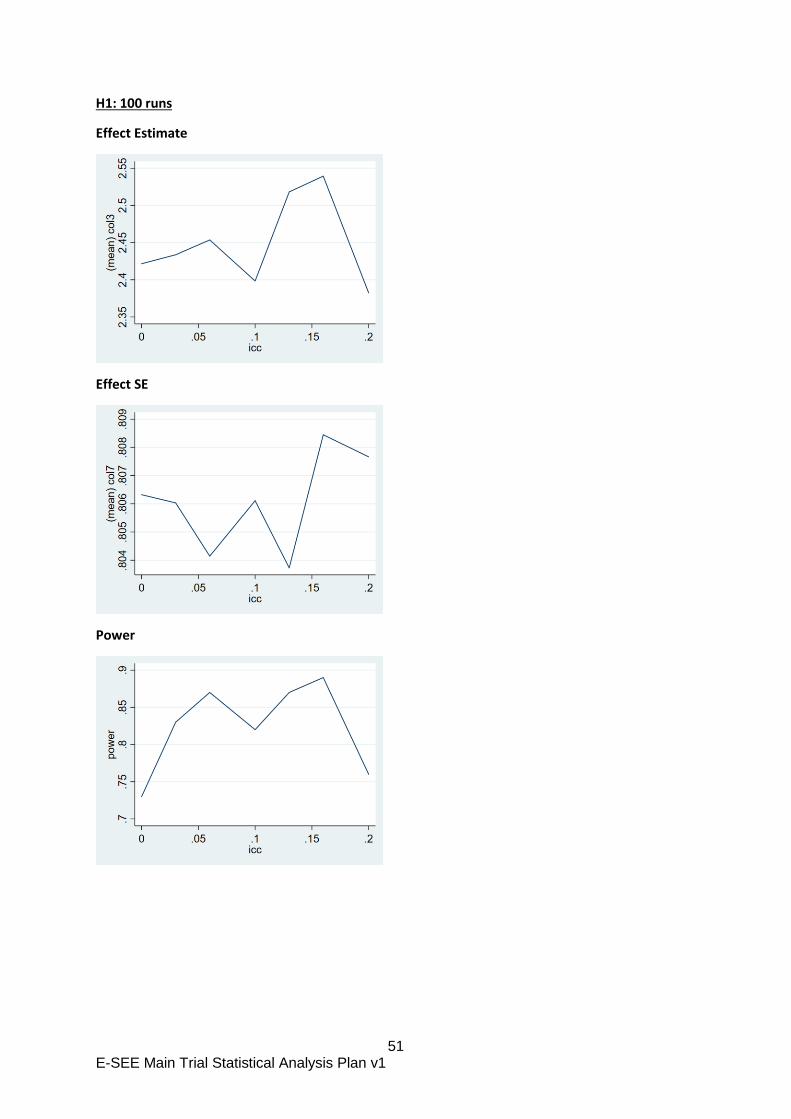
51 E-SEE Main Trial Statistical Analysis Plan v1
H1: 100 runs
Effect Estimate
Effect SE
Power
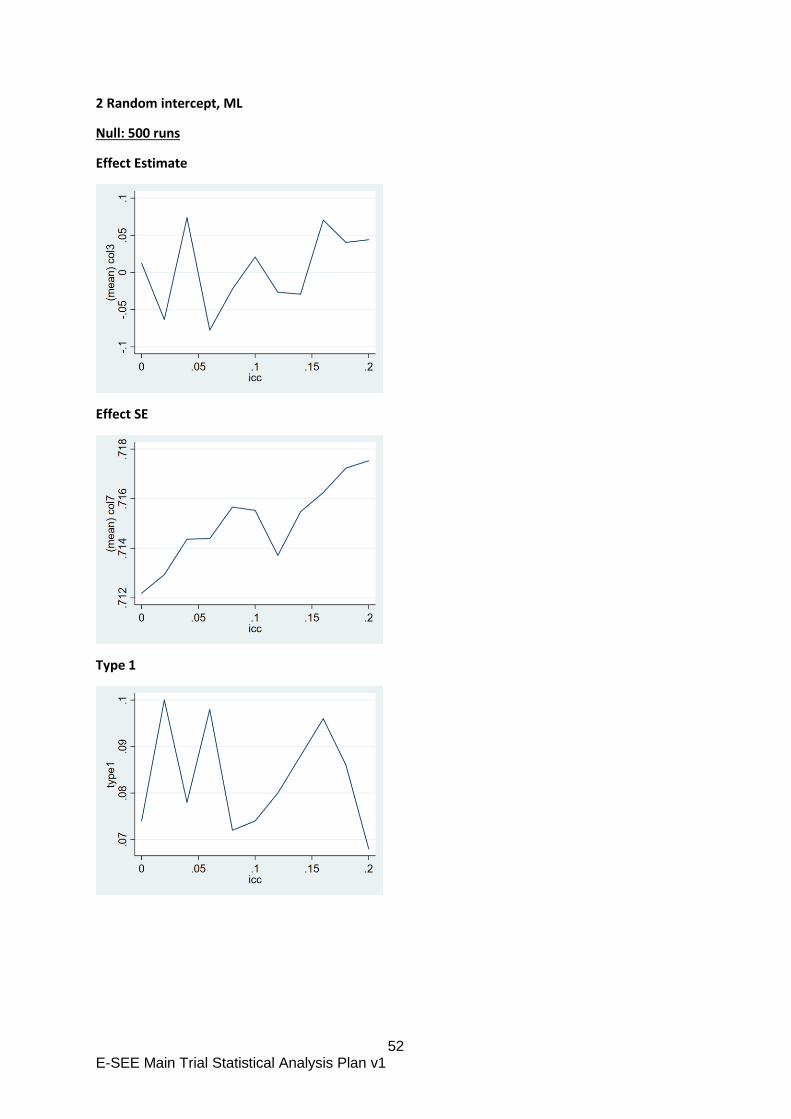
52 E-SEE Main Trial Statistical Analysis Plan v1
2 Random intercept, ML
Null: 500 runs
Effect Estimate
Effect SE
Type 1
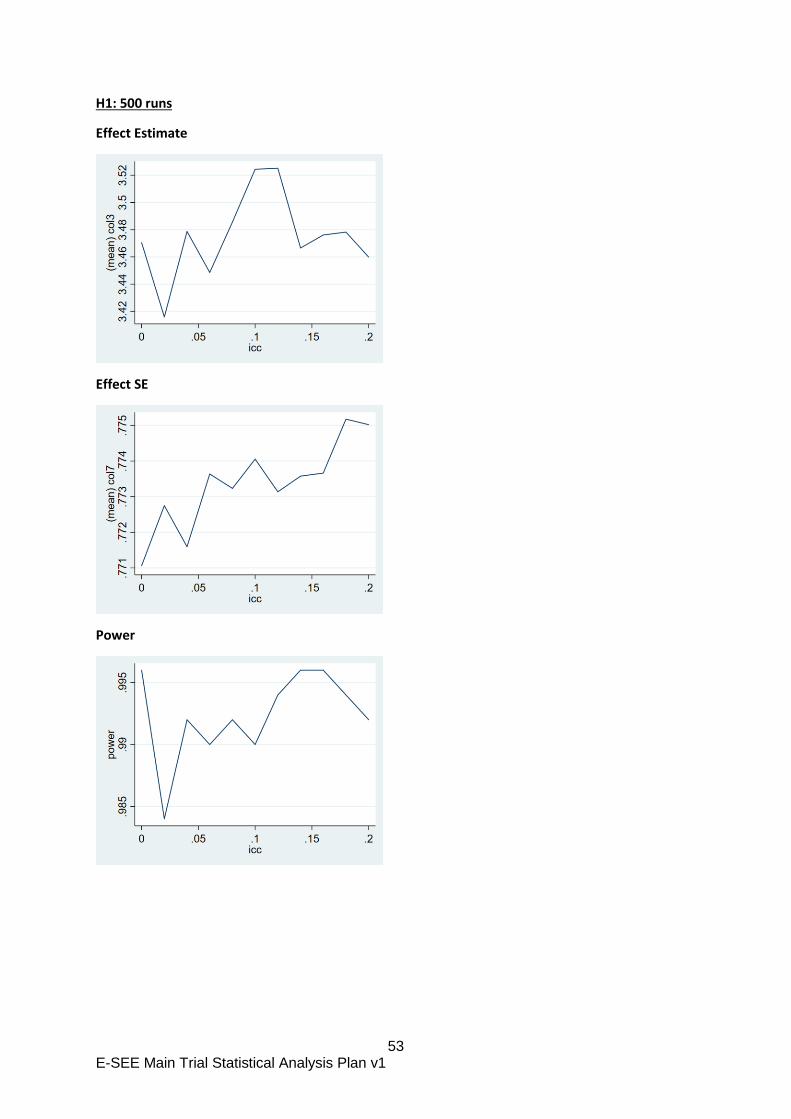
53 E-SEE Main Trial Statistical Analysis Plan v1
H1: 500 runs
Effect Estimate
Effect SE
Power
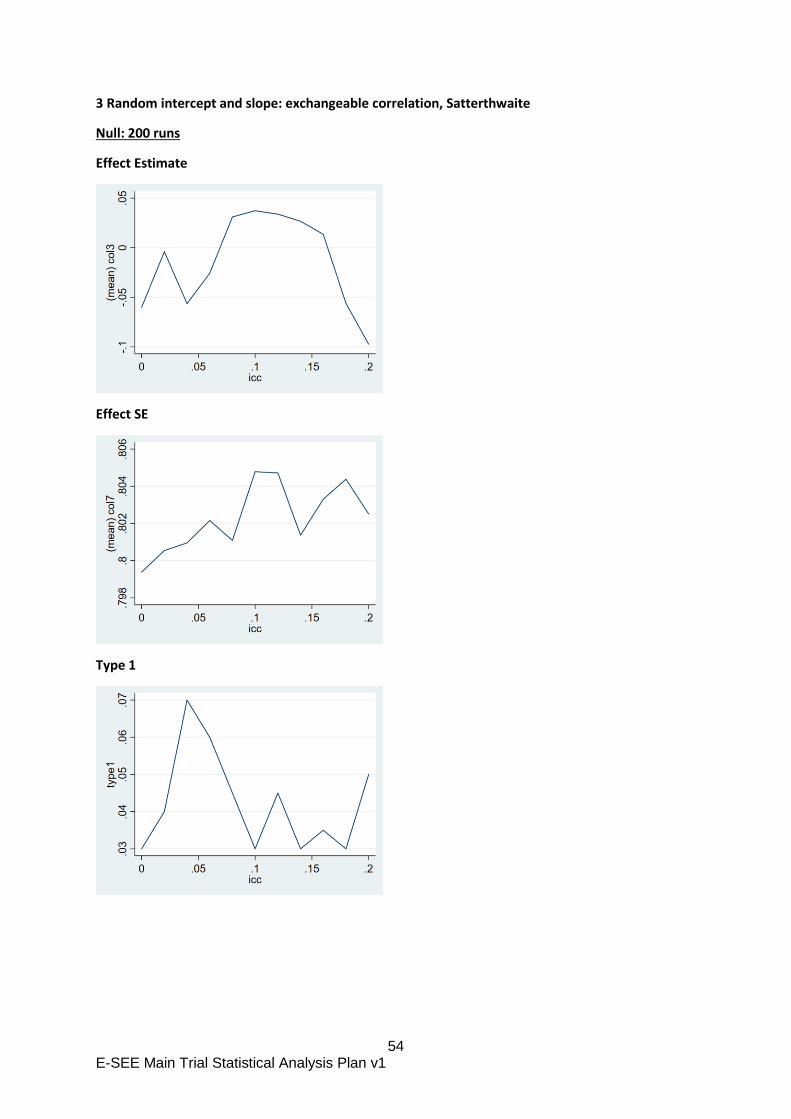
54 E-SEE Main Trial Statistical Analysis Plan v1
3 Random intercept and slope: exchangeable correlation, Satterthwaite
Null: 200 runs
Effect Estimate
Effect SE
Type 1
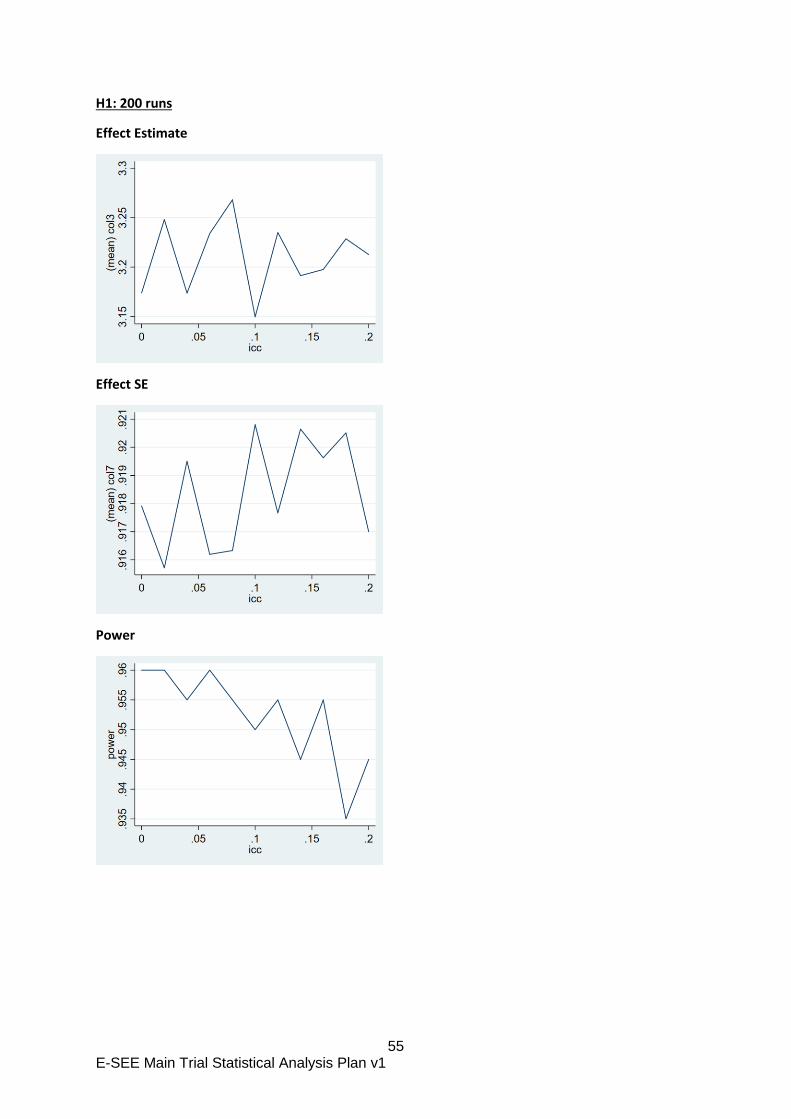
55 E-SEE Main Trial Statistical Analysis Plan v1
H1: 200 runs
Effect Estimate
Effect SE
Power
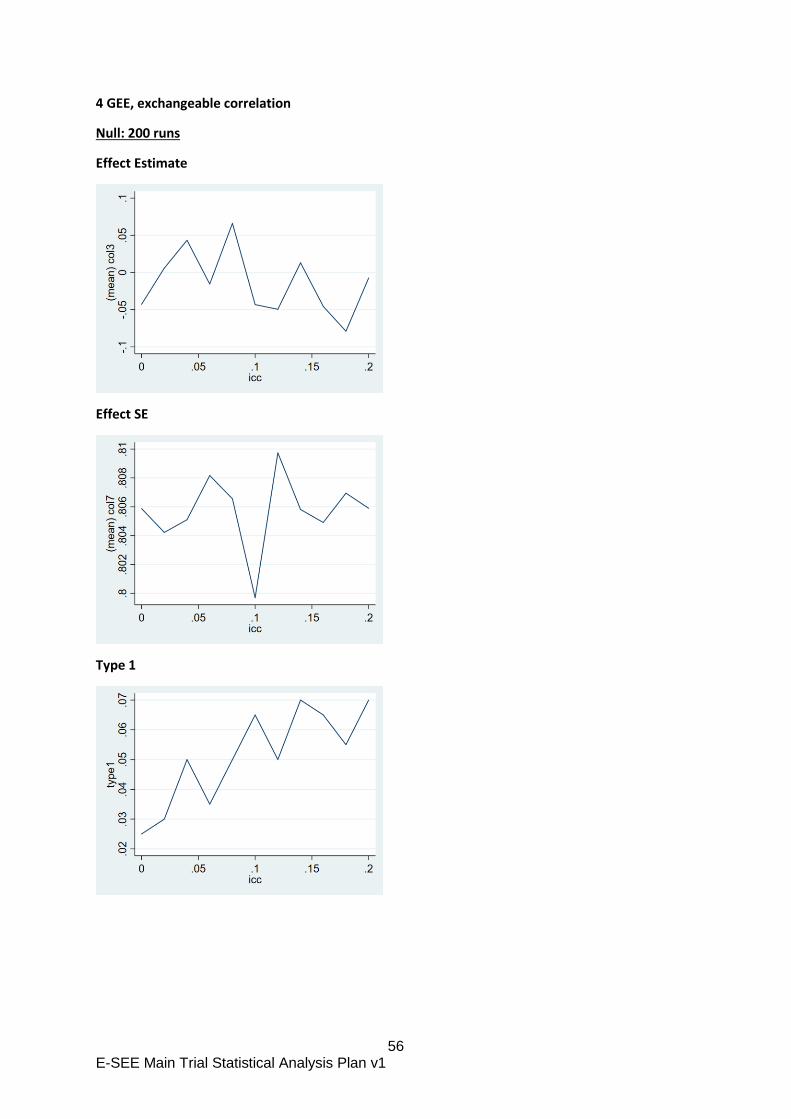
56 E-SEE Main Trial Statistical Analysis Plan v1
4 GEE, exchangeable correlation
Null: 200 runs
Effect Estimate
Effect SE
Type 1
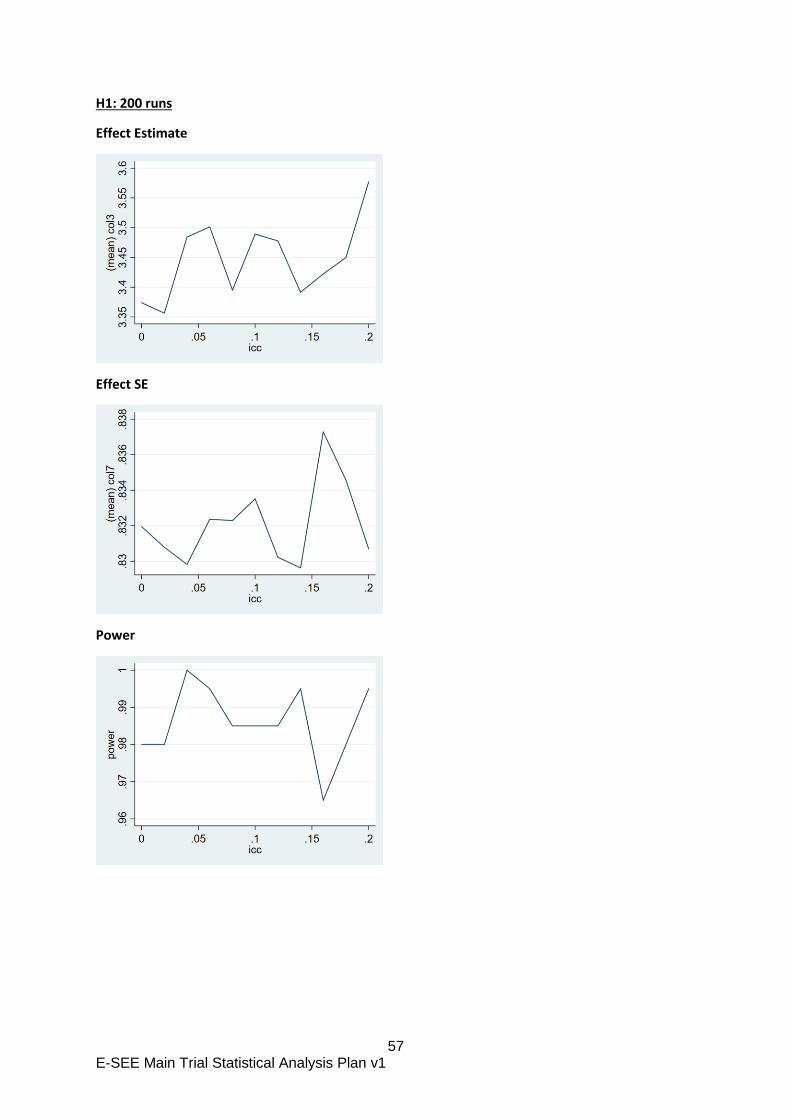
57 E-SEE Main Trial Statistical Analysis Plan v1
H1: 200 runs
Effect Estimate
Effect SE
Power
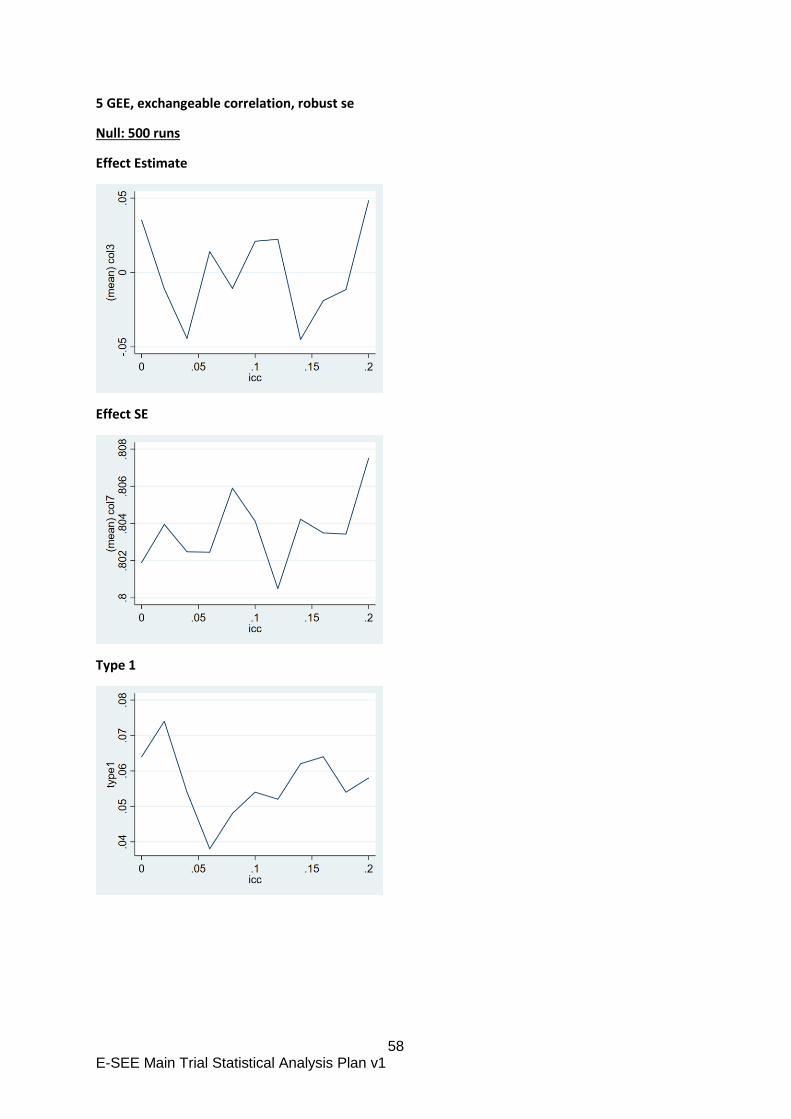
58 E-SEE Main Trial Statistical Analysis Plan v1
5 GEE, exchangeable correlation, robust se
Null: 500 runs
Effect Estimate
Effect SE
Type 1
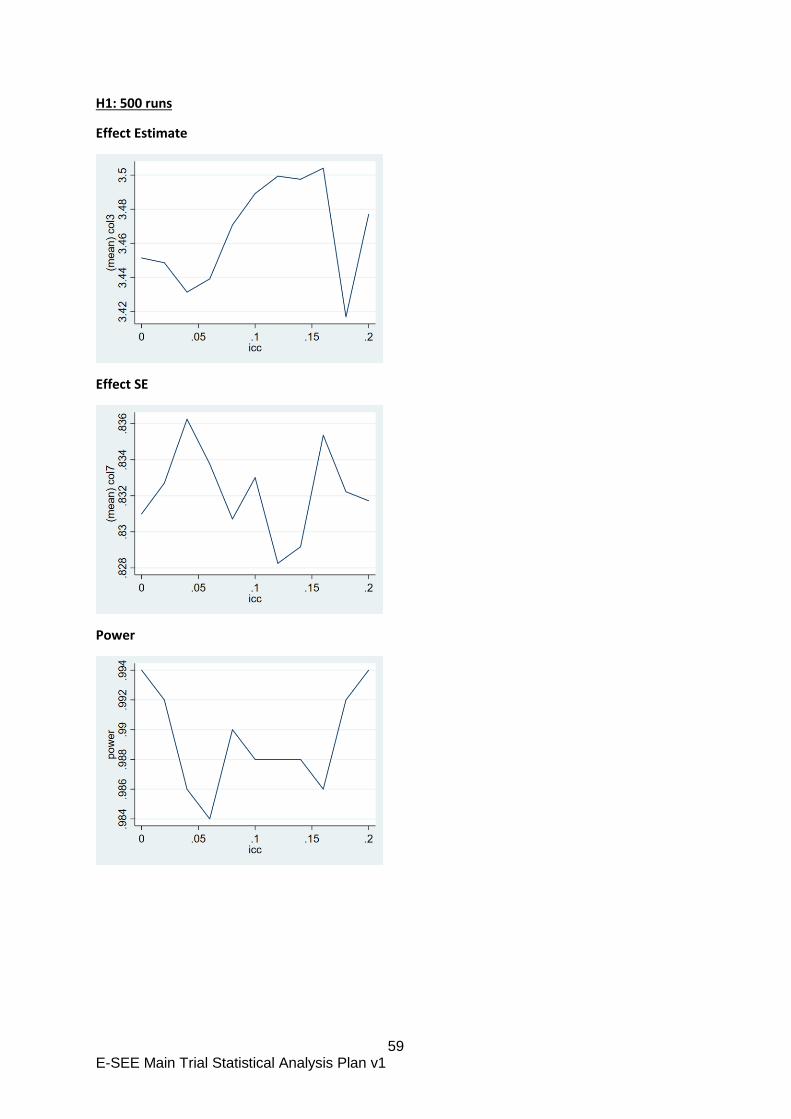
59 E-SEE Main Trial Statistical Analysis Plan v1
H1: 500 runs
Effect Estimate
Effect SE
Power