Embed Size (px)
Citation preview
vmax Guide v1.3 series
Nimsoft® Monitor™
Legal Notices Copyright © 2012, CA. All rights reserved.
Warranty
The material contained in this document is provided "as is," and is subject to being changed, without notice, in future editions. Further, to the maximum extent permitted by applicable law, Nimsoft LLC disclaims all warranties, either express or implied, with regard to this manual and any information contained herein, including but not limited to the implied warranties of merchantability and fitness for a particular purpose. Nimsoft LLC shall not be liable for errors or for incidental or consequential damages in connection with the furnishing, use, or performance of this document or of any information contained herein. Should Nimsoft LLC and the user have a separate written agreement with warranty terms covering the material in this document that conflict with these terms, the warranty terms in the separate agreement shall control.
Technology Licenses
The hardware and/or software described in this document are furnished under a license and may be used or copied only in accordance with the terms of such license.
No part of this manual may be reproduced in any form or by any means (including electronic storage and retrieval or translation into a foreign language) without prior agreement and written consent from Nimsoft LLC as governed by United States and international copyright laws.
Restricted Rights Legend
If software is for use in the performance of a U.S. Government prime contract or subcontract, Software is delivered and licensed as "Commercial computer software" as defined in DFAR 252.227-7014 (June 1995), or as a "commercial item" as defined in FAR 2.101(a) or as "Restricted computer software" as defined in FAR 52.227-19 (June 1987) or any equivalent agency regulation or contract clause. Use, duplication or disclosure of Software is subject to Nimsoft LLC’s standard commercial license terms, and non-DOD Departments and Agencies of the U.S. Government will receive no greater than Restricted Rights as defined in FAR 52.227-19(c)(1-2) (June 1987). U.S. Government users will receive no greater than Limited Rights as defined in FAR 52.227-14 (June 1987) or DFAR 252.227-7015 (b)(2) (November 1995), as applicable in any technical data.
Trademarks
Nimsoft is a trademark of CA.
Adobe®, Acrobat®, Acrobat Reader®, and Acrobat Exchange® are registered trademarks of Adobe Systems Incorporated.
Intel® and Pentium® are U.S. registered trademarks of Intel Corporation.
Java(TM) is a U.S. trademark of Sun Microsystems, Inc.
Microsoft® and Windows® are U.S. registered trademarks of Microsoft Corporation.
Netscape(TM) is a U.S. trademark of Netscape Communications Corporation.
Oracle® is a U.S. registered trademark of Oracle Corporation, Redwood City, California.
UNIX® is a registered trademark of the Open Group.
ITIL® is a Registered Trade Mark of the Office of Government Commerce in the United Kingdom and other countries.
All other trademarks, trade names, service marks and logos referenced herein belong to their respective companies.
Contact Nimsoft
For your convenience, Nimsoft provides a single site where you can access information about Nimsoft products.
At http://support.nimsoft.com/, you can access the following:
■ Online and telephone contact information for technical assistance and customer services
■ Information about user communities and forums
■ Product and documentation downloads
■ Nimsoft Support policies and guidelines
■ Other helpful resources appropriate for your product
Provide Feedback
If you have comments or questions about Nimsoft product documentation, you can send a message to [email protected].

Contents 5
Contents
Chapter 1: vmax 1.3 7
Prerequisites and Supported Platforms ....................................................................................................................... 8
Requirements ........................................................................................................................................................ 8
Installation Notes .................................................................................................................................................. 8
Overview ...................................................................................................................................................................... 9
Monitoring Capabilities .............................................................................................................................................. 10
Templates ................................................................................................................................................................... 10
Chapter 2: Initial Configuration 11
Enter Probe Settings ................................................................................................................................................... 11
Add One or More vmax Resources ............................................................................................................................. 12
The vmax Configuration Interface .............................................................................................................................. 14
The Browser (left-side) Pane ............................................................................................................................... 14
The Content (right-side) Pane ............................................................................................................................. 16
Toolbar Buttons................................................................................................................................................... 16
Managing Messages ................................................................................................................................................... 16
Managing QoS Data and Alarms................................................................................................................................. 17
Adding Monitors to be Measured .............................................................................................................................. 18
Manually Selecting Monitors to be Measured .................................................................................................... 19
Using Templates .................................................................................................................................................. 21
Using Auto Configurations .................................................................................................................................. 22
Chapter 3: vmax Advanced Configuration 25
Optimizing Concurrent Data Collection...................................................................................................................... 25
Vmax Event to Nimsoft Alarm Configuration ............................................................................................................. 26
Chapter 4: QoS Threshold Metrics 27
vmax Metrics .............................................................................................................................................................. 27

Chapter 1: vmax 1.3 7
Chapter 1: vmax 1.3
This description applies to vmax probe version 1.2.
This section contains the following topics:
Documentation Changes (see page 8) Prerequisites and Supported Platforms (see page 8) Overview (see page 9) Monitoring Capabilities (see page 10) Templates (see page 10)
Prerequisites and Supported Platforms
8 vmax Guide
Documentation Changes
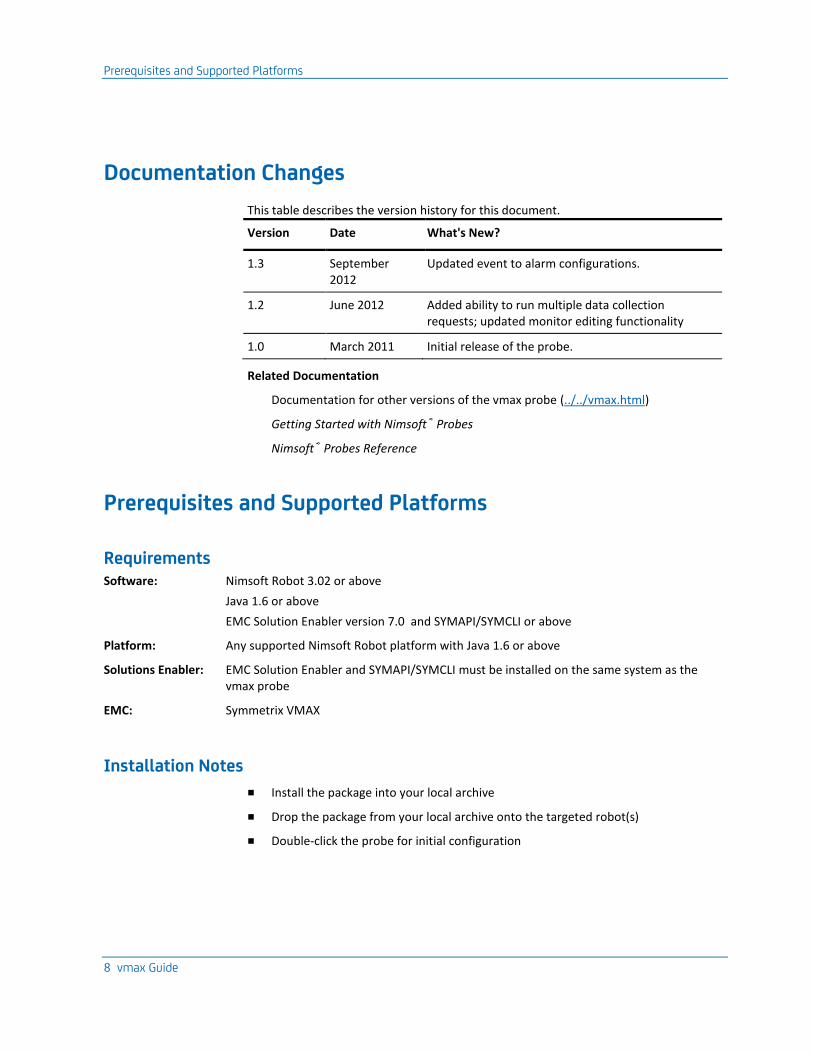
This table describes the version history for this document.
Version Date What's New?
1.3 September 2012
Updated event to alarm configurations.
1.2 June 2012 Added ability to run multiple data collection requests; updated monitor editing functionality
1.0 March 2011 Initial release of the probe.
Related Documentation
Documentation for other versions of the vmax probe (../../vmax.html)
Getting Started with Nimsoft® Probes
Nimsoft® Probes Reference
Prerequisites and Supported Platforms
Requirements Software: Nimsoft Robot 3.02 or above
Java 1.6 or above
EMC Solution Enabler version 7.0 and SYMAPI/SYMCLI or above
Platform: Any supported Nimsoft Robot platform with Java 1.6 or above
Solutions Enabler: EMC Solution Enabler and SYMAPI/SYMCLI must be installed on the same system as the vmax probe
EMC: Symmetrix VMAX
Installation Notes
■ Install the package into your local archive
■ Drop the package from your local archive onto the targeted robot(s)
■ Double-click the probe for initial configuration
Overview
Chapter 1: vmax 1.3 9
Overview
EMC VMAX is an enterprise storage system used by larger organizations. The Nimsoft vmax monitoring probe can handle all common monitoring and data collection tasks for vmax users, providing Quality of Service (QoS) data and alarms whenever it detects sub-optimal performance in the VMAX system.
The vmax probe uses the EMC Solution Enabler (also known as SYMAPI that enables SYMCLI access) to communicate with storage arrays. The CLI must have direct access to storage, with gatekeeper devices mapped to the server on which SYMCLI is running. The SYMCLI also can be configured for remote access by running SYMAPI server on servers that have gatekeeper devices mapped. The probe transparently handles discovering local VMAX systems, as well as using remote service to do the same. The probe runs specific SYMCLI commands and parses output to extract the important information. You can define alarms to be raised and propagated when specified thresholds are breached.
EMC Solutions Enabler is software that provides a host with SYMAPI (Symmetrix Application Programming Interface), CLARAPI (CLARiiON Application Programming Interface) and STORAPI (Storage Application Programming Interface) shared libraries for use by Solutions Enabler applications. Solutions Enabler was developed by EMC for storage, system, and database administrators, and systems engineers. It provides a specialized library of UNIX-formatted commands, and supports command line entries and scripts to perform configuration, control, and management operations on devices and data objects in EMC storage environments. Solutions Enabler software supports both open systems and mainframe operating systems.
Example Solutions Enabler operations:
■ Set array-wide metrics.
■ Control operations on array devices and ports.
■ Device creation, device provisioning (for host allocation), and creation of device pools for thin provisioning.
■ Fully automated storage tiering (FAST).
■ Optimize array performance.
■ Manage QOS (Quality of Service) metrics.
■ Perform virtual LUN migration tasks.
Solutions Enabler software is accompanied with every EMC storage array (Symmetrix/CLARiiON) that is sold. This is a critical piece of software and fully compatible with either Symmetrix Enginuity or CLARiiON Flare. Enginuity and Flare are the intelligent underlying software that drives the storage array operating platform.
Monitoring Capabilities
10 vmax Guide
Monitoring Capabilities
You can monitor the following components:
■ Storage Array
■ Masking
■ Directors
■ Disks
■ Devices
■ Device Pools
■ Disk Groups
■ Ports
Templates
Templates let you define reusable sets of monitors for various components. You define a template once, which defines a set of measurements you find useful, and then apply that template as necessary to achieve consistent monitoring everywhere.
See the Using Templates section for details.
Chapter 2: Initial Configuration 11
Chapter 2: Initial Configuration
Double-click the line representing the probe in Infrastructure Manager to bring up the configuration interface.
It initially appears with the following defaults in the left pane of the window:
■ The All Resources hierarchy, which initially empty.
■ The QoS hierarchy, which contains all QoS definitions.
■ The Templates hierarchy, containing the templates available.
■ The Messages hierarchy containing all the message definitions.
See the section The vmax Configuration Interface for a description of the interface and the different terms, elements, tool buttons and window panes involved.
Note: You must click the Apply button to activate any configuration modifications.
This section contains the following topics:
Enter Probe Settings (see page 11) Add One or More vmax Resources (see page 12) The vmax Configuration Interface (see page 14) Managing Messages (see page 16) Managing QoS Data and Alarms (see page 17) Adding Monitors to be Measured (see page 18)
Enter Probe Settings
Your first configuration task is to tell the probe where Solutions Enabler CLI is installed.
Click the General Setup button on the toolbar ( ) to bring up the vmax Probe Settings dialog. The fields are:
Solutions Enabler CLI Install Directory
The directory where Solutions Enabler CLI is installed.
Log-level
Sets the level of details written to the log file. Log as little as possible during normal operation, to minimize disk consumption.
0= Fatal errors.
1= Errors.
Add One or More vmax Resources
12 vmax Guide
2= Warnings.
3= Information.
4= Debug information.
5= Debug information, extremely detailed.
Enable GUI auto-refresh
When you select this option, the user interface is refreshed each 60 seconds. This reflects the most current measured values from the checkpoints and status of the nodes in the tree structure that can be seen when navigating through the VMAX system appearing under a resource node.
If not checked, you have to press the F5 button to refresh the GUI.
Note: When pressing F5 to refresh, you will not get updated values until the next time the probe has polled the VMAX system. This interval is controlled by the Check Interval set on the properties dialog for the Resource.
Enter directory where CLI is installed, set log level and auto-refresh as you prefer, and click OK.
Add One or More vmax Resources
Start by creating a resource that the probe can use to connect to the VMAX systems. This lets the probe collect and store data and information from the monitored components.
To register a resource:
1. Click the Create New Resources button.
The Register Resource dialog appears.
2. When finished, click the Test button.
The probe discovers all the VMAX systems connected to the server indicated by Solutions Enabler Service, and they are presented in the Connected Arrays list.
3. Click OK to save the Resource.
4. Click the Apply button, and restart the probe.
The Register Resource screen fields are:
Solutions Enabler Service Name
Enter the name of the Solutions Enabler Service Name. Enter localhost for locally connected VMAX systems.
Add One or More vmax Resources
Chapter 2: Initial Configuration 13
Alarm Message
Select the alarm message to be sent if the resource does not respond. Note that you can edit the message or define your own using the Message Pool Manager.
Default Group
Select the group you want the resource listed under. The default is All Resources.
Check Interval
Define how often you want the probe to check the values of the monitors.
Enabled
Check the box to enable monitoring for this resource.
Test button
Click the test button to verify the Solutions Enabler Service and display a list of VMAX systems in the Connected Arrays box.
Connected Arrays
Displays the VMAX systems available on this resource. This list is populated after you click the Test button. Every resource has a checkbox next to it. Select the checkboxes for the resources you want to monitor.
Copy Default AutoConfigs
This option allows you to quickly start using the probe with a default set of QOS metrics and Alarm thresholds applied to all the arrays discovered. The Default Auto Configurations template contains the metric and alarm monitors that are applied when the box is selected. You can create, tune, and apply other templates which contain metrics and alarm definitions. After selecting this option, the list of the default metrics and threshold settings can be seen in the AutoConfiguration node under each array.
Important! This option is selected when adding a new Resource. This option is turned off when editing an existing Resource.
The vmax Configuration Interface
14 vmax Guide
The vmax Configuration Interface
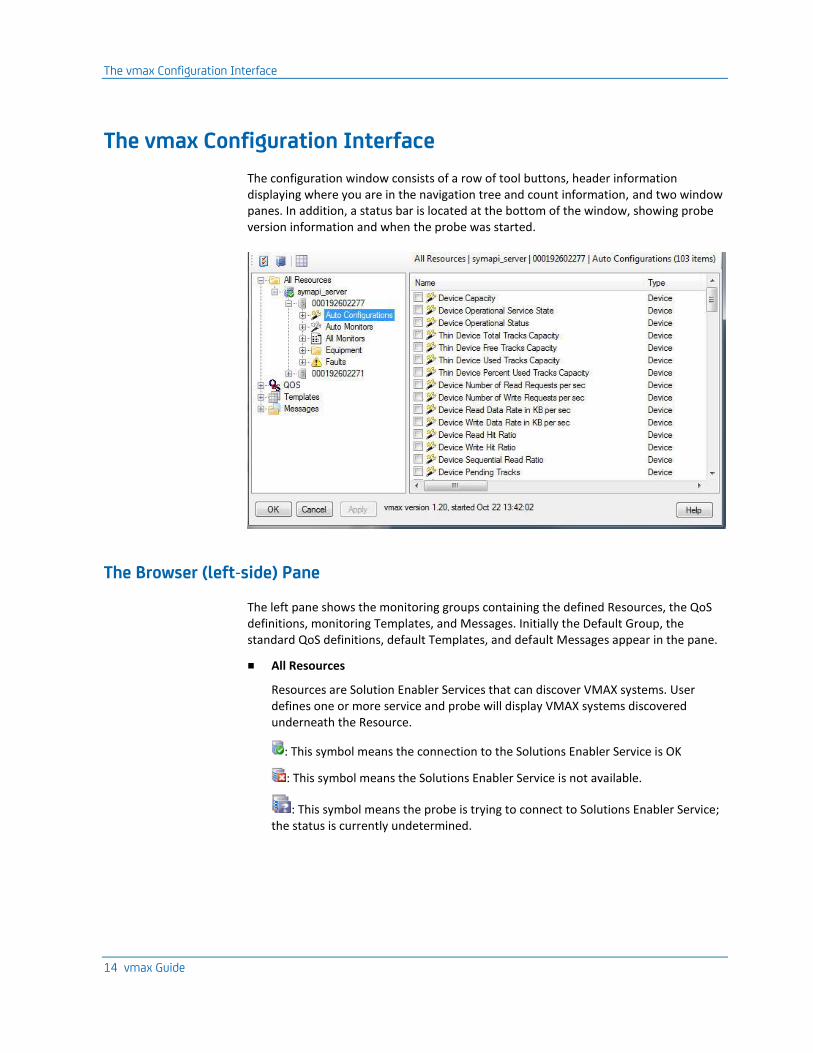
The configuration window consists of a row of tool buttons, header information displaying where you are in the navigation tree and count information, and two window panes. In addition, a status bar is located at the bottom of the window, showing probe version information and when the probe was started.
The Browser (left-side) Pane
The left pane shows the monitoring groups containing the defined Resources, the QoS definitions, monitoring Templates, and Messages. Initially the Default Group, the standard QoS definitions, default Templates, and default Messages appear in the pane.
■ All Resources
Resources are Solution Enabler Services that can discover VMAX systems. User defines one or more service and probe will display VMAX systems discovered underneath the Resource.
: This symbol means the connection to the Solutions Enabler Service is OK
: This symbol means the Solutions Enabler Service is not available.
: This symbol means the probe is trying to connect to Solutions Enabler Service; the status is currently undetermined.
The vmax Configuration Interface
Chapter 2: Initial Configuration 15
There are subordinate hierarchies under the VMAX system node:
■ The Auto Configurations hierarchy
One or more checkpoints (or templates) can be added to this node, using drag and drop to be used for auto configuring unmonitored devices. See the section Using Automatic Configurations for further information.
■ The Auto Monitors hierarchy
This node lists Auto Monitors, created for previously unmonitored devices, based on the contents added to the Auto Configuration node.
■ The All Monitors hierarchy
This node lists All Monitors, either defined by an auto configuration or manual creation.
■ The Equipment hierarchy
This node display equipment hierarchy in a VMAX system. User can drill down into various elements such as Directors, Disks, Device Pools, Devices and other physical elements of the VMAX system.
■ The Faults hierarchy
This node lists all alarms/faults raised in the VMAX system.
■ QOS
This hierarchy contains the standard QoS definitions included with the probe package. These can be selected when editing the monitoring properties for a monitor. To define your own QoS definitions, right-click the QoS node and choose New from the menu.
■ Templates
This hierarchy initially contains the following sample templates:
■ Device Monitors
■ Backend Device Monitors
■ Disk Monitors
■ Director Monitors
■ Port Monitors
■ Storage Pool Monitors
■ Extended Device Monitors
■ Messages
This hierarchy contains messages associated with each alarm. They are grouped by the types of alarms.
Managing Messages
16 vmax Guide
The Content (right-side) Pane
The right pane displays details about the item selected in the left pane, generally as a table.
Toolbar Buttons
There are three toolbar buttons:
The General Setup button opens probe settings dialog box. (See the Enter Probe Settings section)
The Create New Resource button opens the Register Resource dialog box (See the Add One or More vmax Resources section)
The Create New Template button opens new template dialog box. See the Using Templates section for further information about templates.
Managing Messages
The messages associated with each alarm are stored in the Messages hierarchy of the browser (left-side) pane. You can customize the alarm text, and you can create your own messages.
You can add or edit messages as follows:
■ To edit an existing message, double-click the message either in the hierarchy on the left or in the table on the right.
■ To create a new message, right-click an item under the Messages hierarchy, and choose New Message from the menu.
The Edit Message dialog appears. The fields are:
Identification Name
The name of the alarm that the message applies to
Error Alarm Text
The text of the message when the alarm is issued. See below for details.
Clear Alarm Text (OK)
The text of the message when the alarm is cleared. See below for details.
Error Severity
You can choose the severity of the alarm as appropriate for your situation.
Managing QoS Data and Alarms
Chapter 2: Initial Configuration 17
Subsystem string/id
You can define a custom subsystem ID for each message. See the help for the Nimsoft Alarm Server (NAS) for more information.
Note: You can use variables in the Error Alarm and Clear Alarm text to create a message that provides an operator with specific information about the condition.
Using variables is simple: as you type in the Alarm Text field, at the point where you want to use a variable, enter a dollar-sign ($). A dialog pops up with the following set of available variables:
■ $Source: The source where the alarm condition occurs.
■ $Monitor: The monitor (checkpoint) referred to in the alarm message.
■ $Descr: The description of the monitor.
■ $Key: The monitor key (normally the same as the name of the monitor).
■ $Value: The value used in the alarm message.
■ $Oper: The operand to be combined with the value and the threshold in the alarm message.
■ $Thr: The alarm threshold defined.
■ $Unit: The unit to be combined with the value in the alarm message (for example Boolean).
■ $Resource: The resource referred to in the alarm message.
Managing QoS Data and Alarms
You can display QoS definitions by clicking on the QoS node in the left pane. When you select it, all QoS definitions are displayed in the table in right pane.
You can add or edit QoS definitions as follows:
■ To edit an existing QoS definition, double-click on it either in the hierarchy on the left, or in the table on the right.
■ To define a new QoS definition, right-click the QoS node in the left pane and choose New QoS from the menu.
Either way, this action launches the QoS Definition dialog, which contains the following fields:
Name
The name of the QoS definition.
Adding Monitors to be Measured
18 vmax Guide
Group
The group the definition belongs to.
Description
Descriptive text about the QoS definition
Unit
The units of the measurement, fully spelled out.
Unit Abbreviation
A useful abbreviation for the units of the measurement.
Flag
This group lets you choose how the value is to be treated; choose one.
None
The value is a regular floating-point numeric, which can take any value.
Is Boolean
The value should be treated as a Boolean. A value of zero (0) is considered to be false, any other value is true.
Has Max
The value will not exceed the given maximum. This sets the maximum value on an axis when the value is graphed.
Adding Monitors to be Measured
There are three different ways to enable monitors to be measured vmax elements:
■ Manually selecting the monitors
This is done by navigating through the hierarchy appearing under resource node. When you select a folder in the hierarchy on the left, the monitors for it are listed on the right. Simply select the ones you want to monitor. See also the section Manually Selecting Monitors to be Measured.
■ Using templates
Templates are a useful for defining monitors to be measured on multiple VMAX systems. See the section Using Templates for further information.
■ Using Auto Configurations
Auto Configurations provide a powerful method for automatically adding monitors to be measured. "Auto Monitors" will be created when new devices come on line, with no need for you to reconfigure the vmax probe to monitor them.
Adding Monitors to be Measured
Chapter 2: Initial Configuration 19
Example: When new disks are added to the VMAX system, the Auto Configuration feature, if configured, creates Auto Monitor(s) for the new disks and automatically starts monitoring them. See the section Using Auto Configuration for further information.
Manually Selecting Monitors to be Measured
To select a monitor to be measured for a resource, simply select the resource in the left pane and browse the hierarchy appearing under the resource node. Select a folder in this hierarchy to list the associated monitors on the right. Then select the ones you want to monitor.
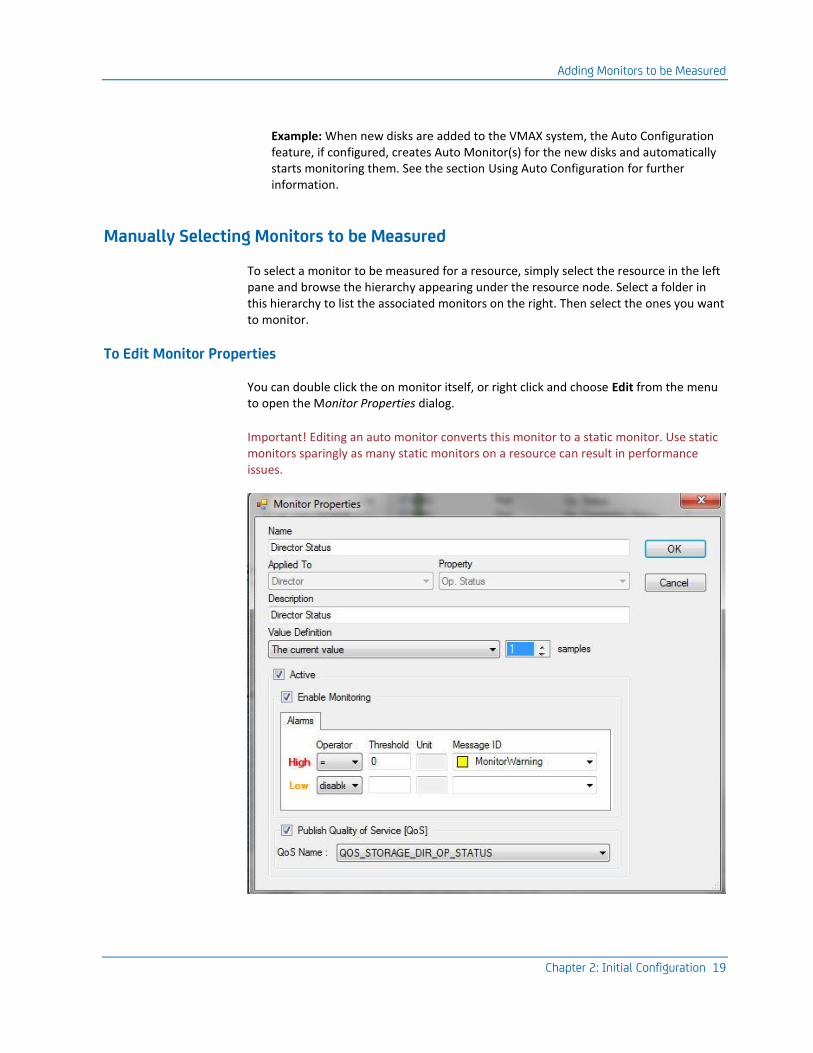
To Edit Monitor Properties
You can double click the on monitor itself, or right click and choose Edit from the menu to open the Monitor Properties dialog.
Important! Editing an auto monitor converts this monitor to a static monitor. Use static monitors sparingly as many static monitors on a resource can result in performance issues.
Adding Monitors to be Measured
20 vmax Guide
The fields are:
Name
The name of the monitor. You can modify this name.
Applied To
The type of devices being monitored.
Property
The specific property for the type displayed in the Applied To field.
Description
The description of the monitor. You can modify this description.
Value Definition
Select which value to be used. This value applies for both alarming and QoS.
You have the following options:
■ The current value. The current value measured will be used.
■ The average value last. The average of the last and current sample: (current + previous) / 2.
■ Number of samples
Active
This activates the monitoring and quality of service options for this probe. You can choose to enable monitoring, publish quality of service or both.
Enable Monitoring
Activates the monitoring.
Note: The monitor will also be selected in the list of monitors in the right window pane when this option is selected, and that you can enable/disable monitoring of the checkpoint from that list.
Alarms tab
Defines the alarm properties for the monitor. You can define both a high and a low threshold.
Initially the high threshold is set to a default value. Set this value to match your needs.
The low threshold is initially disabled. Select an operator from the list and configure it to match your needs.
Adding Monitors to be Measured
Chapter 2: Initial Configuration 21
Operator
Select the appropriate operator from the drop-down list. Typically, exact equalities are not useful for values that vary with time.
Example: => 90 means alarm condition if the measured value is above 90. = 90 means alarm condition if the measured value is exactly 90.
Threshold
Enter the alarm threshold value. An alarm message will be sent if this threshold is exceeded.
Unit
Displays the unit of the monitored value. Example: % or Mbytes. The field is read-only.
Message ID
Select the alarm message to be issued if the specified threshold value is breached. These messages are kept in the message pool. The messages can be modified as noted in the Managing Messages section.
Publish Quality of Service
Select this option if you want QoS messages to be issued on the monitor.
QoS Name
Select the name to be used on the QoS message issued.
Using Templates
Templates let you define a reusable set of monitors for multiple components.
You can create various templates and define a set of monitors belonging to each. You can then apply these templates to any specific resource in the Resources hierarchy in the browser pane by dragging the template to the appropriate item and dropping it there.
The vmax probe contains the following default templates:
■ Device Monitors
■ Backend Device Monitors
■ Disk Monitors
■ Port Monitors
■ Storage Pool Monitors
■ Extended Device Monitors
Adding Monitors to be Measured
22 vmax Guide
To Create a Template
There are two ways to create a template:
■ Click the toolbar button for New Template ( ).
■ Right click the Templates node in the browser pane, and choose New Template from the menu.
In the resulting Template Properties dialog, specify a Name and a Description for the new template.
Note that you can also edit an existing template: Select one of the templates defined under the Templates node in the browser (left-side) pane, right-click it, and select Edit from the menu.
To Add Monitors to the Template
To add a monitor (checkpoint) to a template, drag it from the right pane and drop it on the template in the left pane.
You can then edit the properties for the monitors in the template, as described in the To Edit Monitor Properties section.
To Apply a Template to a VMAX system
Drag and drop the template onto the VMAX system in the Resources hierarchy. This assigns the monitors defined in template to the corresponding vmax components.
Using Auto Configurations
Auto configurations provide a powerful way to apply monitors to objects by their type. You make an auto configuration by changing the Apply To selector in Monitor Property Dialog (see the To Edit Monitor Properties section for details).
Open the Auto Configurations hierarchy under the vmax system to list all auto configurations that are currently applied to that array.
You can add or edit Auto Configurations as follows:
■ To edit an existing Auto Configuration, double-click it either in the hierarchy on the left or in the table on the right and choose Edit from the menu.
■ To define a new Auto Configuration, right click the Auto Configuration node in the left pane, and choose New Auto Configuration from the menu.
Either way, this action launches the Monitor Properties dialog. For details about this dialog, see the To Edit Monitor Properties section.

Adding Monitors to be Measured
Chapter 2: Initial Configuration 23
This dialog lets you define auto configurations for any type of object.
Note: Dragging a static monitor onto the Auto Configurations node in the navigation tree will create an auto configuration. However, the static monitor still exists.

Chapter 3: vmax Advanced Configuration 25
Chapter 3: vmax Advanced Configuration
This section contains advanced configuration options for the vmax probe.
Optimizing Concurrent Data Collection
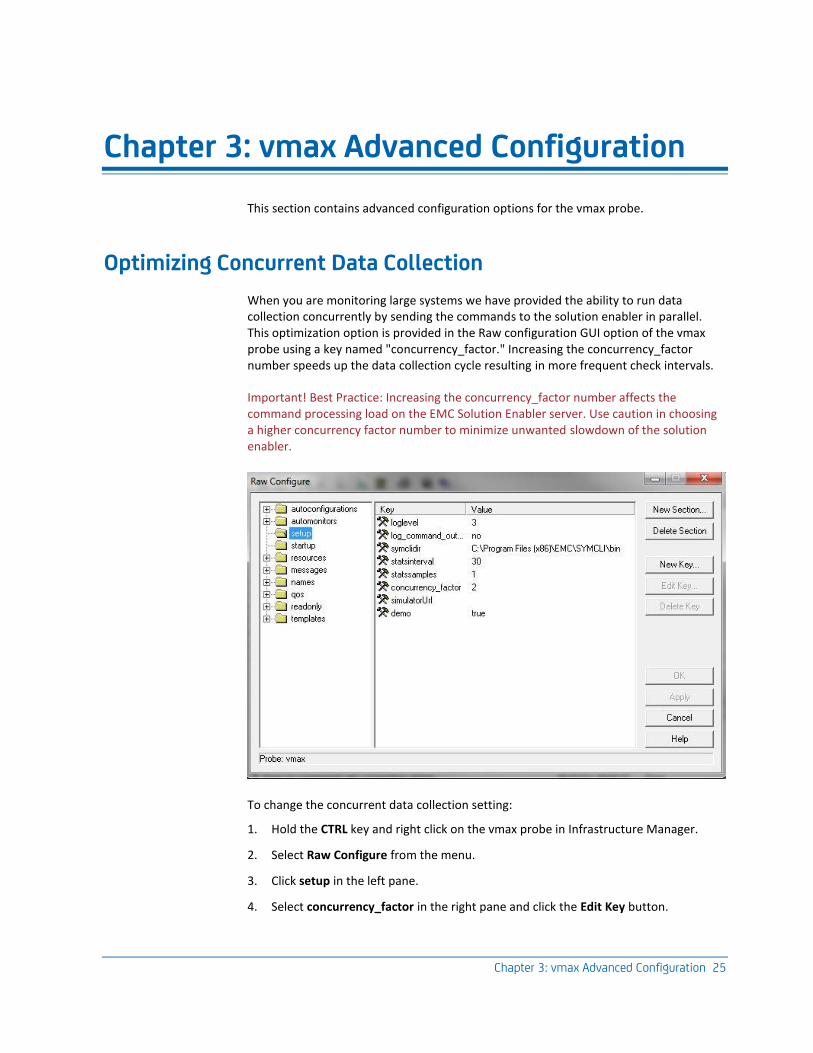
When you are monitoring large systems we have provided the ability to run data collection concurrently by sending the commands to the solution enabler in parallel. This optimization option is provided in the Raw configuration GUI option of the vmax probe using a key named "concurrency_factor." Increasing the concurrency_factor number speeds up the data collection cycle resulting in more frequent check intervals.
Important! Best Practice: Increasing the concurrency_factor number affects the command processing load on the EMC Solution Enabler server. Use caution in choosing a higher concurrency factor number to minimize unwanted slowdown of the solution enabler.
To change the concurrent data collection setting:
1. Hold the CTRL key and right click on the vmax probe in Infrastructure Manager.
2. Select Raw Configure from the menu.
3. Click setup in the left pane.
4. Select concurrency_factor in the right pane and click the Edit Key button.
Vmax Event to Nimsoft Alarm Configuration
26 vmax Guide
5. Enter the new value and click OK.
The default value is 2 which allows 2 parallel run threads to send commands to each array.
6. Restart the probe to implement the changes.
Vmax Event to Nimsoft Alarm Configuration
Vmax array captures all events with various severity from Information to Errors. The vmax probe enables you to route the latest precaptured events to Nimsoft Alarms based on global routing filtering setting in the probe. Recent events show up under each array below the Faults tab in the configuration client. The severity of events to be forwarded as alarms can be set using the raw configuration probe GUI option by adding a key named "level_of_events_to_forward_as_alarms."
Note: This is a global setting per resource (solution enabler domain) and will apply to all arrays discovered in that solution enabler resource/domain.
To set up vmax event to Nimsoft alarm configuration:
1. Hold the CTRL key and right click on the vmax probe in Infrastructure Manager.
2. Select Raw Configure from the menu.
3. Click setup in the left pane.
4. Select level_of_events_to_forward_as_alarms in the right pane and click the Edit Key button.
5. Enter the new value and click Ok.
Valid values are:
■ 0 - No events will be forwarded as alarms
■ 1 - Only fatal events will be forwarded as alarms
■ 2 - Error and fatal events will be forwarded as alarms
■ 3 - Warnings, errors, and fatal events will be forwarded as alarms
■ 4 - All events will be forwarded as alarms, including informational.
The default value is 3.
6. Restart the probe to implement the changes.
Chapter 4: QoS Threshold Metrics 27
Chapter 4: QoS Threshold Metrics
Many Nimsoft Monitor probes ship with default QoS threshold values set. The default threshold values provide an idea of the type of values to be entered in the fields and are not necessarily recommended best practice values. To aid in tuning thresholds and reducing false-positive alarms, this section describes the QoS metrics and provides the default QoS thresholds.
This section contains the following topics:
vmax Metrics (see page 27)
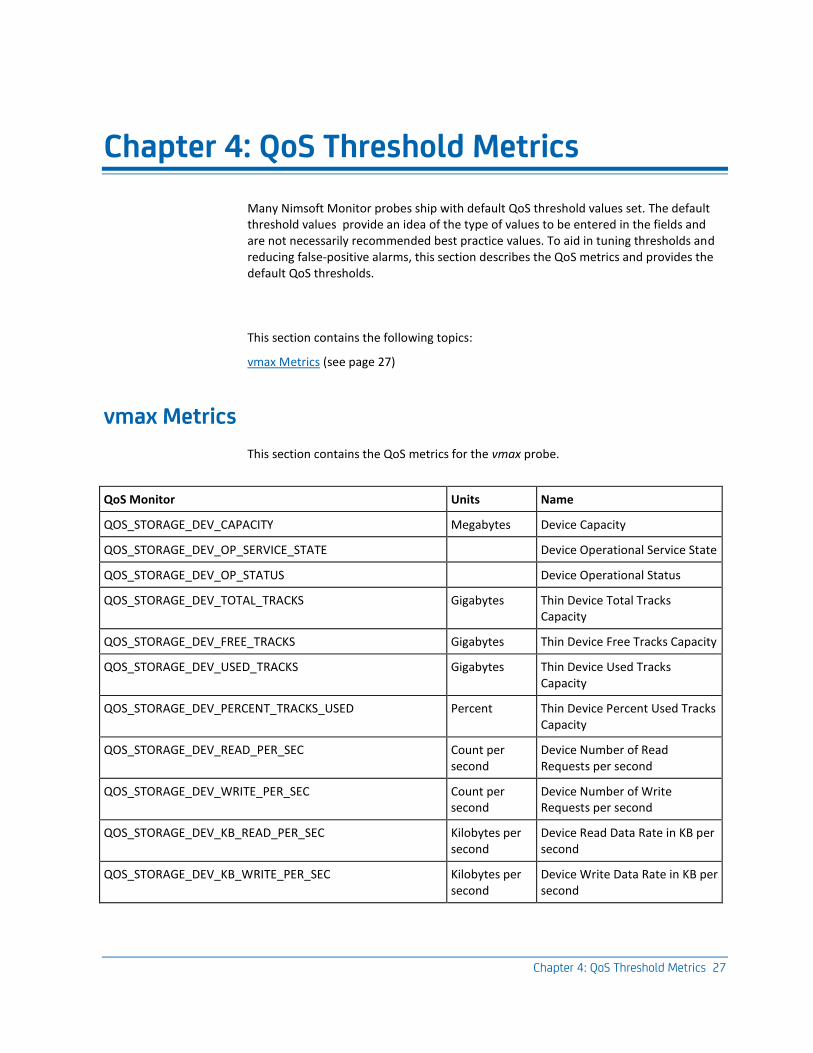
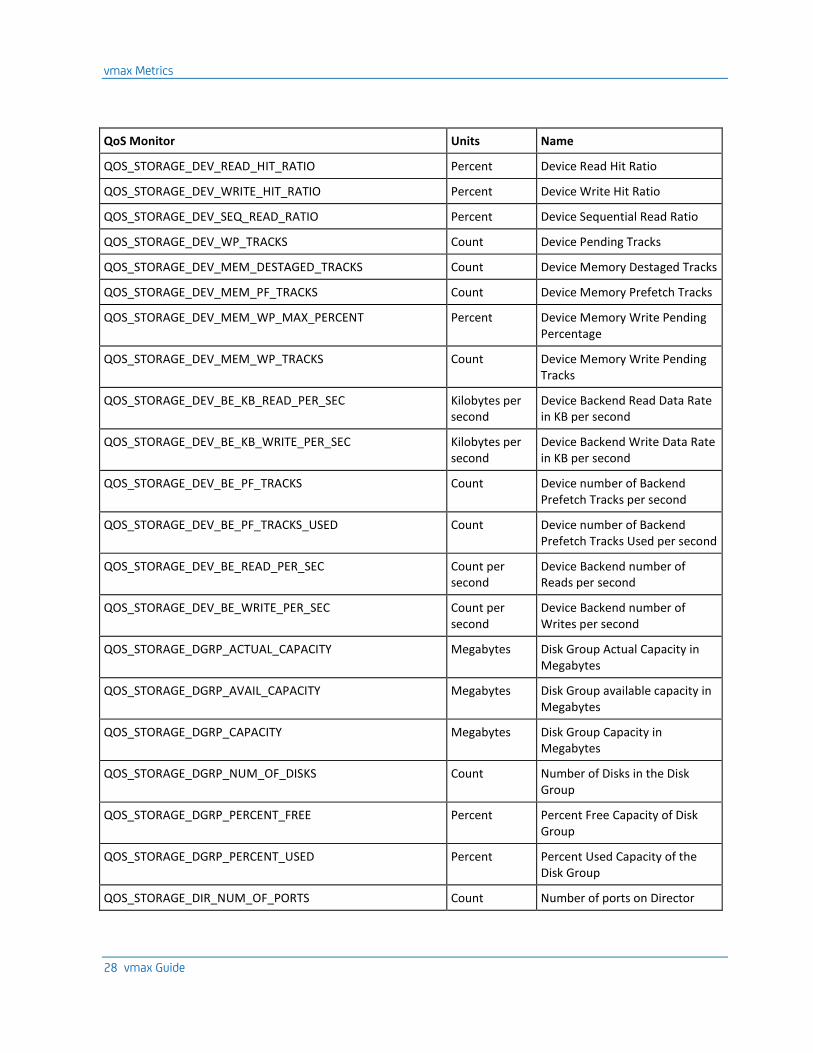
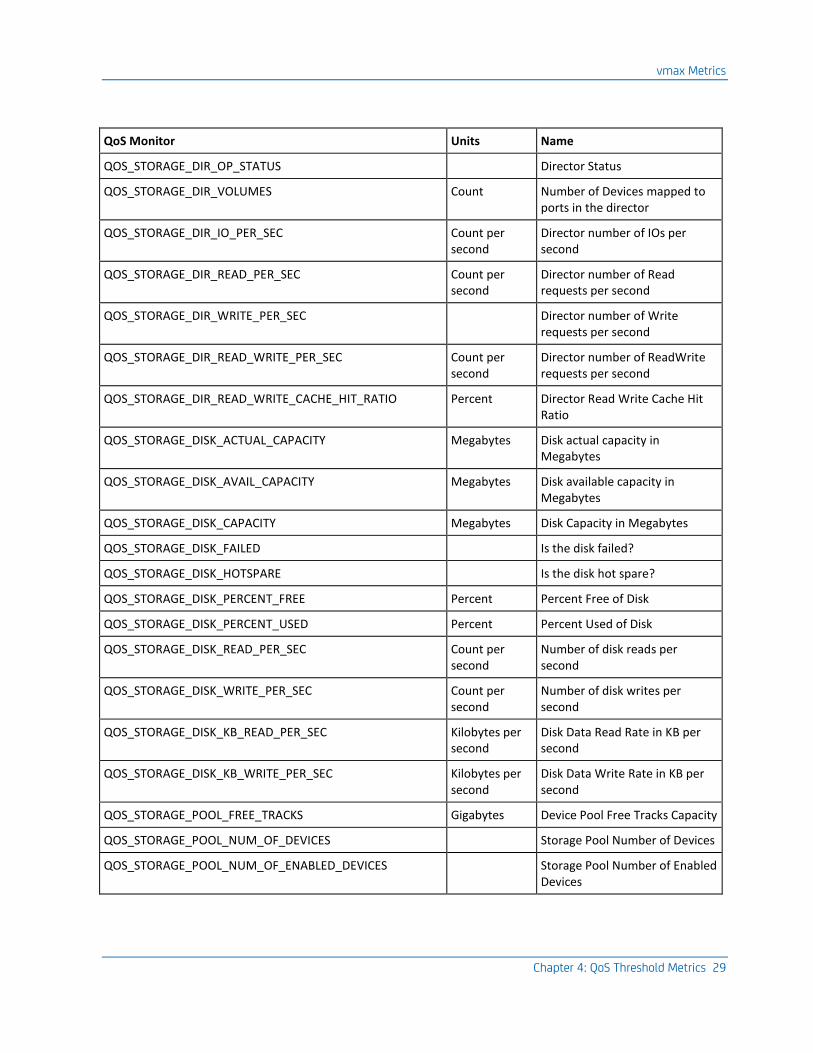
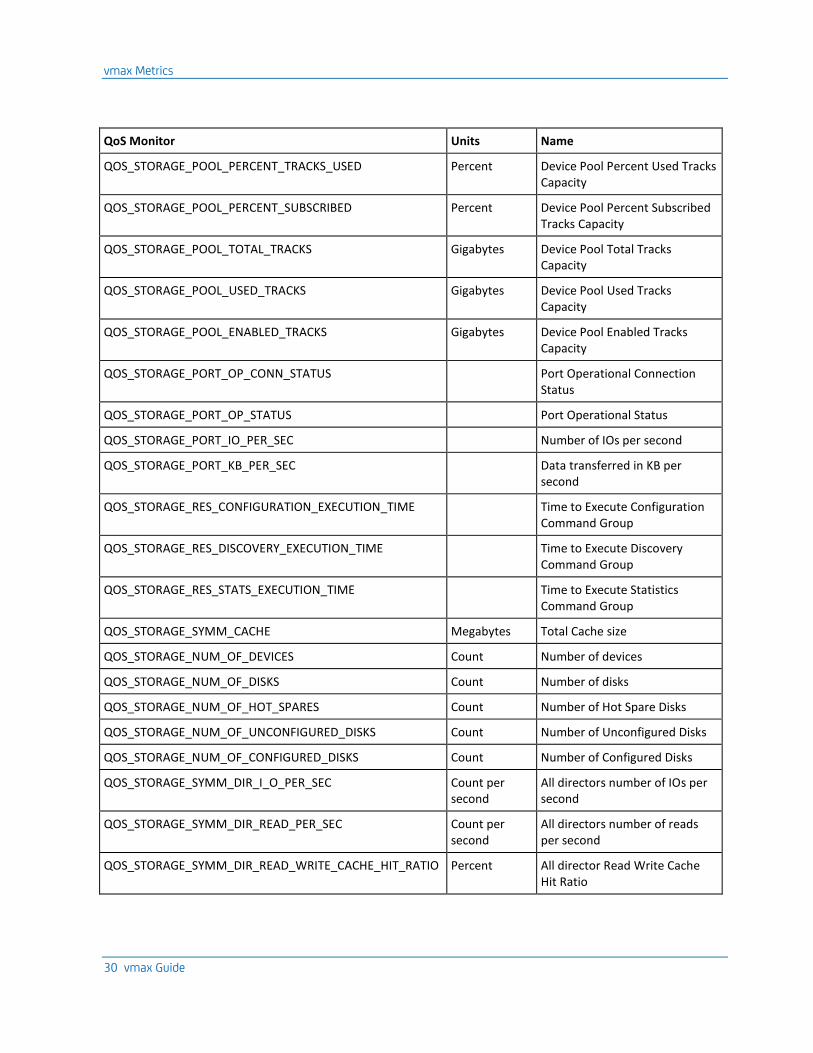
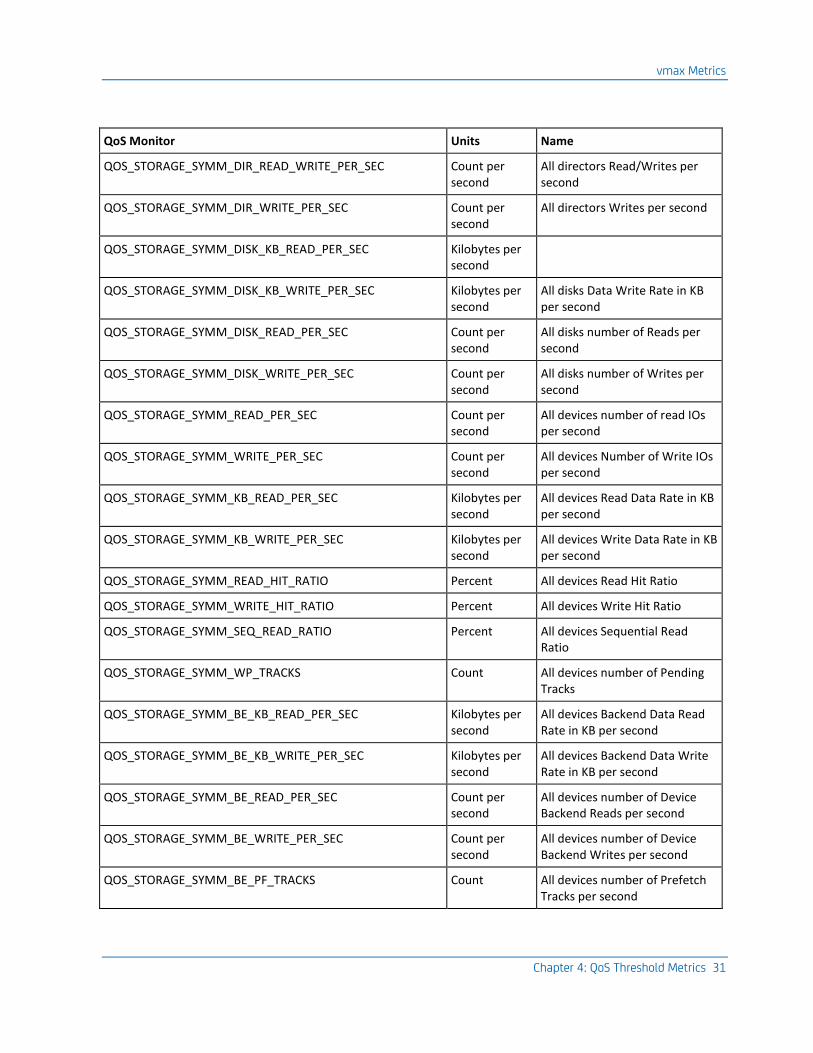
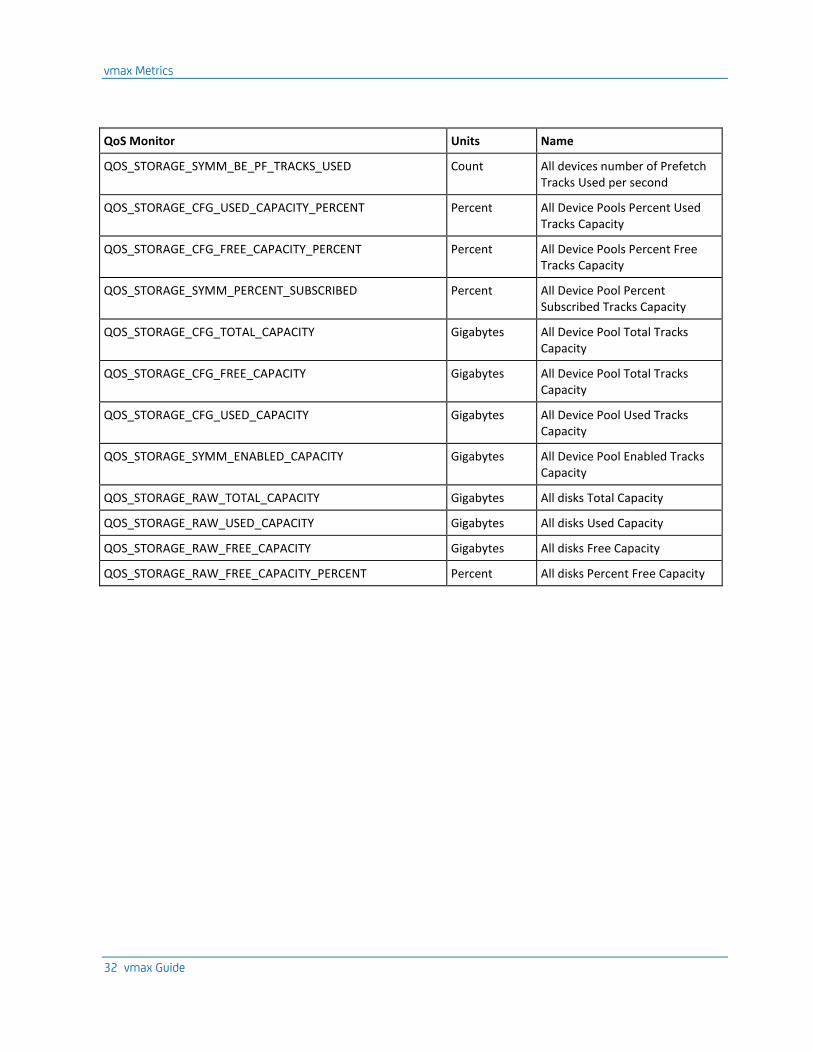
vmax Metrics
This section contains the QoS metrics for the vmax probe.
QoS Monitor Units Name
QOS_STORAGE_DEV_CAPACITY Megabytes Device Capacity
QOS_STORAGE_DEV_OP_SERVICE_STATE Device Operational Service State
QOS_STORAGE_DEV_OP_STATUS Device Operational Status
QOS_STORAGE_DEV_TOTAL_TRACKS Gigabytes Thin Device Total Tracks Capacity
QOS_STORAGE_DEV_FREE_TRACKS Gigabytes Thin Device Free Tracks Capacity
QOS_STORAGE_DEV_USED_TRACKS Gigabytes Thin Device Used Tracks Capacity
QOS_STORAGE_DEV_PERCENT_TRACKS_USED Percent Thin Device Percent Used Tracks Capacity
QOS_STORAGE_DEV_READ_PER_SEC Count per second
Device Number of Read Requests per second
QOS_STORAGE_DEV_WRITE_PER_SEC Count per second
Device Number of Write Requests per second
QOS_STORAGE_DEV_KB_READ_PER_SEC Kilobytes per second
Device Read Data Rate in KB per second
QOS_STORAGE_DEV_KB_WRITE_PER_SEC Kilobytes per second
Device Write Data Rate in KB per second
vmax Metrics
28 vmax Guide
QoS Monitor Units Name
QOS_STORAGE_DEV_READ_HIT_RATIO Percent Device Read Hit Ratio
QOS_STORAGE_DEV_WRITE_HIT_RATIO Percent Device Write Hit Ratio
QOS_STORAGE_DEV_SEQ_READ_RATIO Percent Device Sequential Read Ratio
QOS_STORAGE_DEV_WP_TRACKS Count Device Pending Tracks
QOS_STORAGE_DEV_MEM_DESTAGED_TRACKS Count Device Memory Destaged Tracks
QOS_STORAGE_DEV_MEM_PF_TRACKS Count Device Memory Prefetch Tracks
QOS_STORAGE_DEV_MEM_WP_MAX_PERCENT Percent Device Memory Write Pending Percentage
QOS_STORAGE_DEV_MEM_WP_TRACKS Count Device Memory Write Pending Tracks
QOS_STORAGE_DEV_BE_KB_READ_PER_SEC Kilobytes per second
Device Backend Read Data Rate in KB per second
QOS_STORAGE_DEV_BE_KB_WRITE_PER_SEC Kilobytes per second
Device Backend Write Data Rate in KB per second
QOS_STORAGE_DEV_BE_PF_TRACKS Count Device number of Backend Prefetch Tracks per second
QOS_STORAGE_DEV_BE_PF_TRACKS_USED Count Device number of Backend Prefetch Tracks Used per second
QOS_STORAGE_DEV_BE_READ_PER_SEC Count per second
Device Backend number of Reads per second
QOS_STORAGE_DEV_BE_WRITE_PER_SEC Count per second
Device Backend number of Writes per second
QOS_STORAGE_DGRP_ACTUAL_CAPACITY Megabytes Disk Group Actual Capacity in Megabytes
QOS_STORAGE_DGRP_AVAIL_CAPACITY Megabytes Disk Group available capacity in Megabytes
QOS_STORAGE_DGRP_CAPACITY Megabytes Disk Group Capacity in Megabytes
QOS_STORAGE_DGRP_NUM_OF_DISKS Count Number of Disks in the Disk Group
QOS_STORAGE_DGRP_PERCENT_FREE Percent Percent Free Capacity of Disk Group
QOS_STORAGE_DGRP_PERCENT_USED Percent Percent Used Capacity of the Disk Group
QOS_STORAGE_DIR_NUM_OF_PORTS Count Number of ports on Director
vmax Metrics
Chapter 4: QoS Threshold Metrics 29
QoS Monitor Units Name
QOS_STORAGE_DIR_OP_STATUS Director Status
QOS_STORAGE_DIR_VOLUMES Count Number of Devices mapped to ports in the director
QOS_STORAGE_DIR_IO_PER_SEC Count per second
Director number of IOs per second
QOS_STORAGE_DIR_READ_PER_SEC Count per second
Director number of Read requests per second
QOS_STORAGE_DIR_WRITE_PER_SEC Director number of Write requests per second
QOS_STORAGE_DIR_READ_WRITE_PER_SEC Count per second
Director number of ReadWrite requests per second
QOS_STORAGE_DIR_READ_WRITE_CACHE_HIT_RATIO Percent Director Read Write Cache Hit Ratio
QOS_STORAGE_DISK_ACTUAL_CAPACITY Megabytes Disk actual capacity in Megabytes
QOS_STORAGE_DISK_AVAIL_CAPACITY Megabytes Disk available capacity in Megabytes
QOS_STORAGE_DISK_CAPACITY Megabytes Disk Capacity in Megabytes
QOS_STORAGE_DISK_FAILED Is the disk failed?
QOS_STORAGE_DISK_HOTSPARE Is the disk hot spare?
QOS_STORAGE_DISK_PERCENT_FREE Percent Percent Free of Disk
QOS_STORAGE_DISK_PERCENT_USED Percent Percent Used of Disk
QOS_STORAGE_DISK_READ_PER_SEC Count per second
Number of disk reads per second
QOS_STORAGE_DISK_WRITE_PER_SEC Count per second
Number of disk writes per second
QOS_STORAGE_DISK_KB_READ_PER_SEC Kilobytes per second
Disk Data Read Rate in KB per second
QOS_STORAGE_DISK_KB_WRITE_PER_SEC Kilobytes per second
Disk Data Write Rate in KB per second
QOS_STORAGE_POOL_FREE_TRACKS Gigabytes Device Pool Free Tracks Capacity
QOS_STORAGE_POOL_NUM_OF_DEVICES Storage Pool Number of Devices
QOS_STORAGE_POOL_NUM_OF_ENABLED_DEVICES Storage Pool Number of Enabled Devices
vmax Metrics
30 vmax Guide
QoS Monitor Units Name
QOS_STORAGE_POOL_PERCENT_TRACKS_USED Percent Device Pool Percent Used Tracks Capacity
QOS_STORAGE_POOL_PERCENT_SUBSCRIBED Percent Device Pool Percent Subscribed Tracks Capacity
QOS_STORAGE_POOL_TOTAL_TRACKS Gigabytes Device Pool Total Tracks Capacity
QOS_STORAGE_POOL_USED_TRACKS Gigabytes Device Pool Used Tracks Capacity
QOS_STORAGE_POOL_ENABLED_TRACKS Gigabytes Device Pool Enabled Tracks Capacity
QOS_STORAGE_PORT_OP_CONN_STATUS Port Operational Connection Status
QOS_STORAGE_PORT_OP_STATUS Port Operational Status
QOS_STORAGE_PORT_IO_PER_SEC Number of IOs per second
QOS_STORAGE_PORT_KB_PER_SEC Data transferred in KB per second
QOS_STORAGE_RES_CONFIGURATION_EXECUTION_TIME Time to Execute Configuration Command Group
QOS_STORAGE_RES_DISCOVERY_EXECUTION_TIME Time to Execute Discovery Command Group
QOS_STORAGE_RES_STATS_EXECUTION_TIME Time to Execute Statistics Command Group
QOS_STORAGE_SYMM_CACHE Megabytes Total Cache size
QOS_STORAGE_NUM_OF_DEVICES Count Number of devices
QOS_STORAGE_NUM_OF_DISKS Count Number of disks
QOS_STORAGE_NUM_OF_HOT_SPARES Count Number of Hot Spare Disks
QOS_STORAGE_NUM_OF_UNCONFIGURED_DISKS Count Number of Unconfigured Disks
QOS_STORAGE_NUM_OF_CONFIGURED_DISKS Count Number of Configured Disks
QOS_STORAGE_SYMM_DIR_I_O_PER_SEC Count per second
All directors number of IOs per second
QOS_STORAGE_SYMM_DIR_READ_PER_SEC Count per second
All directors number of reads per second
QOS_STORAGE_SYMM_DIR_READ_WRITE_CACHE_HIT_RATIO Percent All director Read Write Cache Hit Ratio
vmax Metrics
Chapter 4: QoS Threshold Metrics 31
QoS Monitor Units Name
QOS_STORAGE_SYMM_DIR_READ_WRITE_PER_SEC Count per second
All directors Read/Writes per second
QOS_STORAGE_SYMM_DIR_WRITE_PER_SEC Count per second
All directors Writes per second
QOS_STORAGE_SYMM_DISK_KB_READ_PER_SEC Kilobytes per second
QOS_STORAGE_SYMM_DISK_KB_WRITE_PER_SEC Kilobytes per second
All disks Data Write Rate in KB per second
QOS_STORAGE_SYMM_DISK_READ_PER_SEC Count per second
All disks number of Reads per second
QOS_STORAGE_SYMM_DISK_WRITE_PER_SEC Count per second
All disks number of Writes per second
QOS_STORAGE_SYMM_READ_PER_SEC Count per second
All devices number of read IOs per second
QOS_STORAGE_SYMM_WRITE_PER_SEC Count per second
All devices Number of Write IOs per second
QOS_STORAGE_SYMM_KB_READ_PER_SEC Kilobytes per second
All devices Read Data Rate in KB per second
QOS_STORAGE_SYMM_KB_WRITE_PER_SEC Kilobytes per second
All devices Write Data Rate in KB per second
QOS_STORAGE_SYMM_READ_HIT_RATIO Percent All devices Read Hit Ratio
QOS_STORAGE_SYMM_WRITE_HIT_RATIO Percent All devices Write Hit Ratio
QOS_STORAGE_SYMM_SEQ_READ_RATIO Percent All devices Sequential Read Ratio
QOS_STORAGE_SYMM_WP_TRACKS Count All devices number of Pending Tracks
QOS_STORAGE_SYMM_BE_KB_READ_PER_SEC Kilobytes per second
All devices Backend Data Read Rate in KB per second
QOS_STORAGE_SYMM_BE_KB_WRITE_PER_SEC Kilobytes per second
All devices Backend Data Write Rate in KB per second
QOS_STORAGE_SYMM_BE_READ_PER_SEC Count per second
All devices number of Device Backend Reads per second
QOS_STORAGE_SYMM_BE_WRITE_PER_SEC Count per second
All devices number of Device Backend Writes per second
QOS_STORAGE_SYMM_BE_PF_TRACKS Count All devices number of Prefetch Tracks per second
vmax Metrics
32 vmax Guide
QoS Monitor Units Name
QOS_STORAGE_SYMM_BE_PF_TRACKS_USED Count All devices number of Prefetch Tracks Used per second
QOS_STORAGE_CFG_USED_CAPACITY_PERCENT Percent All Device Pools Percent Used Tracks Capacity
QOS_STORAGE_CFG_FREE_CAPACITY_PERCENT Percent All Device Pools Percent Free Tracks Capacity
QOS_STORAGE_SYMM_PERCENT_SUBSCRIBED Percent All Device Pool Percent Subscribed Tracks Capacity
QOS_STORAGE_CFG_TOTAL_CAPACITY Gigabytes All Device Pool Total Tracks Capacity
QOS_STORAGE_CFG_FREE_CAPACITY Gigabytes All Device Pool Total Tracks Capacity
QOS_STORAGE_CFG_USED_CAPACITY Gigabytes All Device Pool Used Tracks Capacity
QOS_STORAGE_SYMM_ENABLED_CAPACITY Gigabytes All Device Pool Enabled Tracks Capacity
QOS_STORAGE_RAW_TOTAL_CAPACITY Gigabytes All disks Total Capacity
QOS_STORAGE_RAW_USED_CAPACITY Gigabytes All disks Used Capacity
QOS_STORAGE_RAW_FREE_CAPACITY Gigabytes All disks Free Capacity
QOS_STORAGE_RAW_FREE_CAPACITY_PERCENT Percent All disks Percent Free Capacity