Embed Size (px)
Citation preview
Nine Month Report 2016BoKlok Lingonriset, Huddinge, Sweden
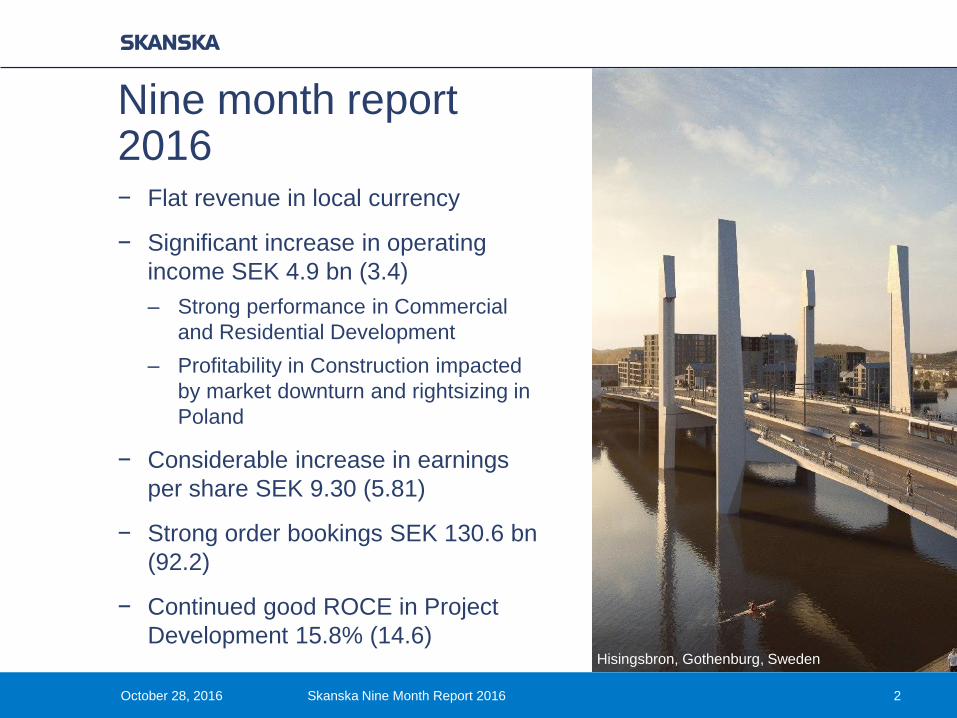
− Flat revenue in local currency
− Significant increase in operating
income SEK 4.9 bn (3.4)
– Strong performance in Commercial
and Residential Development
– Profitability in Construction impacted
by market downturn and rightsizing in
Poland
− Considerable increase in earnings
per share SEK 9.30 (5.81)
− Strong order bookings SEK 130.6 bn
(92.2)
− Continued good ROCE in Project
Development 15.8% (14.6)Hisingsbron, Gothenburg, Sweden
October 28, 2016 Skanska Nine Month Report 2016 2
Nine month report2016
− Invest, develop, market, sell and
aftermarket
− Operations in the Nordics, Prague
and Warsaw
− Pre-sale level typically 40% before
project launch
− Construction time between 10-30
months
− 3,875 homes started and 4,036 sold,
R-12. 6,680 ongoing end of period
− Two product offers
– Homes by Skanska
– BoKlok
October 28, 2016 Skanska Nine Month Report 2016 3
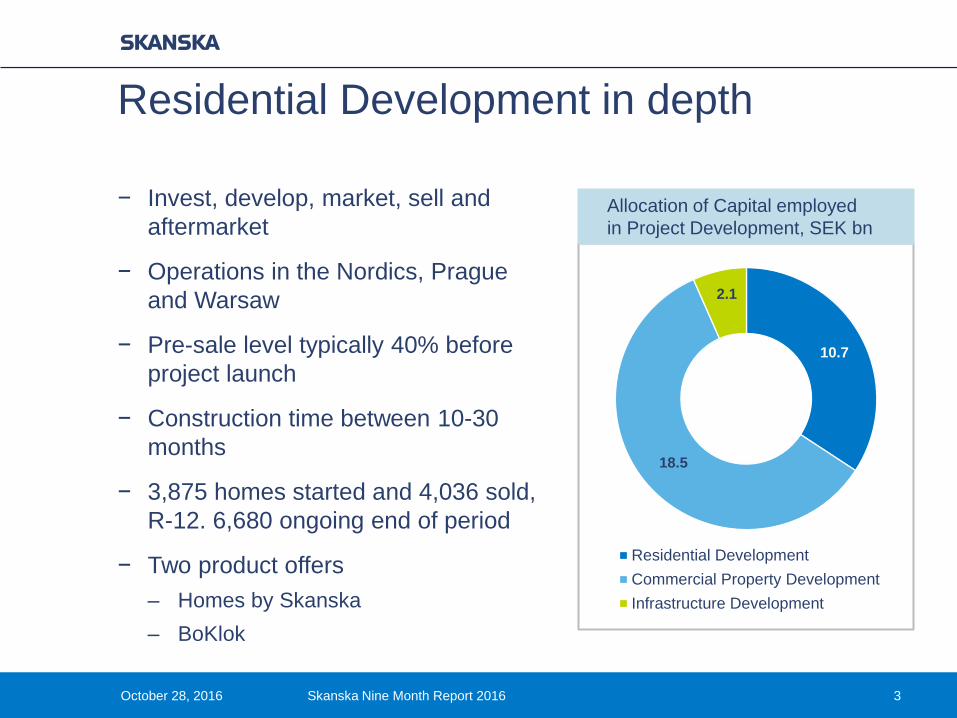
Residential Development in depth
10.7
18.5
2.1
Residential Development
Commercial Property Development
Infrastructure Development
Allocation of Capital employed
in Project Development, SEK bn
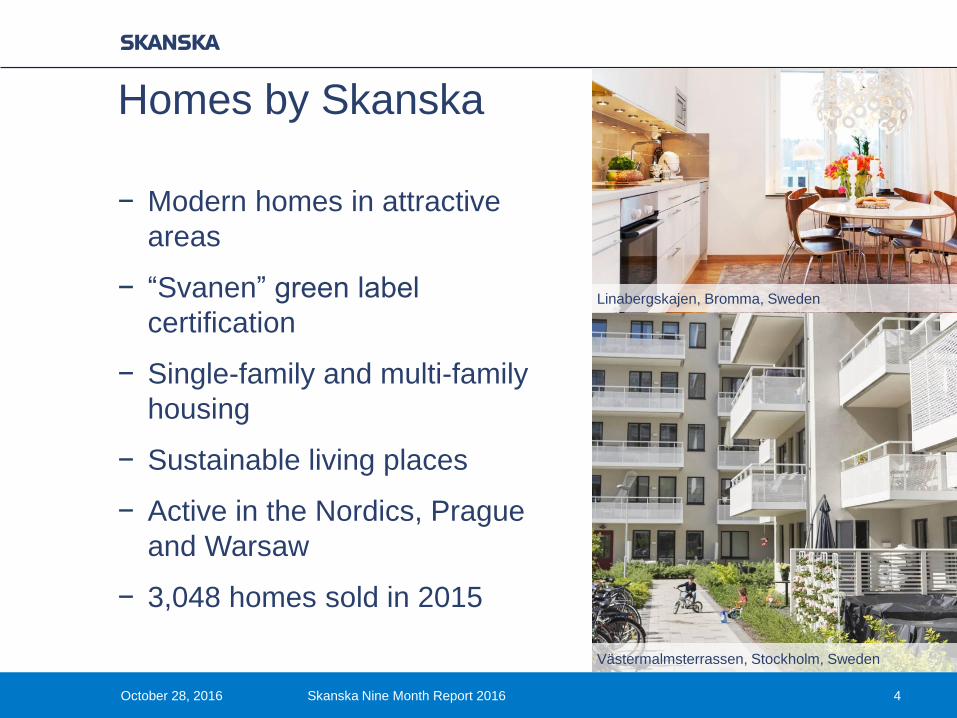
− Modern homes in attractive
areas
− “Svanen” green label
certification
− Single-family and multi-family
housing
− Sustainable living places
− Active in the Nordics, Prague
and Warsaw
− 3,048 homes sold in 2015
October 28, 2016 Skanska Nine Month Report 2016 4
Homes by Skanska
Västermalmsterrassen, Stockholm, Sweden
Linabergskajen, Bromma, Sweden
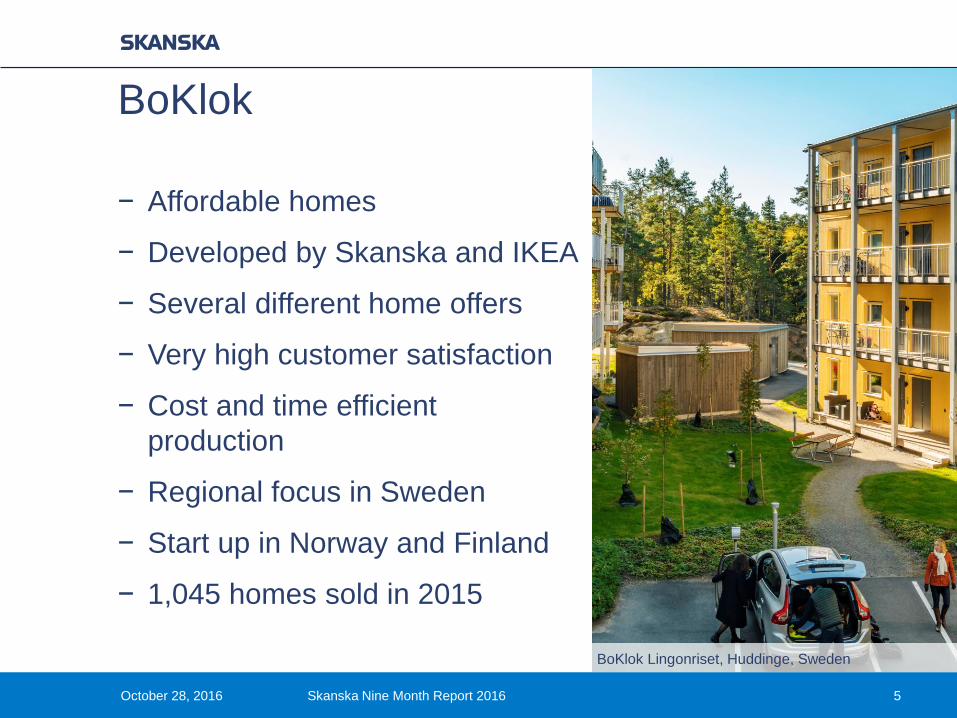
− Affordable homes
− Developed by Skanska and IKEA
− Several different home offers
− Very high customer satisfaction
− Cost and time efficient
production
− Regional focus in Sweden
− Start up in Norway and Finland
− 1,045 homes sold in 2015
BoKlok Lingonriset, Huddinge, Sweden
October 28, 2016 Skanska Nine Month Report 2016 5
BoKlok
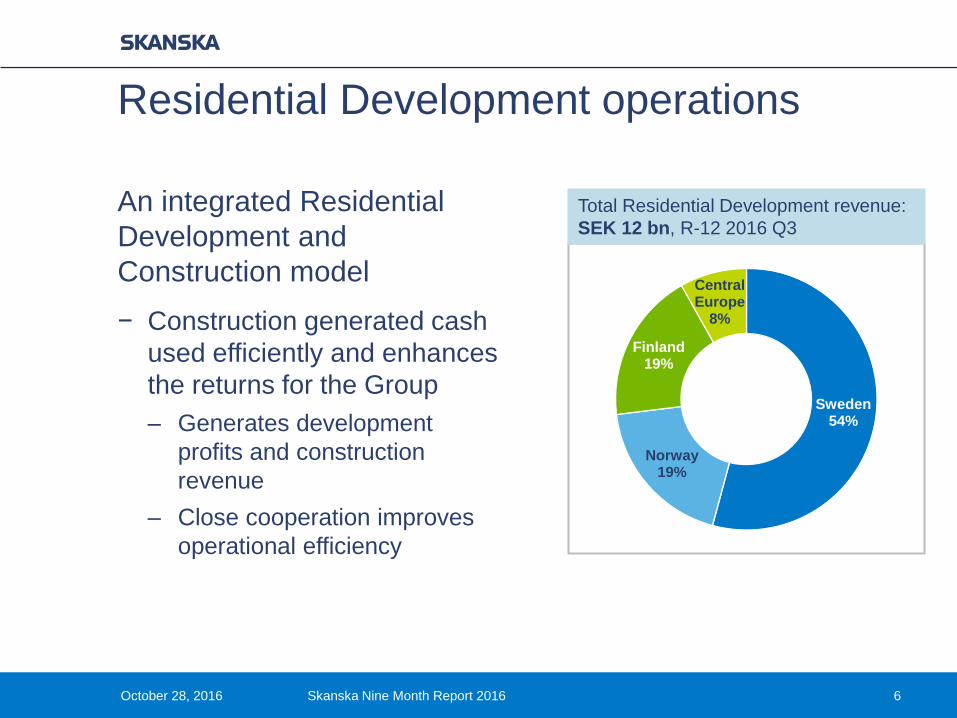
An integrated Residential
Development and
Construction model
− Construction generated cash
used efficiently and enhances
the returns for the Group
– Generates development
profits and construction
revenue
– Close cooperation improves
operational efficiency
October 28, 2016 Skanska Nine Month Report 2016 6
Residential Development operations
Total Residential Development revenue:
SEK 12 bn, R-12 2016 Q3
Sweden54%
Norway19%
Finland19%
Central Europe
8%
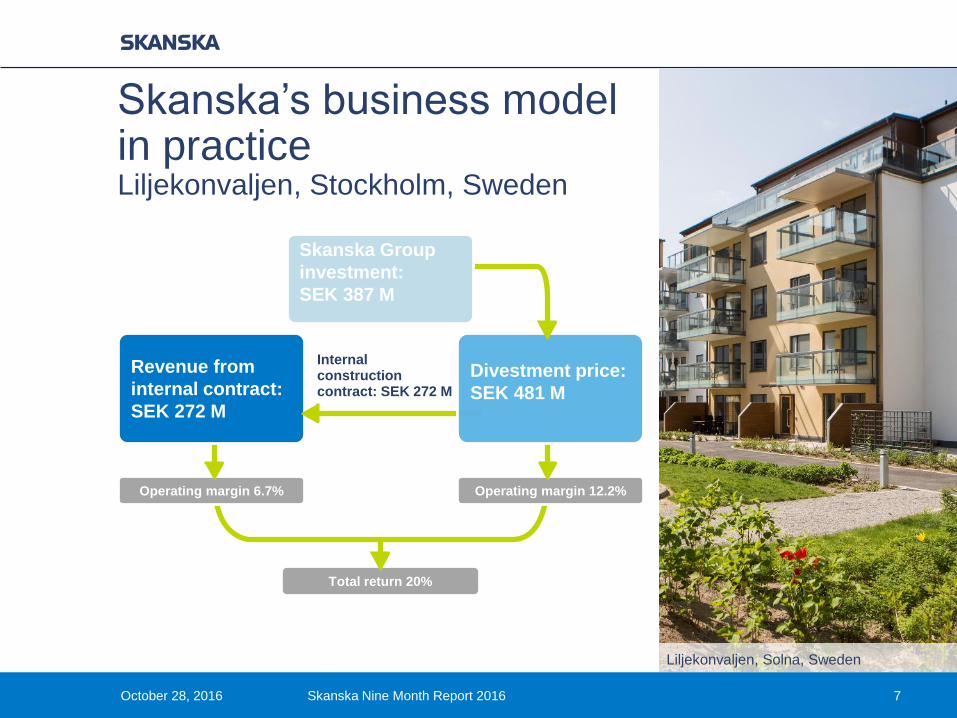
Total return 20%
7
Skanska’s business model in practiceLiljekonvaljen, Stockholm, Sweden
Total investment:
SEK 387 M
Internalconstruction contract: SEK 272 M
Revenue from
internal contract:
SEK 272 M
Divestment price:
SEK 481 M
Operating margin 6.7% Operating margin 12.2%
October 28, 2016 Skanska Nine Month Report 2016
Liljekonvaljen, Solna, Sweden
Skanska Group
investment:
SEK 387 M
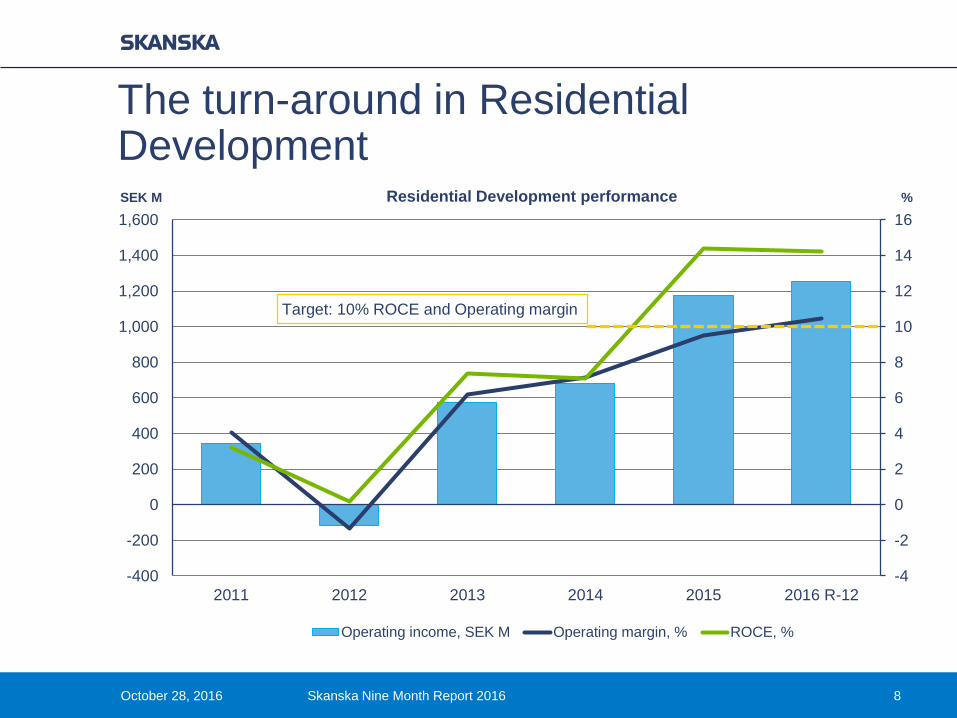
-4
-2
0
2
4
6
8
10
12
14
16
-400
-200
0
200
400
600
800
1,000
1,200
1,400
1,600
2011 2012 2013 2014 2015 2016 R-12
Operating income, SEK M Operating margin, % ROCE, %
Target: 10% ROCE and Operating margin
October 28, 2016 Skanska Nine Month Report 2016 8
The turn-around in Residential DevelopmentSEK M %Residential Development performance
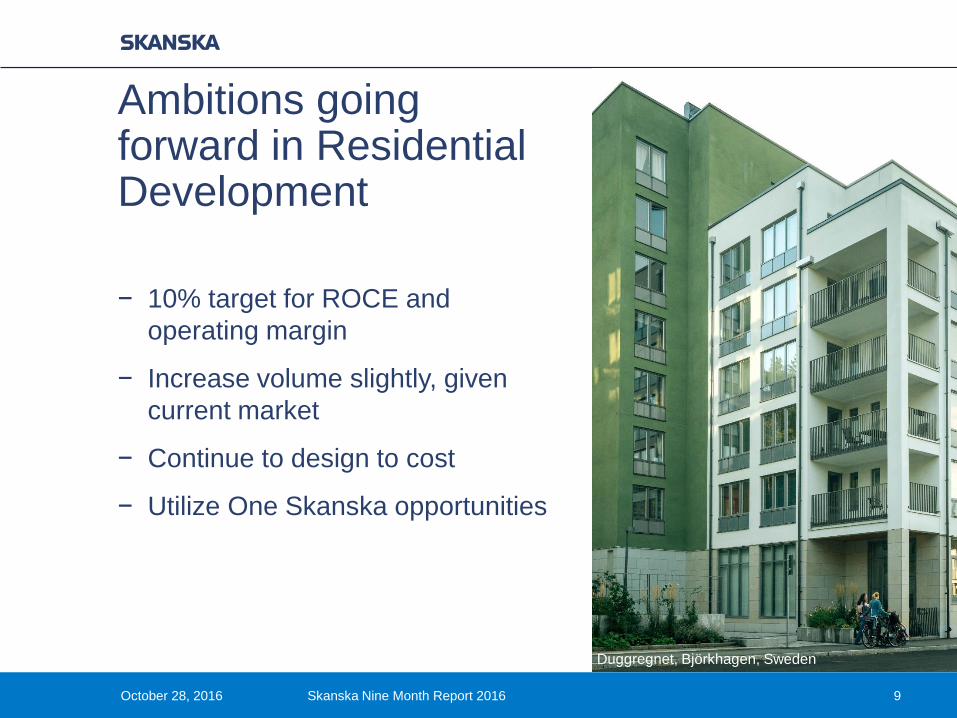
− 10% target for ROCE and
operating margin
− Increase volume slightly, given
current market
− Continue to design to cost
− Utilize One Skanska opportunities
Duggregnet, Björkhagen, Sweden
October 28, 2016 Skanska Nine Month Report 2016 9
Ambitions going forward in Residential Development
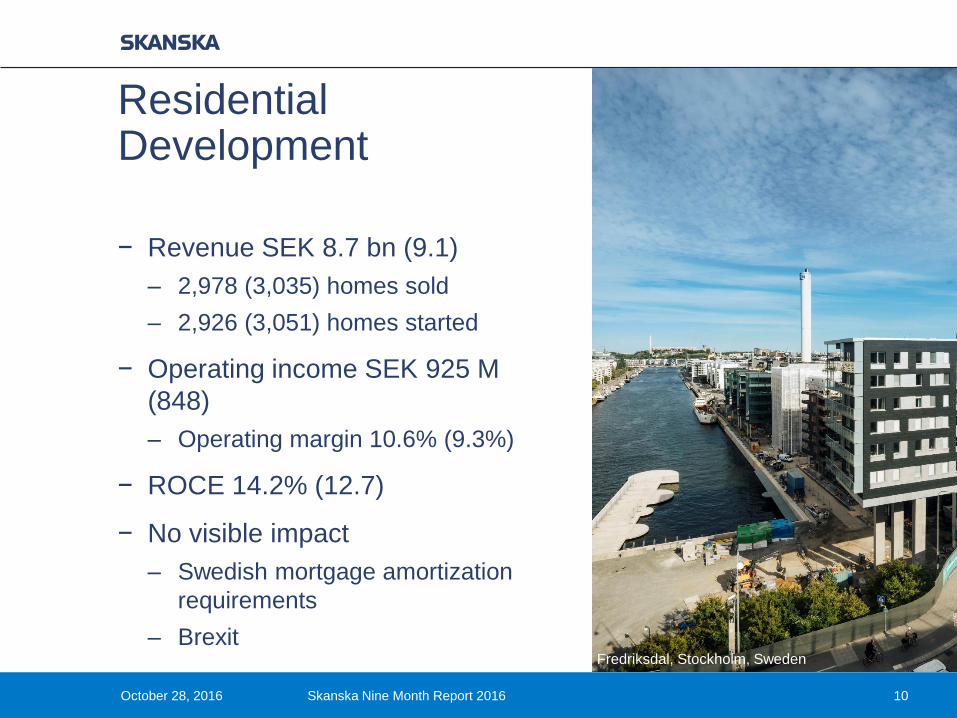
− Revenue SEK 8.7 bn (9.1)
– 2,978 (3,035) homes sold
– 2,926 (3,051) homes started
− Operating income SEK 925 M
(848)
– Operating margin 10.6% (9.3%)
− ROCE 14.2% (12.7)
− No visible impact
– Swedish mortgage amortization
requirements
– BrexitFredriksdal, Stockholm, Sweden
October 28, 2016 Skanska Nine Month Report 2016 10
Residential Development
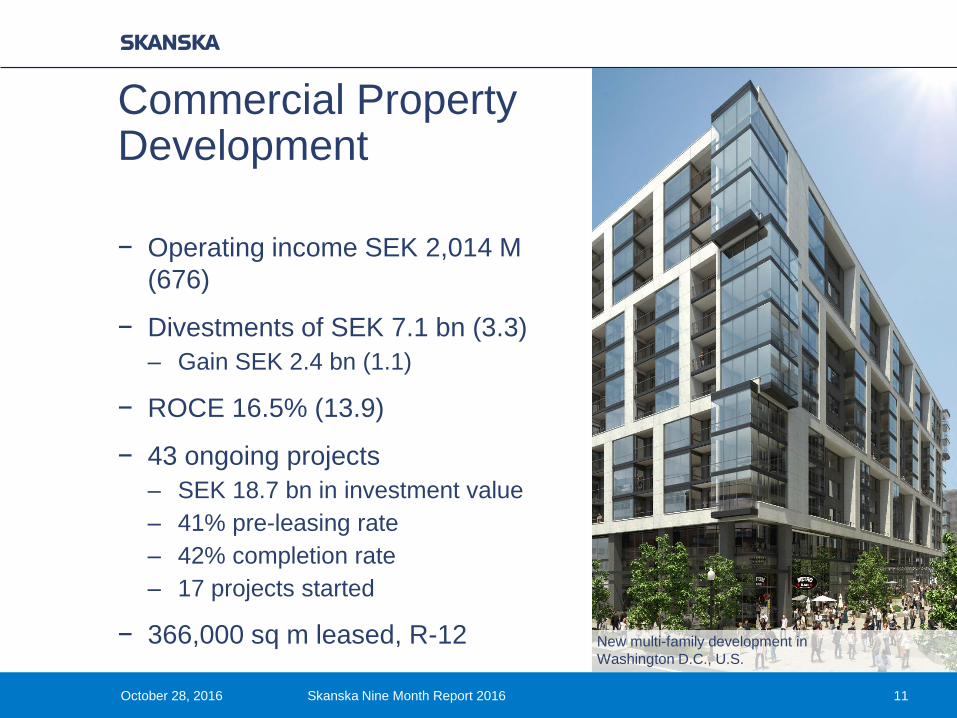
− Operating income SEK 2,014 M
(676)
− Divestments of SEK 7.1 bn (3.3)
– Gain SEK 2.4 bn (1.1)
− ROCE 16.5% (13.9)
− 43 ongoing projects
– SEK 18.7 bn in investment value
– 41% pre-leasing rate
– 42% completion rate
– 17 projects started
− 366,000 sq m leased, R-12 New multi-family development in
Washington D.C., U.S.
October 28, 2016 Skanska Nine Month Report 2016 11
Commercial Property Development
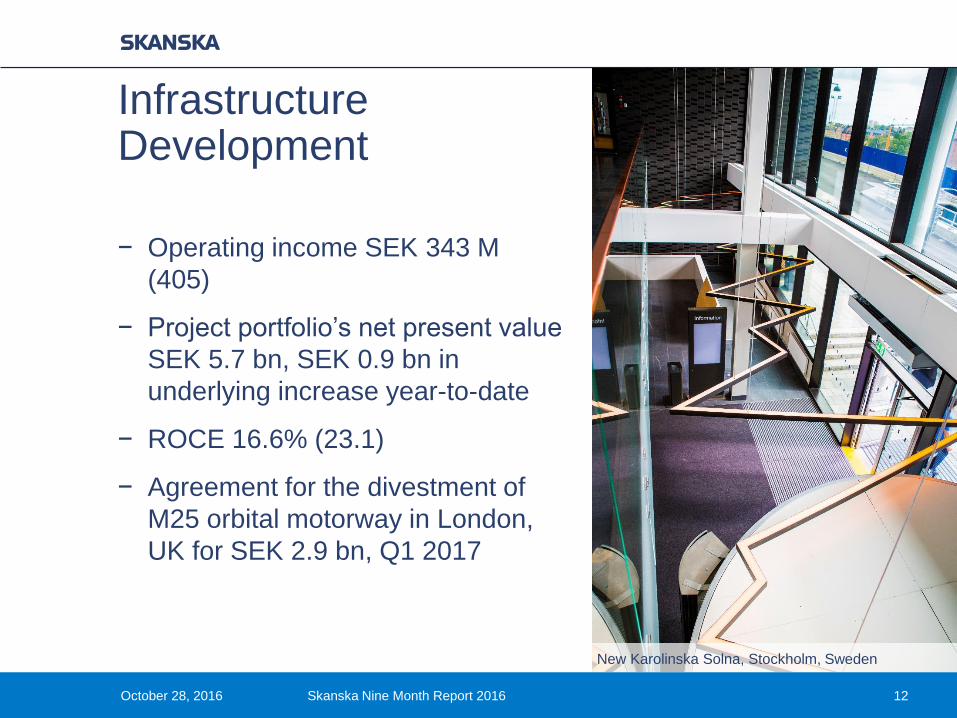
− Operating income SEK 343 M
(405)
− Project portfolio’s net present value
SEK 5.7 bn, SEK 0.9 bn in
underlying increase year-to-date
− ROCE 16.6% (23.1)
− Agreement for the divestment of
M25 orbital motorway in London,
UK for SEK 2.9 bn, Q1 2017
New Karolinska Solna, Stockholm, Sweden
October 28, 2016 Skanska Nine Month Report 2016 12
Infrastructure Development
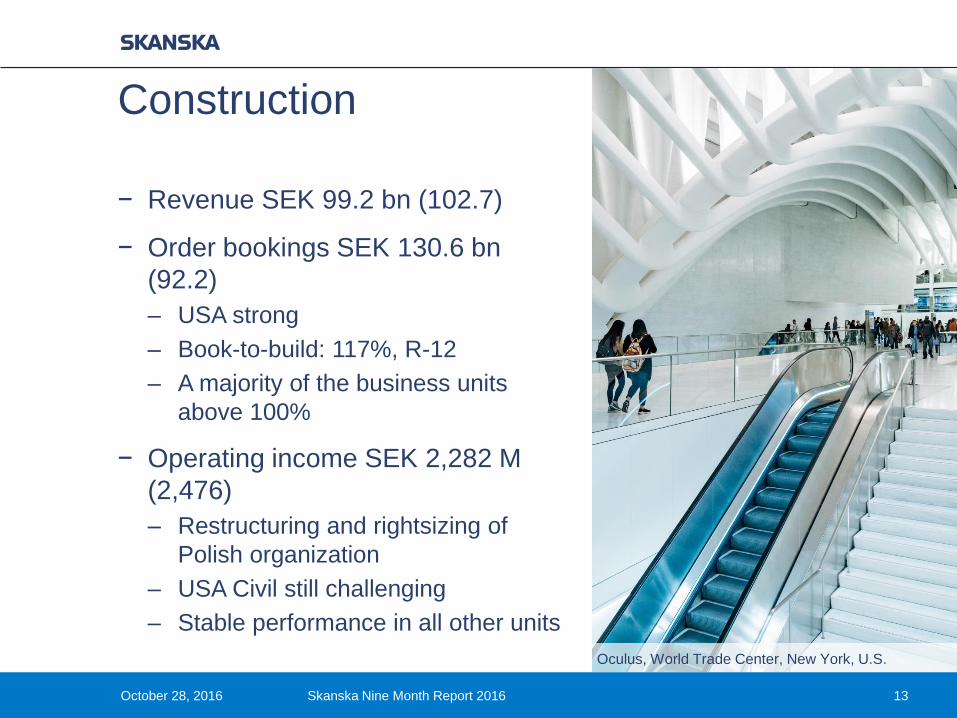
− Revenue SEK 99.2 bn (102.7)
− Order bookings SEK 130.6 bn
(92.2)
– USA strong
– Book-to-build: 117%, R-12
– A majority of the business units
above 100%
− Operating income SEK 2,282 M
(2,476)
– Restructuring and rightsizing of
Polish organization
– USA Civil still challenging
– Stable performance in all other units
Oculus, World Trade Center, New York, U.S.
October 28, 2016 Skanska Nine Month Report 2016 13
Construction
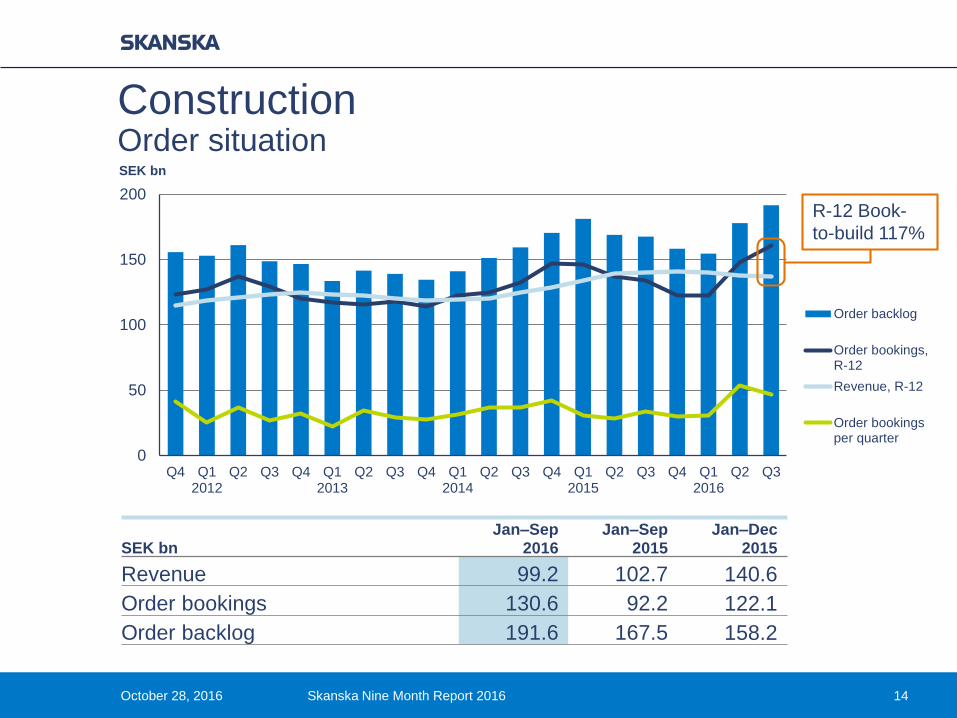
Construction Order situation
0
50
100
150
200
Q4 Q12012
Q2 Q3 Q4 Q12013
Q2 Q3 Q4 Q12014
Q2 Q3 Q4 Q12015
Q2 Q3 Q4 Q12016
Q2 Q3
SEK bn
Order backlog
Order bookings,R-12
Revenue, R-12
Order bookingsper quarter
R-12 Book-
to-build 117%
October 28, 2016 Skanska Nine Month Report 2016 14
SEK bnJan–Sep
2016Jan–Sep
2015Jan–Dec
2015
Revenue 99.2 102.7 140.6
Order bookings 130.6 92.2 122.1
Order backlog 191.6 167.5 158.2
October 28, 2016 Skanska Nine Month Report 2016 15
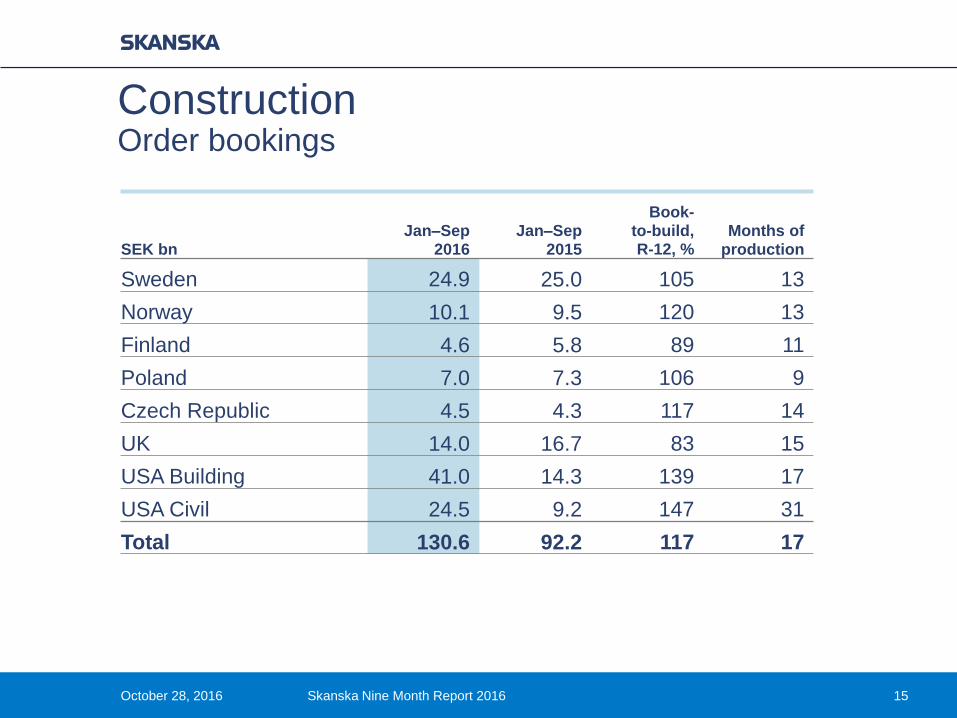
Construction Order bookings
SEK bnJan–Sep
2016Jan–Sep
2015
Book-to-build,R-12, %
Months of production
Sweden 24.9 25.0 105 13
Norway 10.1 9.5 120 13
Finland 4.6 5.8 89 11
Poland 7.0 7.3 106 9
Czech Republic 4.5 4.3 117 14
UK 14.0 16.7 83 15
USA Building 41.0 14.3 139 17
USA Civil 24.5 9.2 147 31
Total 130.6 92.2 117 17
0
25
50
75
100
125
150
0
1
2
3
4
5
6
Q4 Q12012
Q2 Q3 Q4 Q12013
Q2 Q3 Q4 Q12014
Q2 Q3 Q4 Q12015
Q2 Q3 Q4 Q12016
Q2 Q3
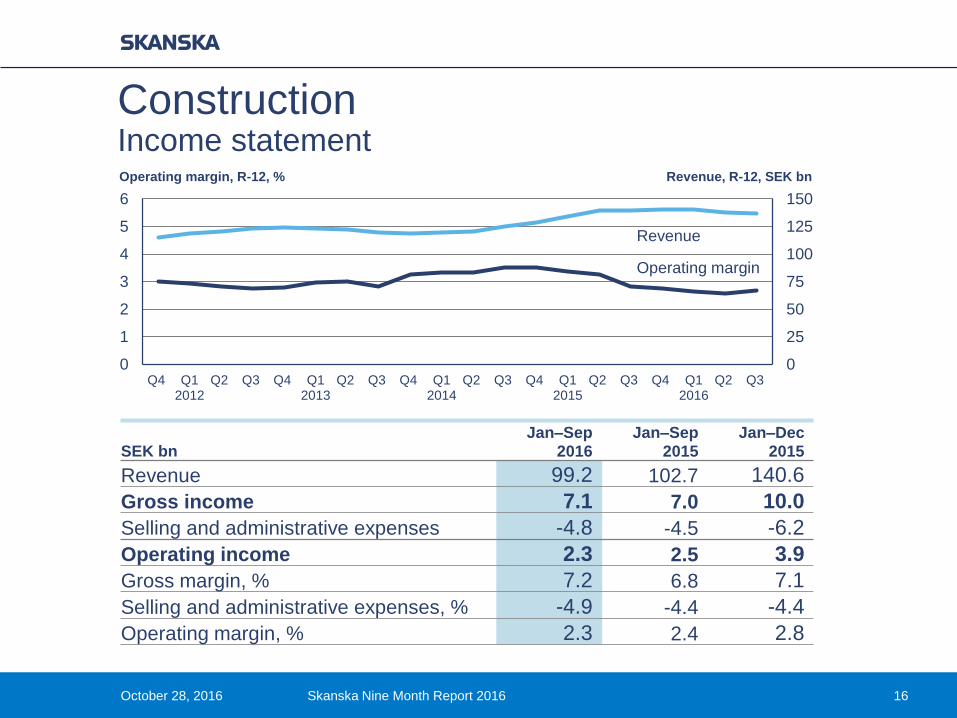
Construction Income statement
Revenue
Operating margin
Revenue, R-12, SEK bnOperating margin, R-12, %
October 28, 2016 Skanska Nine Month Report 2016 16
SEK bnJan–Sep
2016Jan–Sep
2015Jan–Dec
2015
Revenue 99.2 102.7 140.6
Gross income 7.1 7.0 10.0
Selling and administrative expenses -4.8 -4.5 -6.2
Operating income 2.3 2.5 3.9
Gross margin, % 7.2 6.8 7.1
Selling and administrative expenses, % -4.9 -4.4 -4.4
Operating margin, % 2.3 2.4 2.8
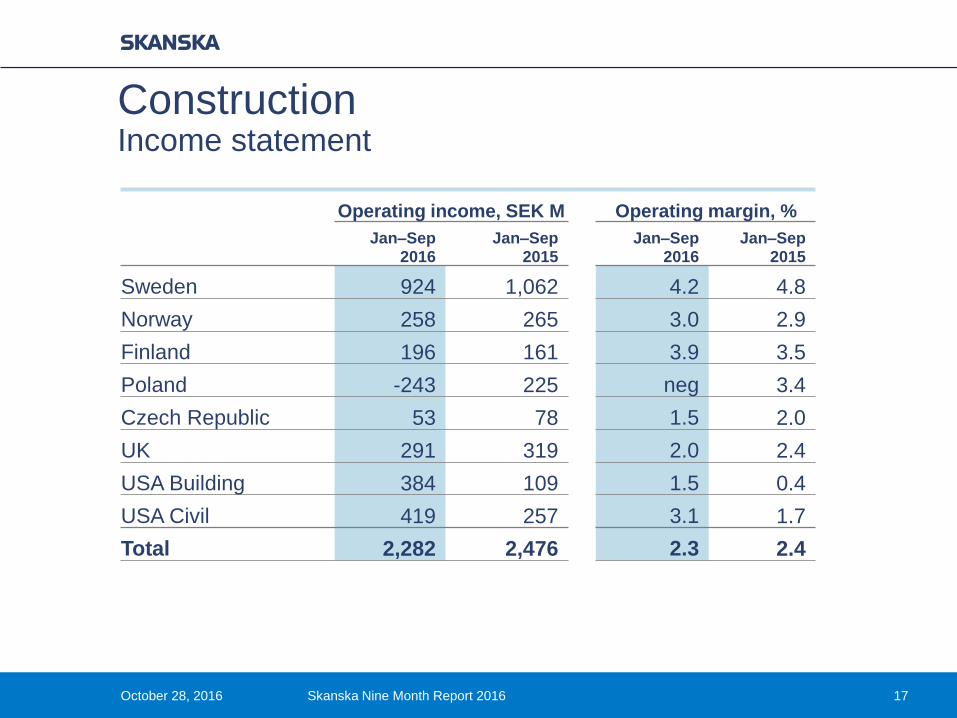
Construction Income statement
17
Operating income, SEK M Operating margin, %
Jan–Sep 2016
Jan–Sep 2015
Jan–Sep 2016
Jan–Sep 2015
Sweden 924 1,062 4.2 4.8
Norway 258 265 3.0 2.9
Finland 196 161 3.9 3.5
Poland -243 225 neg 3.4
Czech Republic 53 78 1.5 2.0
UK 291 319 2.0 2.4
USA Building 384 109 1.5 0.4
USA Civil 419 257 3.1 1.7
Total 2,282 2,476 2.3 2.4
October 28, 2016 Skanska Nine Month Report 2016
-5
0
5
10
15
-5
0
5
10
15
Q4 Q12012
Q2 Q3 Q4 Q12013
Q2 Q3 Q4 Q12014
Q2 Q3 Q4 Q12015
Q2 Q3 Q4 Q12016
Q2 Q3
Revenue
Operating margin
Operating margin, R-12, %
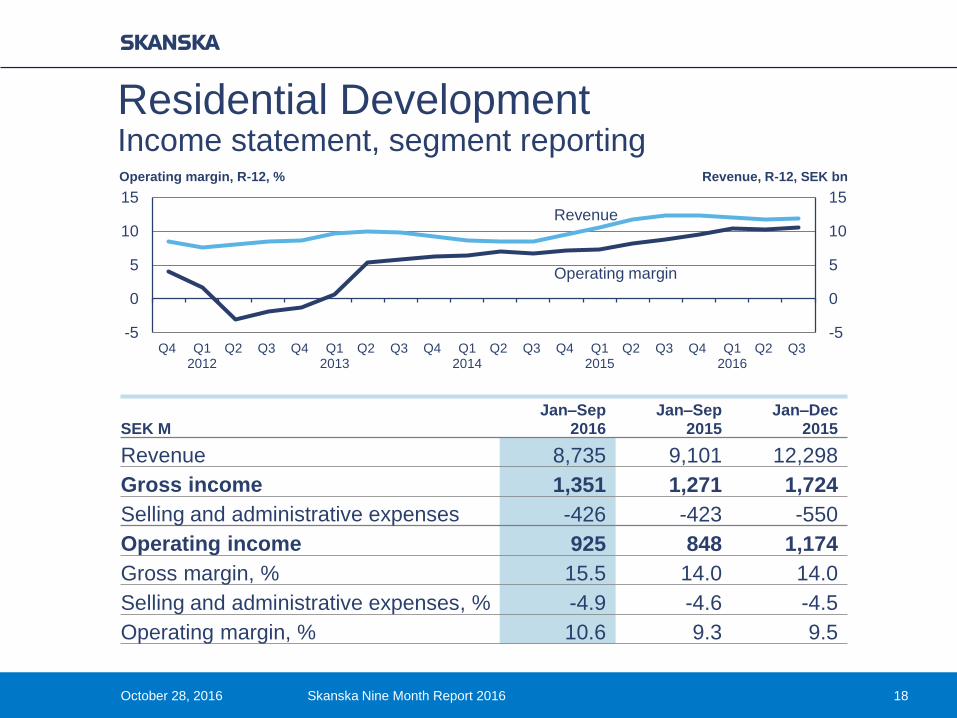
Residential Development Income statement, segment reporting
Revenue, R-12, SEK bn
October 28, 2016 Skanska Nine Month Report 2016 18
SEK MJan–Sep
2016Jan–Sep
2015Jan–Dec
2015
Revenue 8,735 9,101 12,298
Gross income 1,351 1,271 1,724
Selling and administrative expenses -426 -423 -550
Operating income 925 848 1,174
Gross margin, % 15.5 14.0 14.0
Selling and administrative expenses, % -4.9 -4.6 -4.5
Operating margin, % 10.6 9.3 9.5
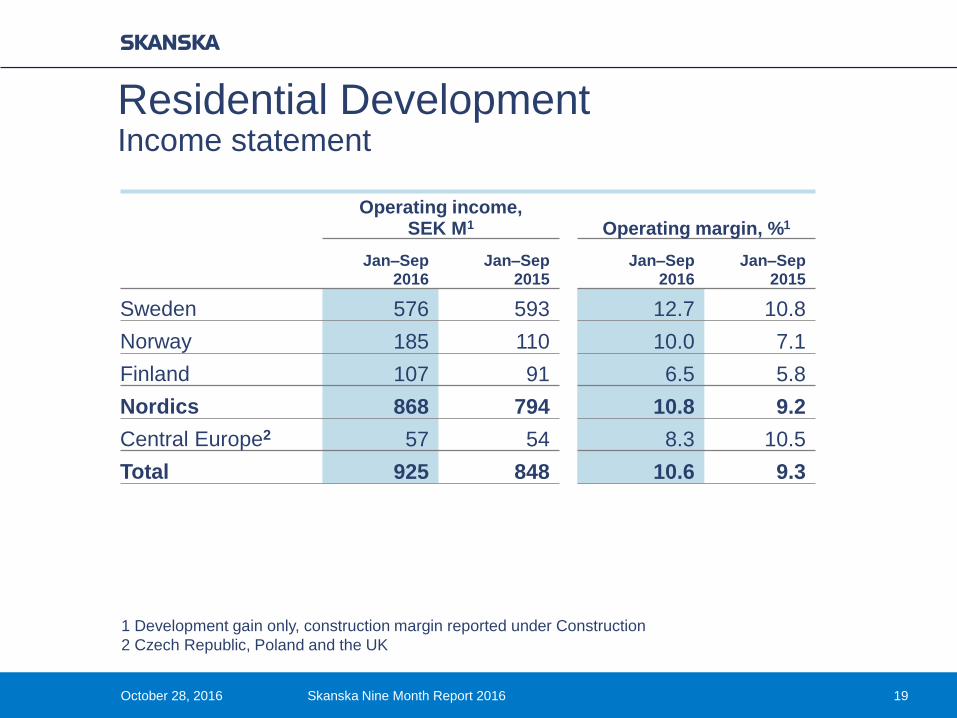
Residential Development Income statement
19
Operating income, SEK M1 Operating margin, %1
Jan–Sep 2016
Jan–Sep 2015
Jan–Sep 2016
Jan–Sep 2015
Sweden 576 593 12.7 10.8
Norway 185 110 10.0 7.1
Finland 107 91 6.5 5.8
Nordics 868 794 10.8 9.2
Central Europe2 57 54 8.3 10.5
Total 925 848 10.6 9.3
1 Development gain only, construction margin reported under Construction
2 Czech Republic, Poland and the UK
October 28, 2016 Skanska Nine Month Report 2016
0
1,000
2,000
3,000
4,000
5,000
Q4 Q12012
Q2 Q3 Q4 Q12013
Q2 Q3 Q4 Q12014
Q2 Q3 Q4 Q12015
Q2 Q3 Q4 Q12016
Q2 Q3
Homes
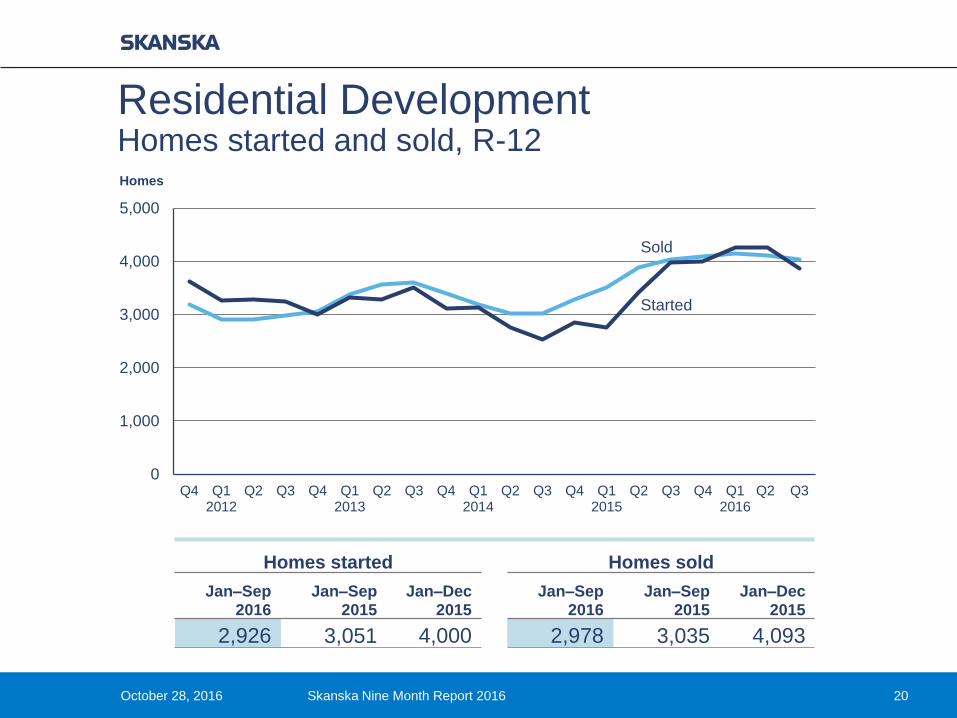
Residential Development Homes started and sold, R-12
October 28, 2016 Skanska Nine Month Report 2016 20
Homes started Homes sold
Jan–Sep 2016
Jan–Sep 2015
Jan–Dec 2015
Jan–Sep2016
Jan–Sep 2015
Jan–Dec 2015
2,926 3,051 4,000 2,978 3,035 4,093
Sold
Started
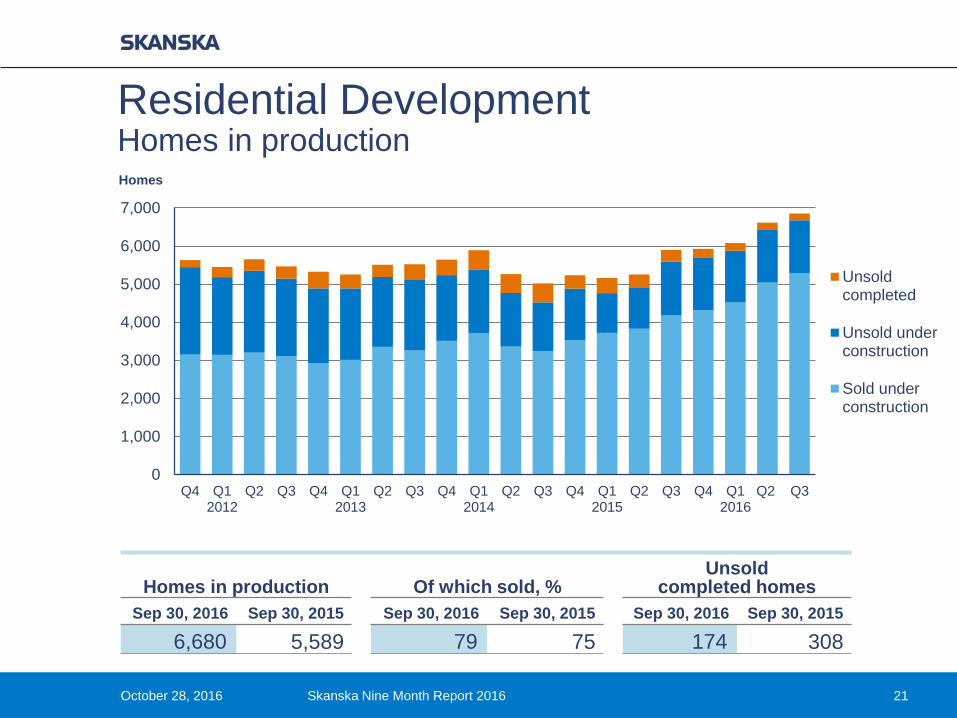
Residential Development Homes in production
October 28, 2016 Skanska Nine Month Report 2016 21
0
1,000
2,000
3,000
4,000
5,000
6,000
7,000
Q4 Q12012
Q2 Q3 Q4 Q12013
Q2 Q3 Q4 Q12014
Q2 Q3 Q4 Q12015
Q2 Q3 Q4 Q12016
Q2 Q3
Homes
Unsoldcompleted
Unsold underconstruction
Sold underconstruction
Homes in production Of which sold, %Unsold
completed homes
Sep 30, 2016 Sep 30, 2015 Sep 30, 2016 Sep 30, 2015 Sep 30, 2016 Sep 30, 2015
6,680 5,589 79 75 174 308
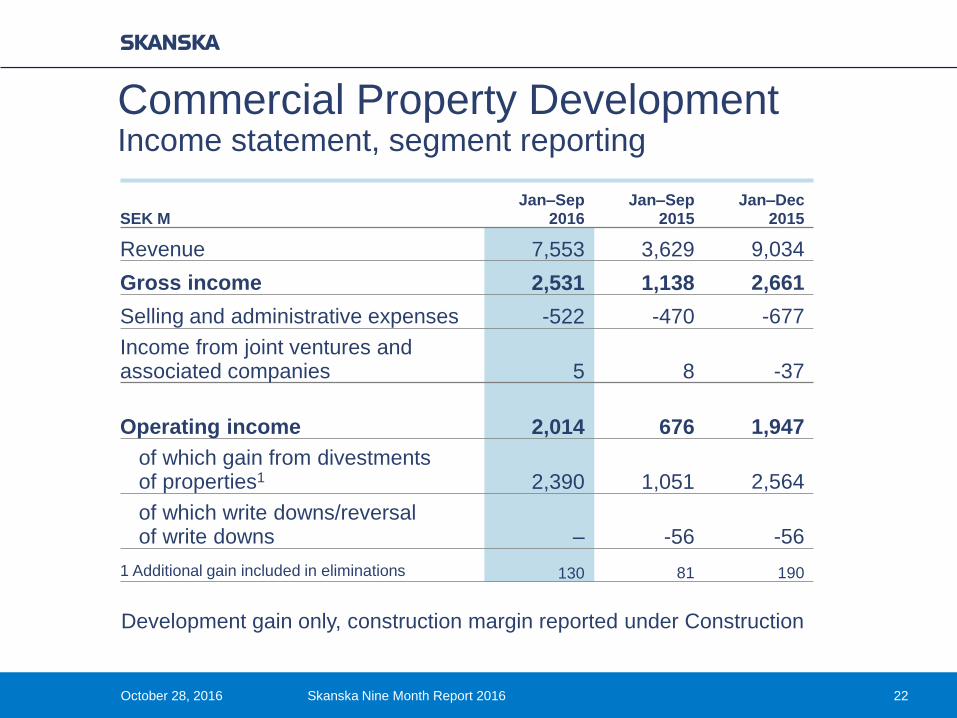
Commercial Property Development Income statement, segment reporting
22
SEK MJan–Sep
2016Jan–Sep
2015Jan–Dec
2015
Revenue 7,553 3,629 9,034
Gross income 2,531 1,138 2,661
Selling and administrative expenses -522 -470 -677
Income from joint ventures andassociated companies 5 8 -37
Operating income 2,014 676 1,947
of which gain from divestments of properties1 2,390 1,051 2,564
of which write downs/reversal of write downs – -56 -56
1 Additional gain included in eliminations 130 81 190
Development gain only, construction margin reported under Construction
October 28, 2016 Skanska Nine Month Report 2016
0
2
4
6
8
10
12
14
Q4 Q12012
Q2 Q3 Q4 Q12013
Q2 Q3 Q4 Q12014
Q2 Q3 Q4 Q12015
Q2 Q3 Q4 Q12016
Q2 Q3
Revenue fromdivestments,R-12
Operatingincome fromdivestments,R-12
SEK bn
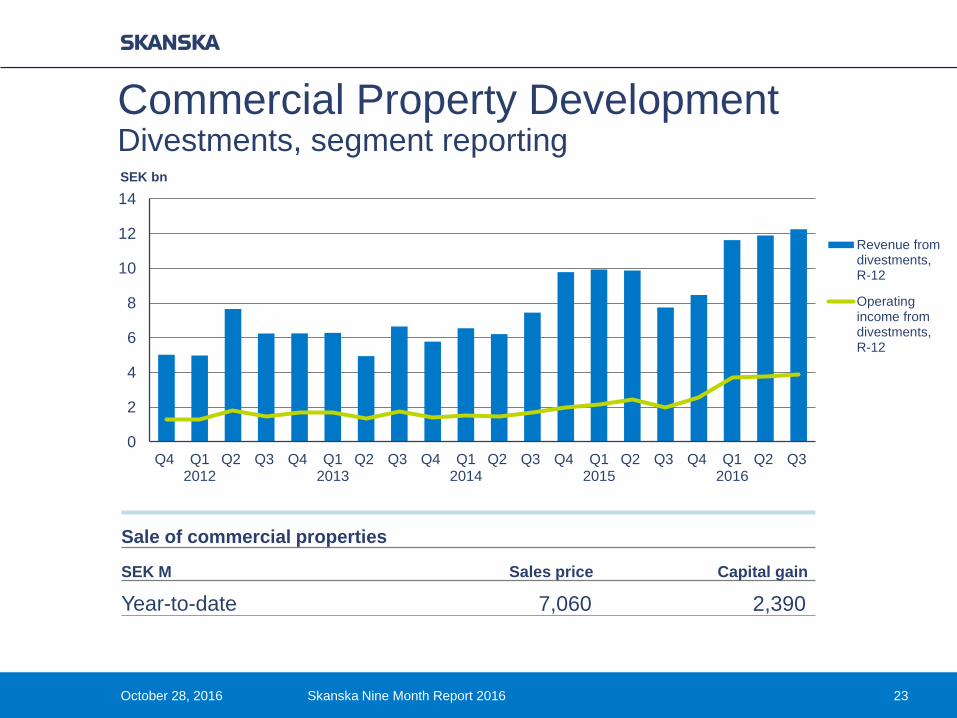
Commercial Property Development Divestments, segment reporting
Sale of commercial properties
SEK M Sales price Capital gain
Year-to-date 7,060 2,390
October 28, 2016 Skanska Nine Month Report 2016 23
October 28, 2016 Skanska Nine Month Report 2016 24
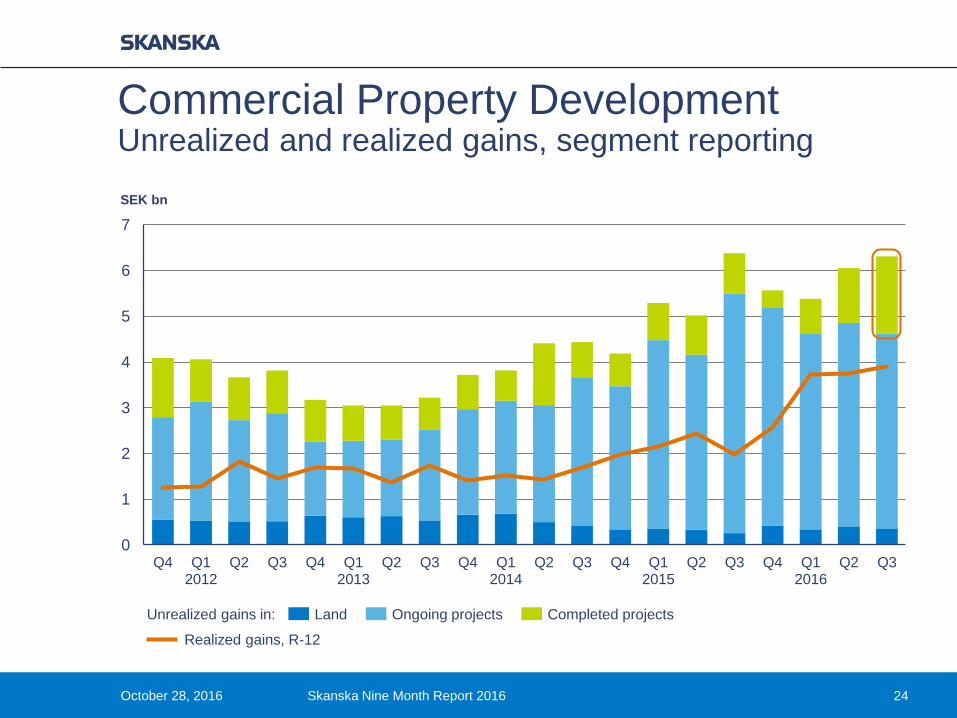
Commercial Property Development Unrealized and realized gains, segment reporting
0
1
2
3
4
5
6
7
Q4 Q12012
Q2 Q3 Q4 Q12013
Q2 Q3 Q4 Q12014
Q2 Q3 Q4 Q12015
Q2 Q3 Q4 Q12016
Q2 Q3
SEK bn
Unrealized gains in: Land Ongoing projects Completed projects
Realized gains, R-12
0
50
100
150
200
250
300
350
400
450
Q4 Q12012
Q2 Q3 Q4 Q12013
Q2 Q3 Q4 Q12014
Q2 Q3 Q4 Q12015
Q2 Q3 Q4 Q12016
Q2 Q3
Leasing,quarterly
Leasing,R-12
000 sq m
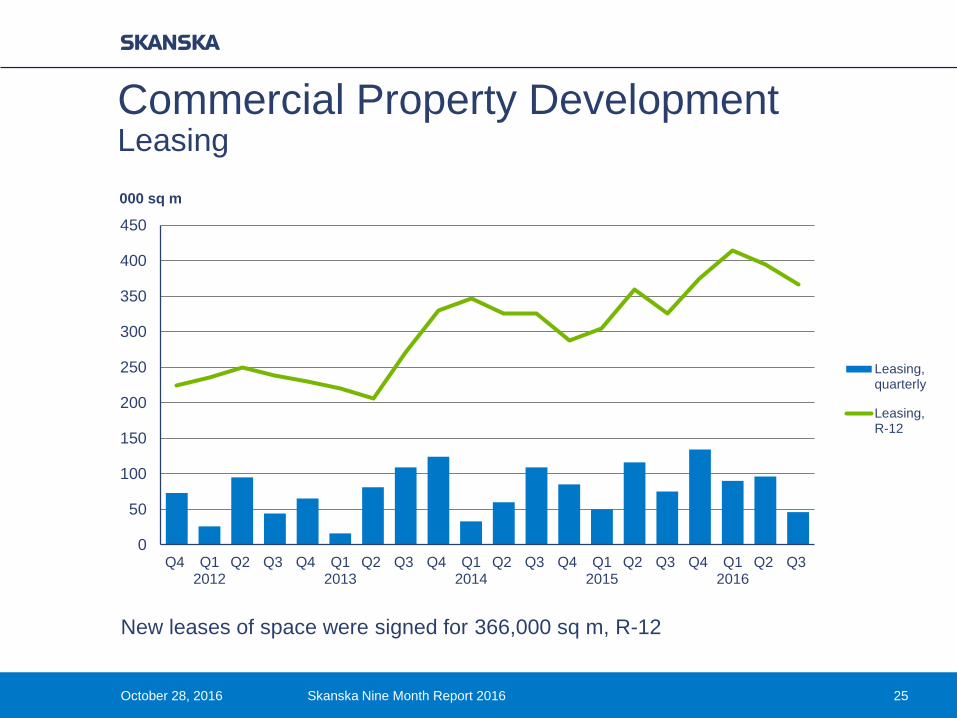
Commercial Property Development Leasing
New leases of space were signed for 366,000 sq m, R-12
October 28, 2016 Skanska Nine Month Report 2016 25
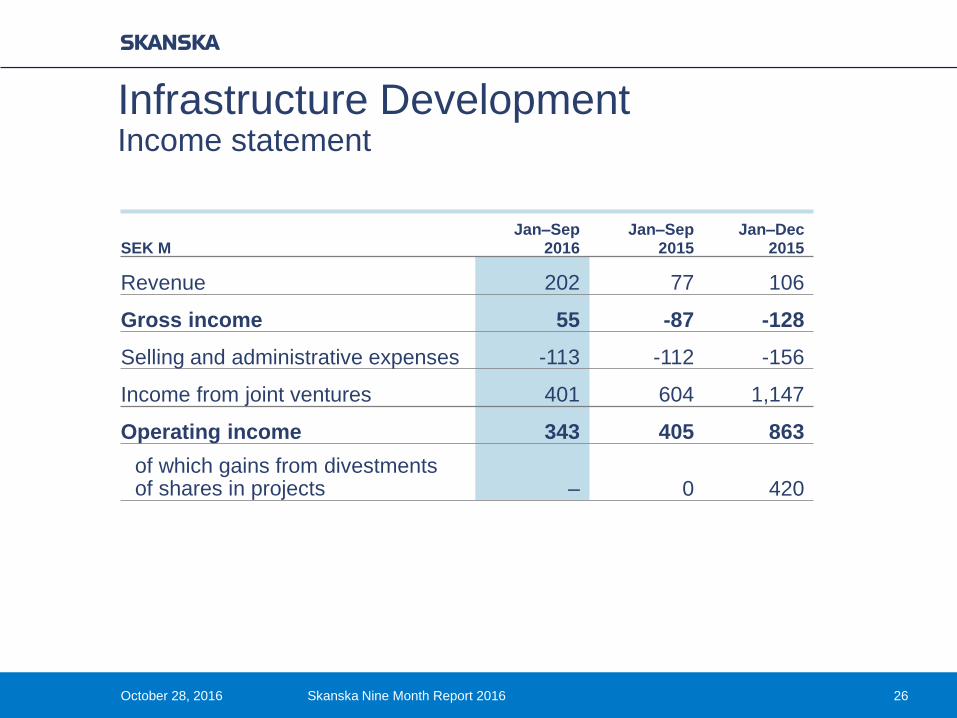
Infrastructure Development Income statement
26October 28, 2016 Skanska Nine Month Report 2016
SEK MJan–Sep
2016Jan–Sep
2015Jan–Dec
2015
Revenue 202 77 106
Gross income 55 -87 -128
Selling and administrative expenses -113 -112 -156
Income from joint ventures 401 604 1,147
Operating income 343 405 863
of which gains from divestmentsof shares in projects – 0 420
October 28, 2016 Skanska Nine Month Report 2016 27
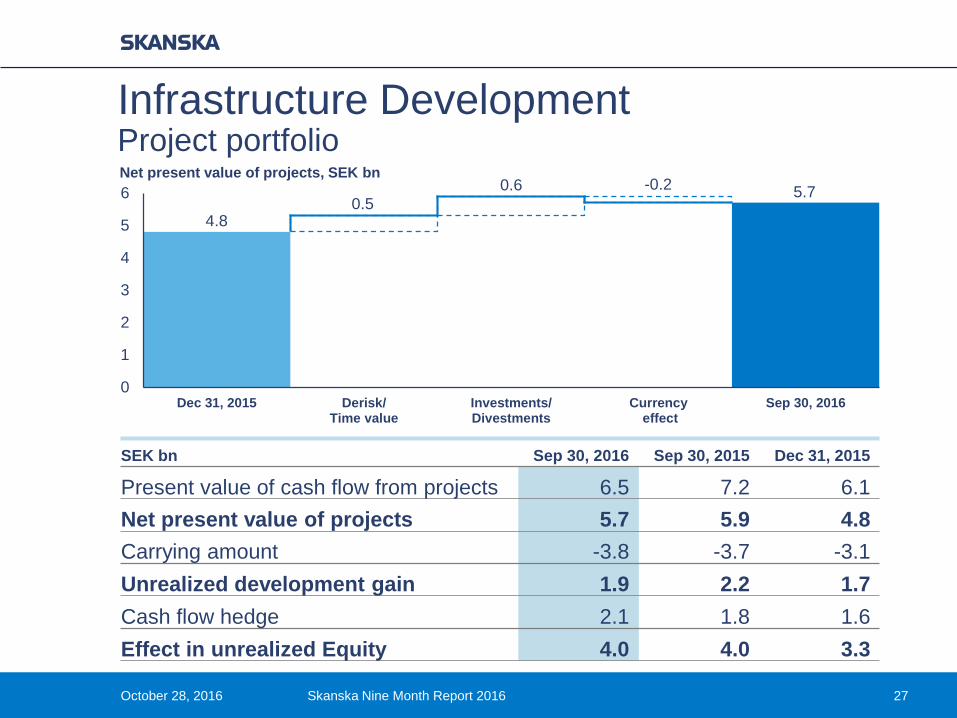
Infrastructure Development Project portfolioNet present value of projects, SEK bn
4.80.5
0.6 -0.2
0
1
2
3
4
5
6
Dec 31, 2015 Derisk/Time value
Investments/Divestments
Currency effect
Sep 30, 2016
5.7
SEK bn Sep 30, 2016 Sep 30, 2015 Dec 31, 2015
Present value of cash flow from projects 6.5 7.2 6.1
Net present value of projects 5.7 5.9 4.8
Carrying amount -3.8 -3.7 -3.1
Unrealized development gain 1.9 2.2 1.7
Cash flow hedge 2.1 1.8 1.6
Effect in unrealized Equity 4.0 4.0 3.3
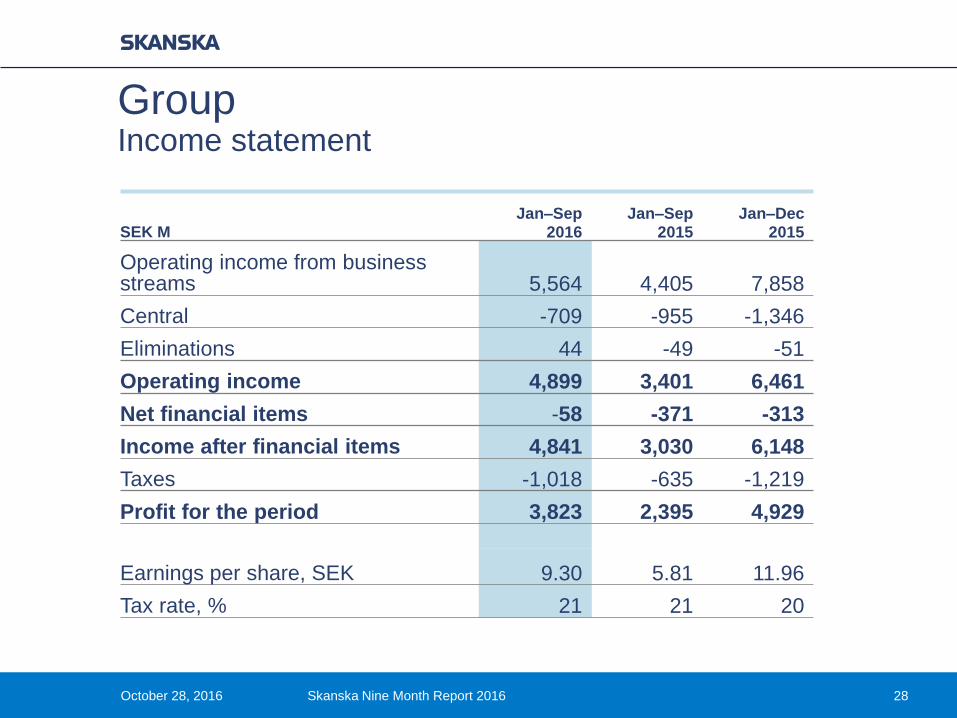
Group Income statement
28October 28, 2016 Skanska Nine Month Report 2016
SEK MJan–Sep
2016Jan–Sep
2015Jan–Dec
2015
Operating income from business streams 5,564 4,405 7,858
Central -709 -955 -1,346
Eliminations 44 -49 -51
Operating income 4,899 3,401 6,461
Net financial items -58 -371 -313
Income after financial items 4,841 3,030 6,148
Taxes -1,018 -635 -1,219
Profit for the period 3,823 2,395 4,929
Earnings per share, SEK 9.30 5.81 11.96
Tax rate, % 21 21 20
-6
-4
-2
0
2
4
6
8
10
Q4 Q12012
Q2 Q3 Q4 Q12013
Q2 Q3 Q4 Q12014
Q2 Q3 Q4 Q12015
Q2 Q3 Q4 Q12016
Q2 Q3
SEK bn
Cash flowfrombusinessoperations,quarterly
R-12
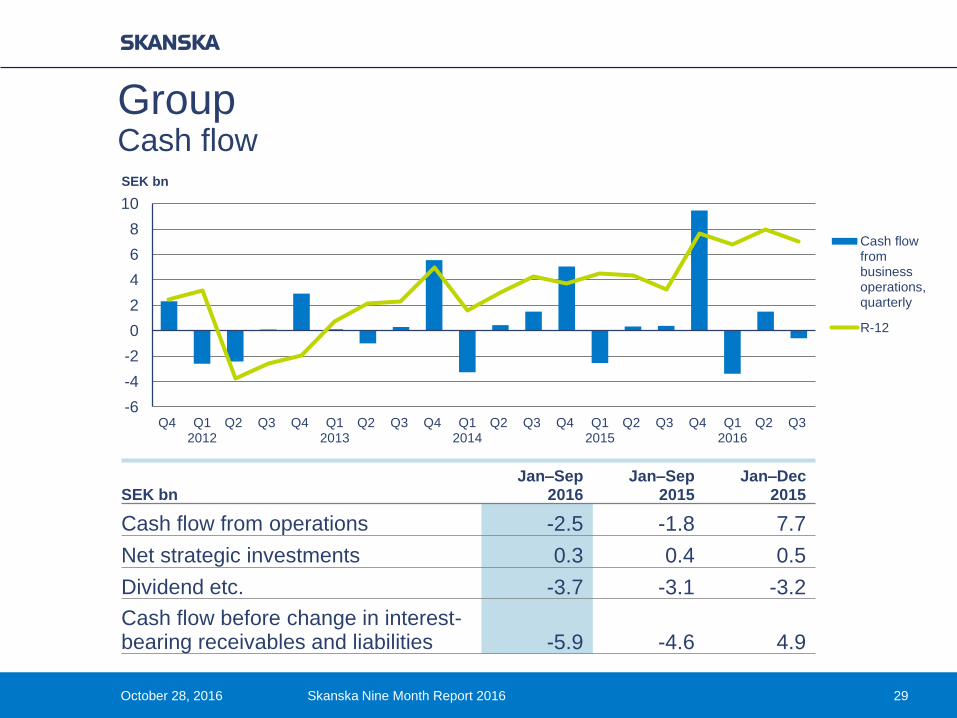
GroupCash flow
October 28, 2016 Skanska Nine Month Report 2016 29
SEK bnJan–Sep
2016Jan–Sep
2015Jan–Dec
2015
Cash flow from operations -2.5 -1.8 7.7
Net strategic investments 0.3 0.4 0.5
Dividend etc. -3.7 -3.1 -3.2
Cash flow before change in interest-bearing receivables and liabilities -5.9 -4.6 4.9
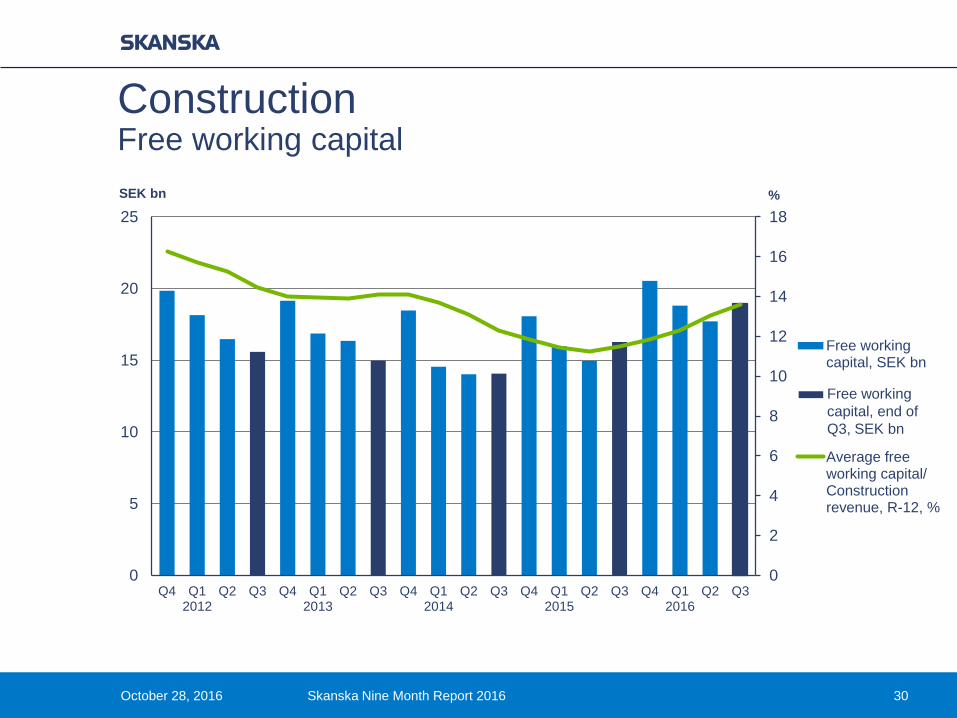
Construction Free working capital
October 28, 2016 Skanska Nine Month Report 2016 30
0
2
4
6
8
10
12
14
16
18
0
5
10
15
20
25
Q4 Q12012
Q2 Q3 Q4 Q12013
Q2 Q3 Q4 Q12014
Q2 Q3 Q4 Q12015
Q2 Q3 Q4 Q12016
Q2 Q3
%SEK bn
Free workingcapital, SEK bn
Average freeworking capital/Constructionrevenue, R-12, %
Free working
capital, end of
Q3, SEK bn
-6
-4
-2
0
2
4
6
8
10
Q4 Q12012
Q2 Q3 Q4 Q12013
Q2 Q3 Q4 Q12014
Q2 Q3 Q4 Q12015
Q2 Q3 Q4 Q12016
Q2 Q3
SEK bn
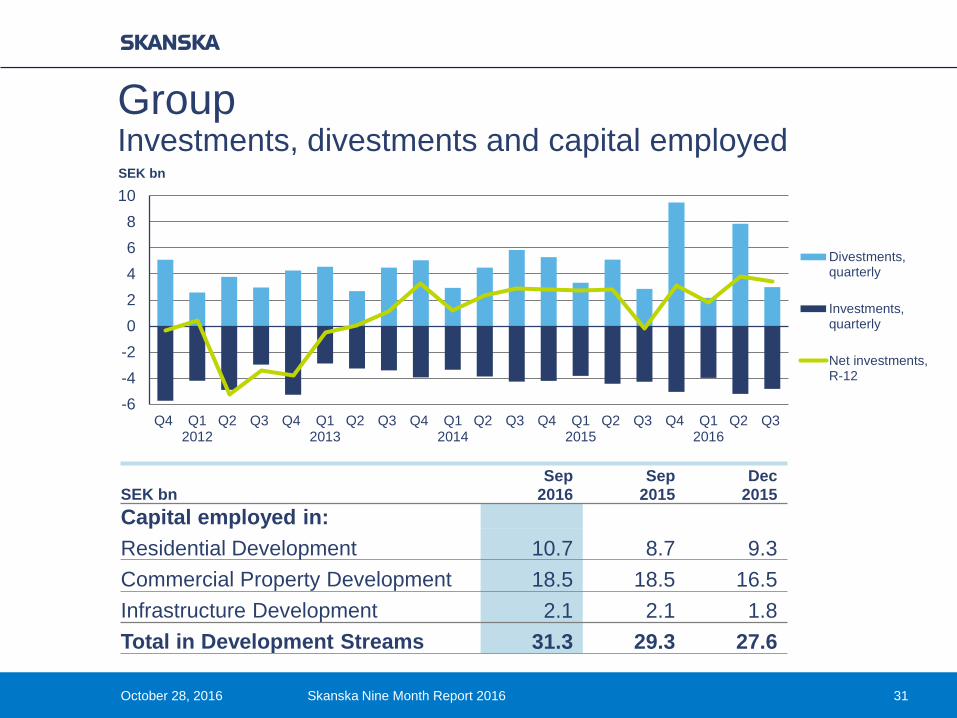
Divestments,quarterly
Investments,quarterly
Net investments,R-12
October 28, 2016 Skanska Nine Month Report 2016 31
GroupInvestments, divestments and capital employed
SEK bnSep
2016Sep
2015Dec
2015
Capital employed in:
Residential Development 10.7 8.7 9.3
Commercial Property Development 18.5 18.5 16.5
Infrastructure Development 2.1 2.1 1.8
Total in Development Streams 31.3 29.3 27.6
0
4
8
12
16
Q4 Q12012
Q2 Q3 Q4 Q12013
Q2 Q3 Q4 Q12014
Q2 Q3 Q4 Q12015
Q2 Q3 Q4 Q12016
Q2 Q3
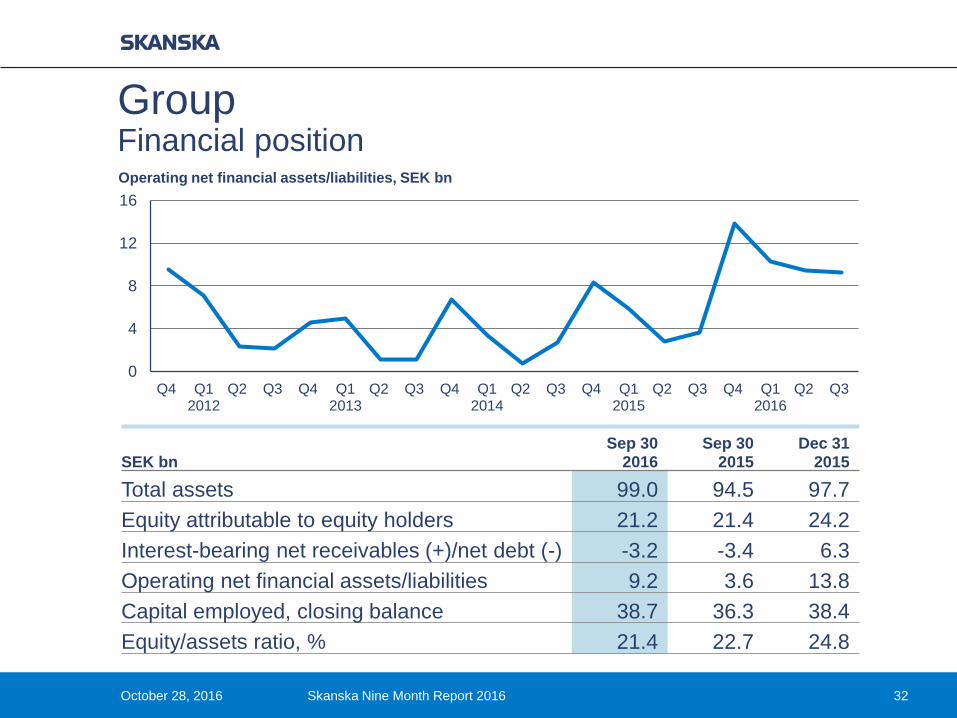
Operating net financial assets/liabilities, SEK bn
Group Financial position
October 28, 2016 Skanska Nine Month Report 2016 32
SEK bnSep 30
2016Sep 30
2015Dec 31
2015
Total assets 99.0 94.5 97.7
Equity attributable to equity holders 21.2 21.4 24.2
Interest-bearing net receivables (+)/net debt (-) -3.2 -3.4 6.3
Operating net financial assets/liabilities 9.2 3.6 13.8
Capital employed, closing balance 38.7 36.3 38.4
Equity/assets ratio, % 21.4 22.7 24.8
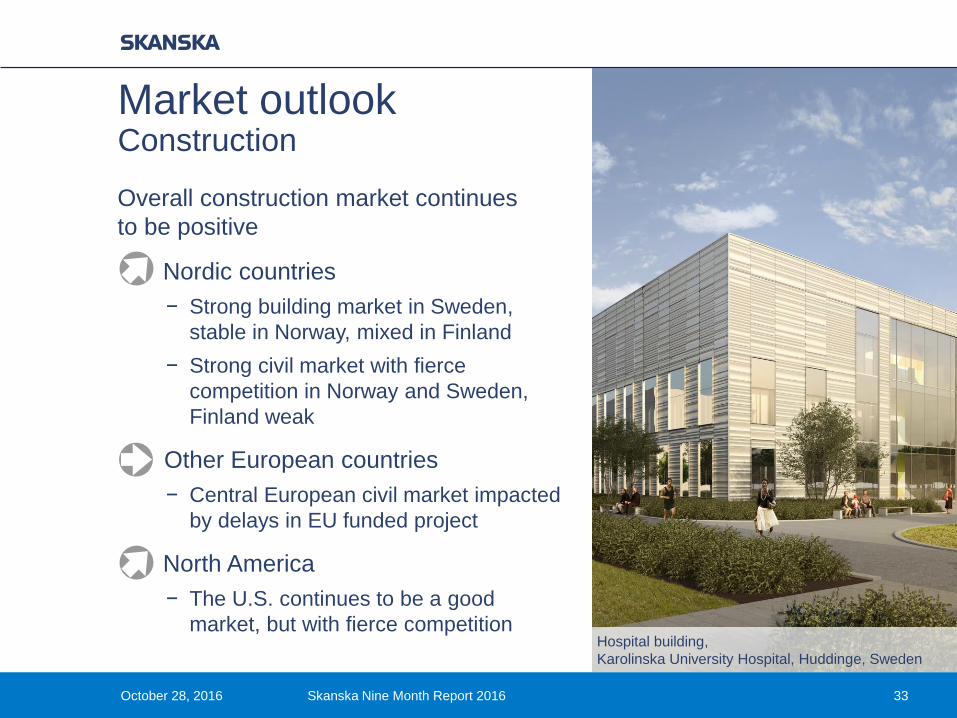
Overall construction market continues
to be positive
Nordic countries
− Strong building market in Sweden,
stable in Norway, mixed in Finland
− Strong civil market with fierce
competition in Norway and Sweden,
Finland weak
Other European countries
− Central European civil market impacted
by delays in EU funded project
North America
− The U.S. continues to be a good
market, but with fierce competition
October 28, 2016 Skanska Nine Month Report 2016
Market outlook Construction
Hospital building,
Karolinska University Hospital, Huddinge, Sweden
33
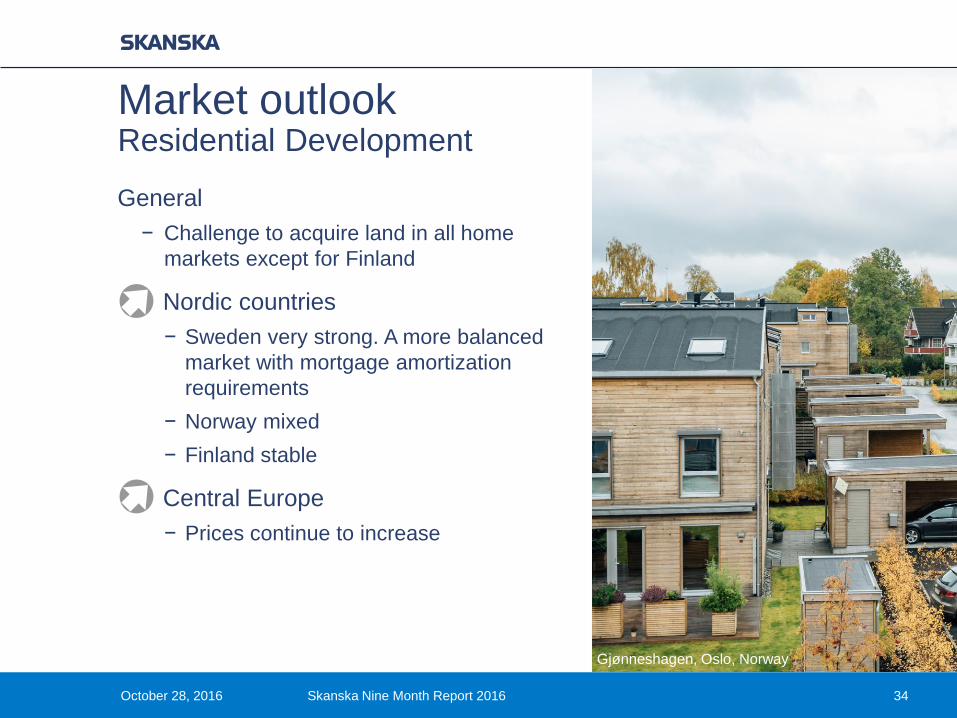
General
− Challenge to acquire land in all home
markets except for Finland
Nordic countries
− Sweden very strong. A more balanced
market with mortgage amortization
requirements
− Norway mixed
− Finland stable
Central Europe
− Prices continue to increase
Gjønneshagen, Oslo, Norway
October 28, 2016 Skanska Nine Month Report 2016 34
Market outlook Residential Development
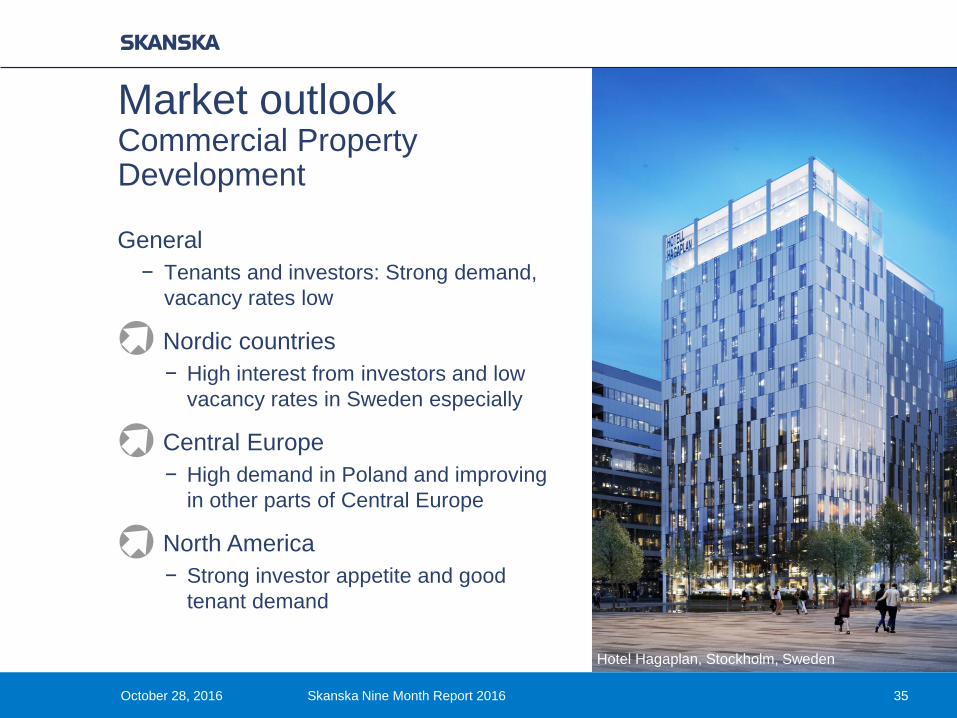
General
− Tenants and investors: Strong demand,
vacancy rates low
Nordic countries
− High interest from investors and low
vacancy rates in Sweden especially
Central Europe
− High demand in Poland and improving
in other parts of Central Europe
North America
− Strong investor appetite and good
tenant demand
Hotel Hagaplan, Stockholm, Sweden
October 28, 2016 Skanska Nine Month Report 2016 35
Market outlook Commercial PropertyDevelopment
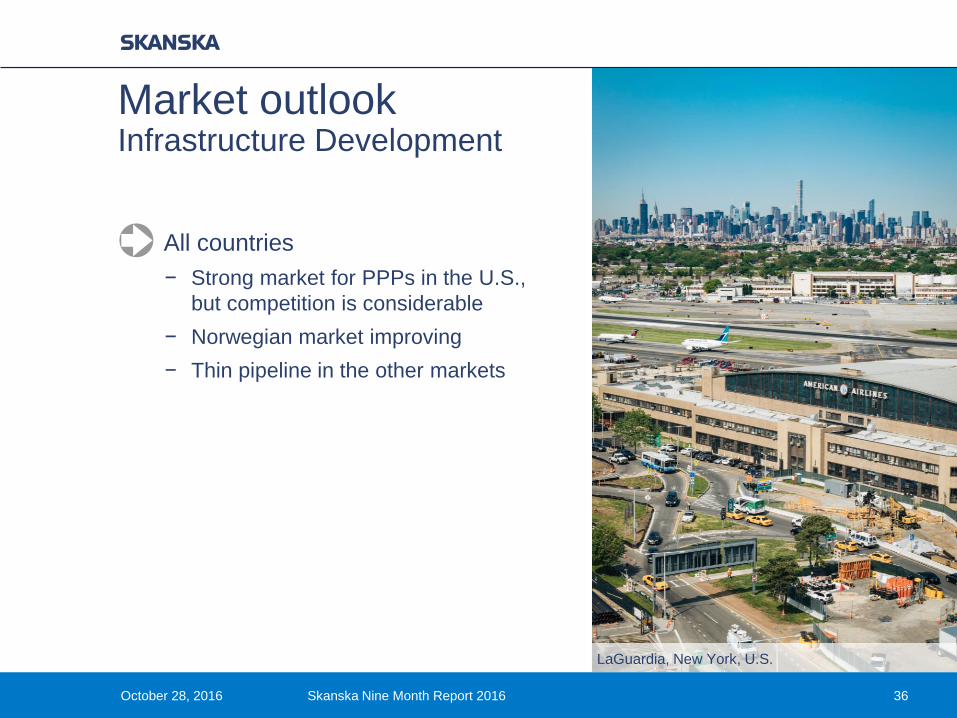
All countries
− Strong market for PPPs in the U.S.,
but competition is considerable
− Norwegian market improving
− Thin pipeline in the other markets
LaGuardia, New York, U.S.
October 28, 2016 Skanska Nine Month Report 2016 36
Market outlook Infrastructure Development
October 28, 2016 Skanska Nine Month Report 2016 37