Embed Size (px)
Citation preview
8/10/2019 Nishant Final_1.pptx
http://slidepdf.com/reader/full/nishant-final1pptx 1/63
Guided By:
-
Prof. A.
S. Walkey(DEEE)
NITTTR, Bhopal
Head of Department:
-
Dr. (Mrs.)
C.S. RAJESHWARI
(DEEE)NITTTR, Bhopal
Presented By:
-
Nishant
ChaturvediM.E. (P.S.)
0012EE11ME08

8/10/2019 Nishant Final_1.pptx
http://slidepdf.com/reader/full/nishant-final1pptx 2/63
8/10/2019 Nishant Final_1.pptx
http://slidepdf.com/reader/full/nishant-final1pptx 3/63
In power generation our main aim is to generate the requiredamount of power with minimum cost.
Economic load dispatch means that the generators real and
reactive power are allowed to vary within certain limits, so asto meet a particular load demand with minimum fuel cost.
This allocation of load are based on some constraints
Equality Constrain Inequality Constrain
8/10/2019 Nishant Final_1.pptx
http://slidepdf.com/reader/full/nishant-final1pptx 4/63
Literature Survey
Pluhacek michal et al (2013) a new approach for chaos drive particle swarm optimization (PSO) algorithm is suggested. Two
different chaotic maps are alternatively used as pseudorandom
number generator and switch over during the run of chaos driven
PSO algorithm.
Rani C. et al (2013) A chotic local search operator is introduced
in the proposed algorithm to avoid premature convergence.
Park Jong-Bae et al (2010) An improved PSO framework
employing chaotic sequence combined with conventional
linearly decreasing inertia weights and adopting a cross overoperation scheme to increase both exploration and exploitation
capability of the PSO.
8/10/2019 Nishant Final_1.pptx
http://slidepdf.com/reader/full/nishant-final1pptx 5/63
8/10/2019 Nishant Final_1.pptx
http://slidepdf.com/reader/full/nishant-final1pptx 6/63
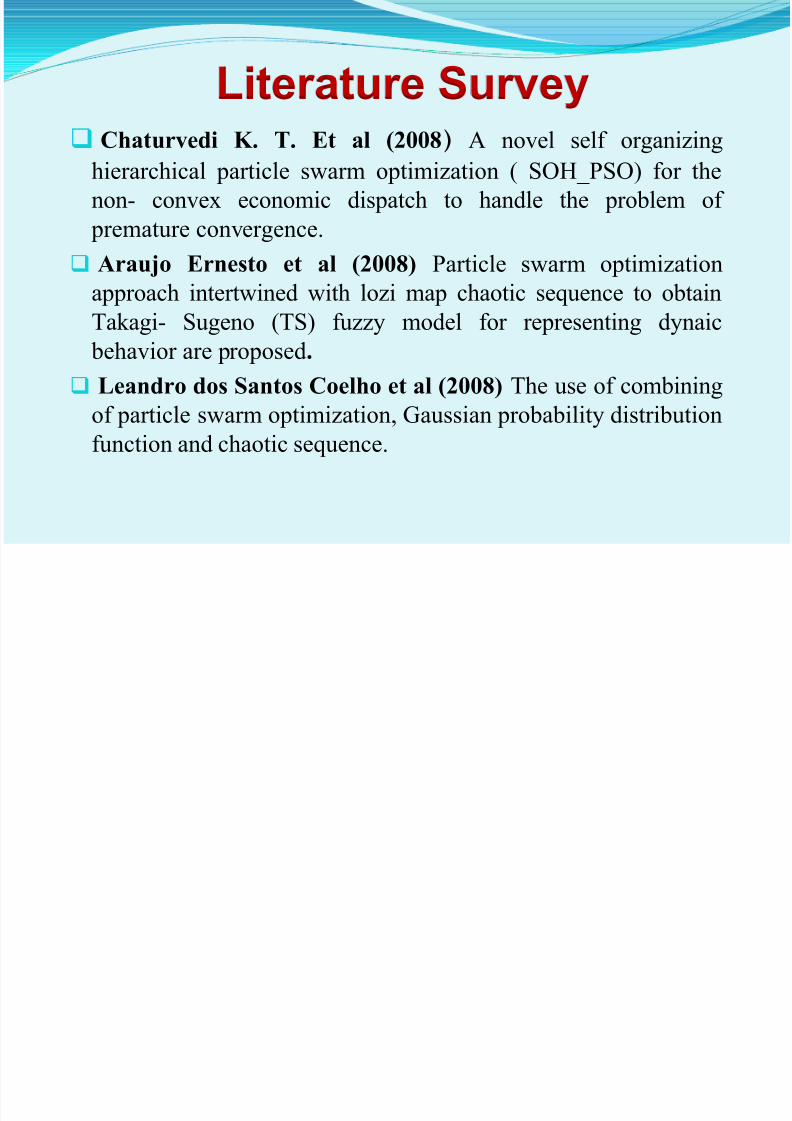
Literature Survey
Chaturvedi K. T. Et al (2008) A novel self organizinghierarchical particle swarm optimization ( SOH_PSO) for the
non- convex economic dispatch to handle the problem of
premature convergence.
Araujo Ernesto et al (2008) Particle swarm optimization
approach intertwined with lozi map chaotic sequence to obtain
Takagi- Sugeno (TS) fuzzy model for representing dynaic
behavior are proposed.
Leandro dos Santos Coelho et al (2008) The use of combining
of particle swarm optimization, Gaussian probability distributionfunction and chaotic sequence.
8/10/2019 Nishant Final_1.pptx
http://slidepdf.com/reader/full/nishant-final1pptx 7/63
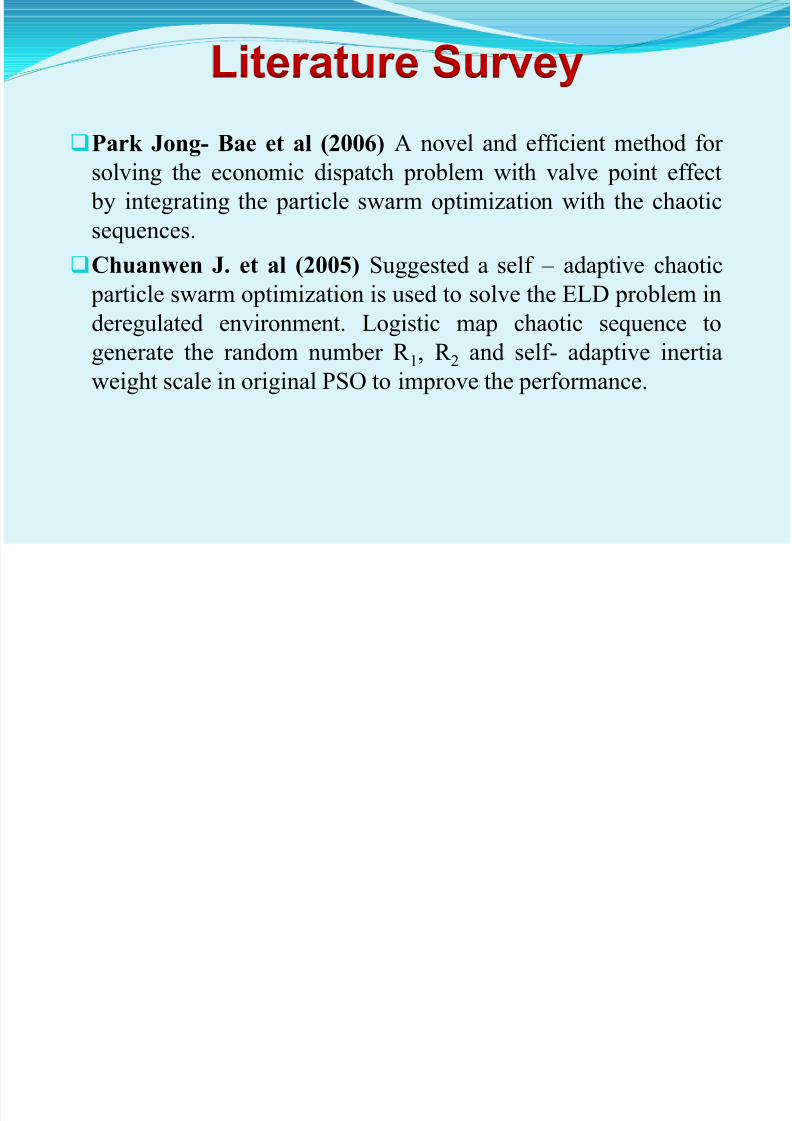
Park Jong- Bae et al (2006) A novel and efficient method forsolving the economic dispatch problem with valve point effect
by integrating the particle swarm optimization with the chaotic
sequences.
Chuanwen J. et al (2005) Suggested a self – adaptive chaotic particle swarm optimization is used to solve the ELD problem in
deregulated environment. Logistic map chaotic sequence to
generate the random number R 1, R 2 and self- adaptive inertia
weight scale in original PSO to improve the performance.
Literature Survey
8/10/2019 Nishant Final_1.pptx
http://slidepdf.com/reader/full/nishant-final1pptx 8/63
OBJECTIVE The main objective of study is to minimize generation cost using partical
swarn optimization (PSO) algorithm for the economic load dispatch (ELD) problem.
The purpose of the economic load dispatch (ELD) problem is to control the
committed generator’s output such that the total fuel cost is minimized,
while satisfying the power demand and other physical and operational
constraints.
To integrate PSO method with Chaotic map for solving ELD problem
having generated unit with non smooth cost function and multi-fuel.To maximize the power generation by proposing a PSO algorithm to
obtain the optimum scheduling of generator
8/10/2019 Nishant Final_1.pptx
http://slidepdf.com/reader/full/nishant-final1pptx 9/63
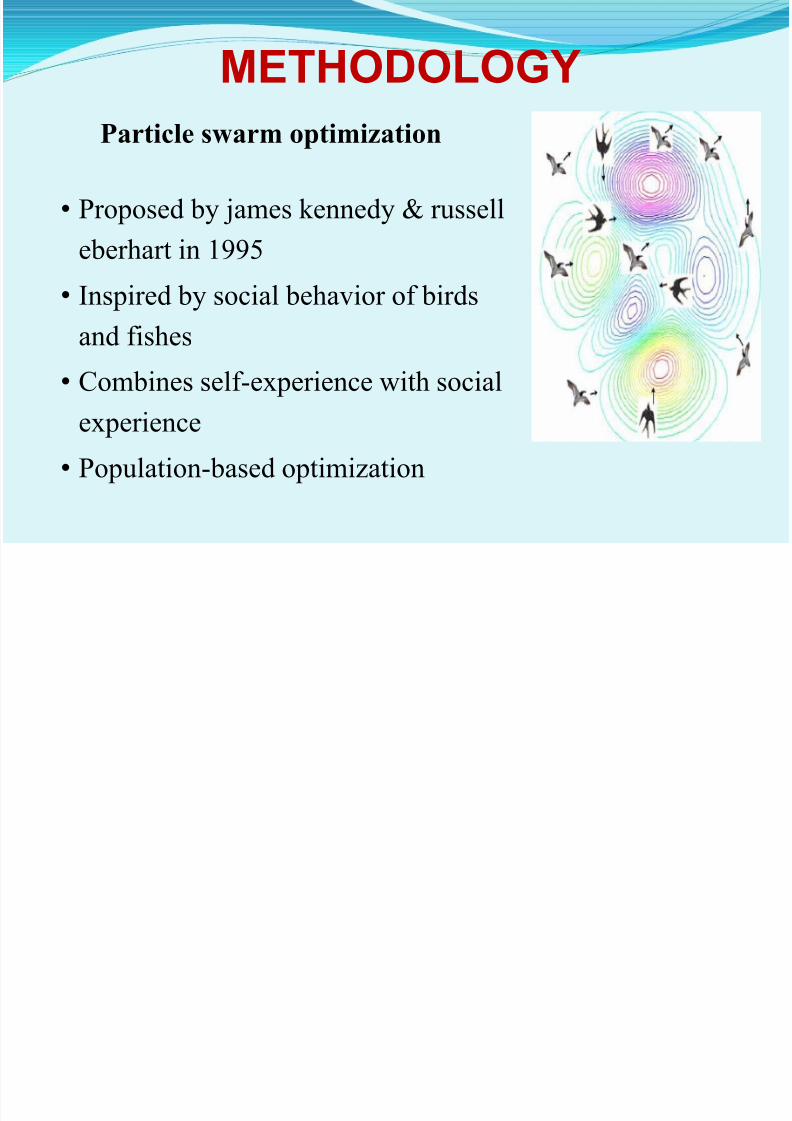
METHODOLOGY
Particle swarm optimization
• Proposed by james kennedy & russell
eberhart in 1995
• Inspired by social behavior of birds
and fishes
• Combines self-experience with social
experience
• Population-based optimization
8/10/2019 Nishant Final_1.pptx
http://slidepdf.com/reader/full/nishant-final1pptx 10/63
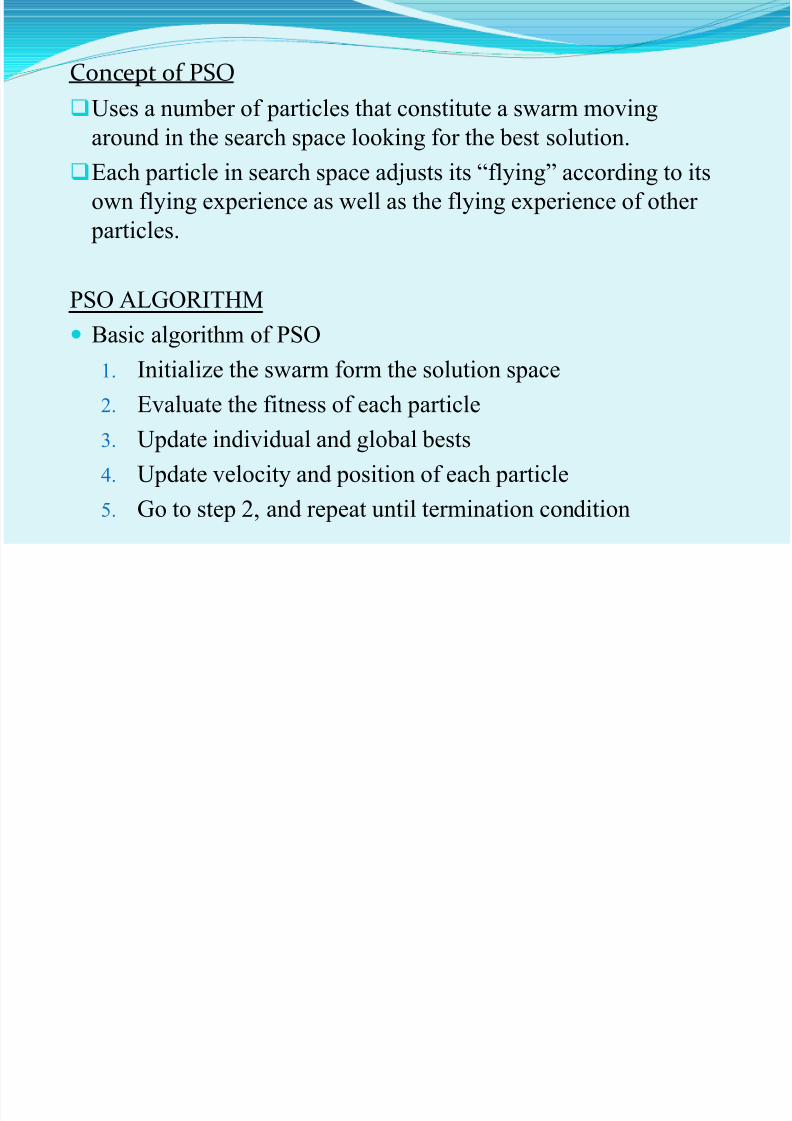
Concept of PSO
Uses a number of particles that constitute a swarm moving
around in the search space looking for the best solution.Each particle in search space adjusts its “flying” according to its
own flying experience as well as the flying experience of other
particles.
PSO ALGORITHM
Basic algorithm of PSO
1. Initialize the swarm form the solution space
2.Evaluate the fitness of each particle
3. Update individual and global bests
4. Update velocity and position of each particle
5. Go to step 2, and repeat until termination condition
8/10/2019 Nishant Final_1.pptx
http://slidepdf.com/reader/full/nishant-final1pptx 11/63
8/10/2019 Nishant Final_1.pptx
http://slidepdf.com/reader/full/nishant-final1pptx 12/63
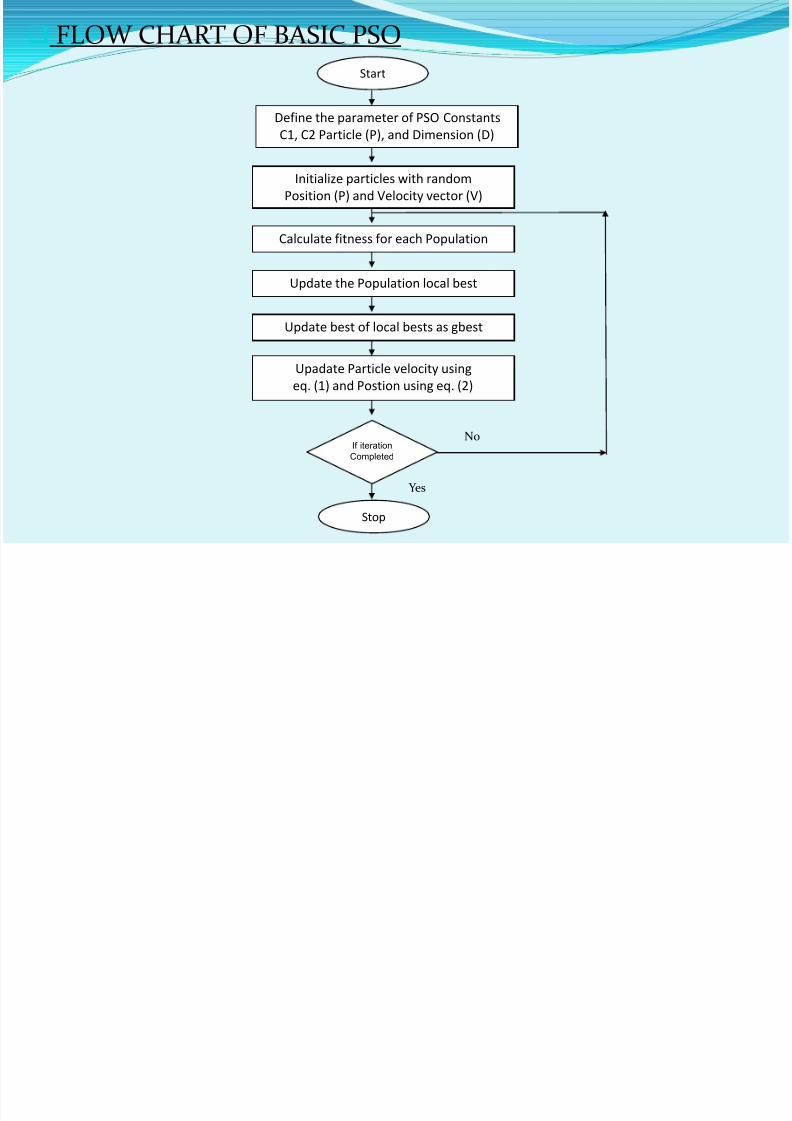
FLOW CHART OF BASIC PSO
Start
Define the parameter of PSO Constants
C1, C2 Particle (P), and Dimension (D)
Initialize particles with random
Position (P) and Velocity vector (V)
Calculate fitness for each Population
Update the Population local best
Update best of local bests as gbest
Upadate Particle velocity using
eq. (1) and Postion using eq. (2)
If iteration
Completed
Stop
No
Yes
8/10/2019 Nishant Final_1.pptx
http://slidepdf.com/reader/full/nishant-final1pptx 13/63
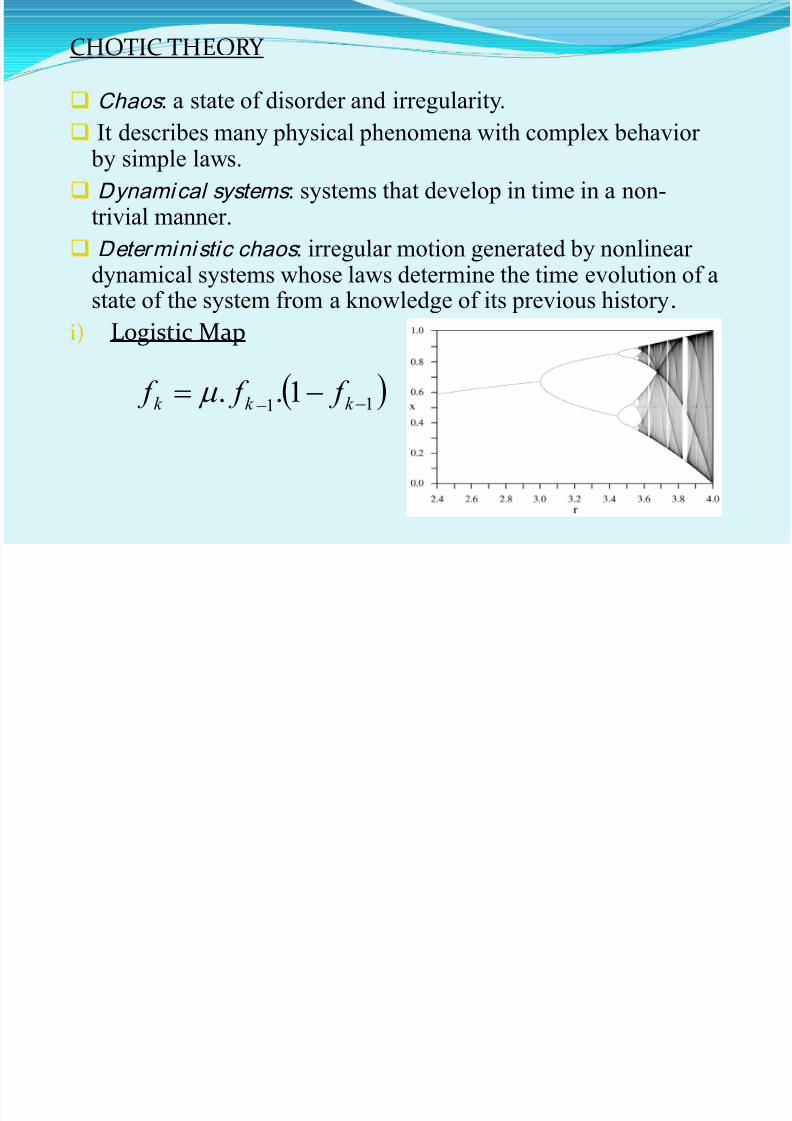
CHOTIC THEORY
Chaos : a state of disorder and irregularity.
It describes many physical phenomena with complex behavior by simple laws.
Dynamical systems : systems that develop in time in a non-trivial manner.
Determini stic chaos : irregular motion generated by nonlinear
dynamical systems whose laws determine the time evolution of astate of the system from a knowledge of its previous history.
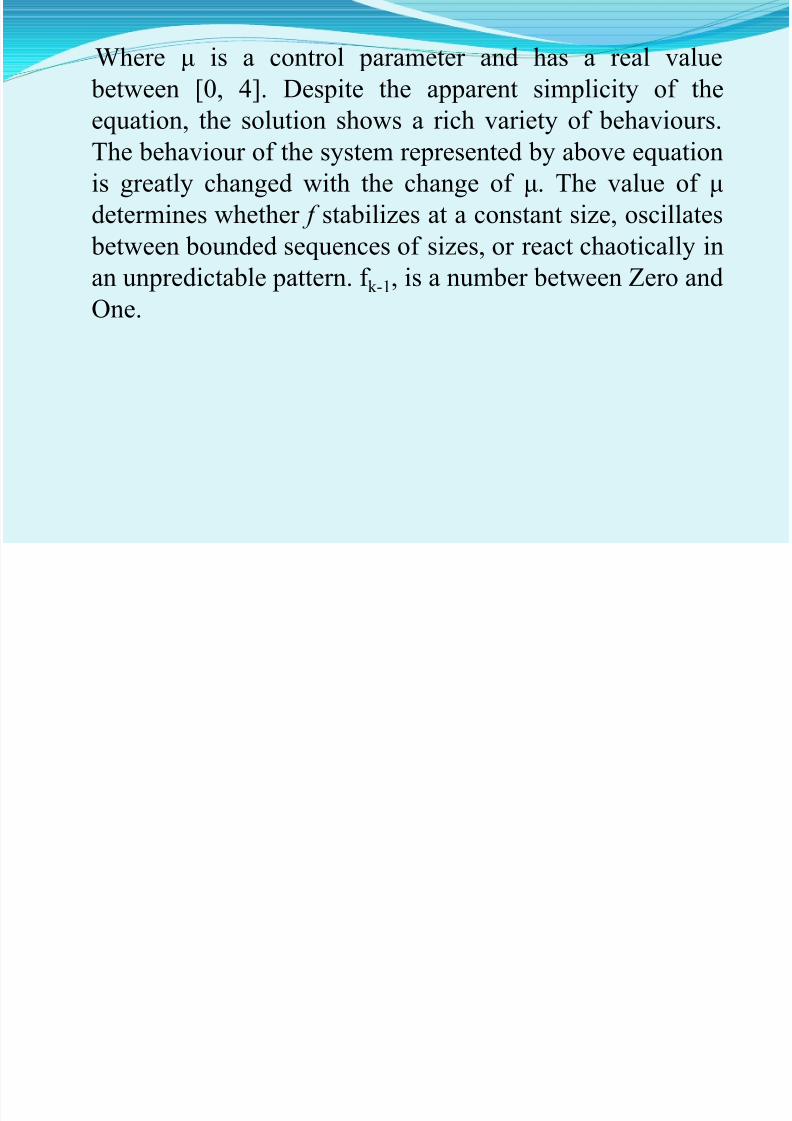
i) Logistic Map
11 1..
k k k f f f
8/10/2019 Nishant Final_1.pptx
http://slidepdf.com/reader/full/nishant-final1pptx 14/63
8/10/2019 Nishant Final_1.pptx
http://slidepdf.com/reader/full/nishant-final1pptx 15/63
ii) Lozi map
Lozi introduced in a short note, a two-dimensional map the
equations and attractors of which resemble those of the
celebrated h´enon map. Simply, a quadratic term in the
latter is replaced with a piecewise linear contribution in the
former. This allows one to rigorously prove the chaotic
character of some attractors. The lozi map is depicted in fig.The map equations are given below. The parameters used in
this work are: a=1.7 and b=0.5.
nnn
bY X a X
||11
nn X Y 1
8/10/2019 Nishant Final_1.pptx
http://slidepdf.com/reader/full/nishant-final1pptx 16/63
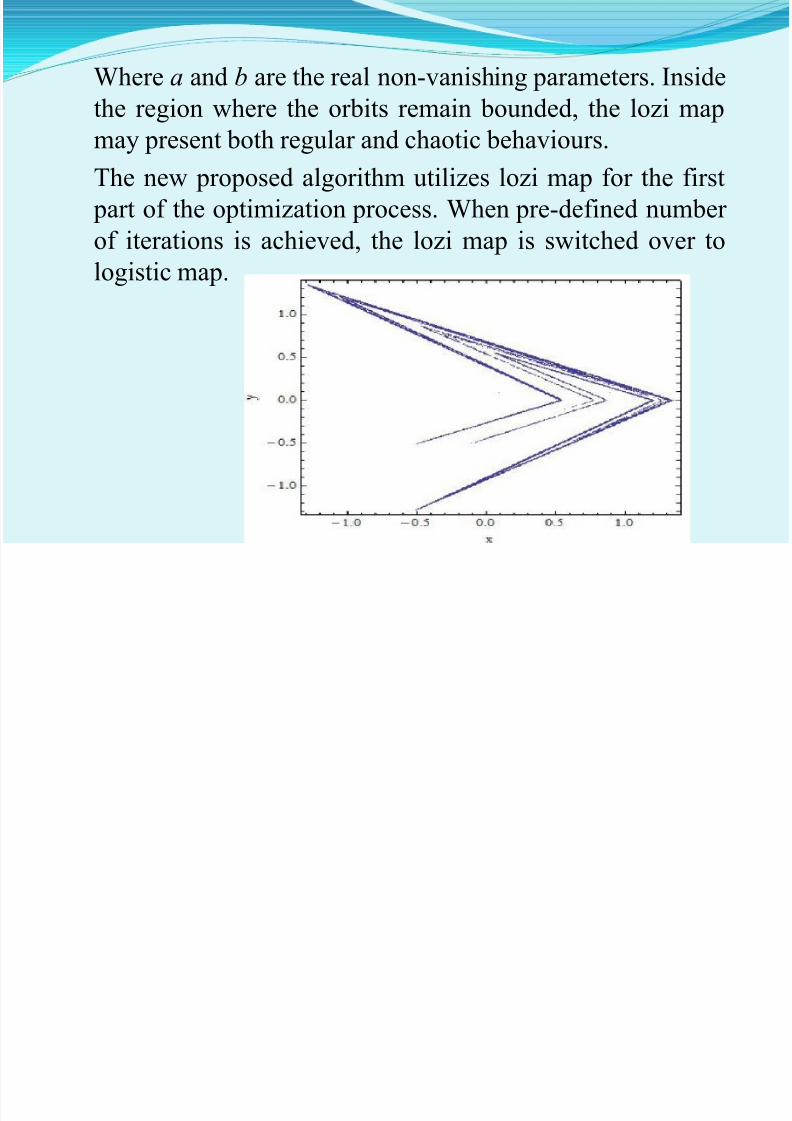
Where a and b are the real non-vanishing parameters. Inside
the region where the orbits remain bounded, the lozi map
may present both regular and chaotic behaviours.The new proposed algorithm utilizes lozi map for the first
part of the optimization process. When pre-defined number
of iterations is achieved, the lozi map is switched over to
logistic map.
8/10/2019 Nishant Final_1.pptx
http://slidepdf.com/reader/full/nishant-final1pptx 17/63
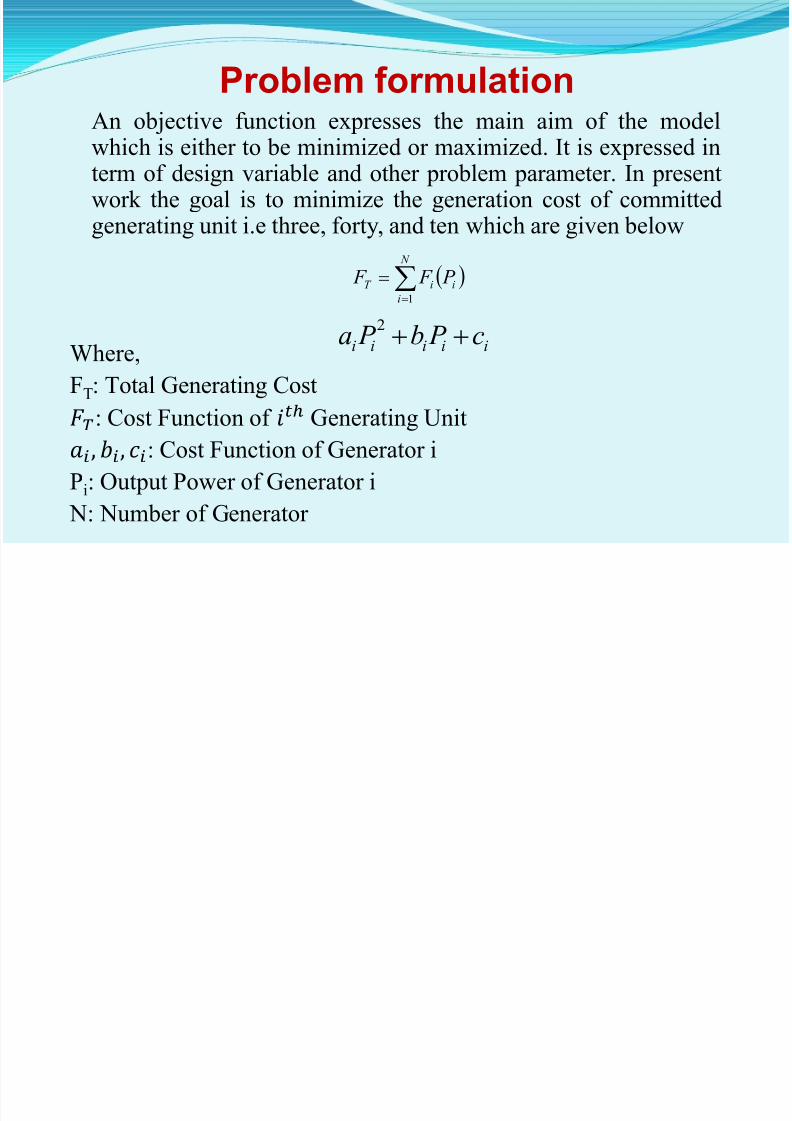
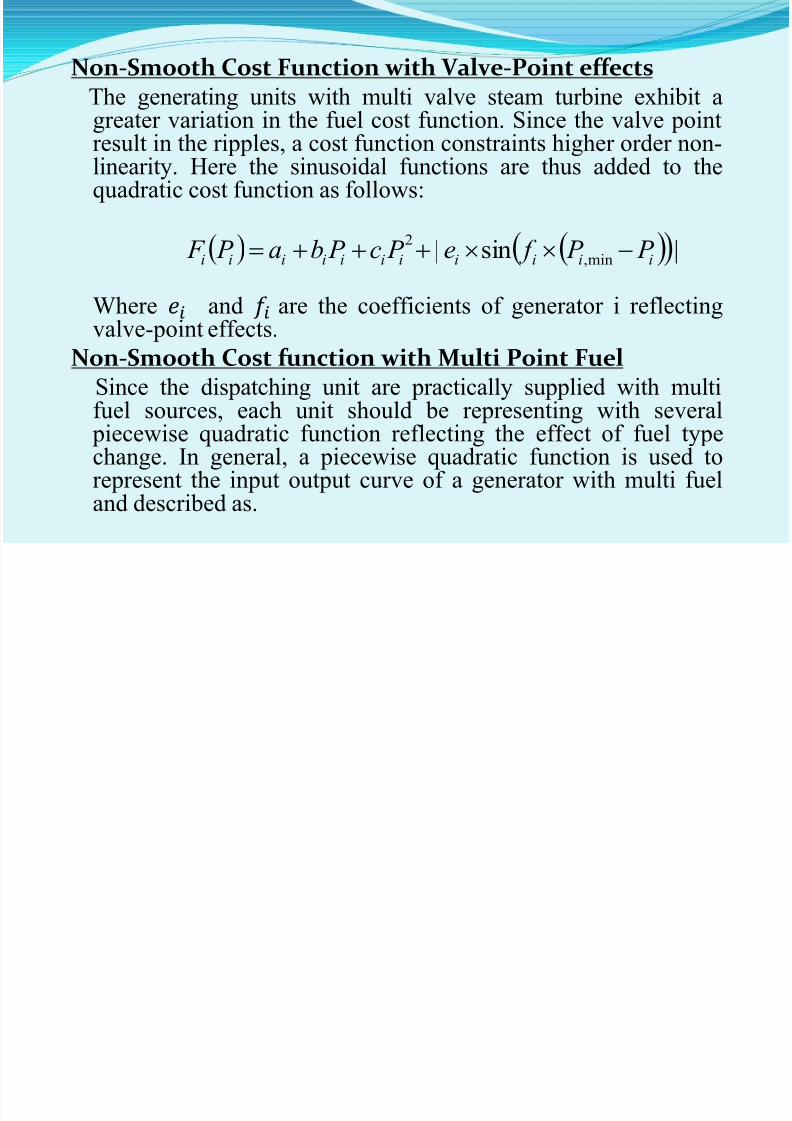
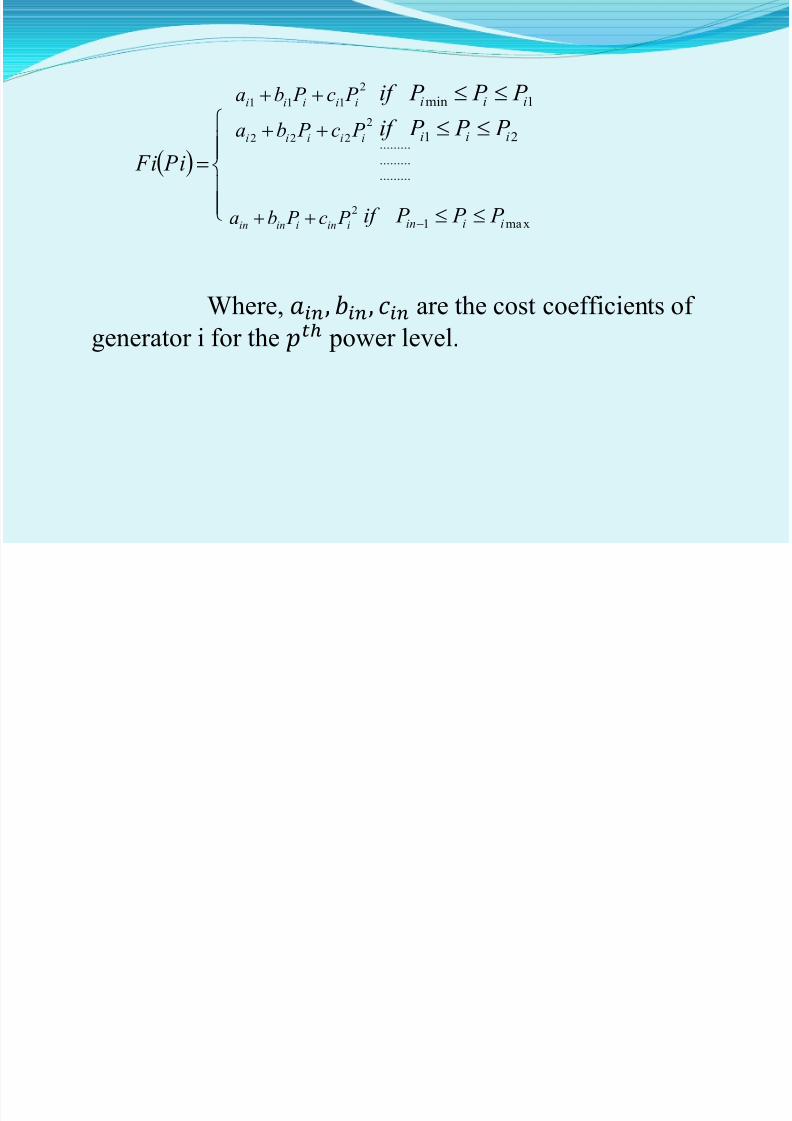
Problem formulation An objective function expresses the main aim of the model
which is either to be minimized or maximized. It is expressed interm of design variable and other problem parameter. In presentwork the goal is to minimize the generation cost of committedgenerating unit i.e three, forty, and ten which are given below
Where,
FT: Total Generating Cost
: Cost Function of ℎ Generating Unit , , : Cost Function of Generator i
Pi: Output Power of Generator i
N: Number of Generator
N
iiiT P F F
1
iiiii c P b P a 2
8/10/2019 Nishant Final_1.pptx
http://slidepdf.com/reader/full/nishant-final1pptx 18/63
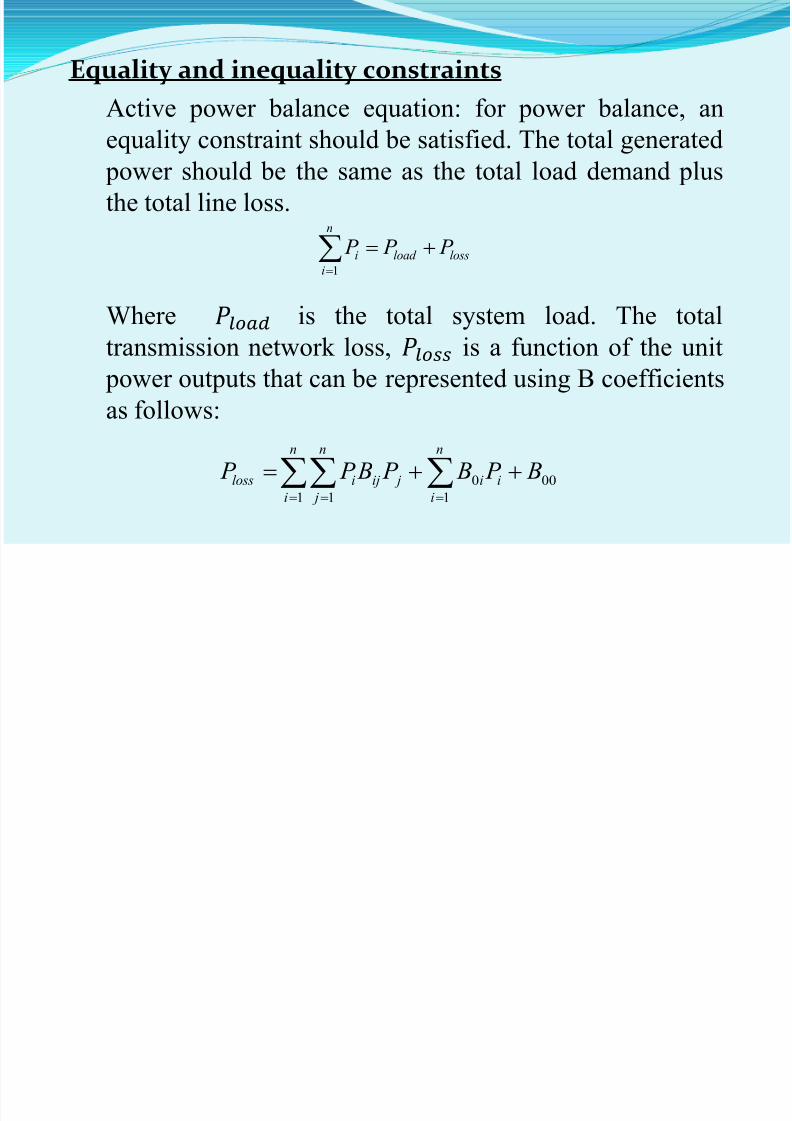
Equality and inequality constraints
Active power balance equation: for power balance, an
equality constraint should be satisfied. The total generated power should be the same as the total load demand plus
the total line loss.
Where is the total system load. The total
transmission network loss, is a function of the unit
power outputs that can be represented using B coefficients
as follows:
n
i
lossload i P P P 1
n
i
n
j
n
i
ii jijiloss B P B P B P P 1 1 1
000
8/10/2019 Nishant Final_1.pptx
http://slidepdf.com/reader/full/nishant-final1pptx 19/63
8/10/2019 Nishant Final_1.pptx
http://slidepdf.com/reader/full/nishant-final1pptx 20/63
8/10/2019 Nishant Final_1.pptx
http://slidepdf.com/reader/full/nishant-final1pptx 21/63
8/10/2019 Nishant Final_1.pptx
http://slidepdf.com/reader/full/nishant-final1pptx 22/63
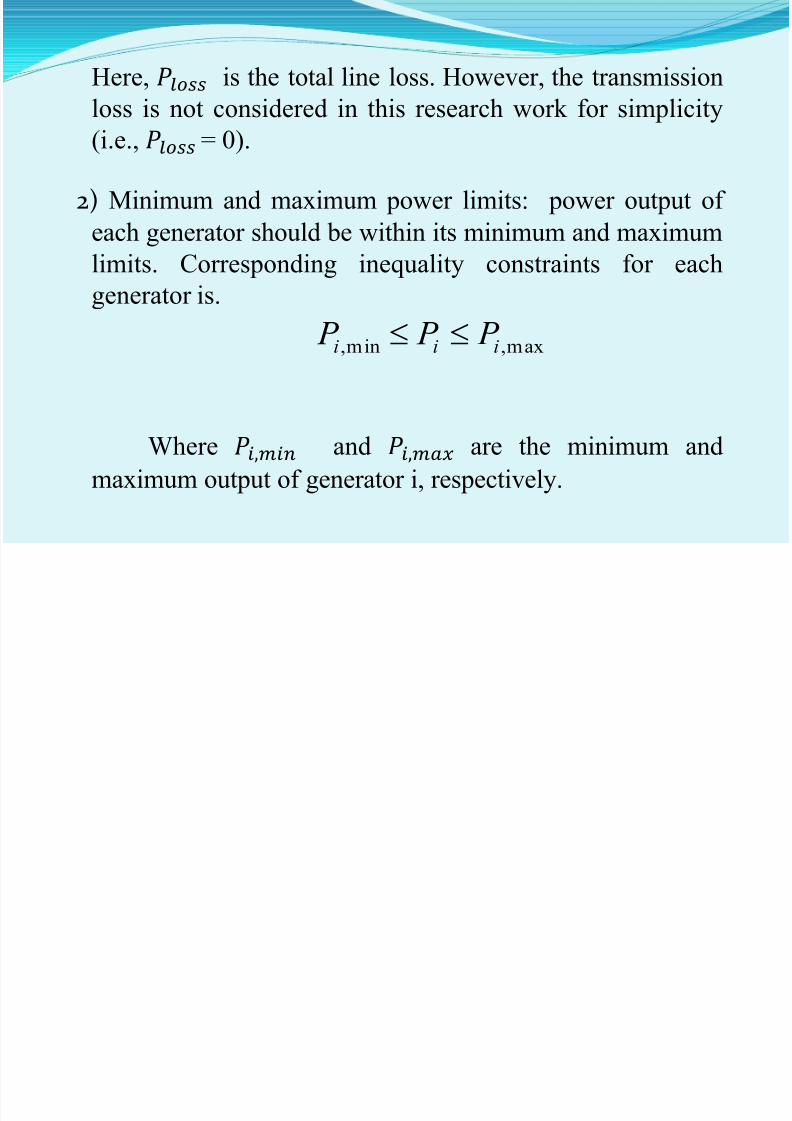
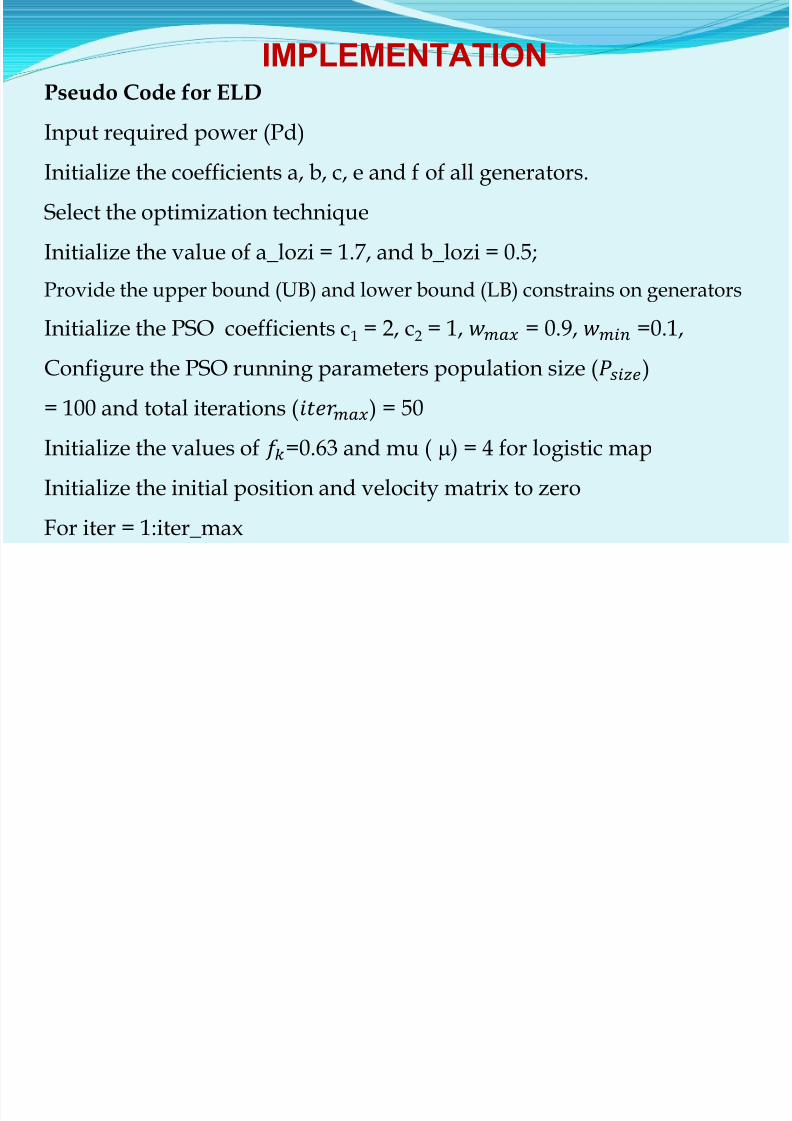
IMPLEMENTATION Pseudo Code for ELD
Input required power (Pd)Initialize the coefficients a, b, c, e and f of all generators.
Select the optimization technique
Initialize the value of a_lozi = 1.7, and b_lozi = 0.5;
Provide the upper bound (UB) and lower bound (LB) constrains on generators
Initialize the PSO coefficients c1 = 2, c2 = 1, = 0.9, =0.1,
Configure the PSO running parameters population size ()
= 100 and total iterations (
) = 50Initialize the values of =0.63 and mu ( ) = 4 for logistic map
Initialize the initial position and velocity matrix to zero
For iter = 1:iter_max
8/10/2019 Nishant Final_1.pptx
http://slidepdf.com/reader/full/nishant-final1pptx 23/63
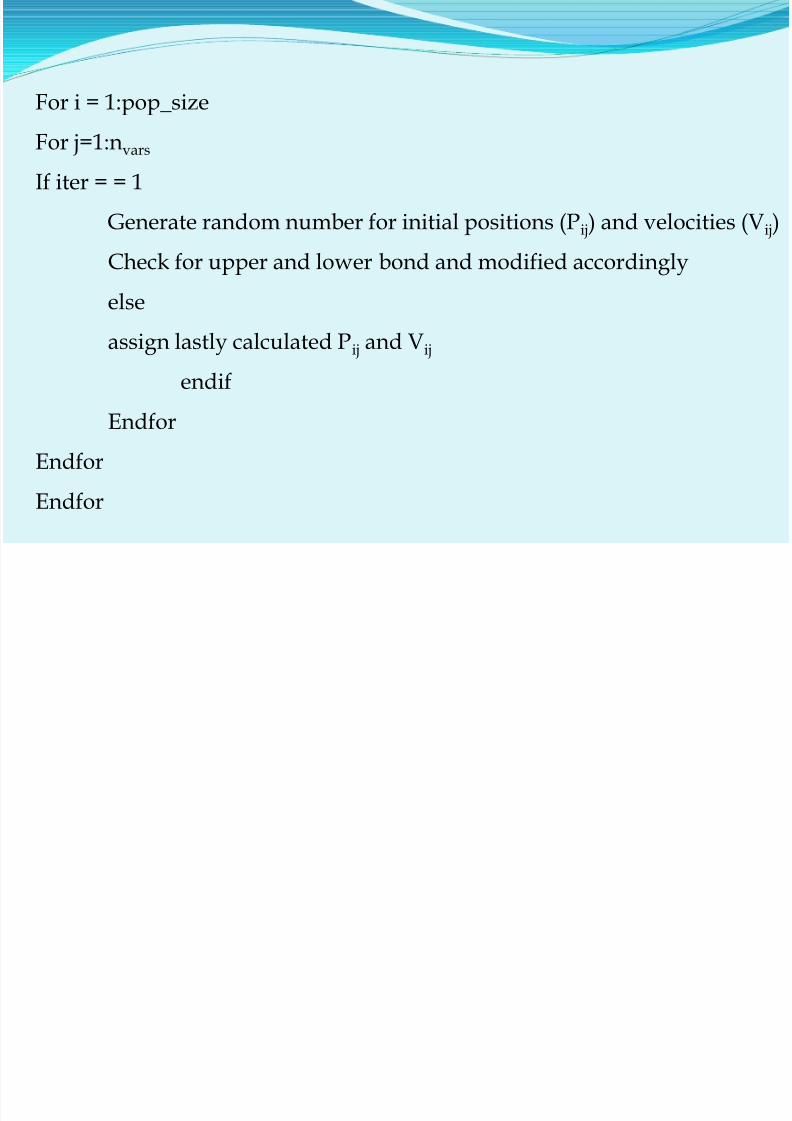
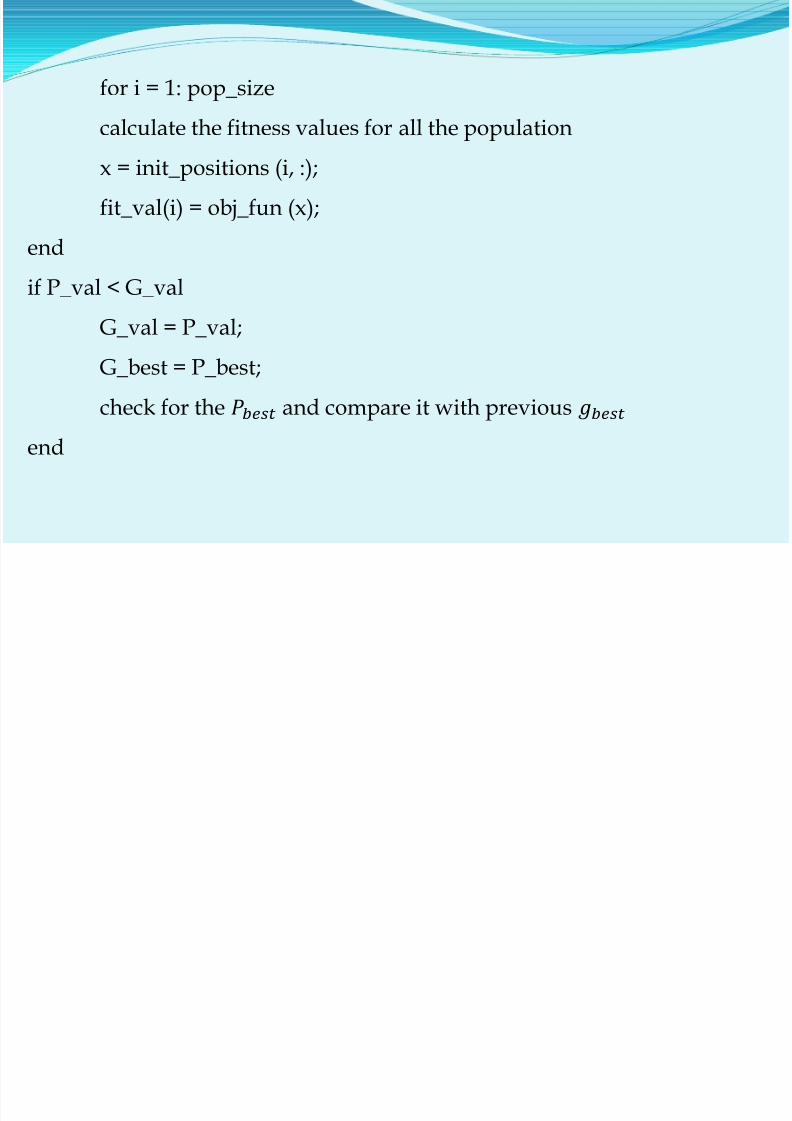
For i = 1:pop_size
For j=1:nvars
If iter = = 1
Generate random number for initial positions (Pij) and velocities (Vij)
Check for upper and lower bond and modified accordingly
else
assign lastly calculated Pij and Vij
endif
Endfor
Endfor
Endfor
8/10/2019 Nishant Final_1.pptx
http://slidepdf.com/reader/full/nishant-final1pptx 24/63
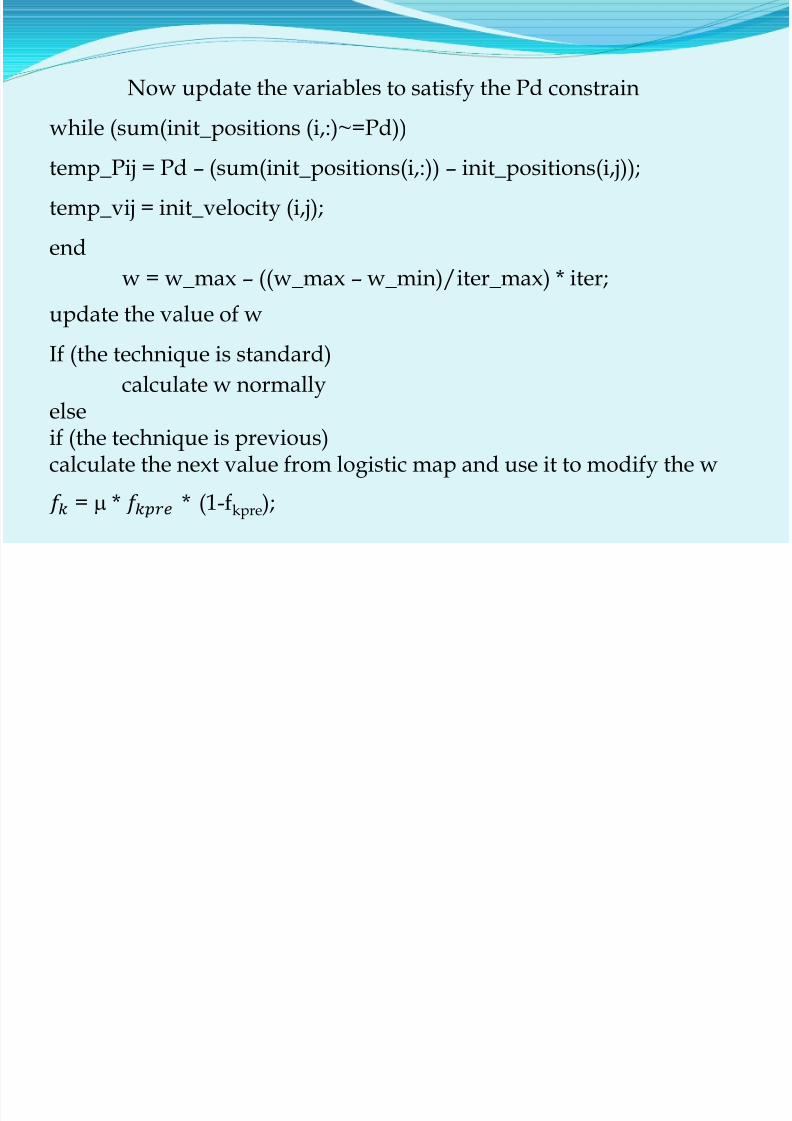
Now update the variables to satisfy the Pd constrain
while (sum(init_positions (i,:)~=Pd))
temp_Pij = Pd – (sum(init_positions(i,:)) – init_positions(i,j));
temp_vij = init_velocity (i,j);
end
w = w_max– ((w_max
– w_min)/iter_max) * iter;
update the value of w
If (the technique is standard)
calculate w normally
elseif (the technique is previous)calculate the next value from logistic map and use it to modify the w
= * * (1-fkpre);
8/10/2019 Nishant Final_1.pptx
http://slidepdf.com/reader/full/nishant-final1pptx 25/63
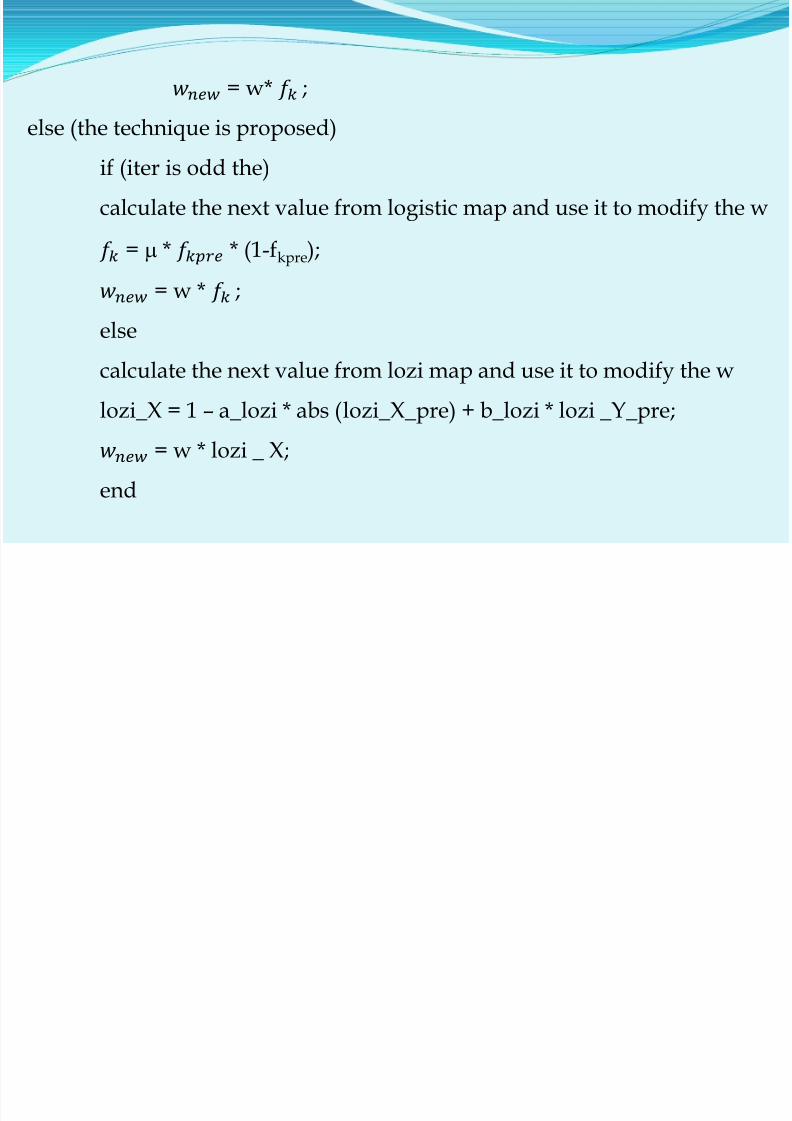
= w* ;
else (the technique is proposed)
if (iter is odd the)
calculate the next value from logistic map and use it to modify the w
= * * (1-fkpre);
= w * ;
else
calculate the next value from lozi map and use it to modify the w
lozi_X = 1–
a_lozi * abs (lozi_X_pre) + b_lozi * lozi _Y_pre; = w * lozi _ X;
end
8/10/2019 Nishant Final_1.pptx
http://slidepdf.com/reader/full/nishant-final1pptx 26/63

8/10/2019 Nishant Final_1.pptx
http://slidepdf.com/reader/full/nishant-final1pptx 27/63
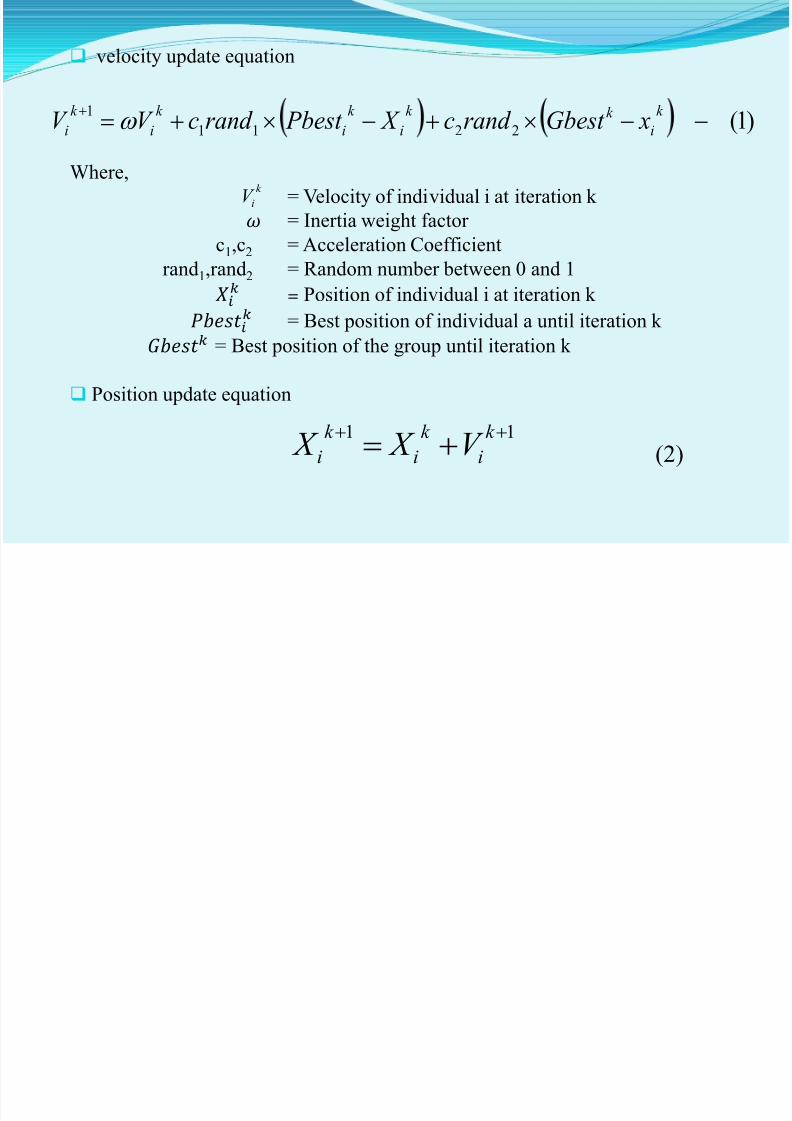
init_velocity = w_new * init_velocity + c1 * rand * ( – init_positions)+c2
* rand * ( – init_positions);
calculate the new velocity and positions for all the population and repeat
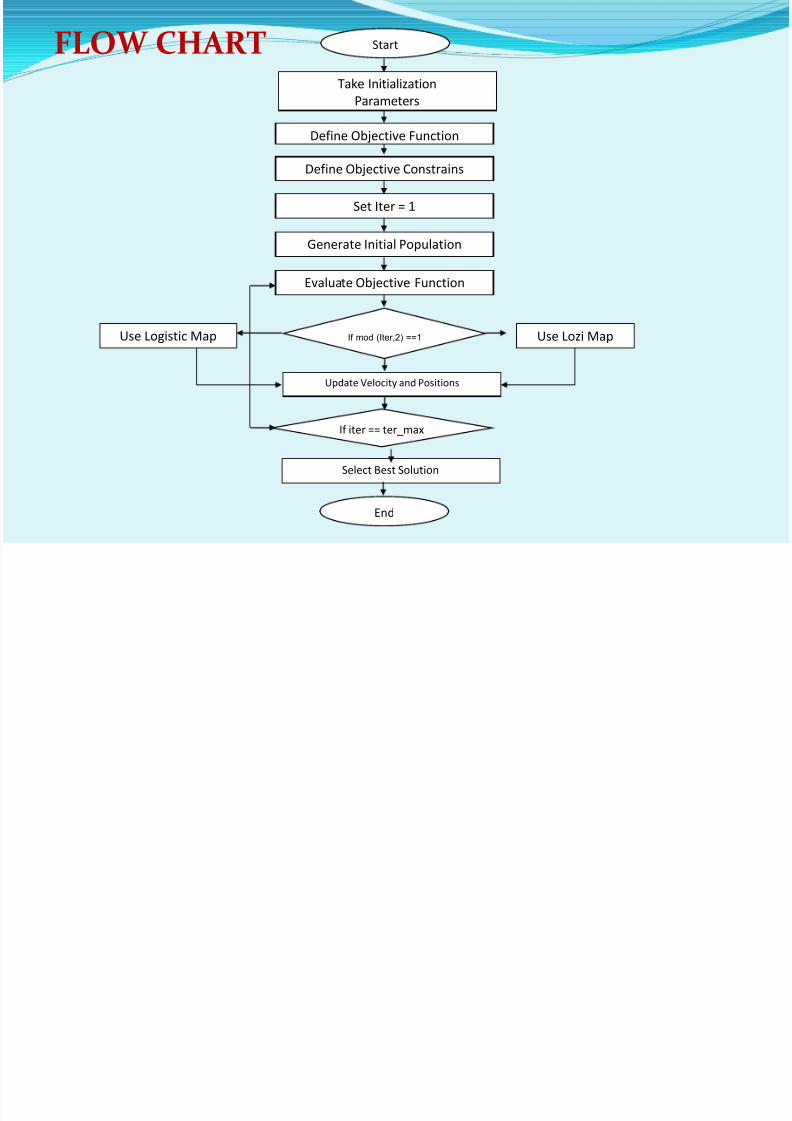
FLOW CHART
8/10/2019 Nishant Final_1.pptx
http://slidepdf.com/reader/full/nishant-final1pptx 28/63
Start
If mod (Iter,2) ==1
End
Take Initialization
Parameters
Define Objective Function
Define Objective Constrains
Set Iter = 1
Generate Initial Population
Evaluate Objective Function
Use Lozi Map Use Logistic Map
Update Velocity and Positions
Select Best Solution
If iter == ter_max
FLOW CHART
RESULTS & DISCUSSION
8/10/2019 Nishant Final_1.pptx
http://slidepdf.com/reader/full/nishant-final1pptx 29/63
RESULTS & DISCUSSION
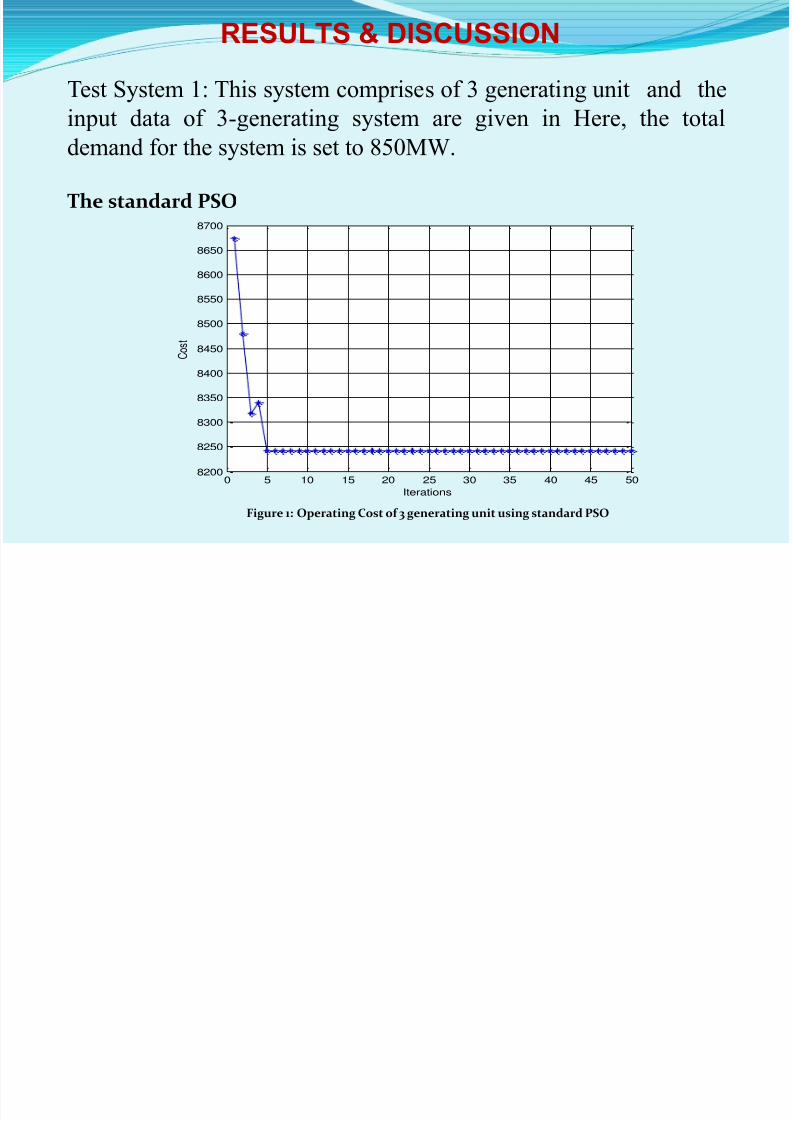
Test System 1: This system comprises of 3 generating unit and the
input data of 3-generating system are given in Here, the total
demand for the system is set to 850MW.
The standard PSO
0 5 10 15 20 25 30 35 40 45 508200
8250
8300
8350
8400
8450
8500
8550
8600
8650
8700
Iterations
C o s t
Figure 1: Operating Cost of 3 generating unit using standard PSO
8/10/2019 Nishant Final_1.pptx
http://slidepdf.com/reader/full/nishant-final1pptx 30/63
8/10/2019 Nishant Final_1.pptx
http://slidepdf.com/reader/full/nishant-final1pptx 31/63
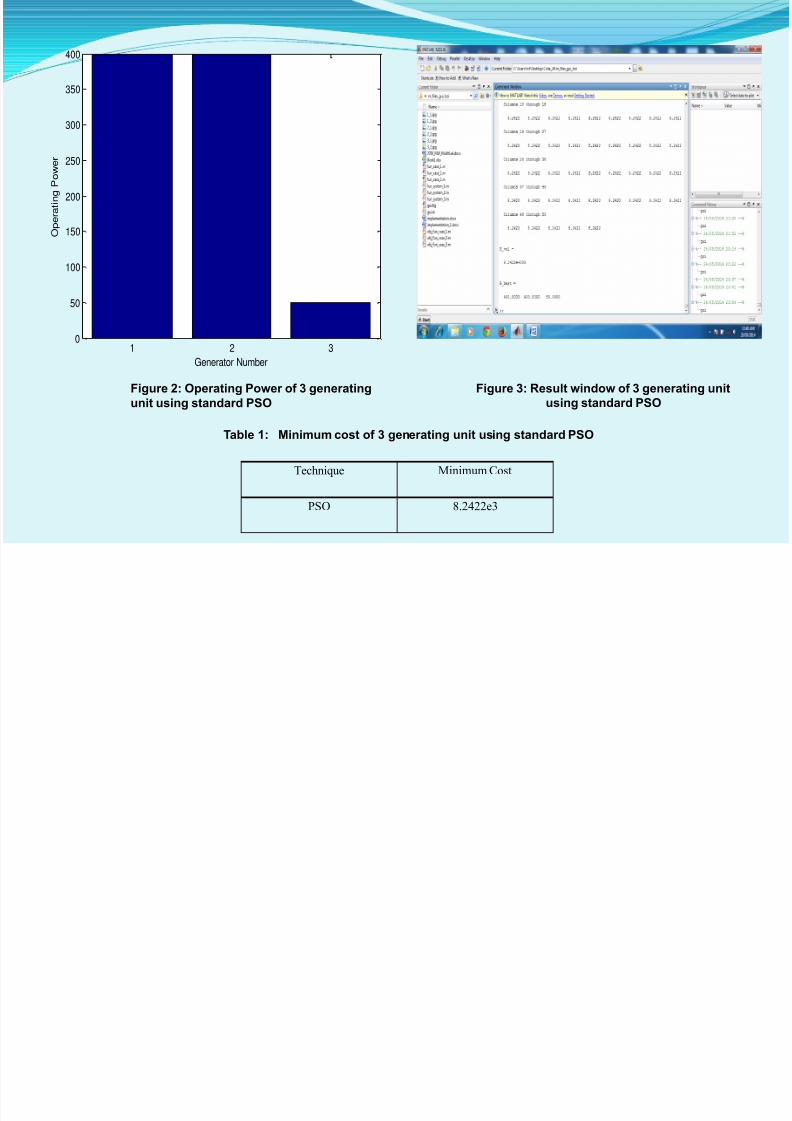
400
8/10/2019 Nishant Final_1.pptx
http://slidepdf.com/reader/full/nishant-final1pptx 32/63
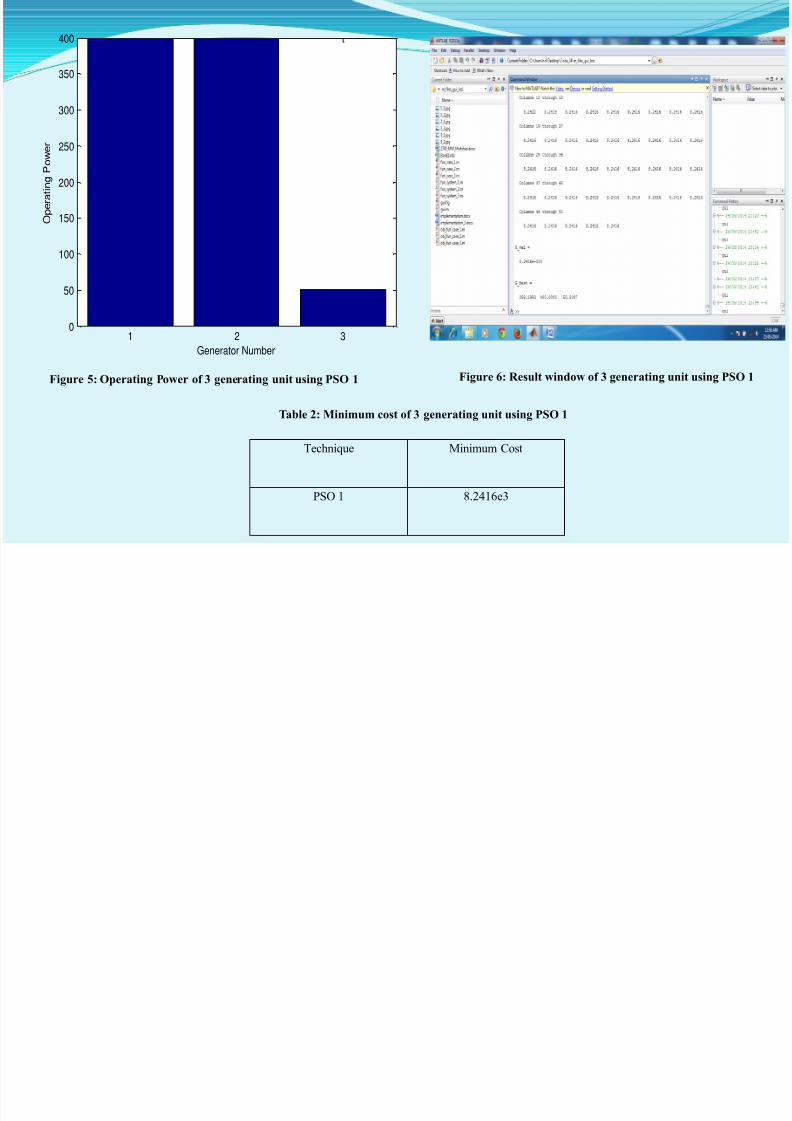
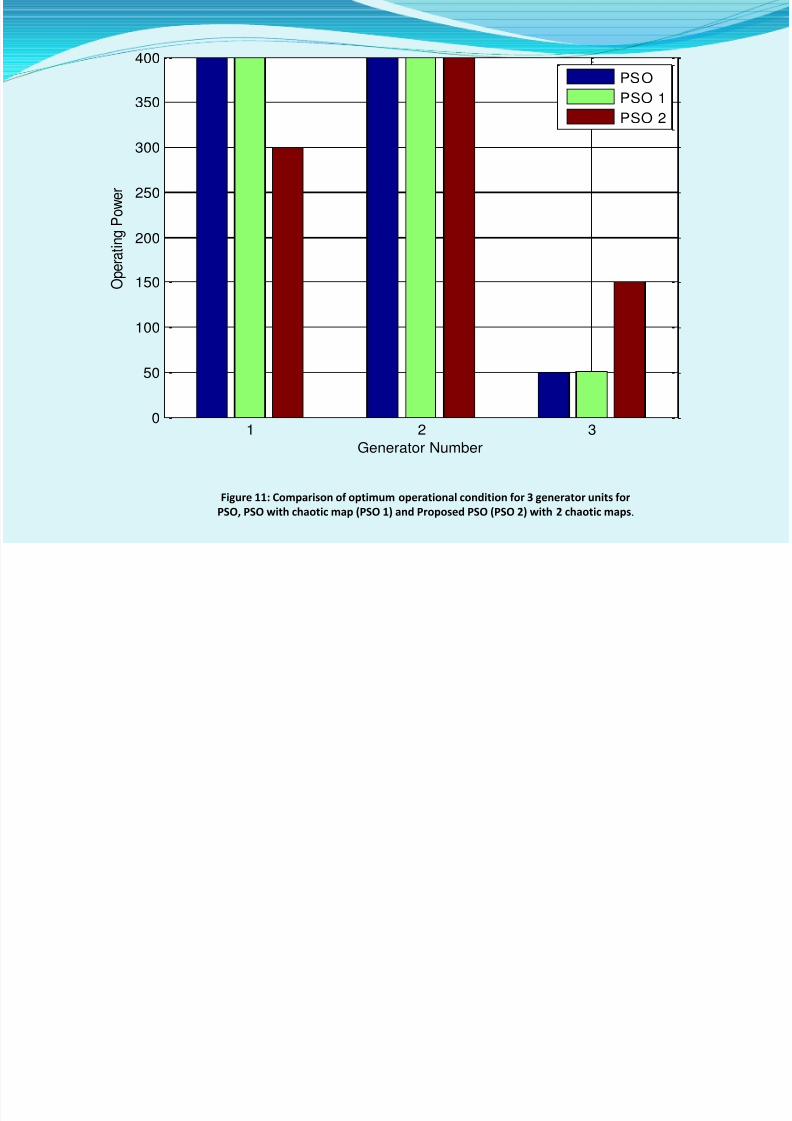
1 2 30
50
100
150
200
250
300
350
400
Generator Number
O p e r a t i n g P o w e r
Figure 5: Operating Power of 3 generating unit using PSO 1
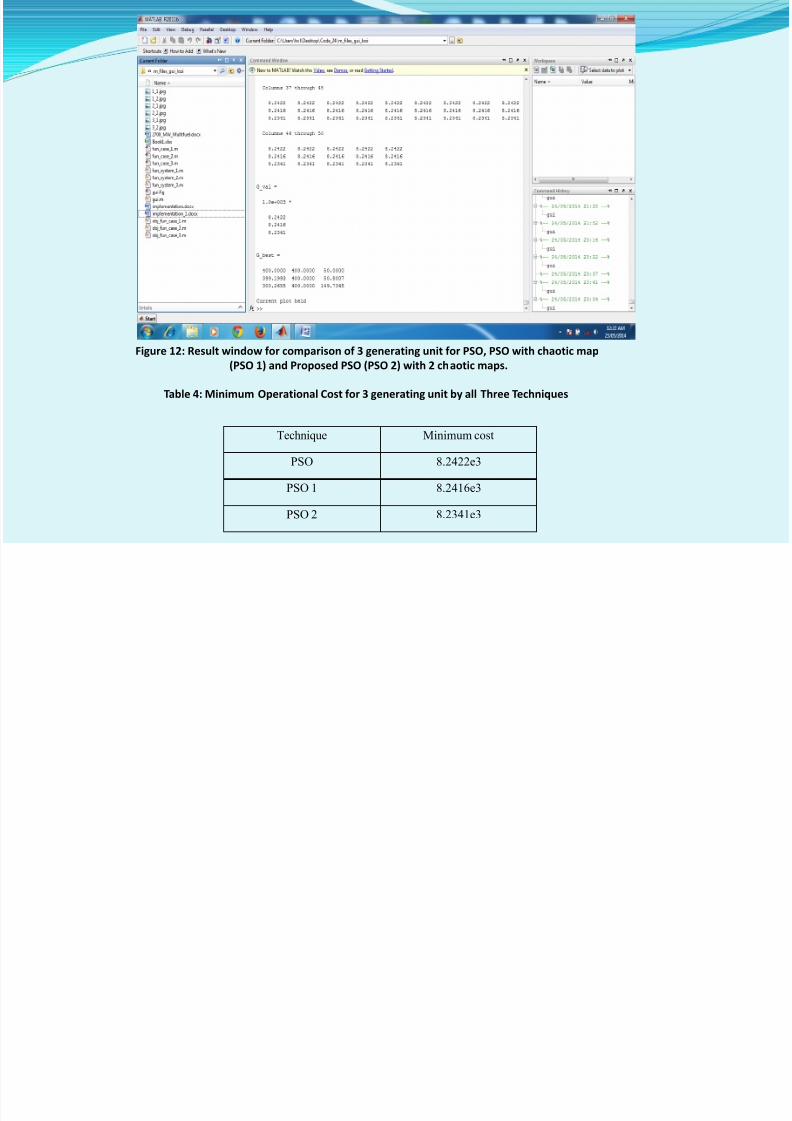
Technique Minimum Cost
PSO 1 8.2416e3
Figure 6: Result window of 3 generating unit using PSO 1
Table 2: Minimum cost of 3 generating unit using PSO 1
8/10/2019 Nishant Final_1.pptx
http://slidepdf.com/reader/full/nishant-final1pptx 33/63
400
8/10/2019 Nishant Final_1.pptx
http://slidepdf.com/reader/full/nishant-final1pptx 34/63
1 2 30
50
100
150
200
250
300
350
400
Generator Number
O p e r a t i n g P o w e r
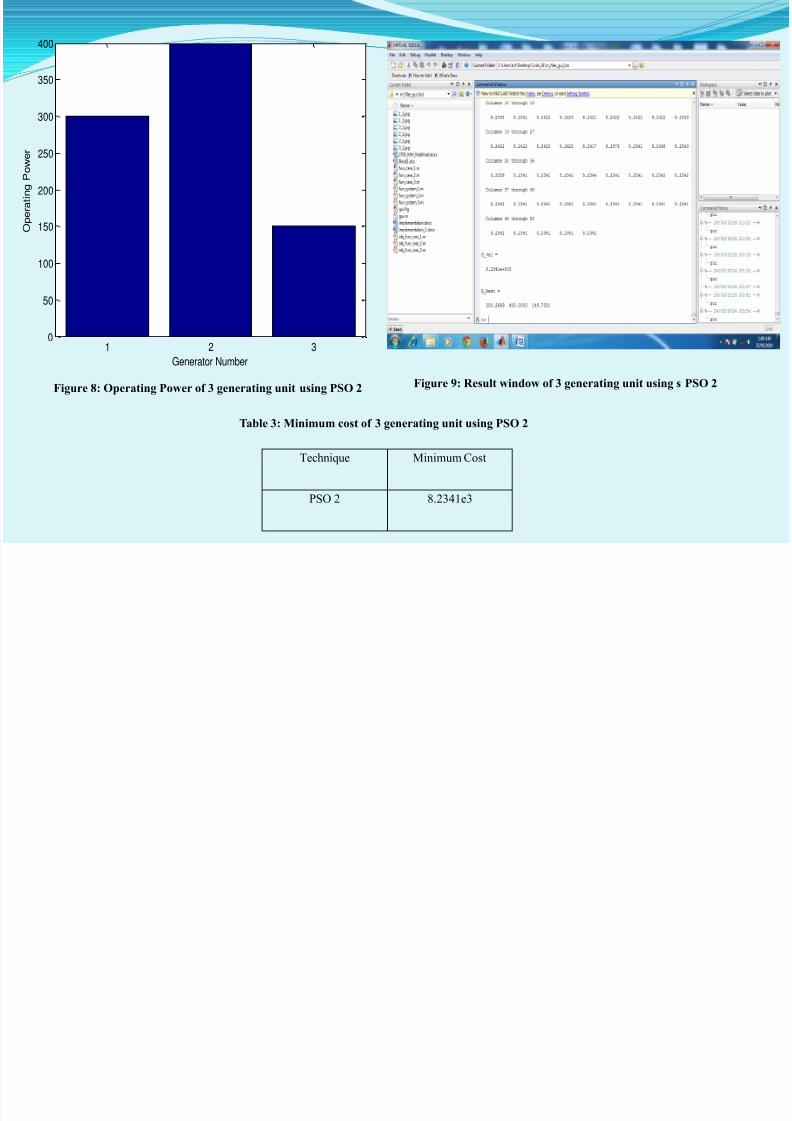
Figure 8: Operating Power of 3 generating unit using PSO 2
Technique Minimum Cost
PSO 2 8.2341e3
Figure 9: Result window of 3 generating unit using s PSO 2
Table 3: Minimum cost of 3 generating unit using PSO 2
8/10/2019 Nishant Final_1.pptx
http://slidepdf.com/reader/full/nishant-final1pptx 35/63
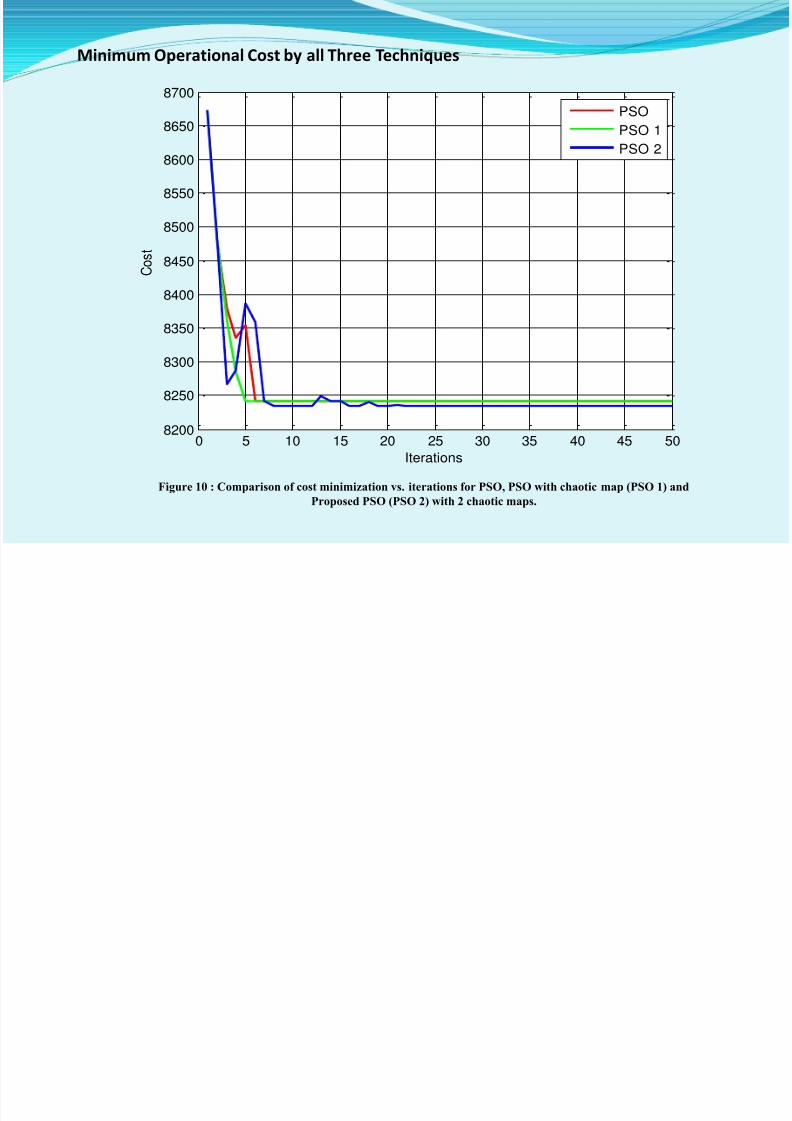
Minimum Operational Cost by all Three Techniques
0 5 10 15 20 25 30 35 40 45 508200
8250
8300
8350
8400
8450
8500
8550
8600
8650
8700
Iterations
C o s t
PSO
PSO 1
PSO 2
Figure 10 : Comparison of cost minimization vs. iterations for PSO, PSO with chaotic map (PSO 1) and
Proposed PSO (PSO 2) with 2 chaotic maps.
8/10/2019 Nishant Final_1.pptx
http://slidepdf.com/reader/full/nishant-final1pptx 36/63
8/10/2019 Nishant Final_1.pptx
http://slidepdf.com/reader/full/nishant-final1pptx 37/63
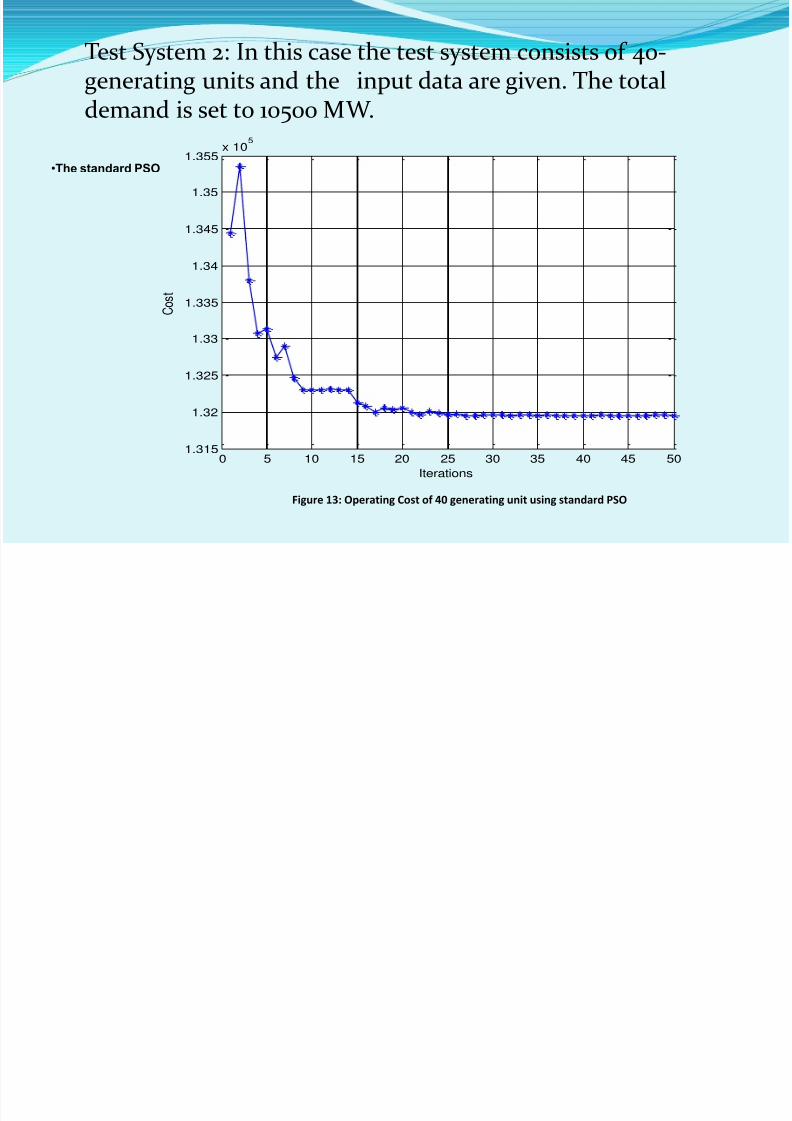
Test System 2: In this case the test system consists of 40
8/10/2019 Nishant Final_1.pptx
http://slidepdf.com/reader/full/nishant-final1pptx 38/63
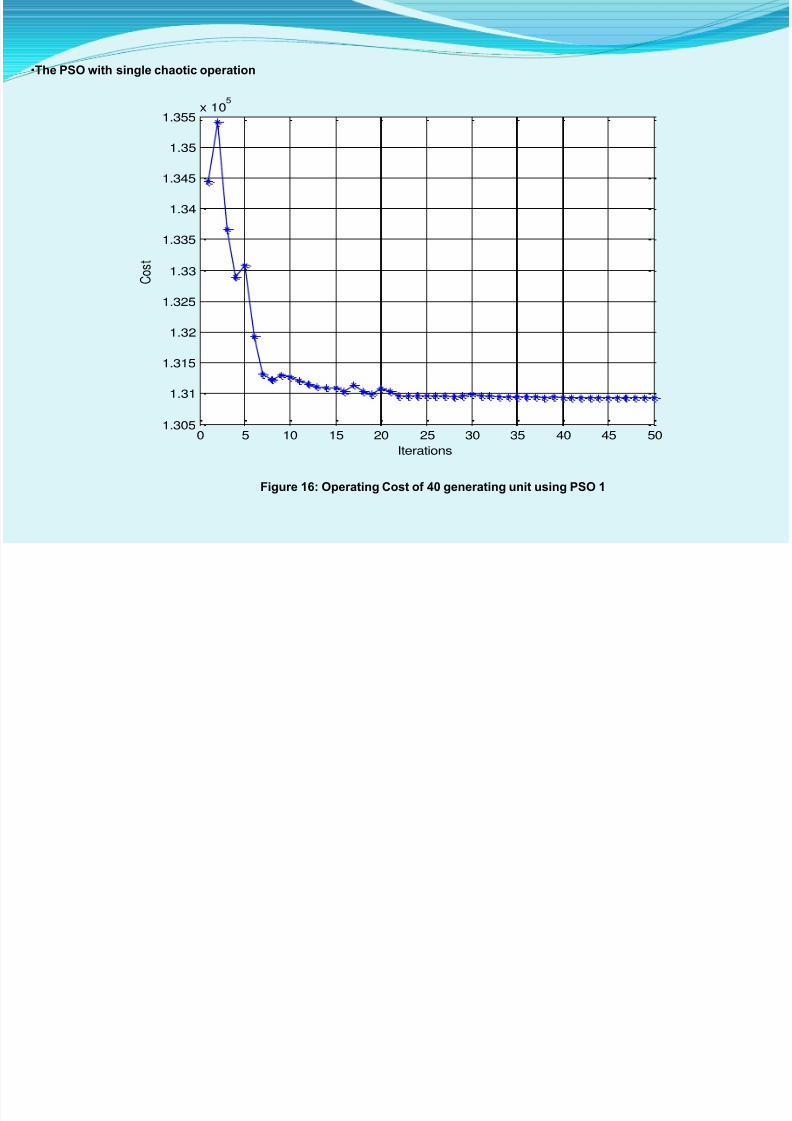
Test System 2: In this case the test system consists of 40-generating units and the input data are given. The totaldemand is set to 10500 MW.
•The standard PSO
0 5 10 15 20 25 30 35 40 45 501.315
1.32
1.325
1.33
1.335
1.34
1.345
1.35
1.355 x 10
5
Iterations
C o s t
Figure 13: Operating Cost of 40 generating unit using standard PSO
600
8/10/2019 Nishant Final_1.pptx
http://slidepdf.com/reader/full/nishant-final1pptx 39/63
0 5 10 15 20 25 30 35 40 450
100
200
300
400
500
Generator Number
O p e r a t i n g P o w e r
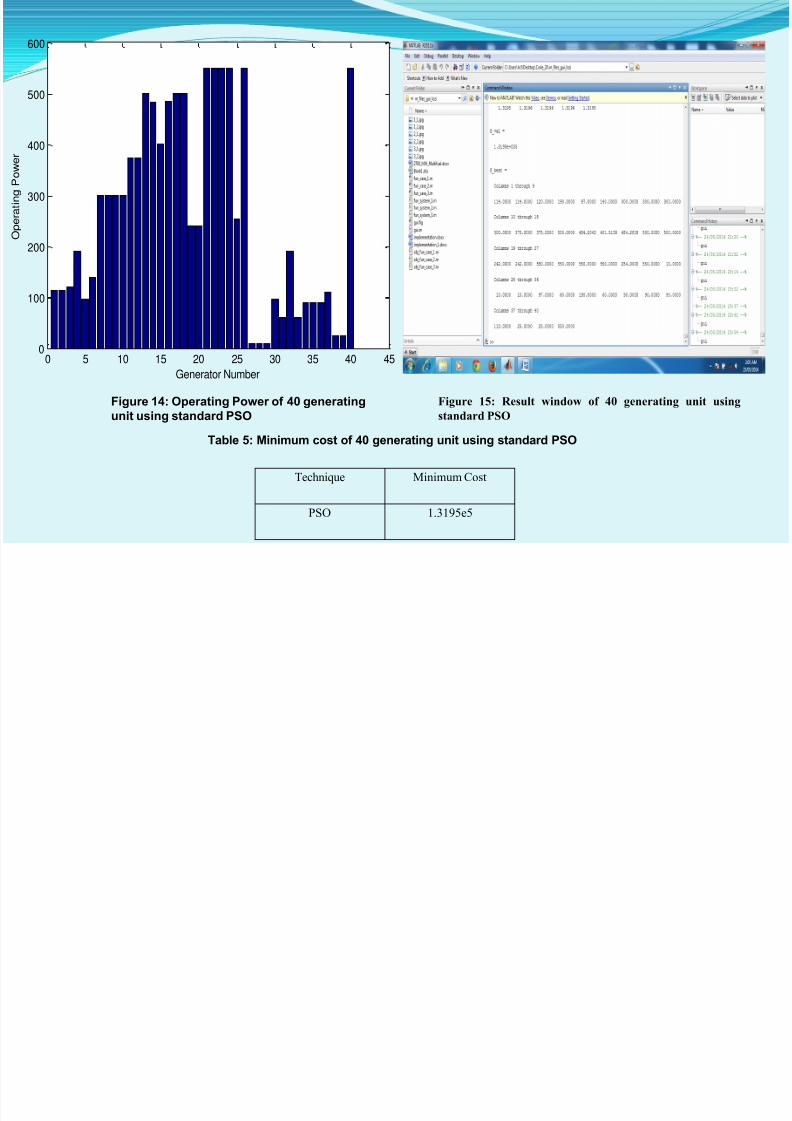
Figure 14: Operating Power of 40 generating
unit using standard PSO
Figure 15: Result window of 40 generating unit using
standard PSO
Table 5: Minimum cost of 40 generating unit using standard PSO
Technique Minimum Cost
PSO 1.3195e5
8/10/2019 Nishant Final_1.pptx
http://slidepdf.com/reader/full/nishant-final1pptx 40/63
600
8/10/2019 Nishant Final_1.pptx
http://slidepdf.com/reader/full/nishant-final1pptx 41/63
0 5 10 15 20 25 30 35 40 450
100
200
300
400
500
600
Generator Number
O p e r a t i n g P o w e r
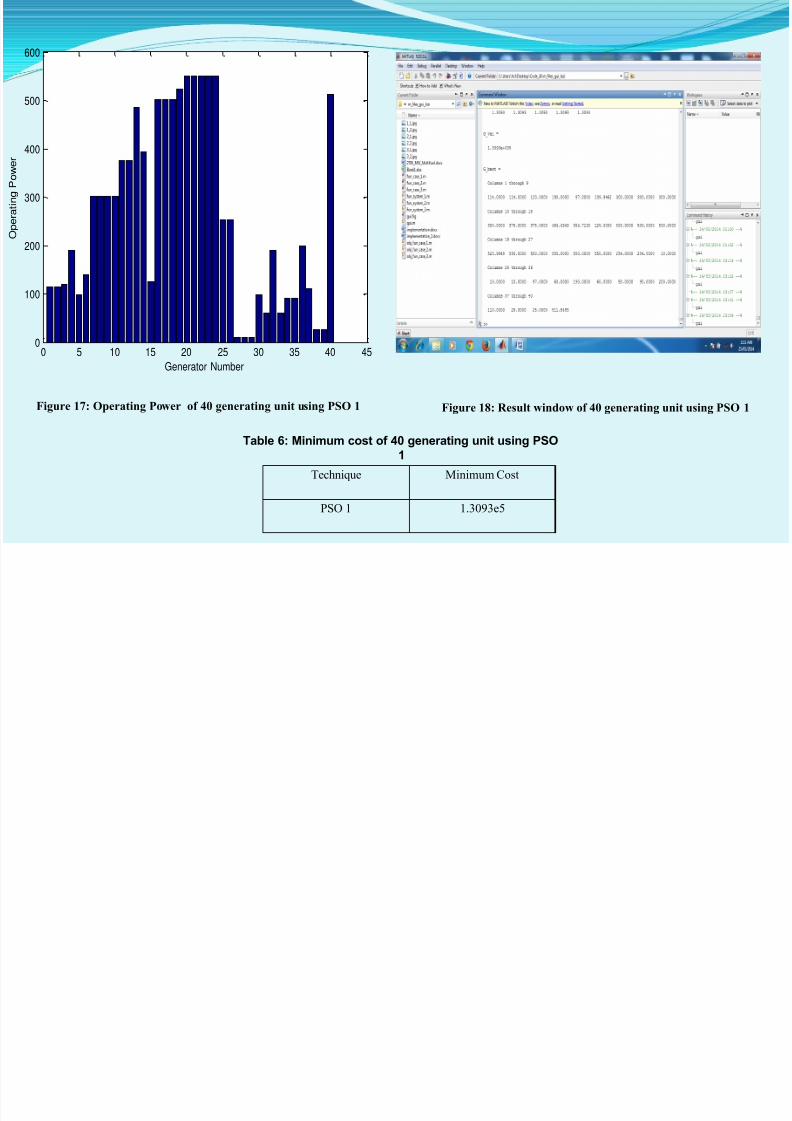
Figure 17: Operating Power of 40 generating unit using PSO 1 Figure 18: Result window of 40 generating unit using PSO 1
Table 6: Minimum cost of 40 generating unit using PSO
1
Technique Minimum Cost
PSO 1 1.3093e5
8/10/2019 Nishant Final_1.pptx
http://slidepdf.com/reader/full/nishant-final1pptx 42/63
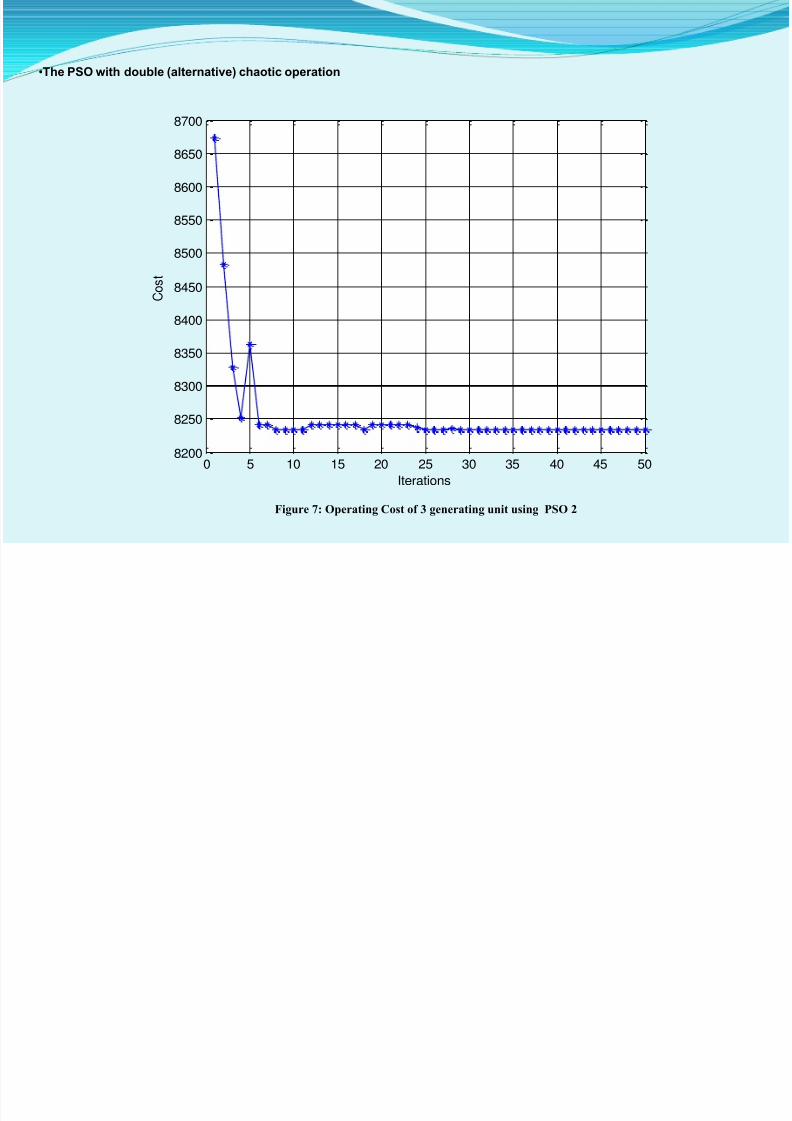
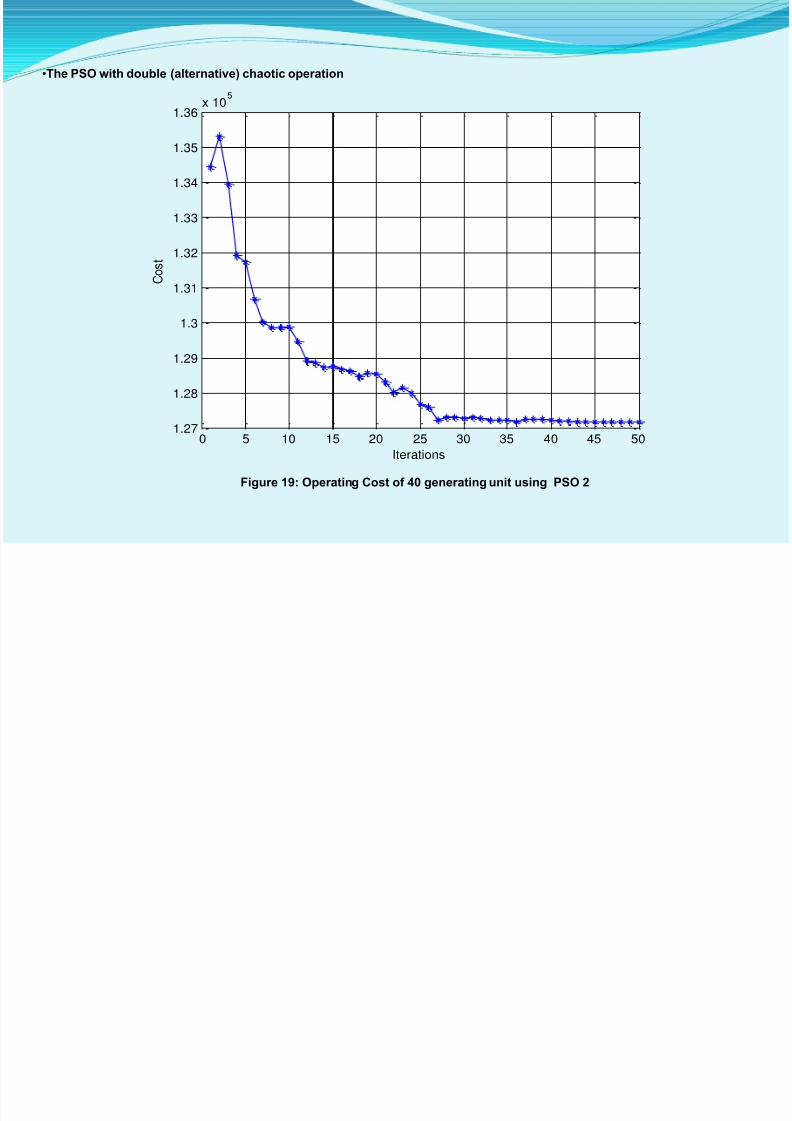
•The PSO with double (alternative) chaotic operation
0 5 10 15 20 25 30 35 40 45 501.27
1.28
1.29
1.3
1.31
1.32
1.33
1.34
1.35
1.36x 10
5
Iterations
C o s t
Figure 19: Operating Cost of 40 generating unit using PSO 2
600
8/10/2019 Nishant Final_1.pptx
http://slidepdf.com/reader/full/nishant-final1pptx 43/63
0 5 10 15 20 25 30 35 40 450
100
200
300
400
500
Generator Number
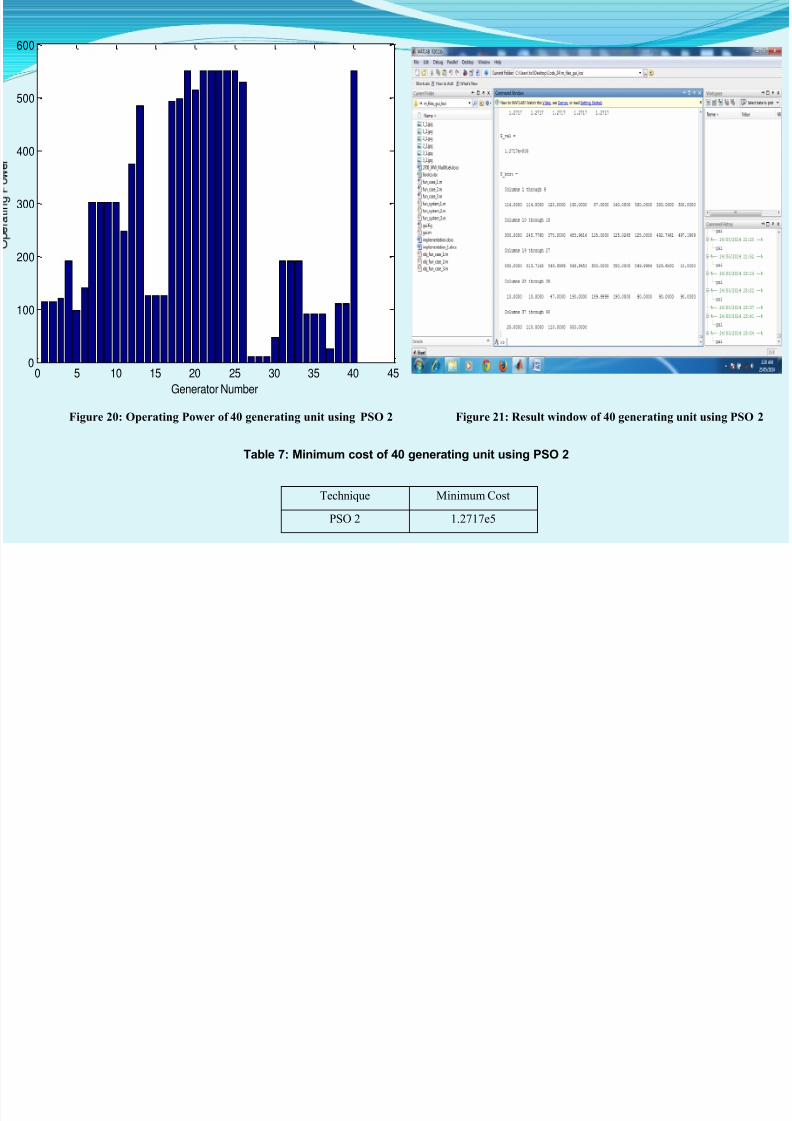
Figure 20: Operating Power of 40 generating unit using PSO 2 Figure 21: Result window of 40 generating unit using PSO 2
Table 7: Minimum cost of 40 generating unit using PSO 2
Technique Minimum Cost
PSO 2 1.2717e5
8/10/2019 Nishant Final_1.pptx
http://slidepdf.com/reader/full/nishant-final1pptx 44/63
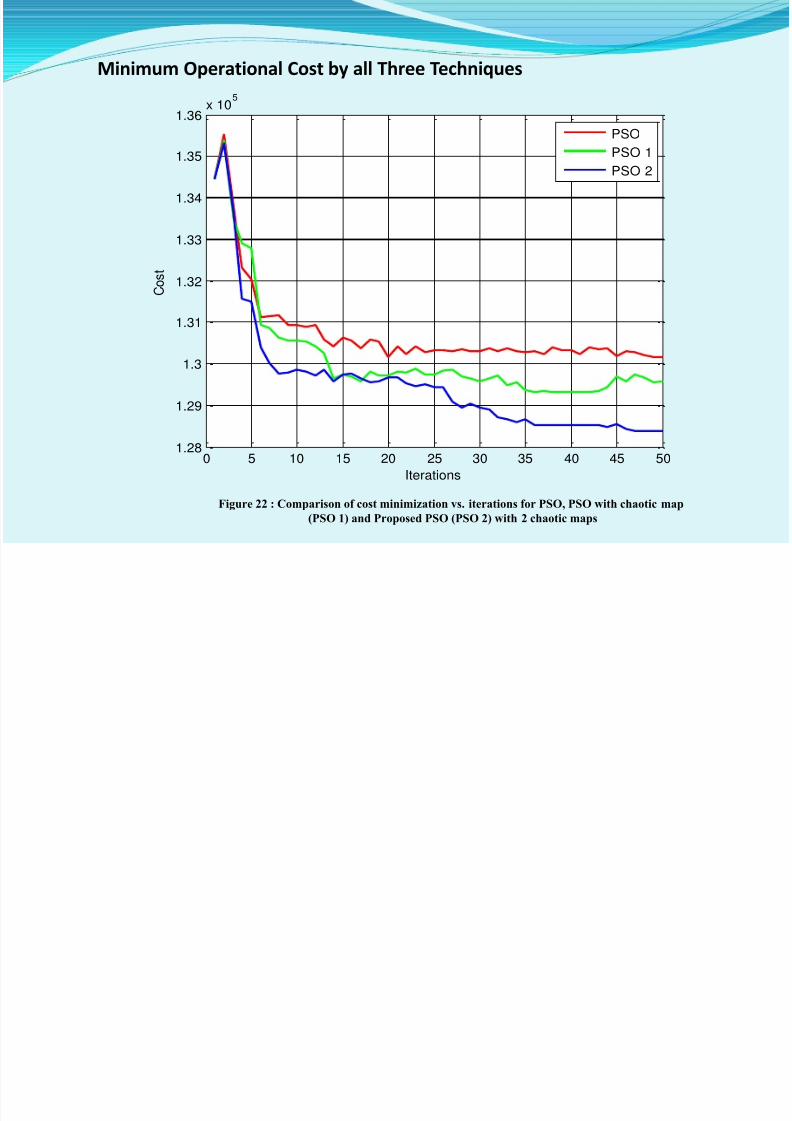
Minimum Operational Cost by all Three Techniques
0 5 10 15 20 25 30 35 40 45 501.28
1.29
1.3
1.31
1.32
1.33
1.34
1.35
1.36x 10
5
Iterations
C
o s t
PSO
PSO 1
PSO 2
Figure 22 : Comparison of cost minimization vs. iterations for PSO, PSO with chaotic map
(PSO 1) and Proposed PSO (PSO 2) with 2 chaotic maps
600
8/10/2019 Nishant Final_1.pptx
http://slidepdf.com/reader/full/nishant-final1pptx 45/63
0 5 10 15 20 25 30 35 40 450
100
200
300
400
500
Generator Number
O p
e r a t i n g P o w e r
PSO
PSO 1
PSO 2
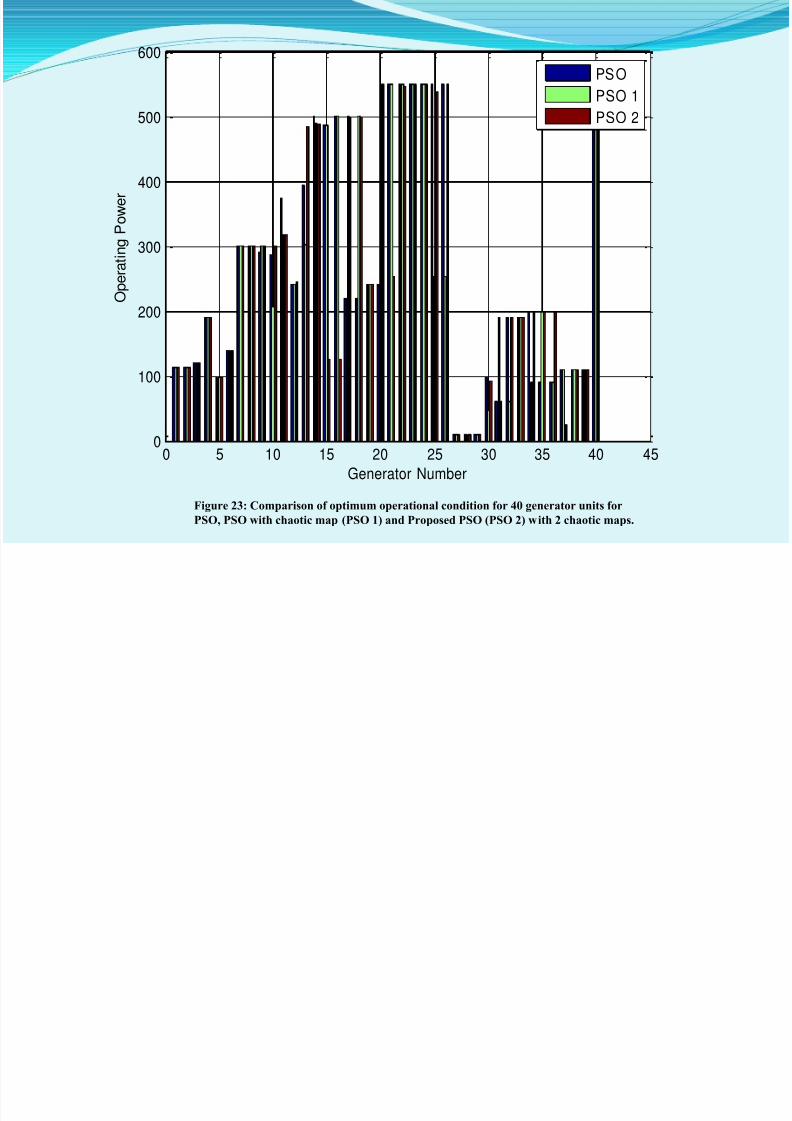
Figure 23: Comparison of optimum operational condition for 40 generator units for
PSO, PSO with chaotic map (PSO 1) and Proposed PSO (PSO 2) with 2 chaotic maps.
8/10/2019 Nishant Final_1.pptx
http://slidepdf.com/reader/full/nishant-final1pptx 46/63
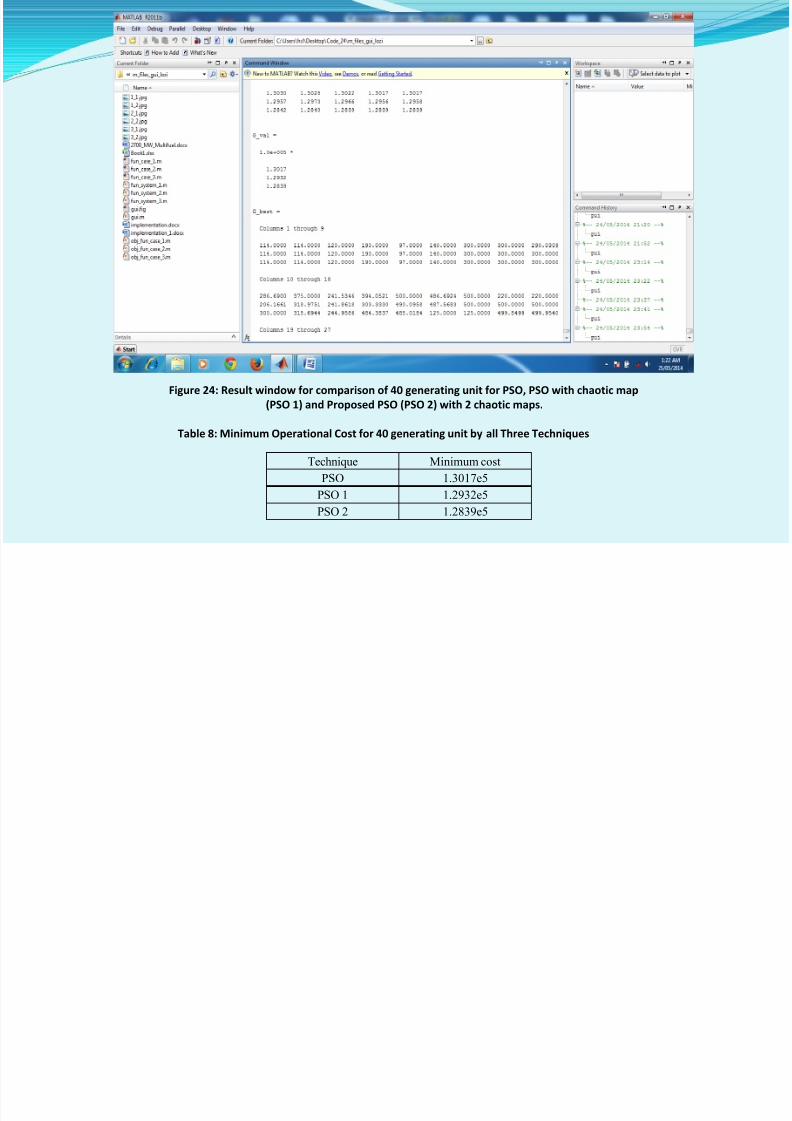
Figure 24: Result window for comparison of 40 generating unit for PSO, PSO with chaotic map
(PSO 1) and Proposed PSO (PSO 2) with 2 chaotic maps.
Technique Minimum cost
PSO 1.3017e5
PSO 1 1.2932e5
PSO 2 1.2839e5
Table 8: Minimum Operational Cost for 40 generating unit by all Three Techniques
T S M l i F l i h V l P i Eff Th
8/10/2019 Nishant Final_1.pptx
http://slidepdf.com/reader/full/nishant-final1pptx 47/63
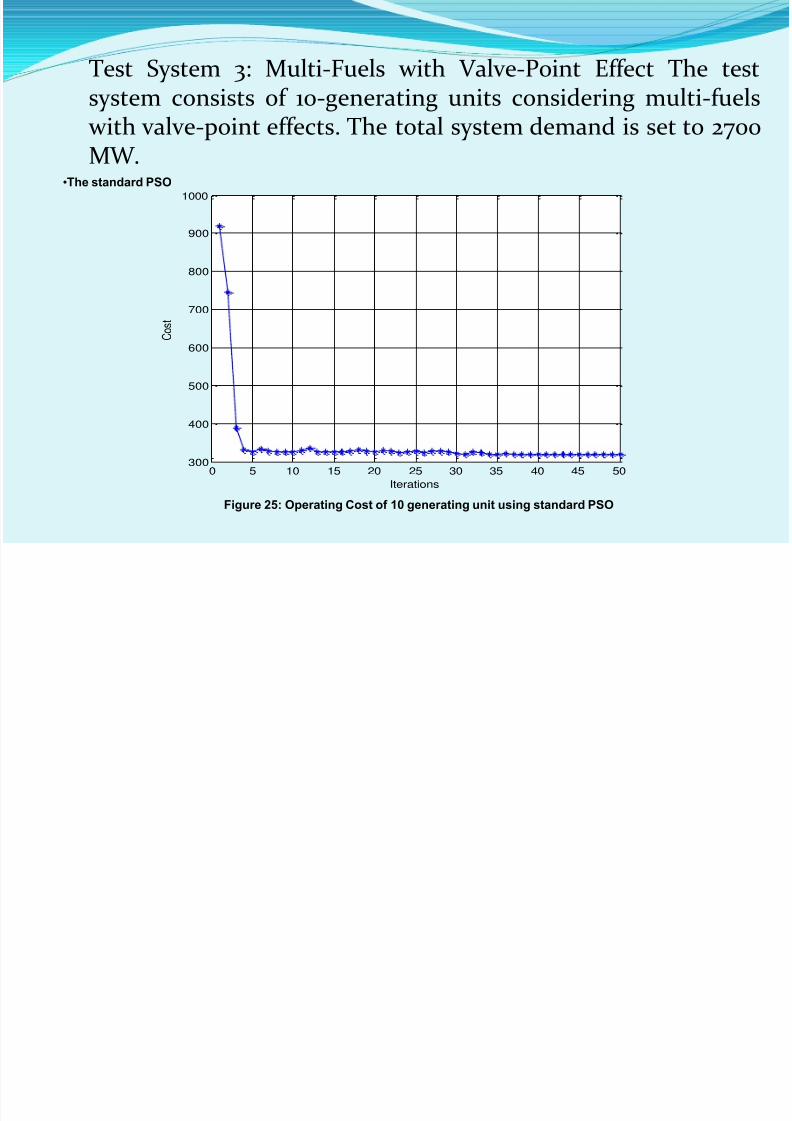
Test System 3: Multi-Fuels with Valve-Point Effect The testsystem consists of 10-generating units considering multi-fuels
with valve-point effects. The total system demand is set to 2700
MW.•The standard PSO
0 5 10 15 20 25 30 35 40 45 50300
400
500
600
700
800
900
1000
Iterations
C o s t
Figure 25: Operating Cost of 10 generating unit using standard PSO
450
500
8/10/2019 Nishant Final_1.pptx
http://slidepdf.com/reader/full/nishant-final1pptx 48/63
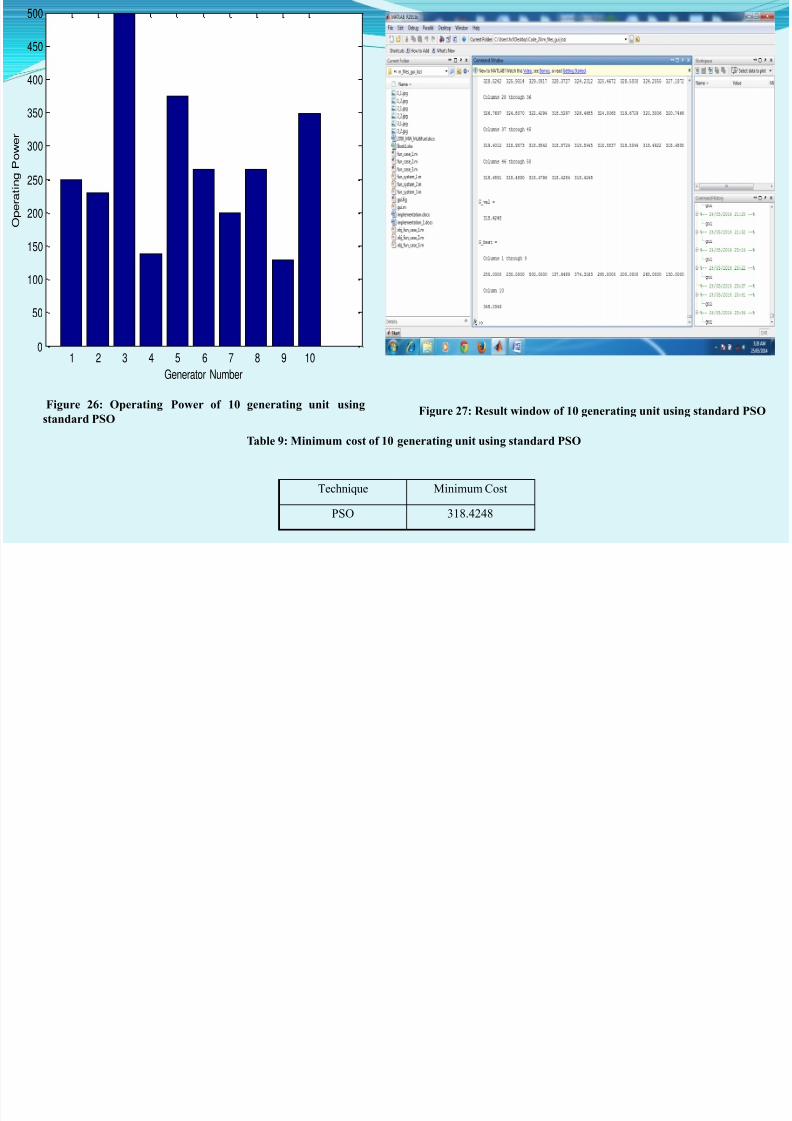
1 2 3 4 5 6 7 8 9 100
50
100
150
200
250
300
350
400
Generator Number
O p e r a t i n g P o w e r
Figure 26: Operating Power of 10 generating unit using
standard PSOFigure 27: Result window of 10 generating unit using standard PSO
Table 9: Minimum cost of 10 generating unit using standard PSO
Technique Minimum Cost
PSO 318.4248
8/10/2019 Nishant Final_1.pptx
http://slidepdf.com/reader/full/nishant-final1pptx 49/63
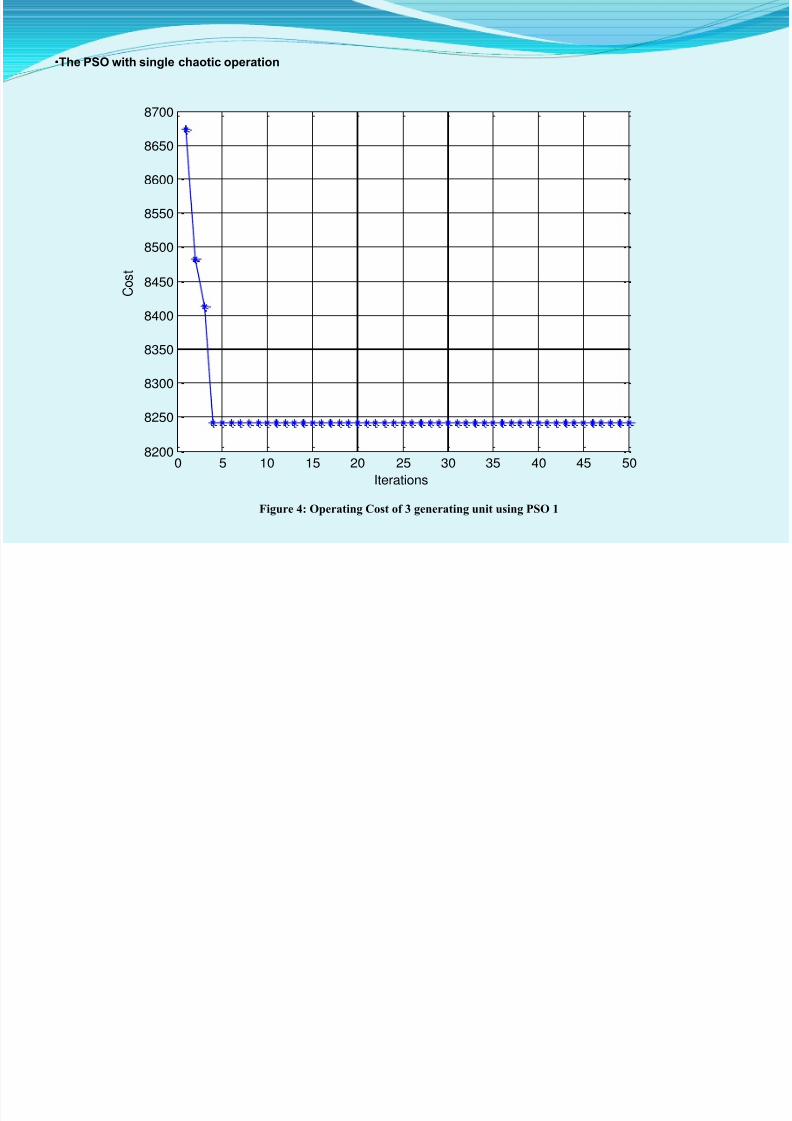
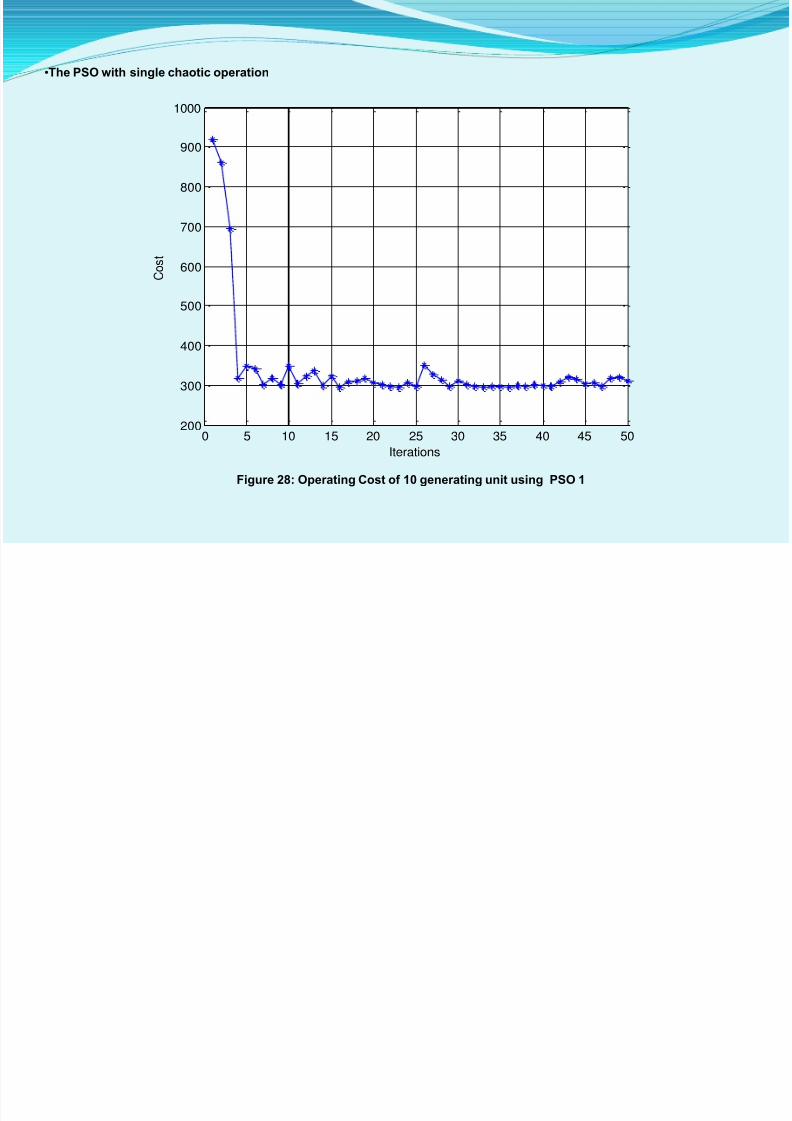
•The PSO with single chaotic operation
0 5 10 15 20 25 30 35 40 45 50200
300
400
500
600
700
800
900
1000
Iterations
C o s t
Figure 28: Operating Cost of 10 generating unit using PSO 1
450
500
8/10/2019 Nishant Final_1.pptx
http://slidepdf.com/reader/full/nishant-final1pptx 50/63
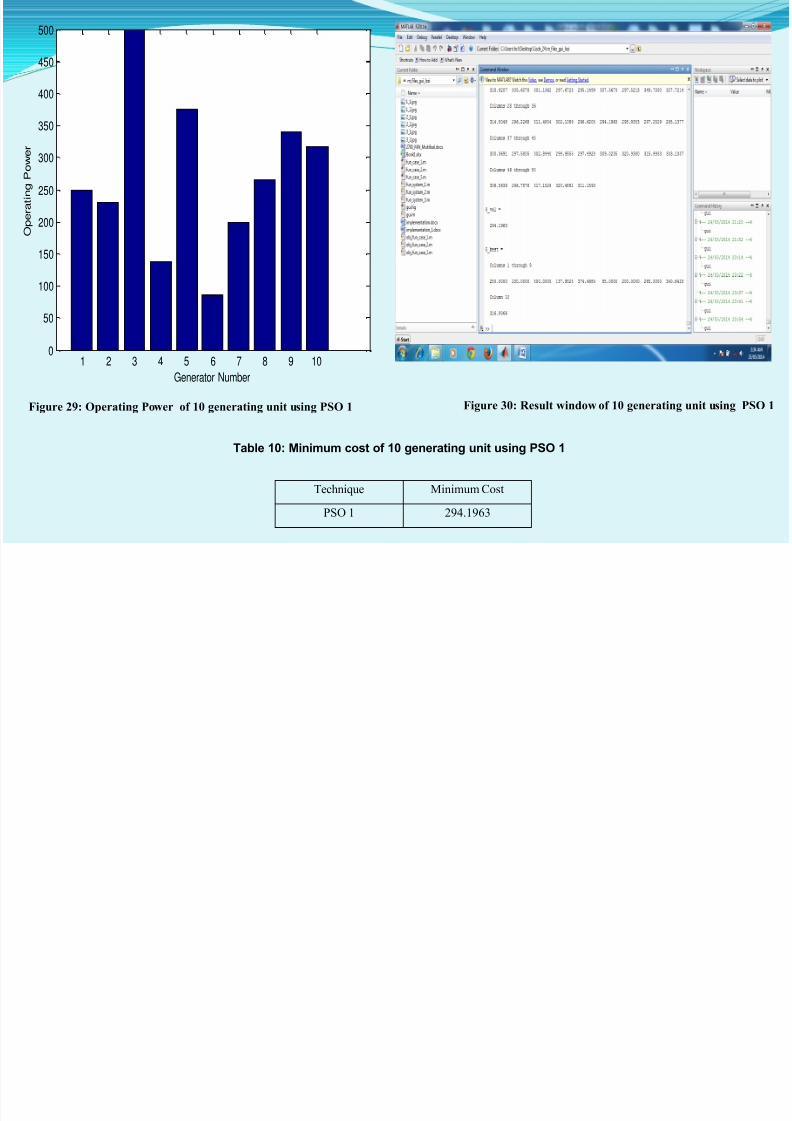
1 2 3 4 5 6 7 8 9 100
50
100
150
200
250
300
350
400
450
Generator Number
O p e r a t i n g P o w e
r
Figure 29: Operating Power of 10 generating unit using PSO 1 Figure 30: Result window of 10 generating unit using PSO 1
Table 10: Minimum cost of 10 generating unit using PSO 1
Technique Minimum Cost
PSO 1 294.1963
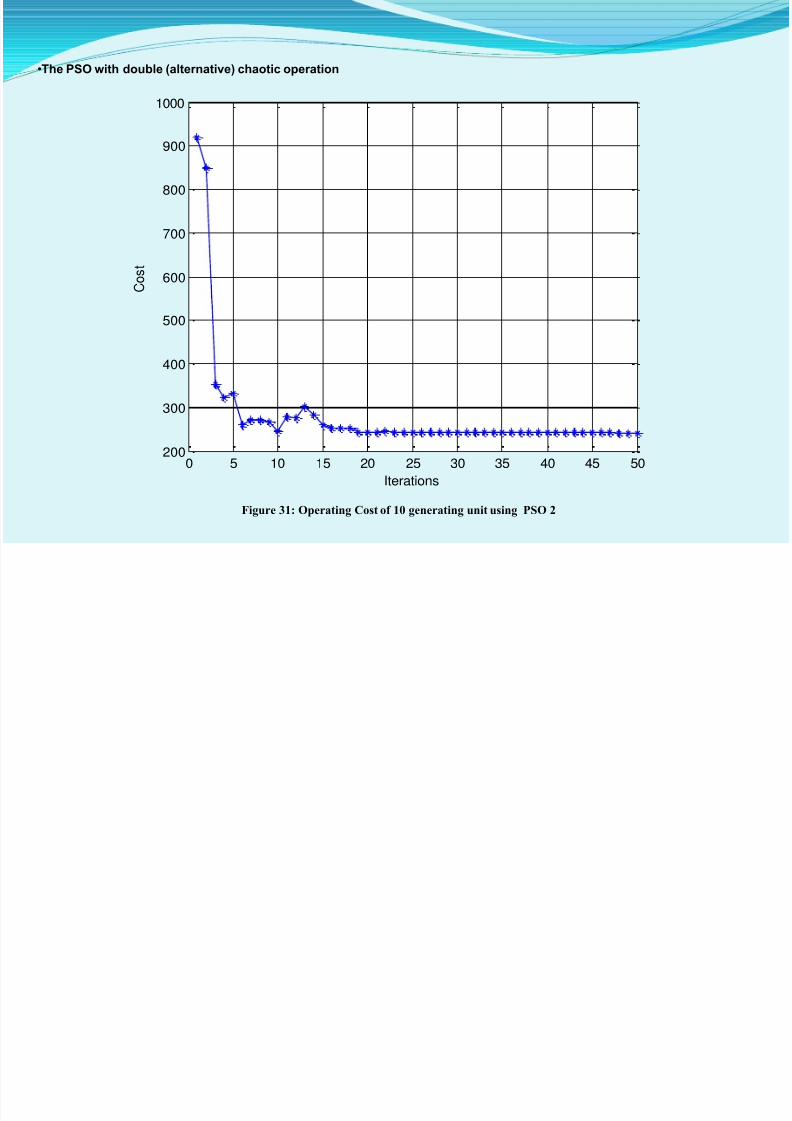
•The PSO with double (alternative) chaotic operation
8/10/2019 Nishant Final_1.pptx
http://slidepdf.com/reader/full/nishant-final1pptx 51/63
•The PSO with double (alternative) chaotic operation
0 5 10 15 20 25 30 35 40 45 50200
300
400
500
600
700
800
900
1000
Iterations
C o s t
Figure 31: Operating Cost of 10 generating unit using PSO 2
300
350
8/10/2019 Nishant Final_1.pptx
http://slidepdf.com/reader/full/nishant-final1pptx 52/63
1 2 3 4 5 6 7 8 9 100
50
100
150
200
250
300
Generator Number
O p e r a t i n g P o w
e r
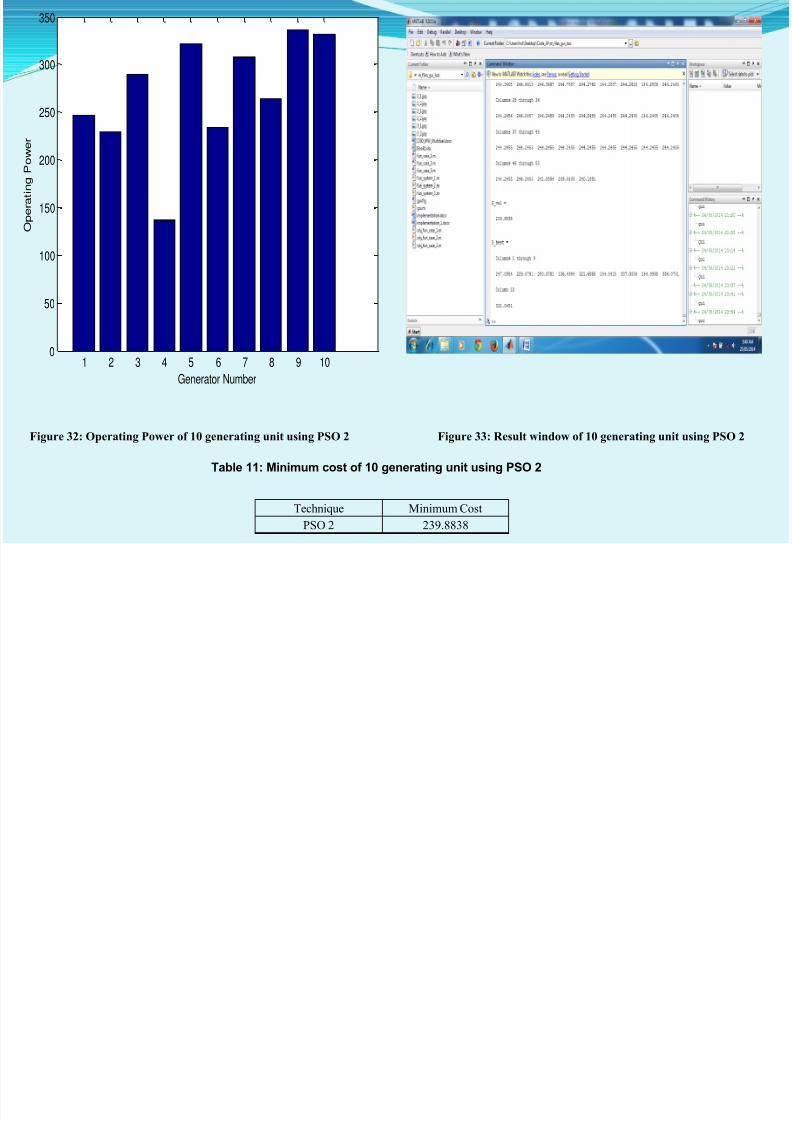
Figure 32: Operating Power of 10 generating unit using PSO 2 Figure 33: Result window of 10 generating unit using PSO 2
Table 11: Minimum cost of 10 generating unit using PSO 2
Technique Minimum Cost
PSO 2 239.8838
Minimum Operational Cost by all Three Techniques
8/10/2019 Nishant Final_1.pptx
http://slidepdf.com/reader/full/nishant-final1pptx 53/63
p y q
0 5 10 15 20 25 30 35 40 45 50200
300
400
500
600
700
800
900
1000
Iterations
C o s t
PSO
PSO 1
PSO 2
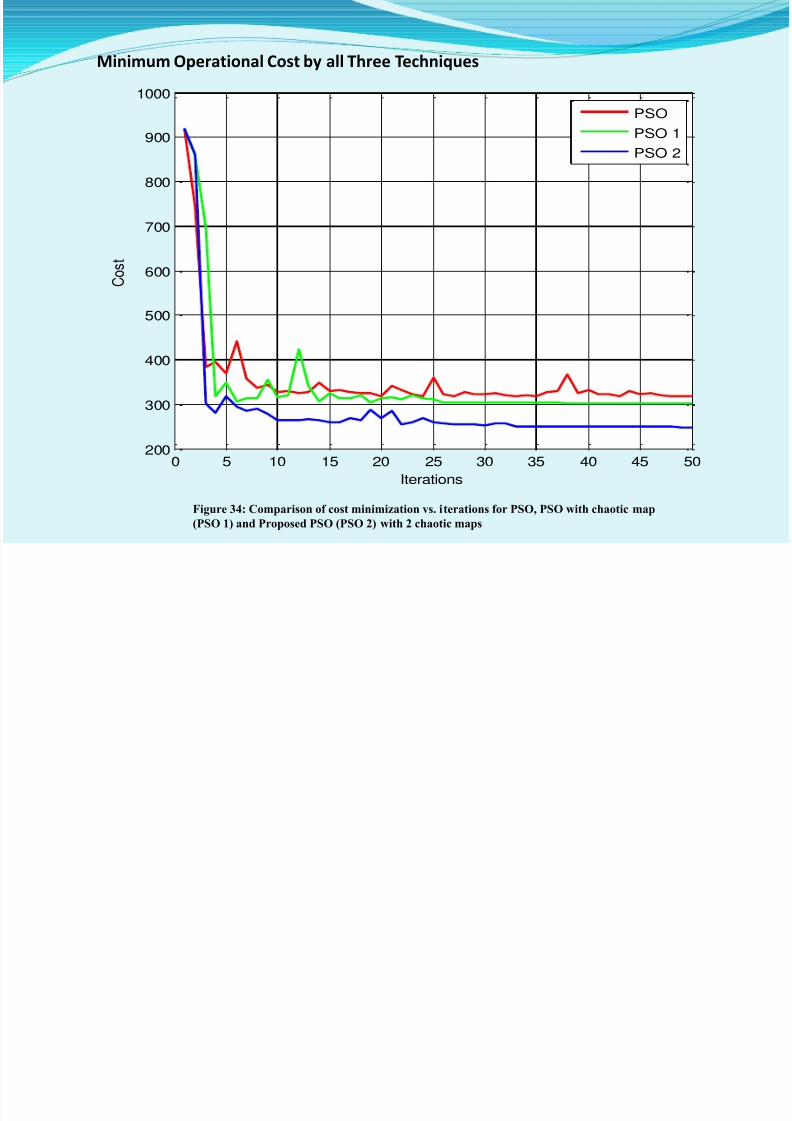
Figure 34: Comparison of cost minimization vs. iterations for PSO, PSO with chaotic map
(PSO 1) and Proposed PSO (PSO 2) with 2 chaotic maps
8/10/2019 Nishant Final_1.pptx
http://slidepdf.com/reader/full/nishant-final1pptx 54/63
1 2 3 4 5 6 7 8 9 100
50
100
150
200
250
300
350
400
450
500
Generator Number
O p
e r a t i n g P o w e r
PSO
PSO 1
PSO 2
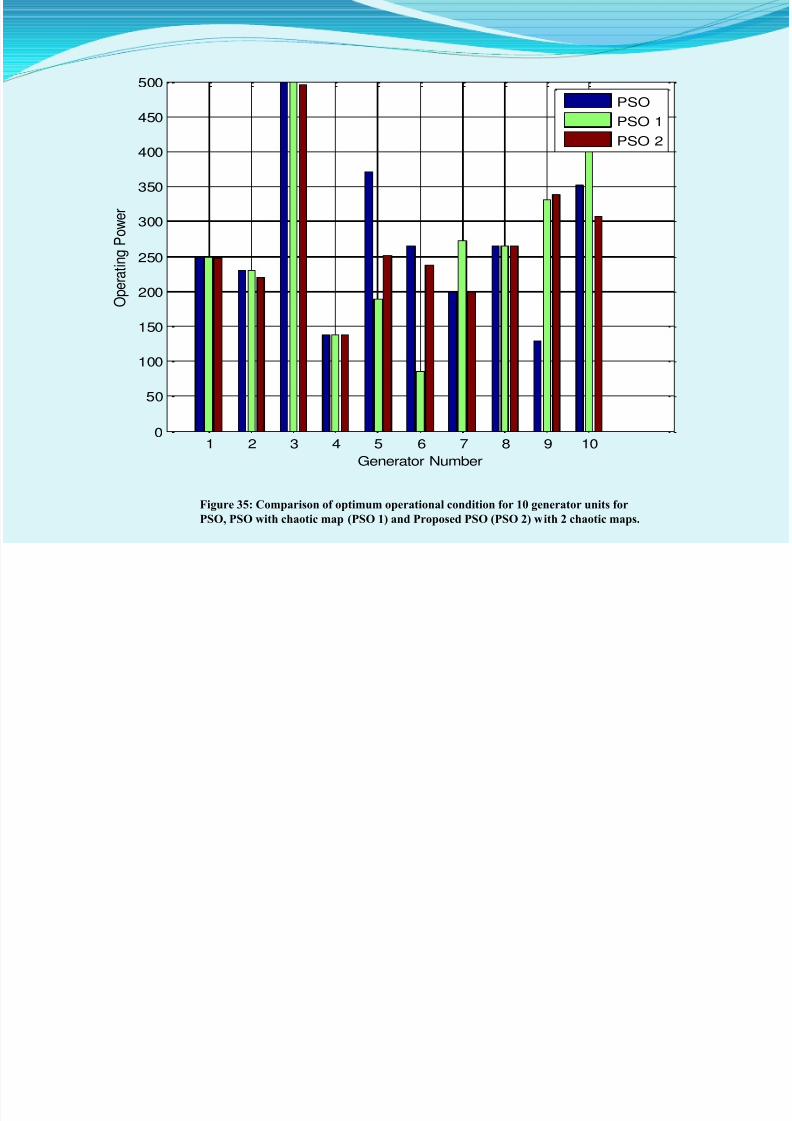
Figure 35: Comparison of optimum operational condition for 10 generator units for
PSO, PSO with chaotic map (PSO 1) and Proposed PSO (PSO 2) with 2 chaotic maps.
8/10/2019 Nishant Final_1.pptx
http://slidepdf.com/reader/full/nishant-final1pptx 55/63
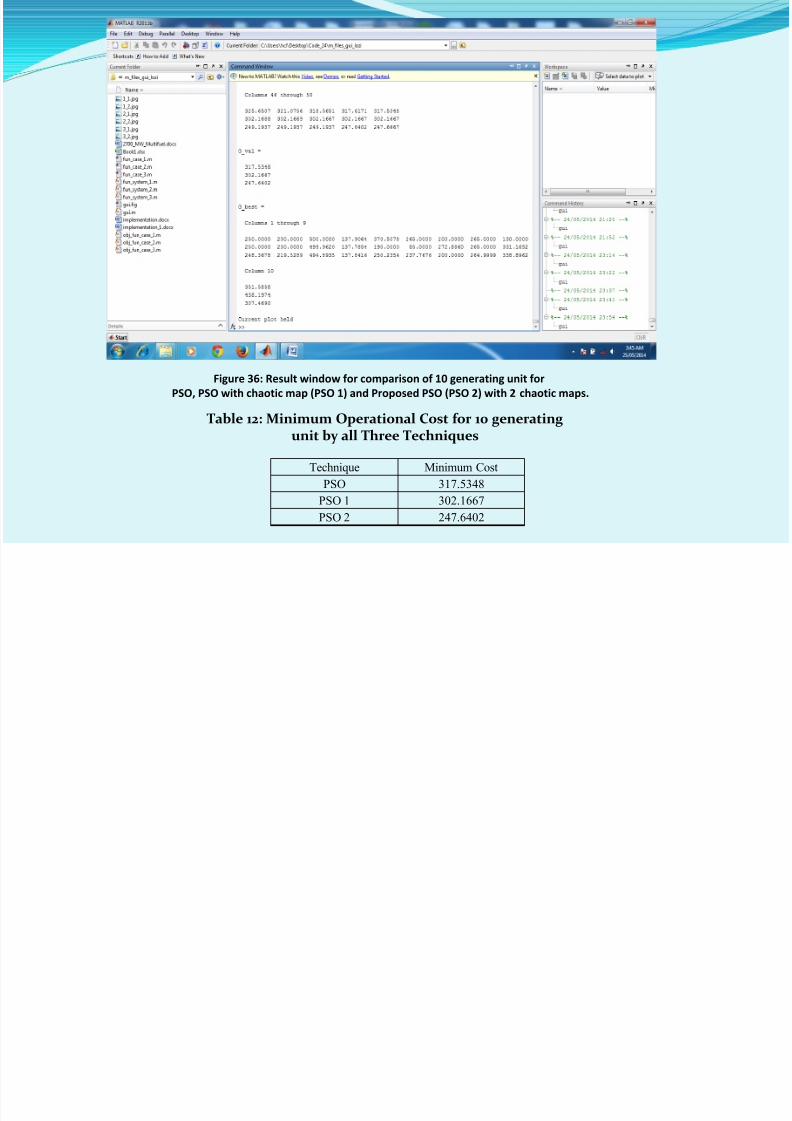
Figure 36: Result window for comparison of 10 generating unit for
PSO, PSO with chaotic map (PSO 1) and Proposed PSO (PSO 2) with 2 chaotic maps.
Table 12: Minimum Operational Cost for 10 generating
unit by all Three Techniques
Technique Minimum Cost
PSO 317.5348
PSO 1 302.1667
PSO 2 247.6402
CONCLUSION AND FUTURE SCOPE
8/10/2019 Nishant Final_1.pptx
http://slidepdf.com/reader/full/nishant-final1pptx 56/63
CONCLUSION AND FUTURE SCOPE
This work presents an efficient approach for enhancing the
performance of standard PSO algorithm by alternative use of twodifferent chaotic maps for velocity updation and applied to the ELD
problem and tested for three different systems and objectives. The
simulation results shows the superiority of the proposed algorithm
over the previously proposed single chaotic map based PSO algorithm
and support the idea that switching over of chaotic pseudorandom
number generators in the PSO algorithm improves its performance
and the optimization process.
CONCLUSION AND FUTURE SCOPE
8/10/2019 Nishant Final_1.pptx
http://slidepdf.com/reader/full/nishant-final1pptx 57/63
The results for three different experiments are collected with different
settings and results compared with other methods which show that the
proposed algorithm improves the results by at least 10% for all three
cases. Although the result has improved we can further develop the
algorithm by utilizing multiple maps and optimizing the chaotic maps parameters however these considerations are leaved for future
enhancements.
CONCLUSION AND FUTURE SCOPE
REFERENCES
8/10/2019 Nishant Final_1.pptx
http://slidepdf.com/reader/full/nishant-final1pptx 58/63
[1] J. Kennedy, “The Particle Swarm Optimization: Society Adaptation of Knowledge”,
in Proc. 4th IEEE Cong. Evolutionary Computation, pp. 303-308, 1997.
[2] Michal Pluhacek, Roman Senkerik and Ivan Zelinka,Donald Davendra, “Chaos PSO
Algorithm Driven Alternately by two Different Chaotic Map – an Initial Study”,
Congress on Evolutionary Computation Cancun Mexico, IEEE 2013, June 20-23, pp.
2444-2449.
[3]C. Rani, D. P. Kothari, and K. Busawon, “Chaotic Self Adaptive Particle Swarm
Approach for Solving Economic Dispatch Problem with Valve-Point Effect.”
International Conference on Power Energy and Control, ICPEC IEEE 2013, pp. 405-
410.
REFERENCES
8/10/2019 Nishant Final_1.pptx
http://slidepdf.com/reader/full/nishant-final1pptx 59/63
[4] A. Jaini, I. Musirin, N. Aminudin, M. M. Othman and T. K. A Raman, “Particle
Swarm Optimization (PSO) Technique in Economic Power Dispatch Problems “The 4th
International Power Engineering and Optimization Conf., Shah Alam, Selangor, IEEE,
Malaysia: 23-24 June 2010.pp. 308-312
[5] Tao Zhang and Cai Jin-Ding, “ A new Chaotic PSO with Dynamic Inertia Weight for
Economic Dispatch Problem”, IEEE, 2009. April 6-7, pp.1-6.
[6] K.T.Chaturvedi, Manjaree Pandit “Self -Organizing Hierarchical Particle Swarm
Optimization for Nonconvex Economic Dispatch” IEEE transactions on power
system,vol.23,august 2008.
[7] Ernesto Araujo and Leandro dos S. Coelho, “ Particle Swarm Approaches usingLozi map Chaotic Sequences to Fuzzy Modelling of an Experimental Thermal-Vacuum
System”, Applied Soft Computing, Vol.8 (2008), pp.1354-1364.
REFERENCES
[8] L d d S C lh d Ch Sh L “S l i E i L d Di h
8/10/2019 Nishant Final_1.pptx
http://slidepdf.com/reader/full/nishant-final1pptx 60/63
[8] Leandro dos Santos Coelho and Chu-Sheng Lee, “Solving Economic Load Dispatch
Problems in Power Systems using Chaotic and Gaussian Particle Swarm Optimization
Approaches”, Electrical Power and Energy Systems, Vol. 30 (2008), pp. 297-307.
[9] Jong-Bae Park, Yun-Won Jeong, Hyun-Houng Kim and Joong-Rin Shin “An
Improved Particle Swarm Optimization for Economic Dispatch with Valve-Point
Effect” International Journal of Innovations in Energy Systems and Power, Vol. 1, no. 1
(November 2006).
[10] Jiang Chuanwen and Etorre Bompard, “ A Self-Adaptive Chaotic Particle Swarm
Algorithm for short time Hydroelectric System Scheduling in Deregulated
Environment”, Energy Conservation and Management,
Vol.46,Issue.17,Oct.2005,pp.2689-2696.
REFERENCES
[11] K M H G W Zh Y D d Kit P W “Q t
8/10/2019 Nishant Final_1.pptx
http://slidepdf.com/reader/full/nishant-final1pptx 61/63
[11] Ke Meng, Hong Gang Wang, Zhao Yang Dong and Kit Po Wong, “Quantum-
Inspire Particle Swarm Optimization for Valve-Point Economic Load Dispatch”,
Transactions on Power systems, IEEE, vol. 25, no. 1, February 2010.
[12] Jong-Bae Park, Yun-Won Jeong, Woo-Nam Lee, Joong-Rin Shin power
engineering society general meeting, 2006 IEEE.
[13] N.Sinha, R. Chakrabarti, and P. K. Chattopadhyay, “Evolutionary programming
techniques for economic load dispatch,” IEEE Trans. On Evolutionary Computations,
Vol. 7, No. 1, pp. 83-94, Feb. 2003.
[14] C.L. Chiang, “Improved genetic algorithm for power economic dispatch of units
with valve-point effects and multiple fuels.” IEEE Trans. Power Syst., vol. 20. no.4, pp.1690-1699, Nov. 2005.
List of Publications Nishant Chaturvedi, A. S. Walkey and N. P. Patidar, “ A Modified PSO Based
8/10/2019 Nishant Final_1.pptx
http://slidepdf.com/reader/full/nishant-final1pptx 62/63
, y ,
Solution Approach for Economic Load Dispatch Problem in Power System.
International Journal of scientific and engineering Research. ISSN : 2229-5518,
Vol. 5, Issue 4,pp. 292-300, April 2014.
Nishant Chaturvedi and A. S. Walkey, “ A Survey on Economic Load Dispatch
Problem using Particle Swarm Optimization technique” International Journal of
emerging Technology and Advanced Engineering. ISSN: 2250-2459, ISO 9001:
2008, Vol. 4, Issue 3, pp. 188-193, March 2014.
Nishant Chaturvedi and A. S. Walkey, “ A Noval Approach for Economic Load
Dispatch Problem Based on GA and PSO” , International Journal of Engineering
Research and Application. ISSN: 2248-9622, Vol. 4, Issue 3 (Version 2), March
2014, pp. 24-31.

8/10/2019 Nishant Final_1.pptx
http://slidepdf.com/reader/full/nishant-final1pptx 63/63


![Final_1]2_ phd](https://img.pdfslide.net/doc/110x75/5534d303550346c3558b4c68/final12-phd.jpg)


