Embed Size (px)
Citation preview
Trapping Oxygen in Hierarchically Porous Carbon Nano-nets: Graphitic
Nitrogen Dopants Boost the Electrocatalytic Activity
Li-Na Han, Xiao Wei, Bing Zhang, Xin-Hao Li*, Qian-Cheng Zhu, Kai-Xue Wang, and Jie-
Sheng Chen*
School of Chemistry and Chemical Engineering, Shanghai Jiao Tong University, Shanghai
200240, P. R. China
Corresponding to: E-mail: [email protected] (X.-H. Li) [email protected] (J.-S. Chen)
Electronic Supplementary Material (ESI) for RSC Advances.This journal is © The Royal Society of Chemistry 2016
Figure S1. SEM images of TiN/Cnet obtained at 1000 °C.
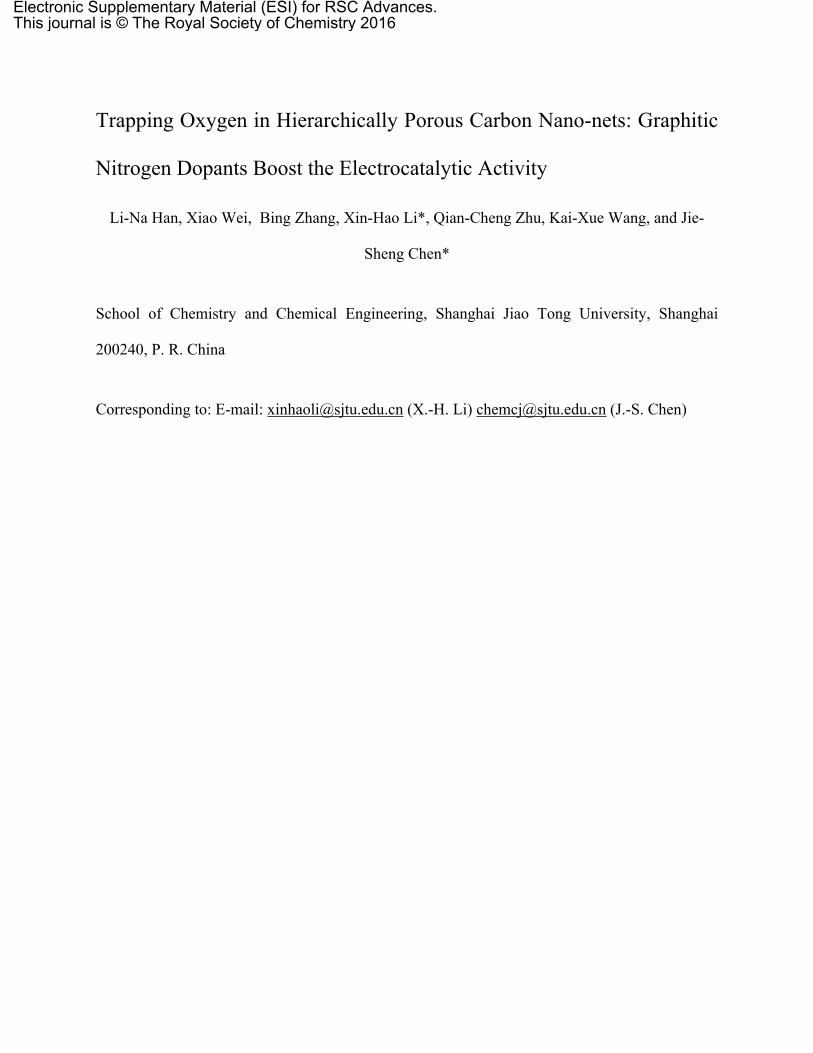
Figure S2. SEM images (a), TEM (b) and HRTEM (c) images of layered carbon obtained at
1000 °C.
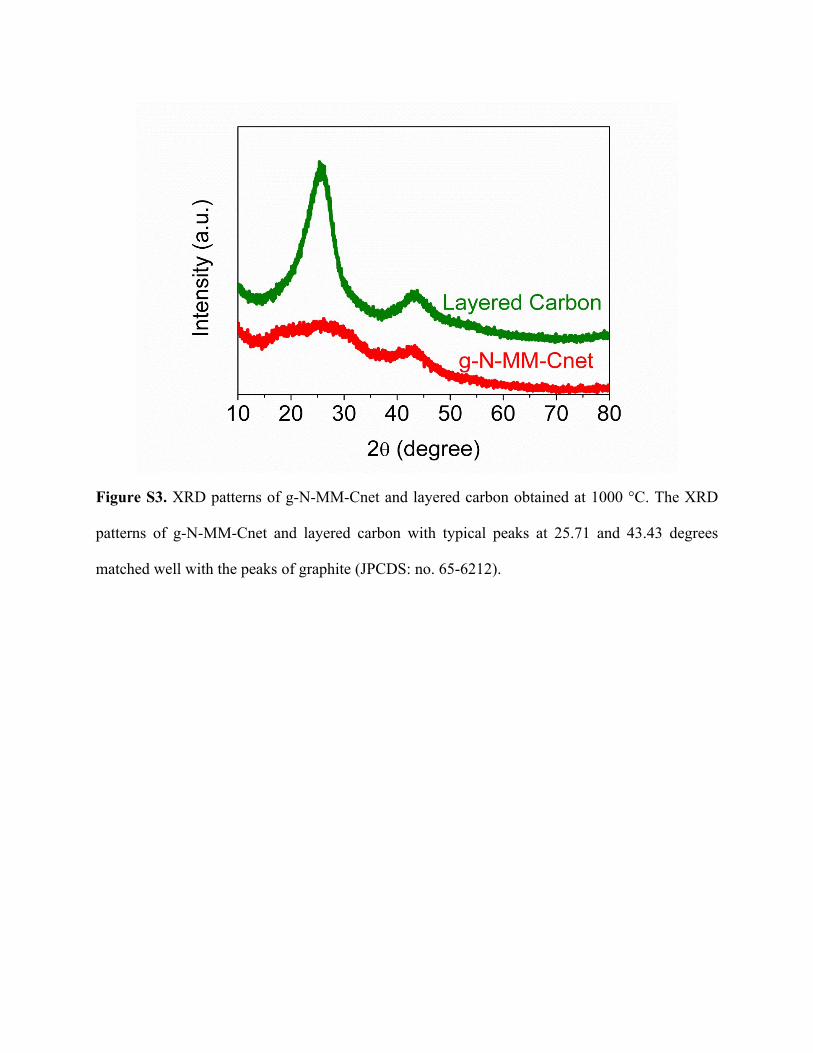
Figure S3. XRD patterns of g-N-MM-Cnet and layered carbon obtained at 1000 °C. The XRD
patterns of g-N-MM-Cnet and layered carbon with typical peaks at 25.71 and 43.43 degrees
matched well with the peaks of graphite (JPCDS: no. 65-6212).
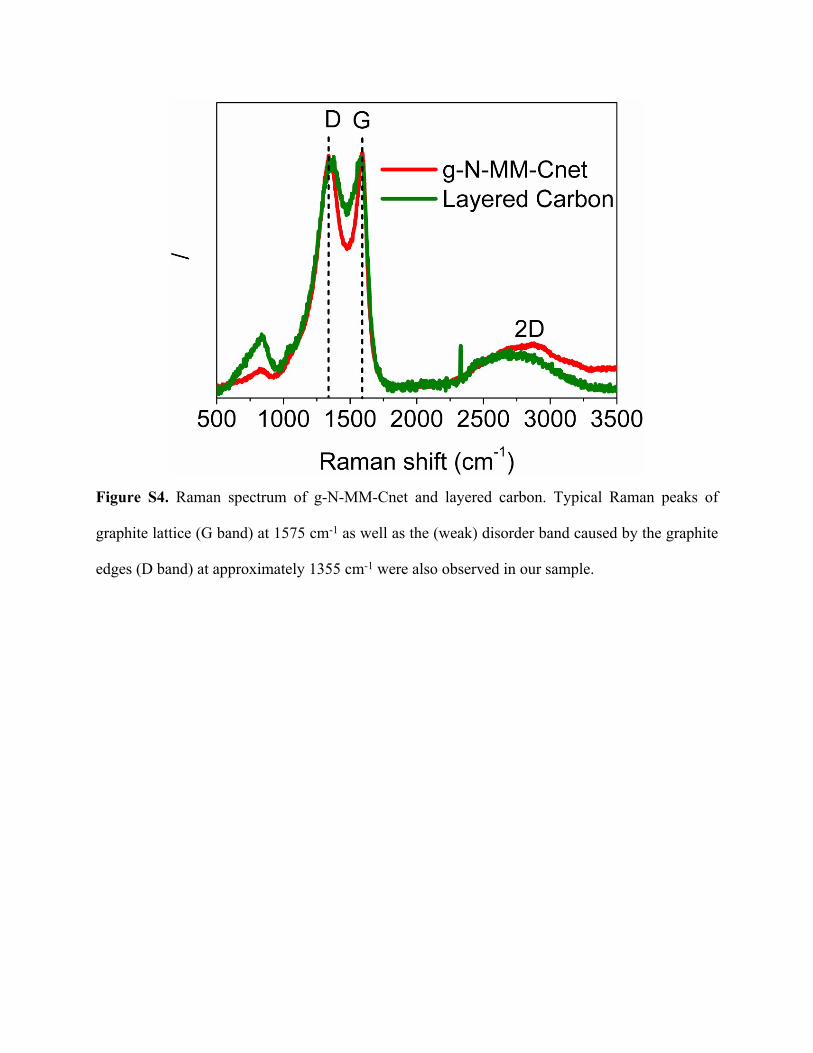
Figure S4. Raman spectrum of g-N-MM-Cnet and layered carbon. Typical Raman peaks of
graphite lattice (G band) at 1575 cm-1 as well as the (weak) disorder band caused by the graphite
edges (D band) at approximately 1355 cm-1 were also observed in our sample.
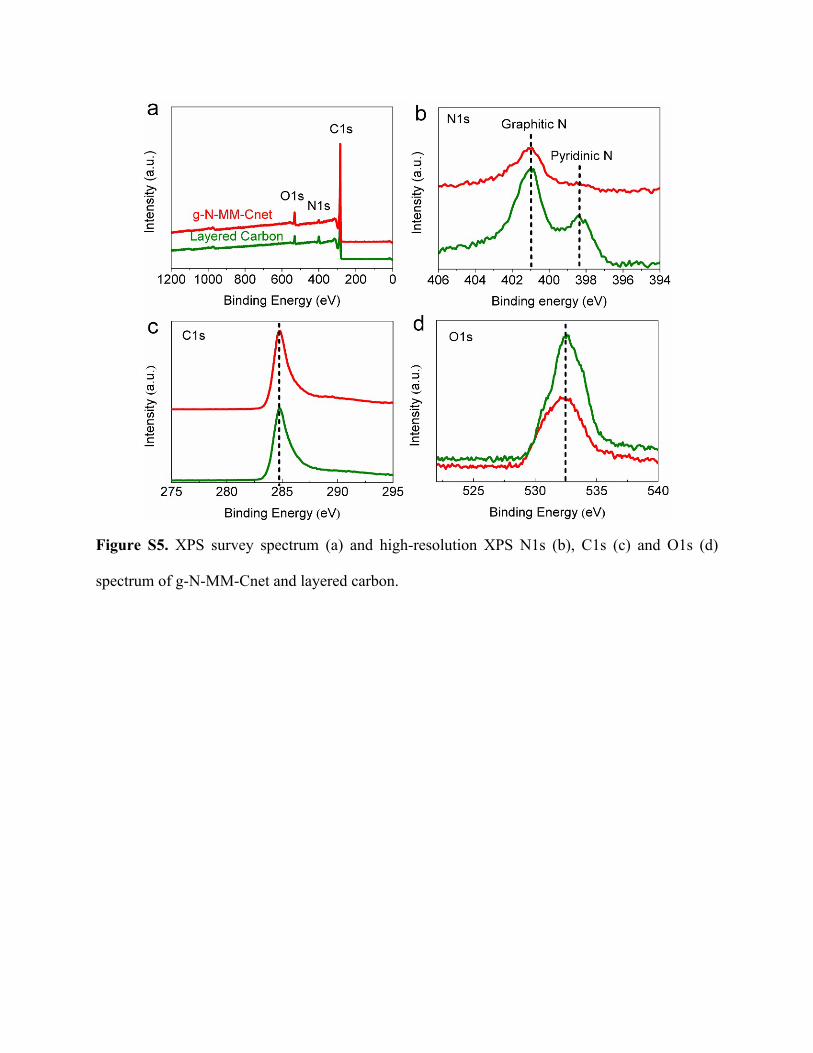
Figure S5. XPS survey spectrum (a) and high-resolution XPS N1s (b), C1s (c) and O1s (d)
spectrum of g-N-MM-Cnet and layered carbon.
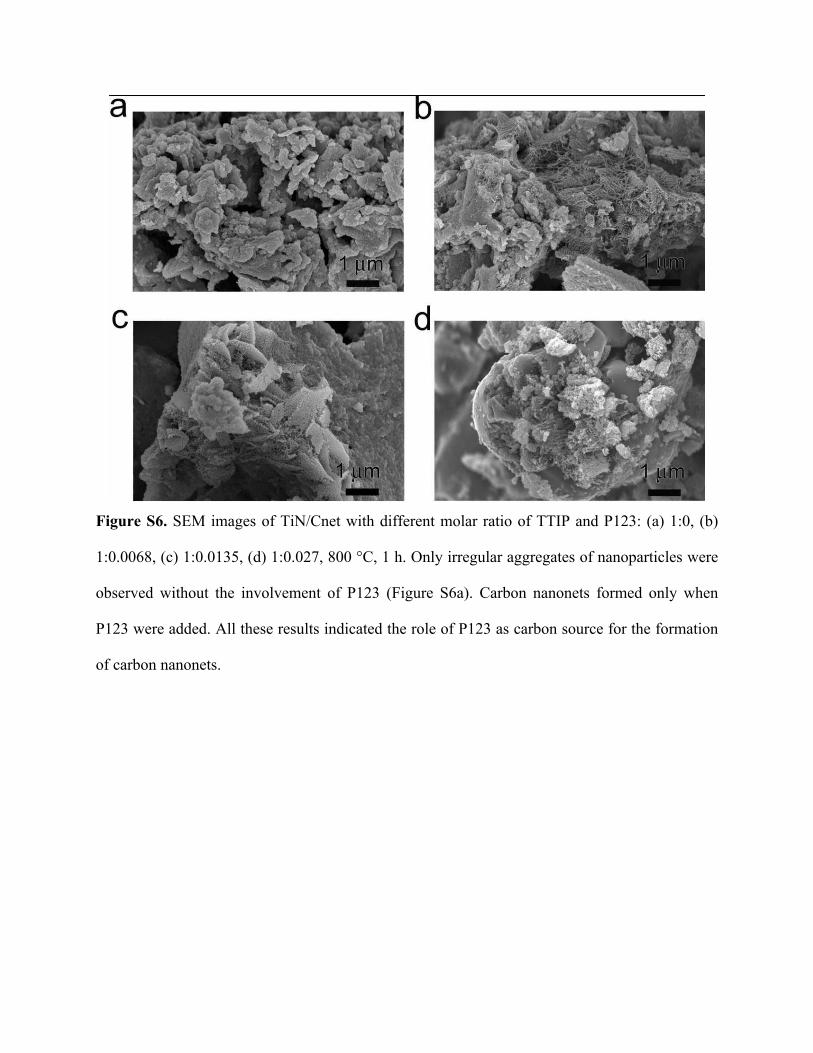
Figure S6. SEM images of TiN/Cnet with different molar ratio of TTIP and P123: (a) 1:0, (b)
1:0.0068, (c) 1:0.0135, (d) 1:0.027, 800 °C, 1 h. Only irregular aggregates of nanoparticles were
observed without the involvement of P123 (Figure S6a). Carbon nanonets formed only when
P123 were added. All these results indicated the role of P123 as carbon source for the formation
of carbon nanonets.
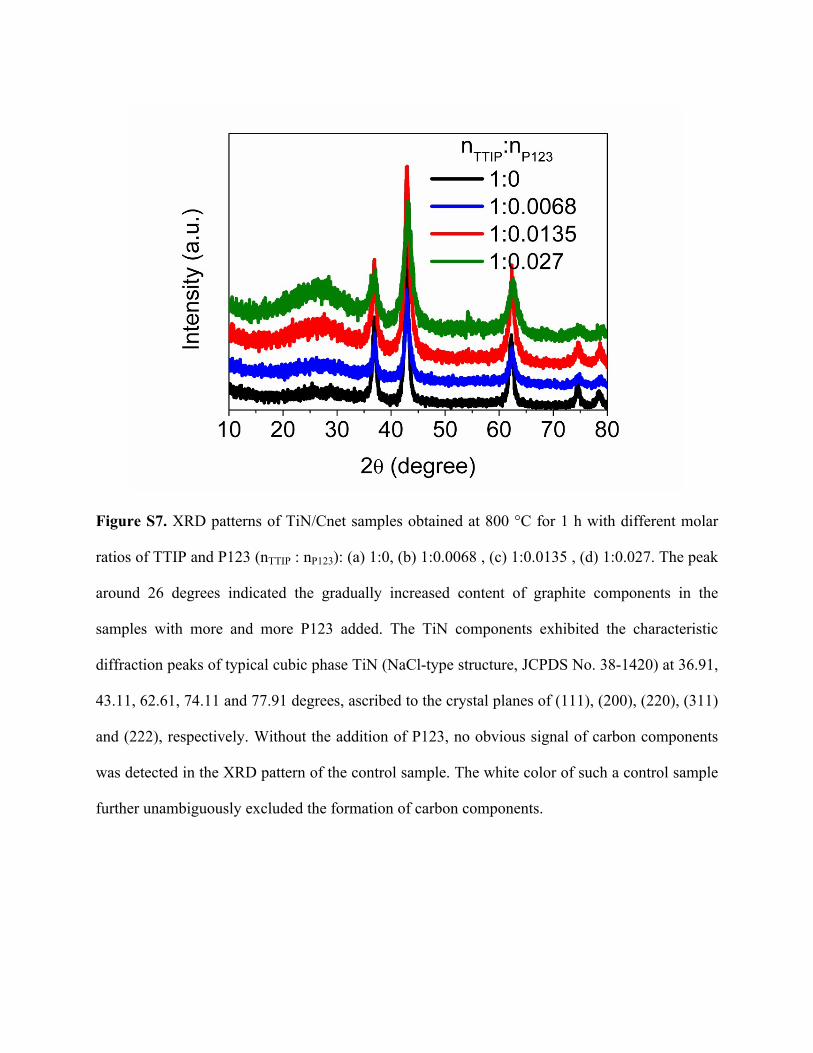
Figure S7. XRD patterns of TiN/Cnet samples obtained at 800 °C for 1 h with different molar
ratios of TTIP and P123 (nTTIP : nP123): (a) 1:0, (b) 1:0.0068 , (c) 1:0.0135 , (d) 1:0.027. The peak
around 26 degrees indicated the gradually increased content of graphite components in the
samples with more and more P123 added. The TiN components exhibited the characteristic
diffraction peaks of typical cubic phase TiN (NaCl-type structure, JCPDS No. 38-1420) at 36.91,
43.11, 62.61, 74.11 and 77.91 degrees, ascribed to the crystal planes of (111), (200), (220), (311)
and (222), respectively. Without the addition of P123, no obvious signal of carbon components
was detected in the XRD pattern of the control sample. The white color of such a control sample
further unambiguously excluded the formation of carbon components.
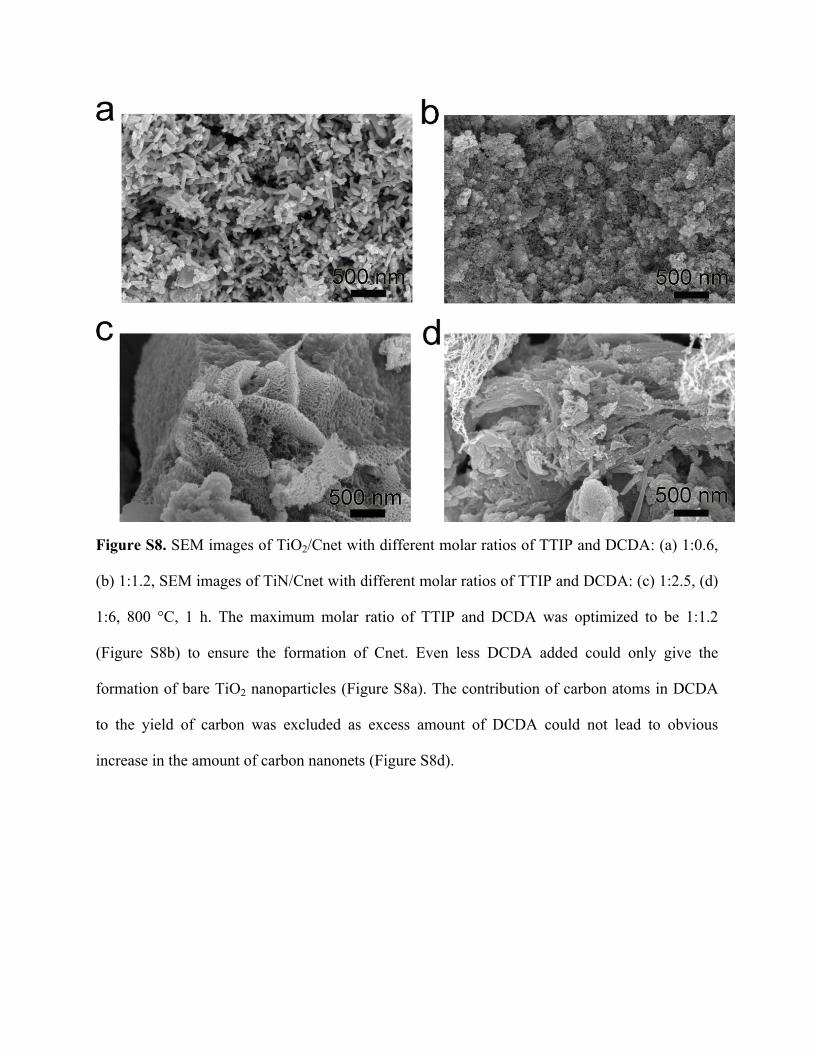
Figure S8. SEM images of TiO2/Cnet with different molar ratios of TTIP and DCDA: (a) 1:0.6,
(b) 1:1.2, SEM images of TiN/Cnet with different molar ratios of TTIP and DCDA: (c) 1:2.5, (d)
1:6, 800 °C, 1 h. The maximum molar ratio of TTIP and DCDA was optimized to be 1:1.2
(Figure S8b) to ensure the formation of Cnet. Even less DCDA added could only give the
formation of bare TiO2 nanoparticles (Figure S8a). The contribution of carbon atoms in DCDA
to the yield of carbon was excluded as excess amount of DCDA could not lead to obvious
increase in the amount of carbon nanonets (Figure S8d).
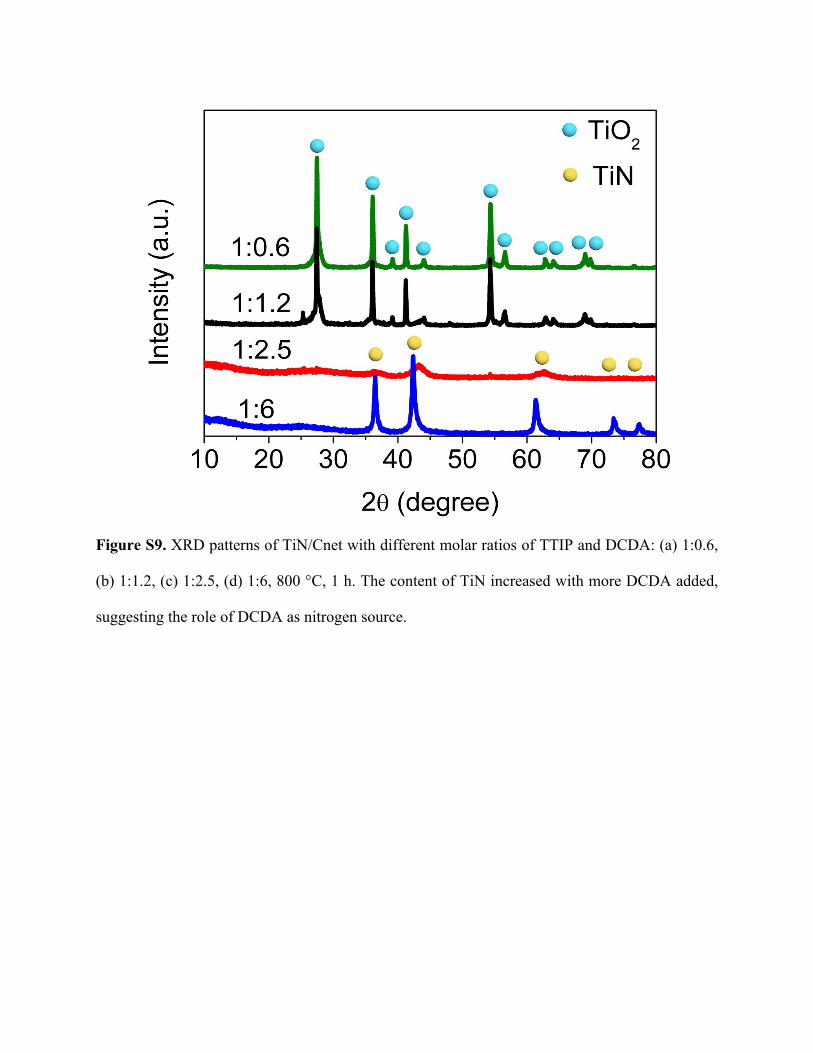
Figure S9. XRD patterns of TiN/Cnet with different molar ratios of TTIP and DCDA: (a) 1:0.6,
(b) 1:1.2, (c) 1:2.5, (d) 1:6, 800 °C, 1 h. The content of TiN increased with more DCDA added,
suggesting the role of DCDA as nitrogen source.
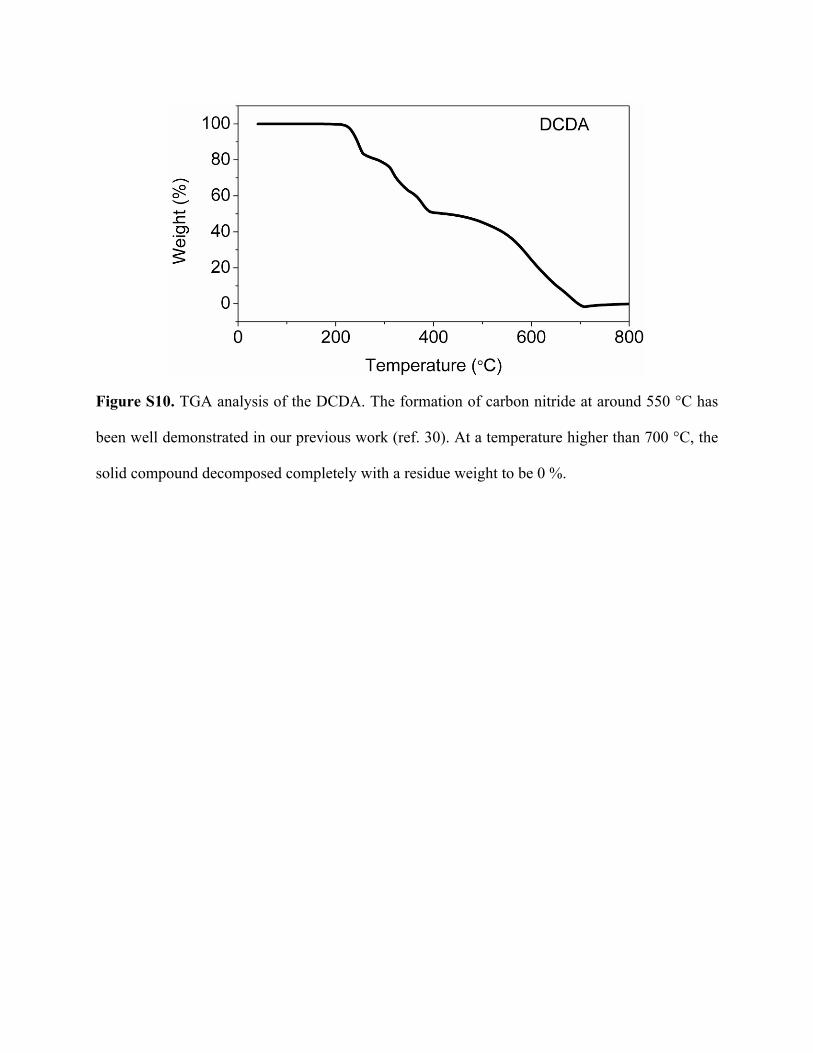
Figure S10. TGA analysis of the DCDA. The formation of carbon nitride at around 550 °C has
been well demonstrated in our previous work (ref. 30). At a temperature higher than 700 °C, the
solid compound decomposed completely with a residue weight to be 0 %.
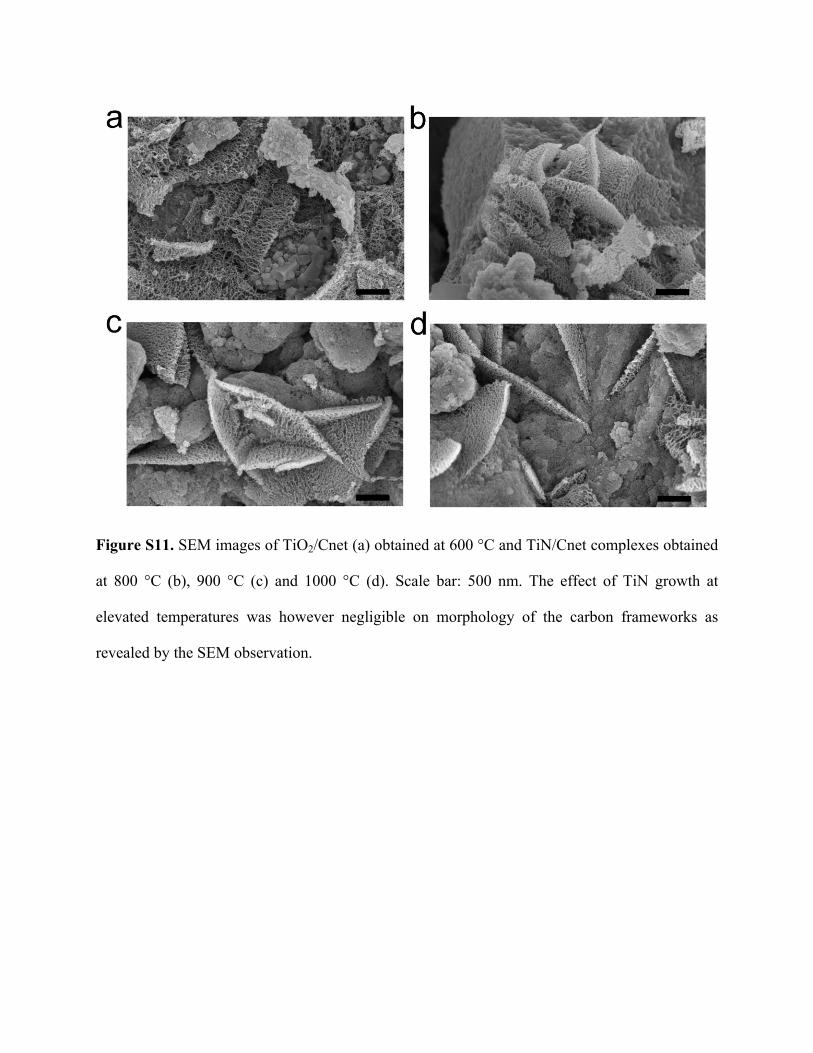
Figure S11. SEM images of TiO2/Cnet (a) obtained at 600 °C and TiN/Cnet complexes obtained
at 800 °C (b), 900 °C (c) and 1000 °C (d). Scale bar: 500 nm. The effect of TiN growth at
elevated temperatures was however negligible on morphology of the carbon frameworks as
revealed by the SEM observation.
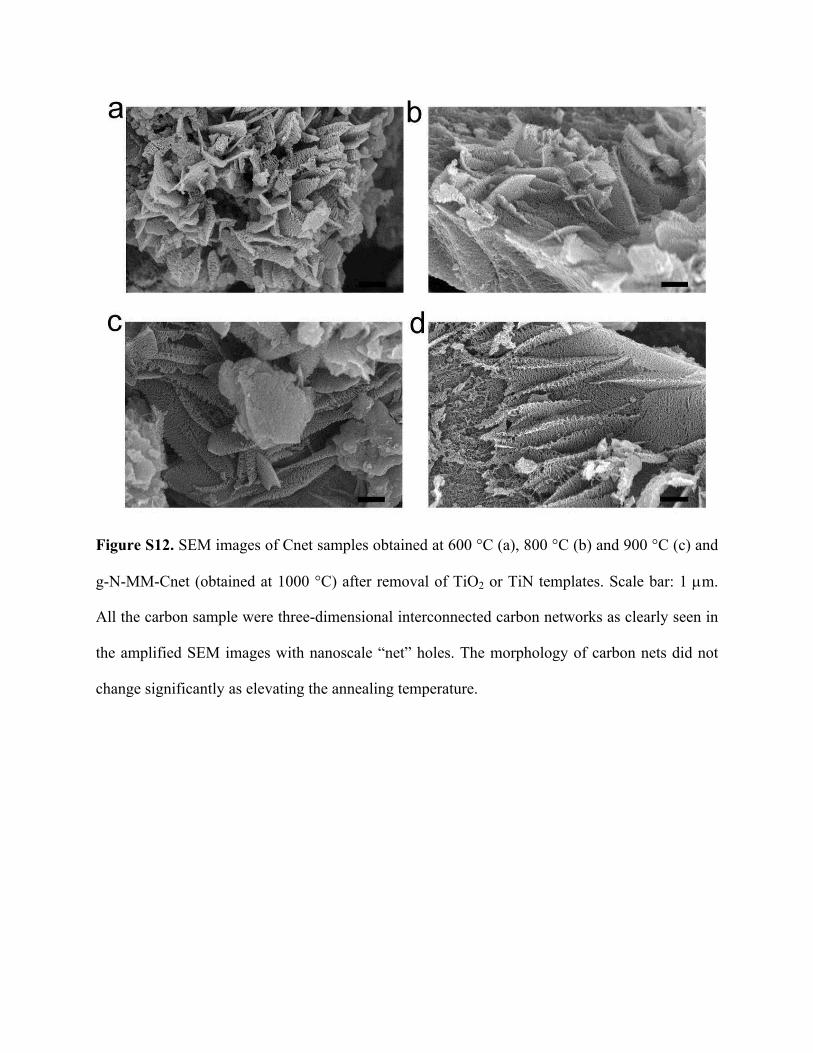
Figure S12. SEM images of Cnet samples obtained at 600 °C (a), 800 °C (b) and 900 °C (c) and
g-N-MM-Cnet (obtained at 1000 °C) after removal of TiO2 or TiN templates. Scale bar: 1 m.
All the carbon sample were three-dimensional interconnected carbon networks as clearly seen in
the amplified SEM images with nanoscale “net” holes. The morphology of carbon nets did not
change significantly as elevating the annealing temperature.
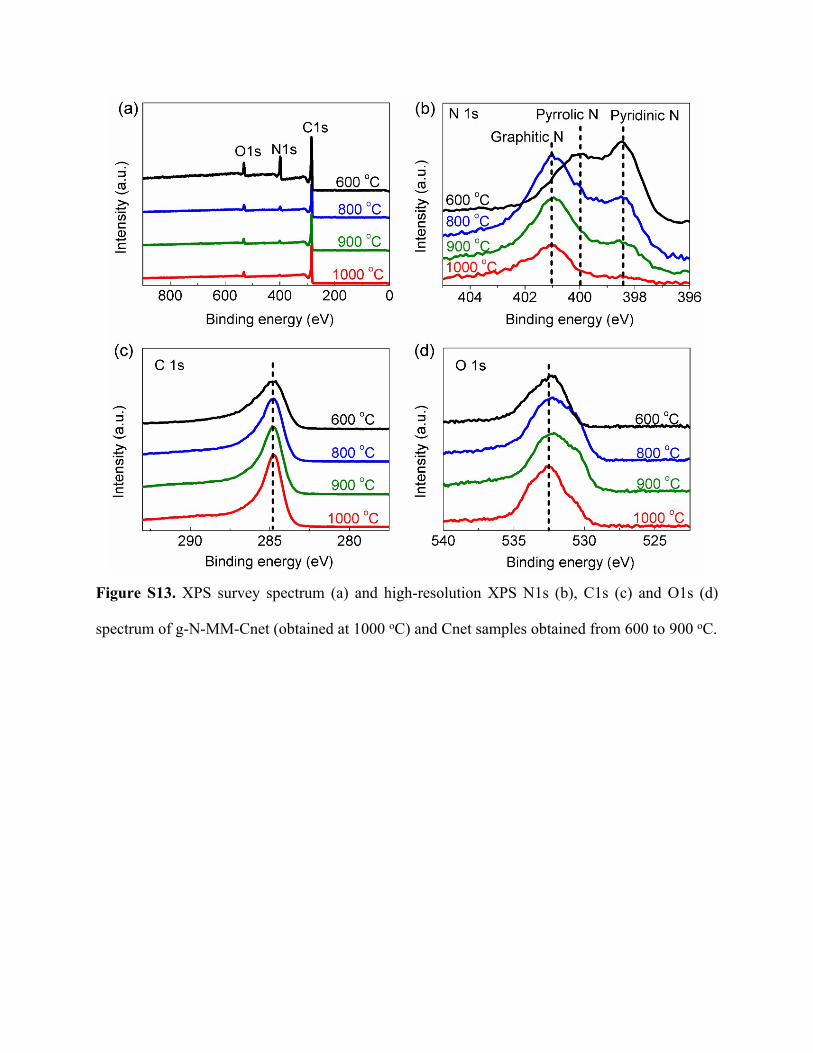
Figure S13. XPS survey spectrum (a) and high-resolution XPS N1s (b), C1s (c) and O1s (d)
spectrum of g-N-MM-Cnet (obtained at 1000 oC) and Cnet samples obtained from 600 to 900 oC.
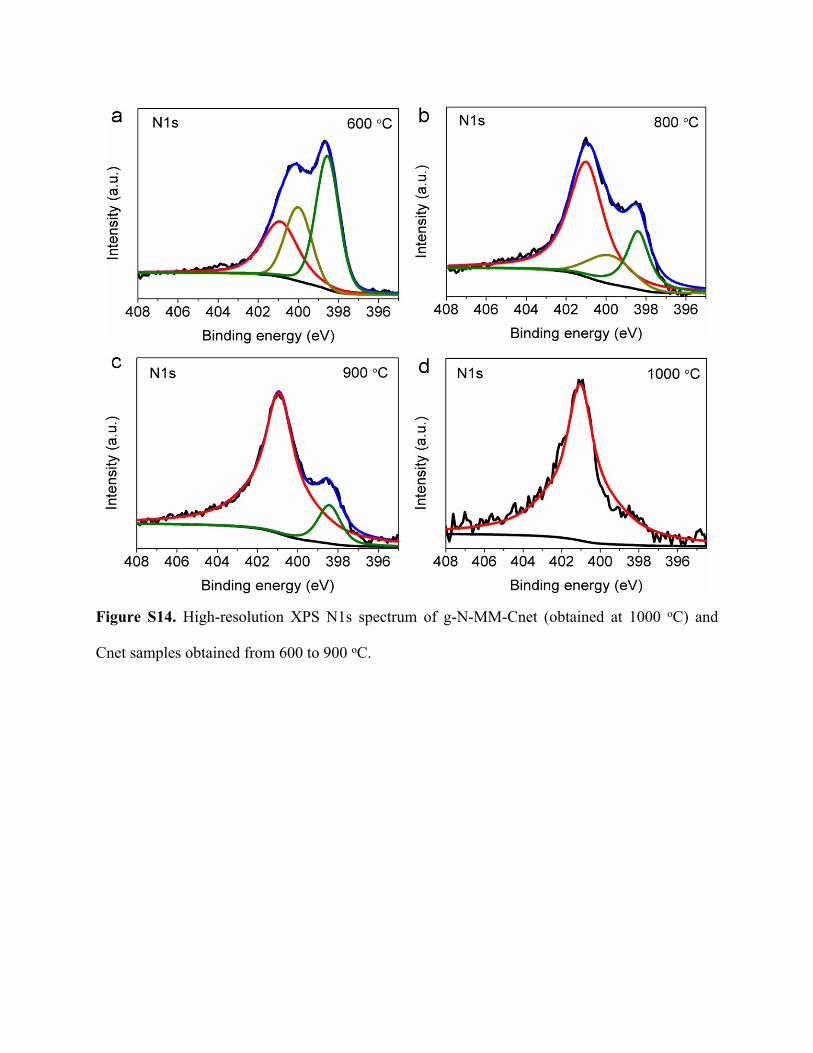
Figure S14. High-resolution XPS N1s spectrum of g-N-MM-Cnet (obtained at 1000 oC) and
Cnet samples obtained from 600 to 900 oC.
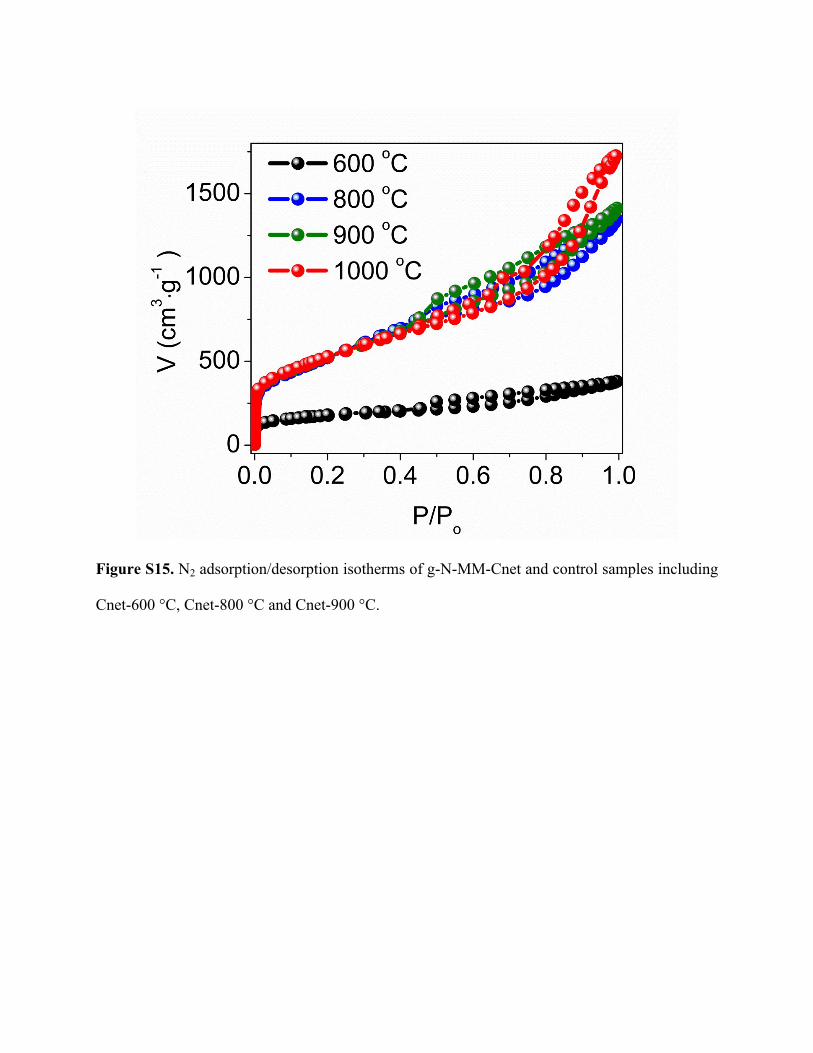
Figure S15. N2 adsorption/desorption isotherms of g-N-MM-Cnet and control samples including
Cnet-600 °C, Cnet-800 °C and Cnet-900 °C.
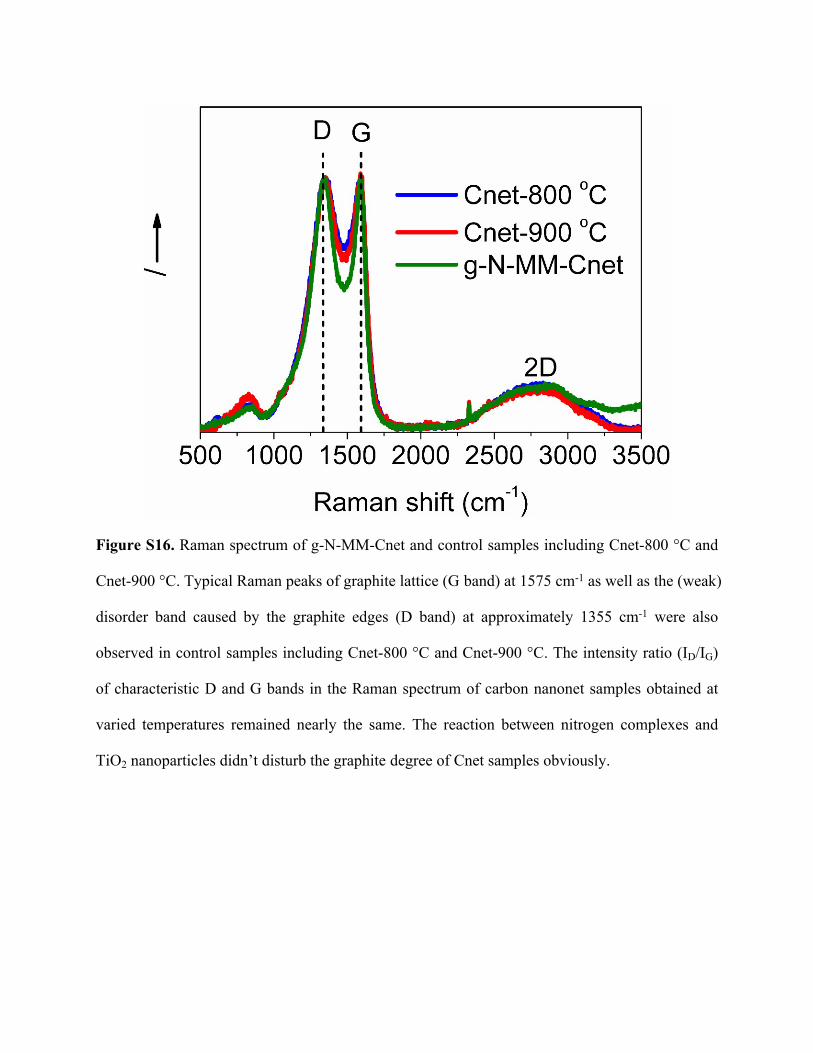
Figure S16. Raman spectrum of g-N-MM-Cnet and control samples including Cnet-800 °C and
Cnet-900 °C. Typical Raman peaks of graphite lattice (G band) at 1575 cm-1 as well as the (weak)
disorder band caused by the graphite edges (D band) at approximately 1355 cm-1 were also
observed in control samples including Cnet-800 °C and Cnet-900 °C. The intensity ratio (ID/IG)
of characteristic D and G bands in the Raman spectrum of carbon nanonet samples obtained at
varied temperatures remained nearly the same. The reaction between nitrogen complexes and
TiO2 nanoparticles didn’t disturb the graphite degree of Cnet samples obviously.
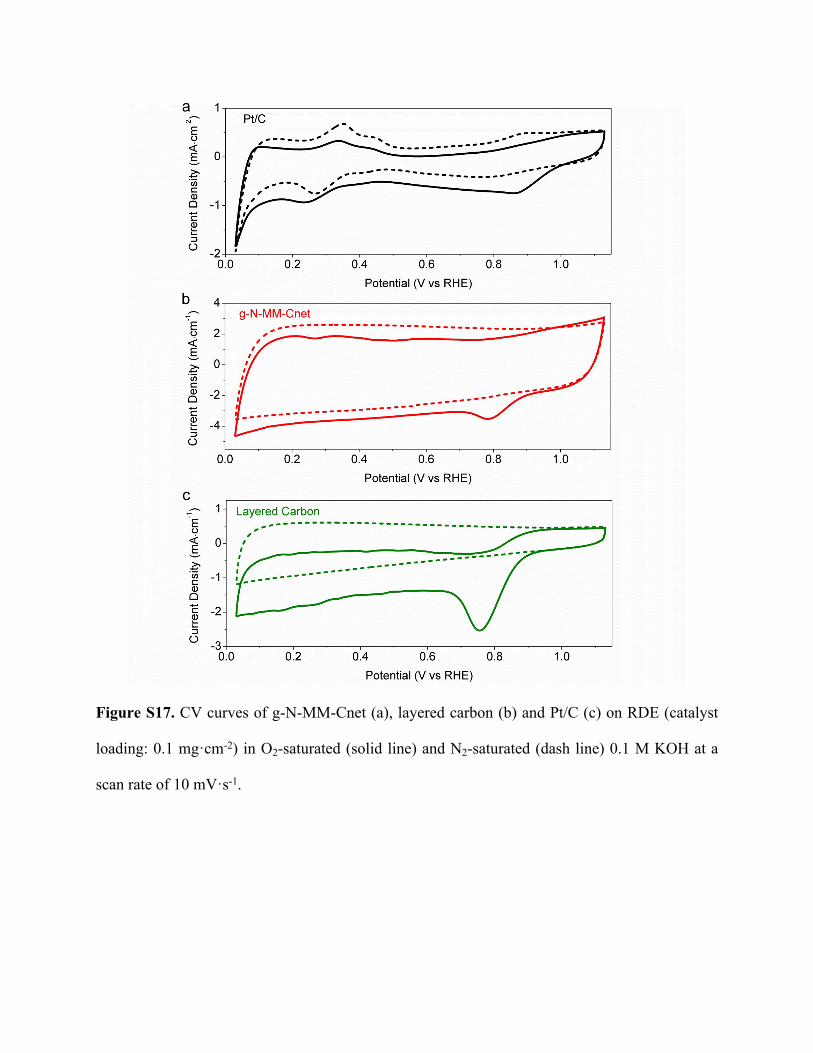
Figure S17. CV curves of g-N-MM-Cnet (a), layered carbon (b) and Pt/C (c) on RDE (catalyst
loading: 0.1 mg·cm-2) in O2-saturated (solid line) and N2-saturated (dash line) 0.1 M KOH at a
scan rate of 10 mV·s-1.
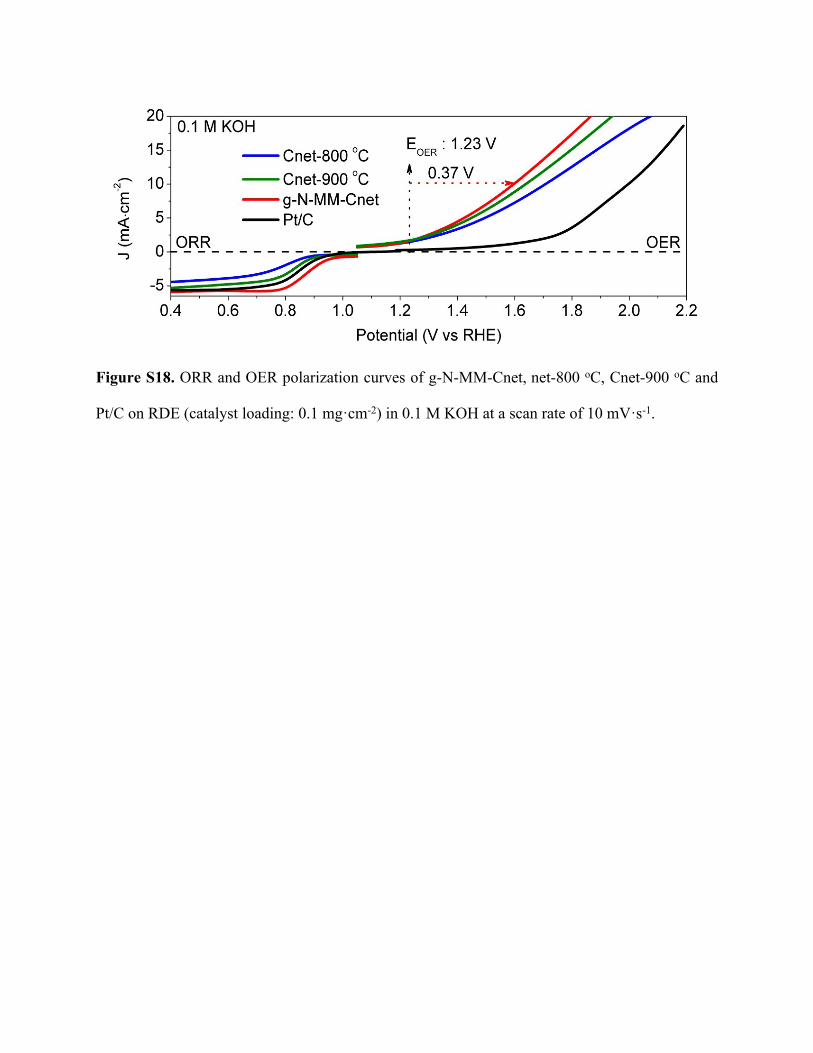
Figure S18. ORR and OER polarization curves of g-N-MM-Cnet, net-800 oC, Cnet-900 oC and
Pt/C on RDE (catalyst loading: 0.1 mg·cm-2) in 0.1 M KOH at a scan rate of 10 mV·s-1.
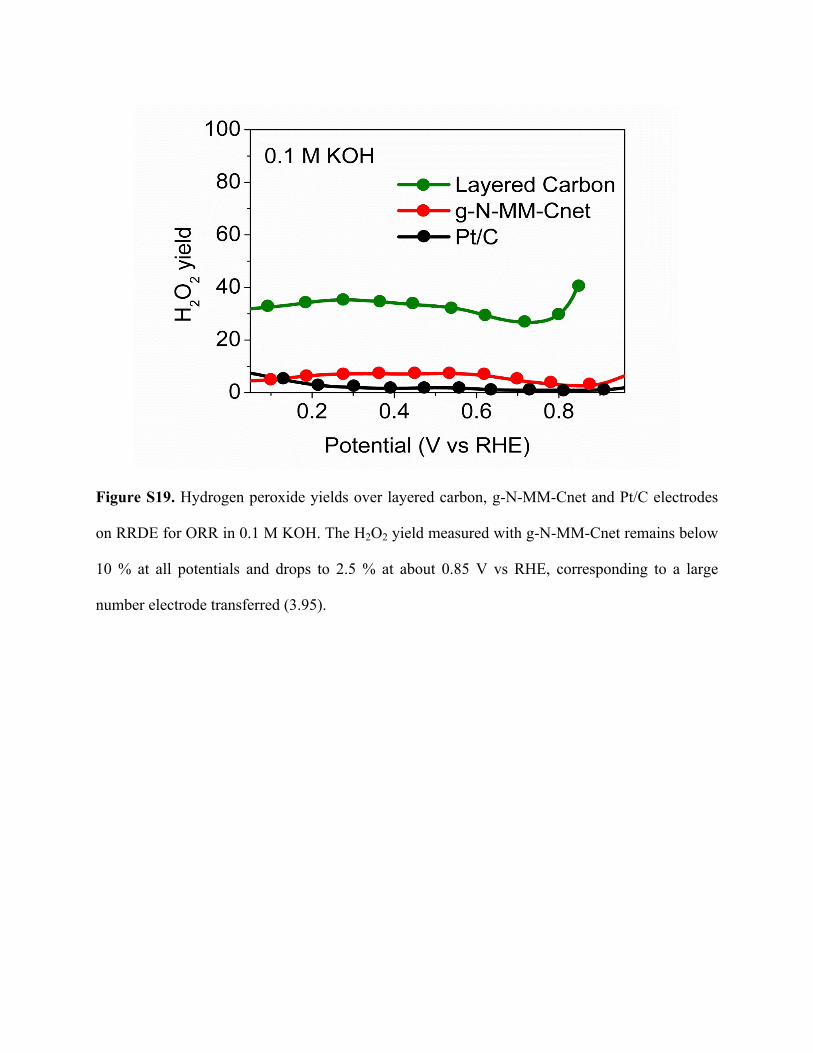
Figure S19. Hydrogen peroxide yields over layered carbon, g-N-MM-Cnet and Pt/C electrodes
on RRDE for ORR in 0.1 M KOH. The H2O2 yield measured with g-N-MM-Cnet remains below
10 % at all potentials and drops to 2.5 % at about 0.85 V vs RHE, corresponding to a large
number electrode transferred (3.95).
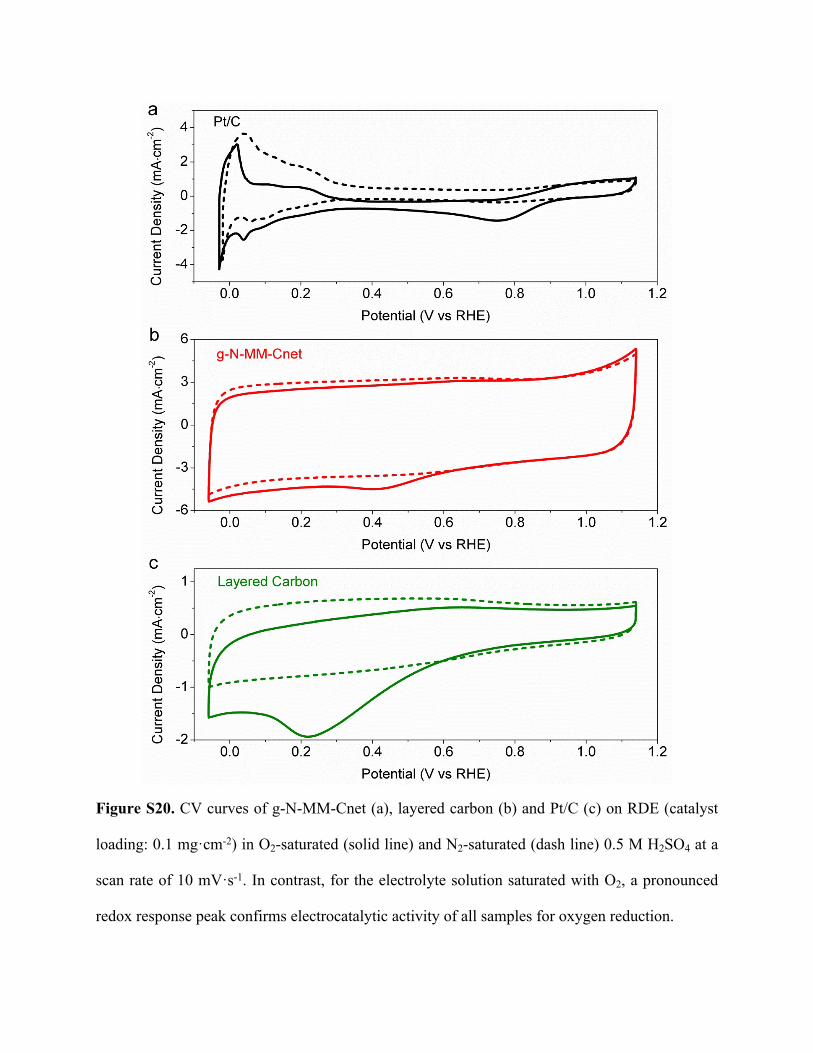
Figure S20. CV curves of g-N-MM-Cnet (a), layered carbon (b) and Pt/C (c) on RDE (catalyst
loading: 0.1 mg·cm-2) in O2-saturated (solid line) and N2-saturated (dash line) 0.5 M H2SO4 at a
scan rate of 10 mV·s-1. In contrast, for the electrolyte solution saturated with O2, a pronounced
redox response peak confirms electrocatalytic activity of all samples for oxygen reduction.
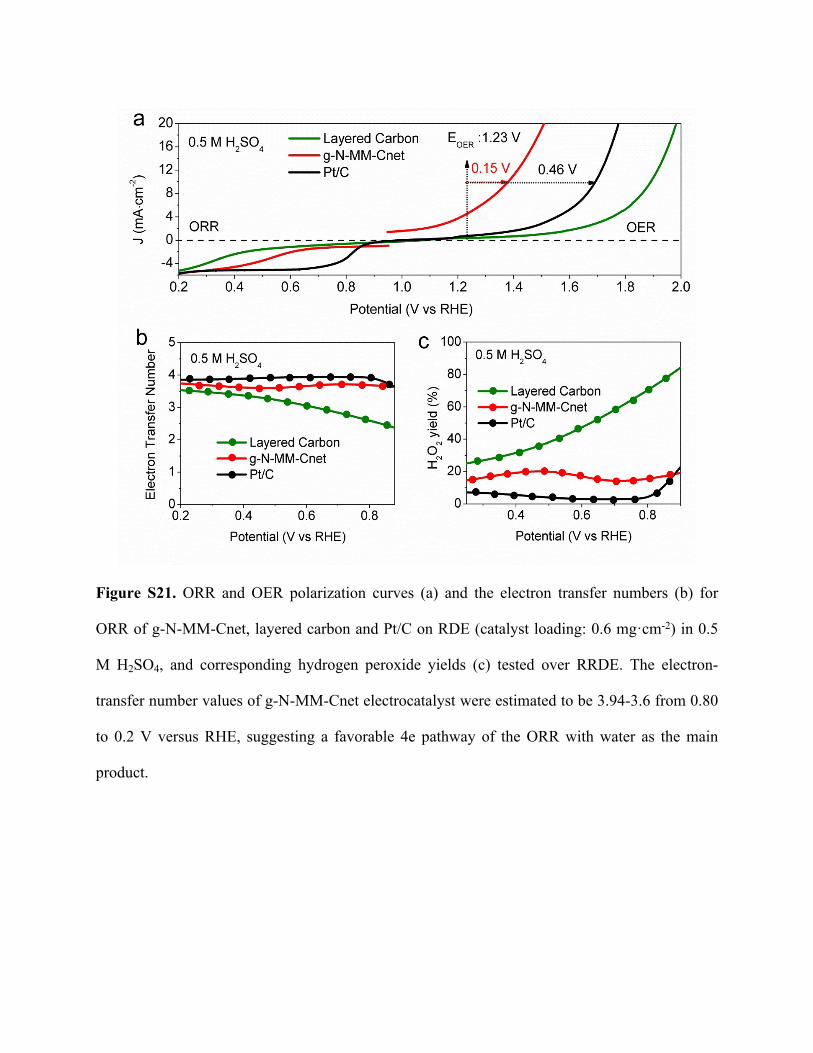
Figure S21. ORR and OER polarization curves (a) and the electron transfer numbers (b) for
ORR of g-N-MM-Cnet, layered carbon and Pt/C on RDE (catalyst loading: 0.6 mg·cm-2) in 0.5
M H2SO4, and corresponding hydrogen peroxide yields (c) tested over RRDE. The electron-
transfer number values of g-N-MM-Cnet electrocatalyst were estimated to be 3.94-3.6 from 0.80
to 0.2 V versus RHE, suggesting a favorable 4e pathway of the ORR with water as the main
product.
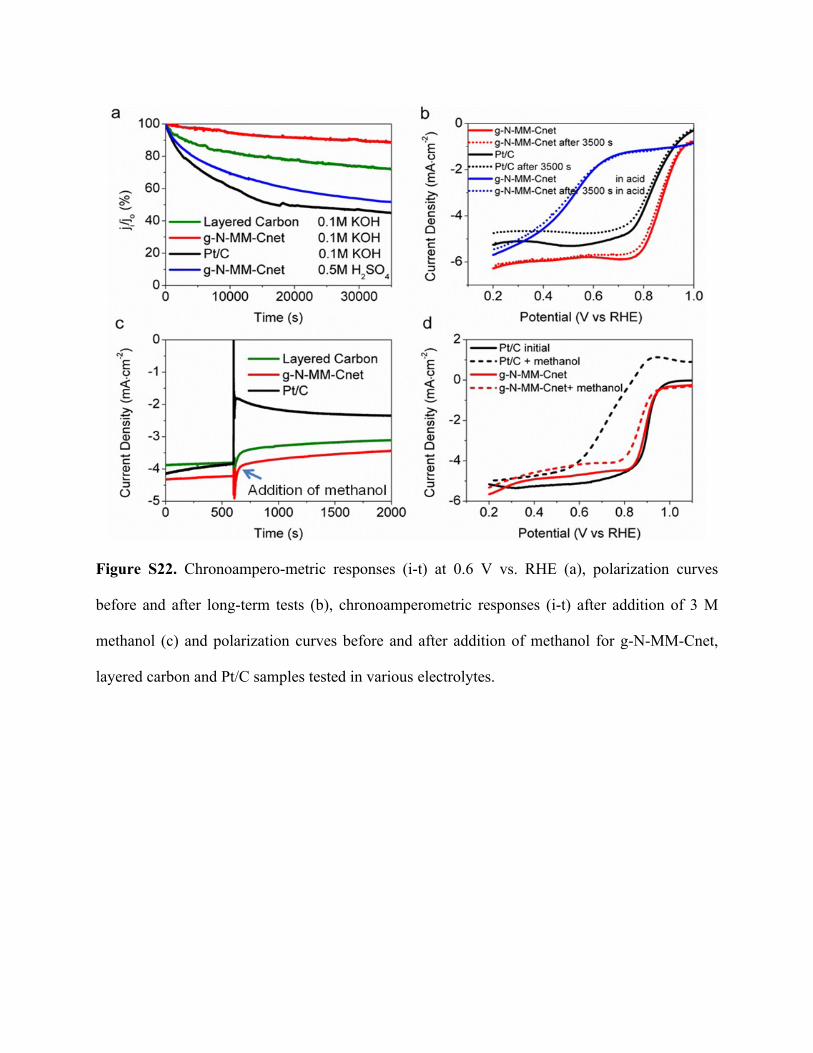
Figure S22. Chronoampero-metric responses (i-t) at 0.6 V vs. RHE (a), polarization curves
before and after long-term tests (b), chronoamperometric responses (i-t) after addition of 3 M
methanol (c) and polarization curves before and after addition of methanol for g-N-MM-Cnet,
layered carbon and Pt/C samples tested in various electrolytes.
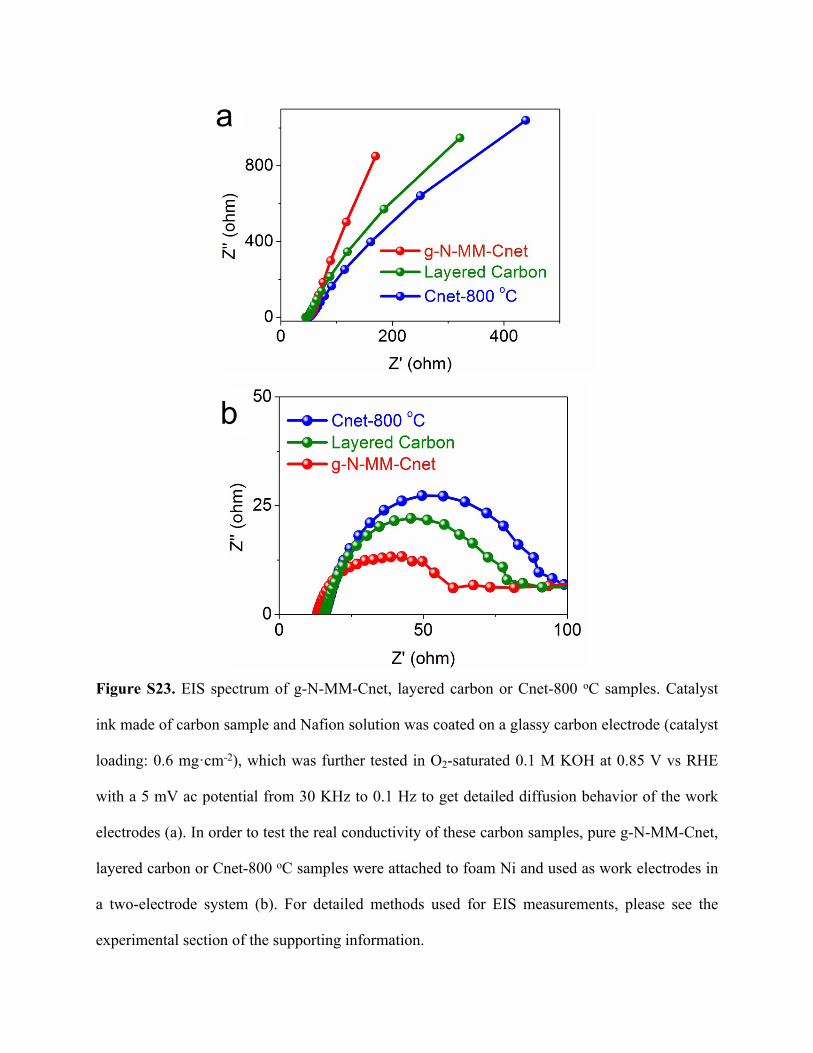
Figure S23. EIS spectrum of g-N-MM-Cnet, layered carbon or Cnet-800 oC samples. Catalyst
ink made of carbon sample and Nafion solution was coated on a glassy carbon electrode (catalyst
loading: 0.6 mg·cm-2), which was further tested in O2-saturated 0.1 M KOH at 0.85 V vs RHE
with a 5 mV ac potential from 30 KHz to 0.1 Hz to get detailed diffusion behavior of the work
electrodes (a). In order to test the real conductivity of these carbon samples, pure g-N-MM-Cnet,
layered carbon or Cnet-800 oC samples were attached to foam Ni and used as work electrodes in
a two-electrode system (b). For detailed methods used for EIS measurements, please see the
experimental section of the supporting information.
a
b

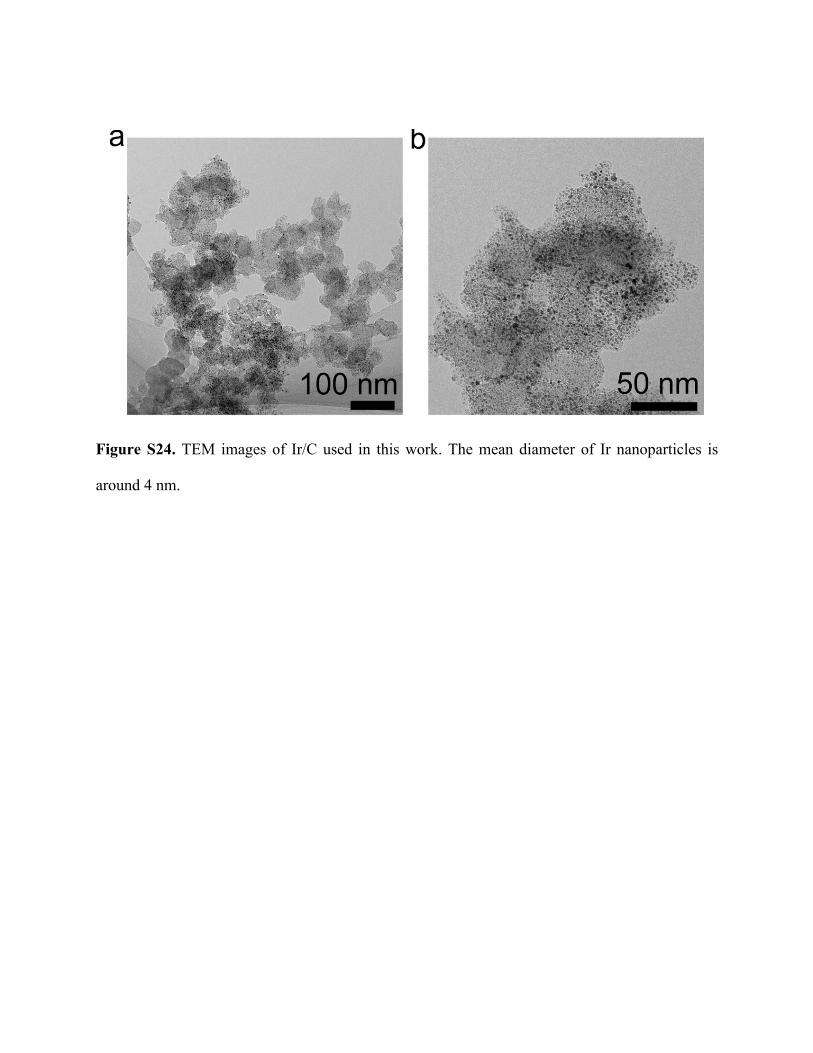
Figure S24. TEM images of Ir/C used in this work. The mean diameter of Ir nanoparticles is
around 4 nm.
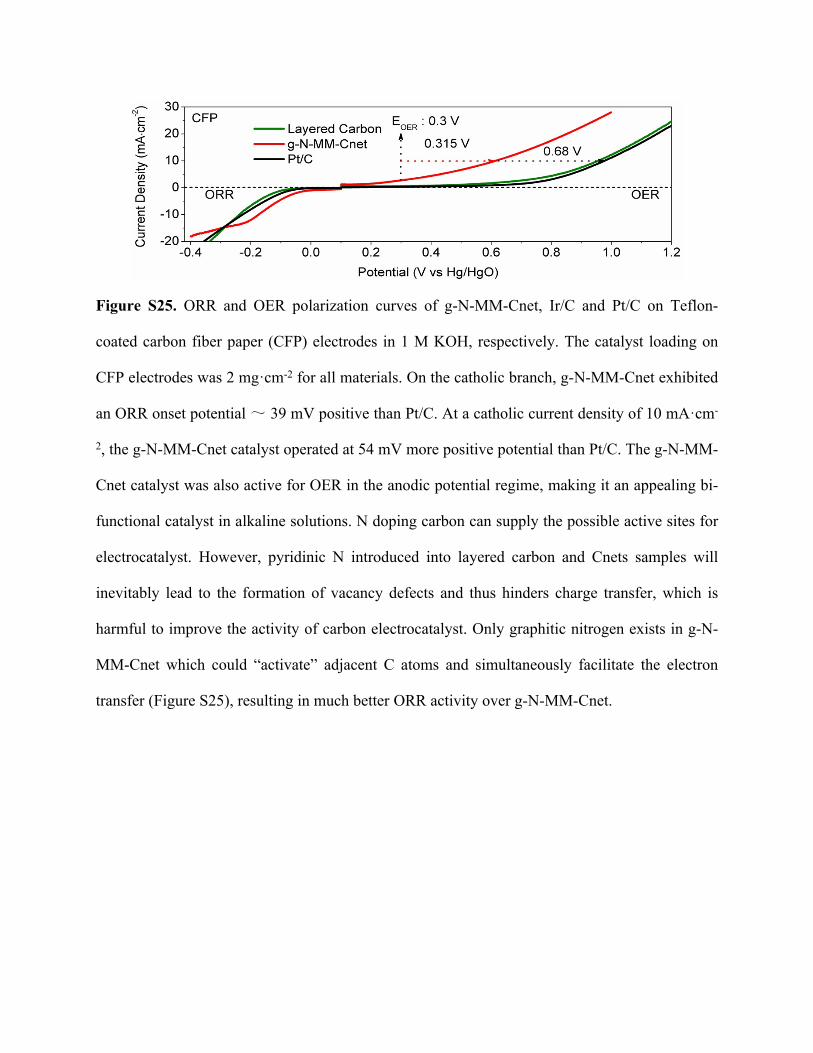
Figure S25. ORR and OER polarization curves of g-N-MM-Cnet, Ir/C and Pt/C on Teflon-
coated carbon fiber paper (CFP) electrodes in 1 M KOH, respectively. The catalyst loading on
CFP electrodes was 2 mg·cm-2 for all materials. On the catholic branch, g-N-MM-Cnet exhibited
an ORR onset potential ~ 39 mV positive than Pt/C. At a catholic current density of 10 mA·cm-
2, the g-N-MM-Cnet catalyst operated at 54 mV more positive potential than Pt/C. The g-N-MM-
Cnet catalyst was also active for OER in the anodic potential regime, making it an appealing bi-
functional catalyst in alkaline solutions. N doping carbon can supply the possible active sites for
electrocatalyst. However, pyridinic N introduced into layered carbon and Cnets samples will
inevitably lead to the formation of vacancy defects and thus hinders charge transfer, which is
harmful to improve the activity of carbon electrocatalyst. Only graphitic nitrogen exists in g-N-
MM-Cnet which could “activate” adjacent C atoms and simultaneously facilitate the electron
transfer (Figure S25), resulting in much better ORR activity over g-N-MM-Cnet.
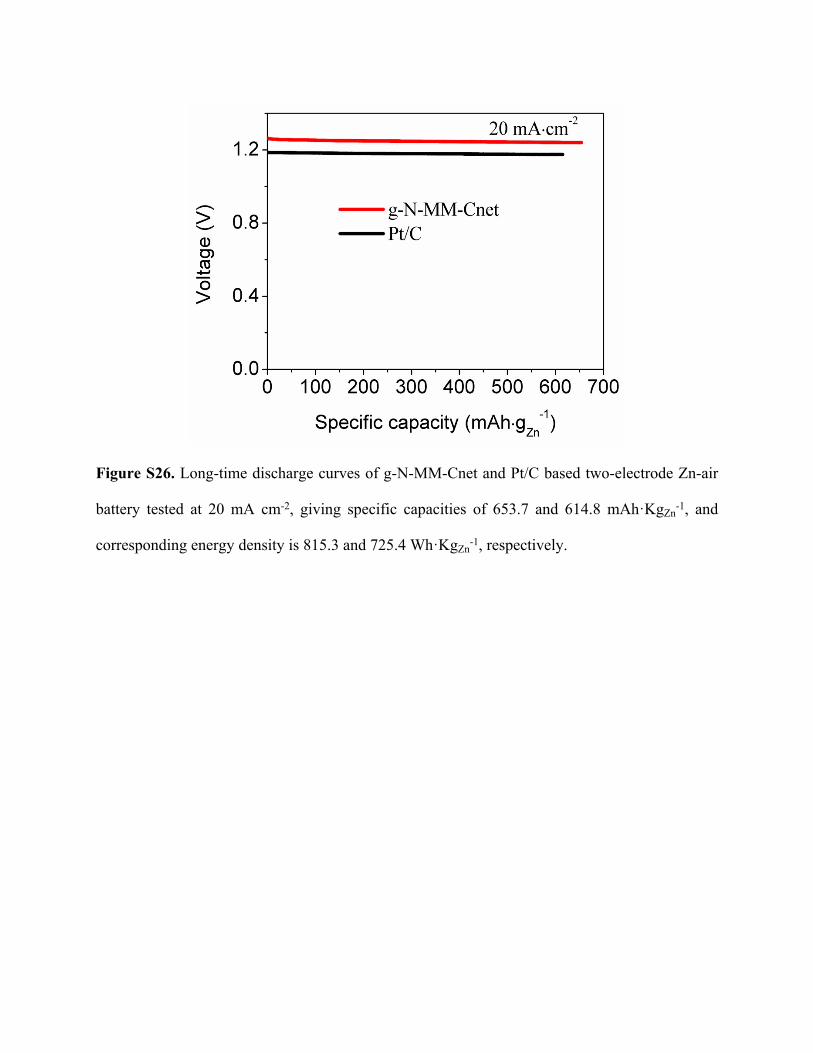
Figure S26. Long-time discharge curves of g-N-MM-Cnet and Pt/C based two-electrode Zn-air
battery tested at 20 mA cm-2, giving specific capacities of 653.7 and 614.8 mAh·KgZn-1, and
corresponding energy density is 815.3 and 725.4 Wh·KgZn-1, respectively.
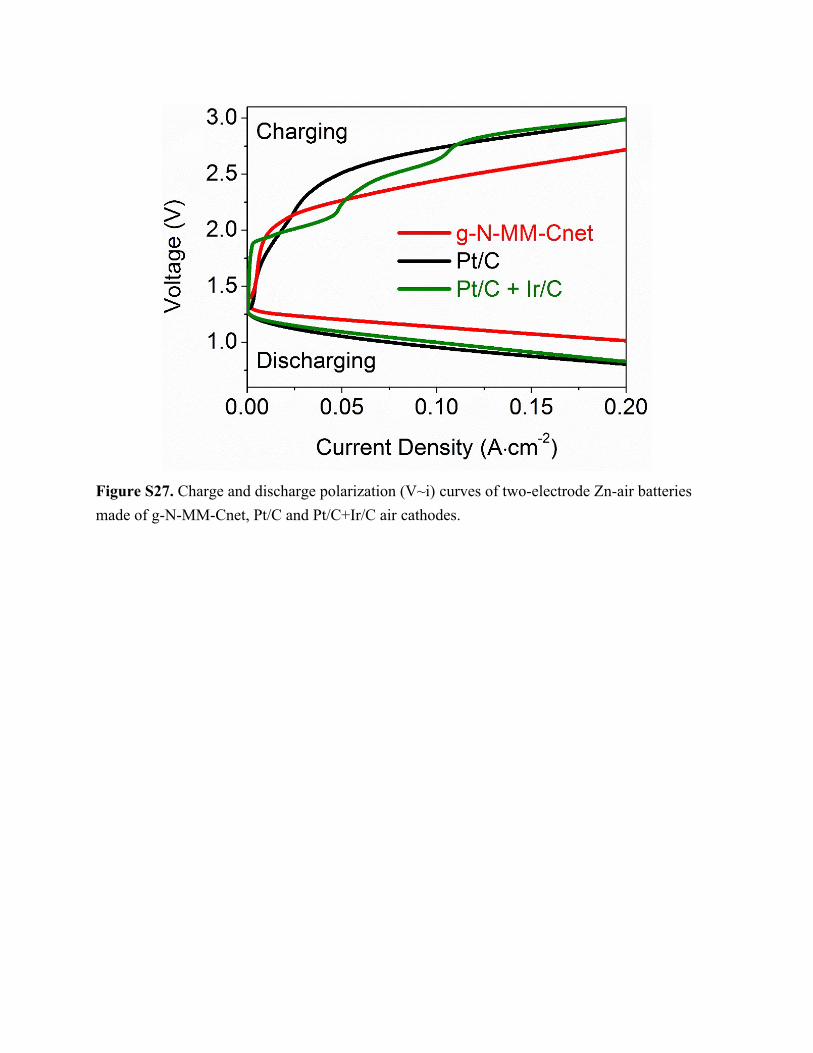
Figure S27. Charge and discharge polarization (V~i) curves of two-electrode Zn-air batteries made of g-N-MM-Cnet, Pt/C and Pt/C+Ir/C air cathodes.
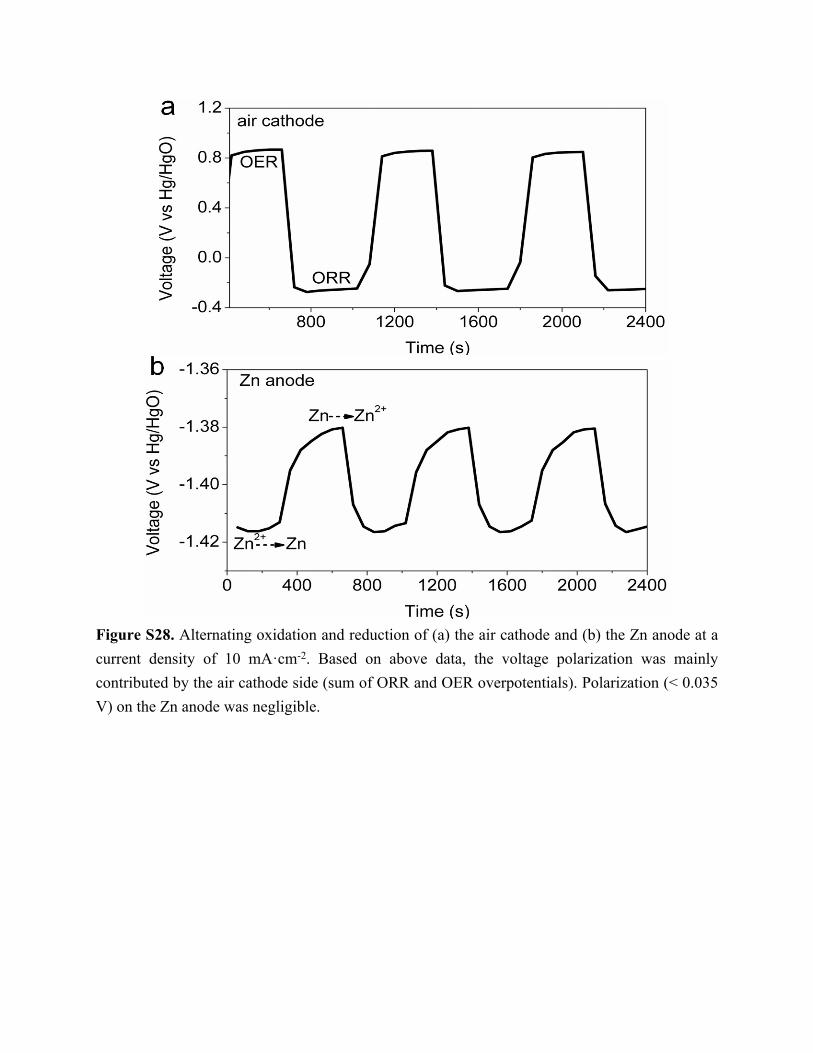
Figure S28. Alternating oxidation and reduction of (a) the air cathode and (b) the Zn anode at a current density of 10 mA·cm-2. Based on above data, the voltage polarization was mainly contributed by the air cathode side (sum of ORR and OER overpotentials). Polarization (< 0.035 V) on the Zn anode was negligible.
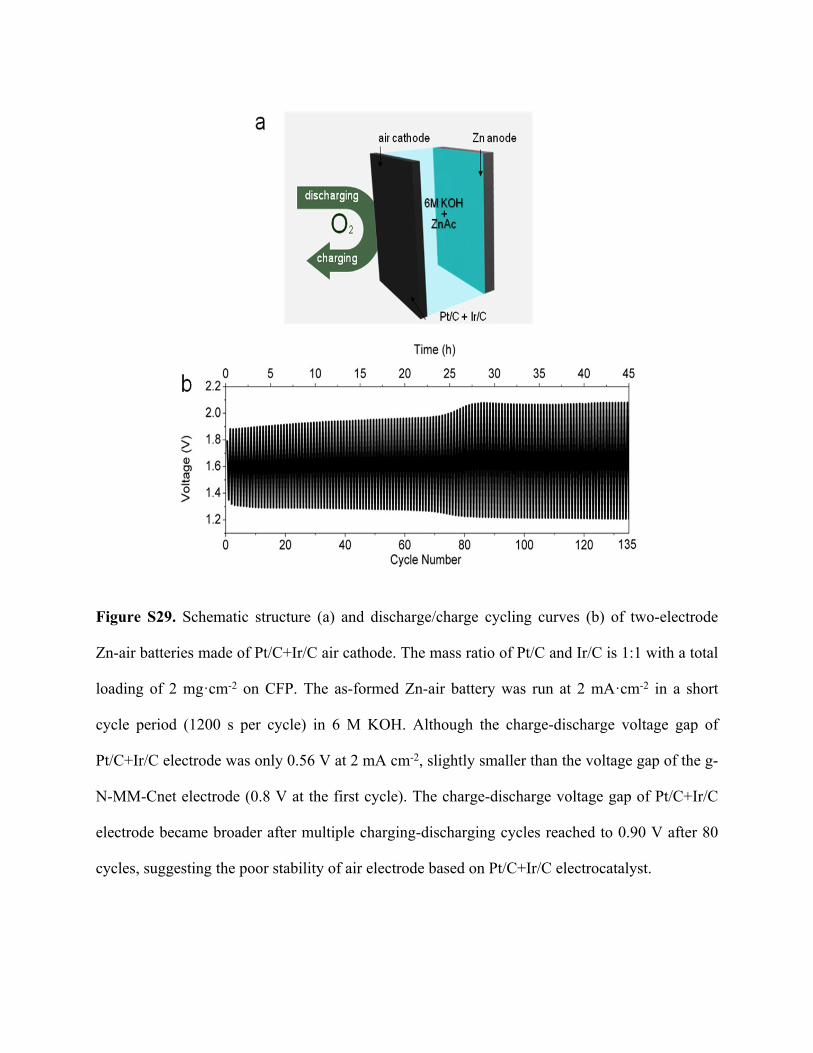
Figure S29. Schematic structure (a) and discharge/charge cycling curves (b) of two-electrode
Zn-air batteries made of Pt/C+Ir/C air cathode. The mass ratio of Pt/C and Ir/C is 1:1 with a total
loading of 2 mg·cm-2 on CFP. The as-formed Zn-air battery was run at 2 mA·cm-2 in a short
cycle period (1200 s per cycle) in 6 M KOH. Although the charge-discharge voltage gap of
Pt/C+Ir/C electrode was only 0.56 V at 2 mA cm-2, slightly smaller than the voltage gap of the g-
N-MM-Cnet electrode (0.8 V at the first cycle). The charge-discharge voltage gap of Pt/C+Ir/C
electrode became broader after multiple charging-discharging cycles reached to 0.90 V after 80
cycles, suggesting the poor stability of air electrode based on Pt/C+Ir/C electrocatalyst.
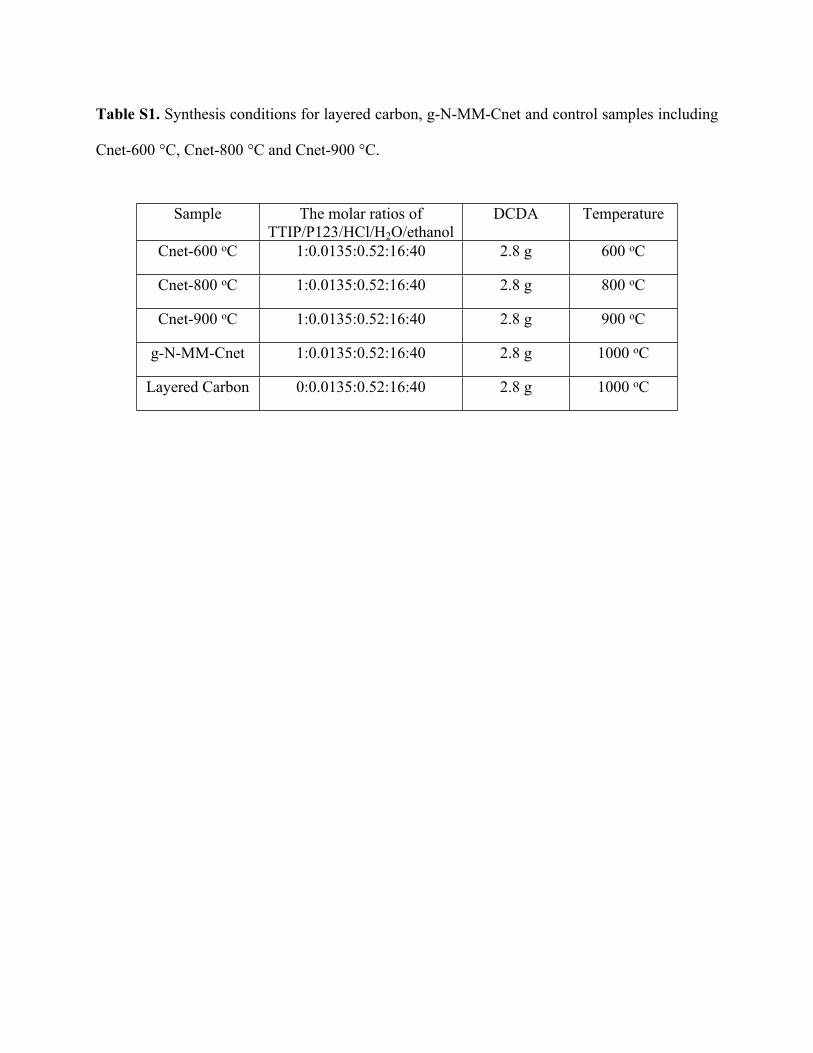
Table S1. Synthesis conditions for layered carbon, g-N-MM-Cnet and control samples including
Cnet-600 °C, Cnet-800 °C and Cnet-900 °C.
Sample The molar ratios of TTIP/P123/HCl/H2O/ethanol
DCDA Temperature
Cnet-600 oC 1:0.0135:0.52:16:40 2.8 g 600 oC
Cnet-800 oC 1:0.0135:0.52:16:40 2.8 g 800 oC
Cnet-900 oC 1:0.0135:0.52:16:40 2.8 g 900 oC
g-N-MM-Cnet 1:0.0135:0.52:16:40 2.8 g 1000 oC
Layered Carbon 0:0.0135:0.52:16:40 2.8 g 1000 oC
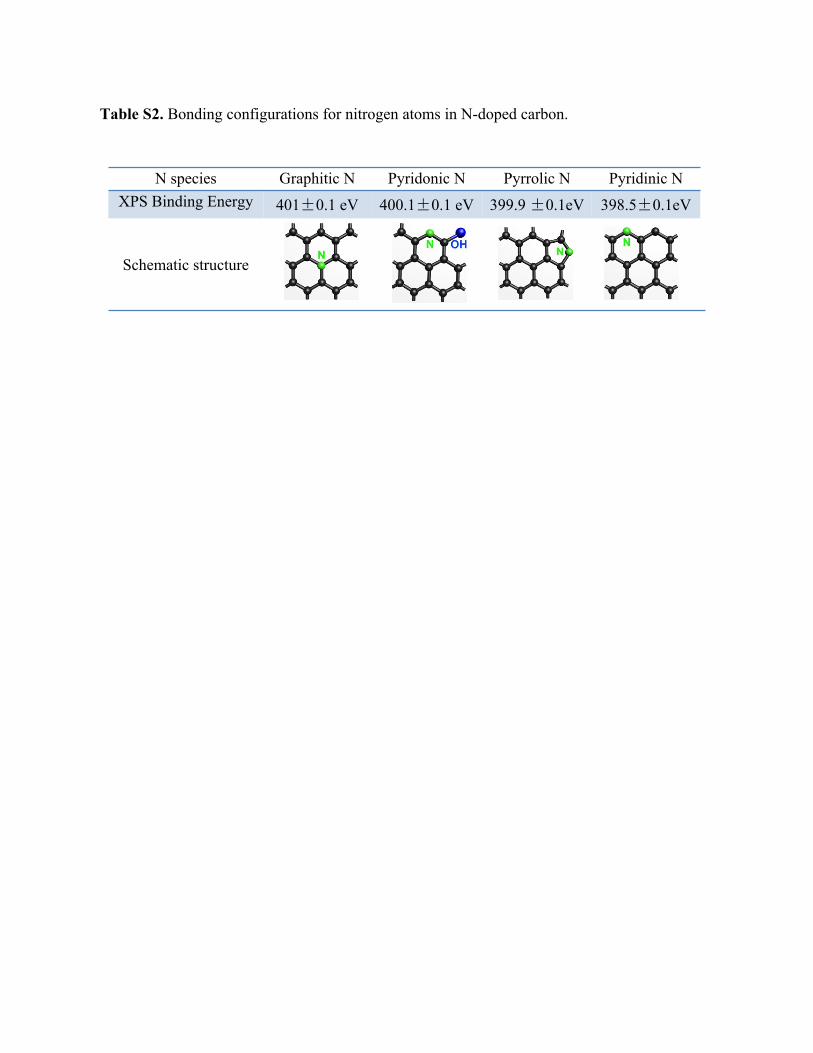
Table S2. Bonding configurations for nitrogen atoms in N-doped carbon.
N species Graphitic N Pyridonic N Pyrrolic N Pyridinic NXPS Binding Energy 401±0.1 eV 400.1±0.1 eV 399.9 ±0.1eV 398.5±0.1eV
Schematic structure
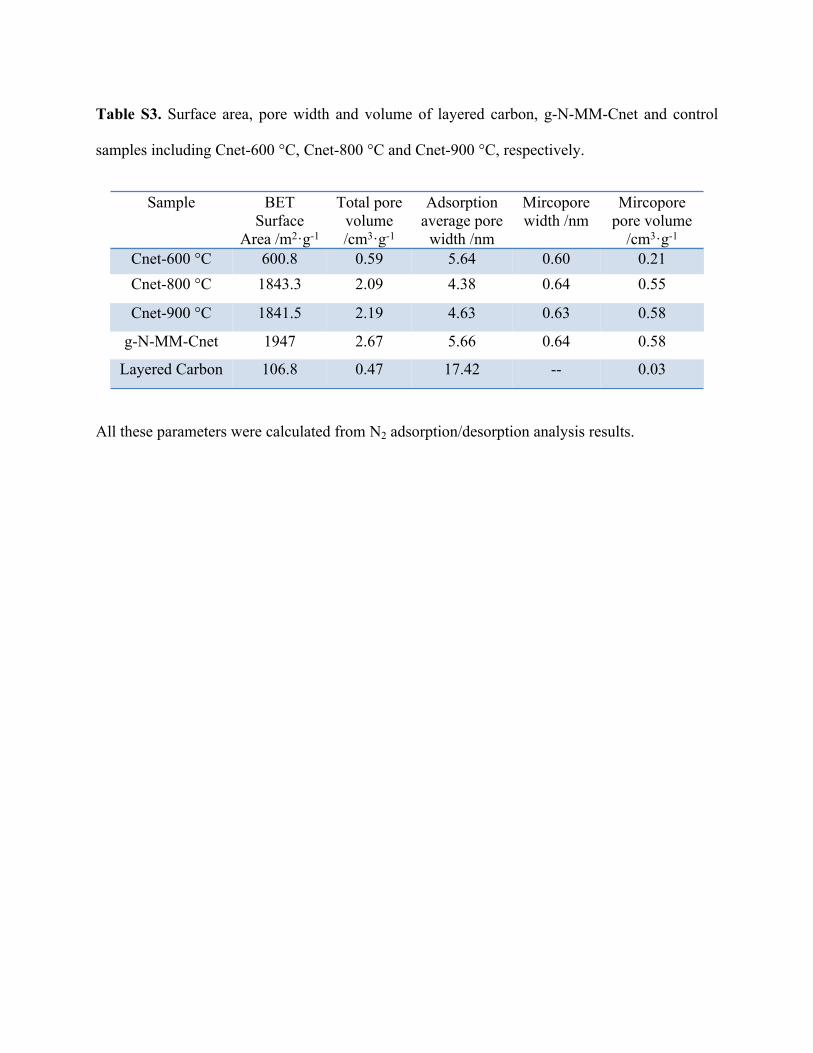
Table S3. Surface area, pore width and volume of layered carbon, g-N-MM-Cnet and control
samples including Cnet-600 °C, Cnet-800 °C and Cnet-900 °C, respectively.
Sample BET Surface
Area /m2·g-1
Total pore volume /cm3·g-1
Adsorption average pore
width /nm
Mircopore width /nm
Mircopore pore volume
/cm3·g-1
Cnet-600 °C 600.8 0.59 5.64 0.60 0.21Cnet-800 °C 1843.3 2.09 4.38 0.64 0.55
Cnet-900 °C 1841.5 2.19 4.63 0.63 0.58
g-N-MM-Cnet 1947 2.67 5.66 0.64 0.58
Layered Carbon 106.8 0.47 17.42 -- 0.03
All these parameters were calculated from N2 adsorption/desorption analysis results.
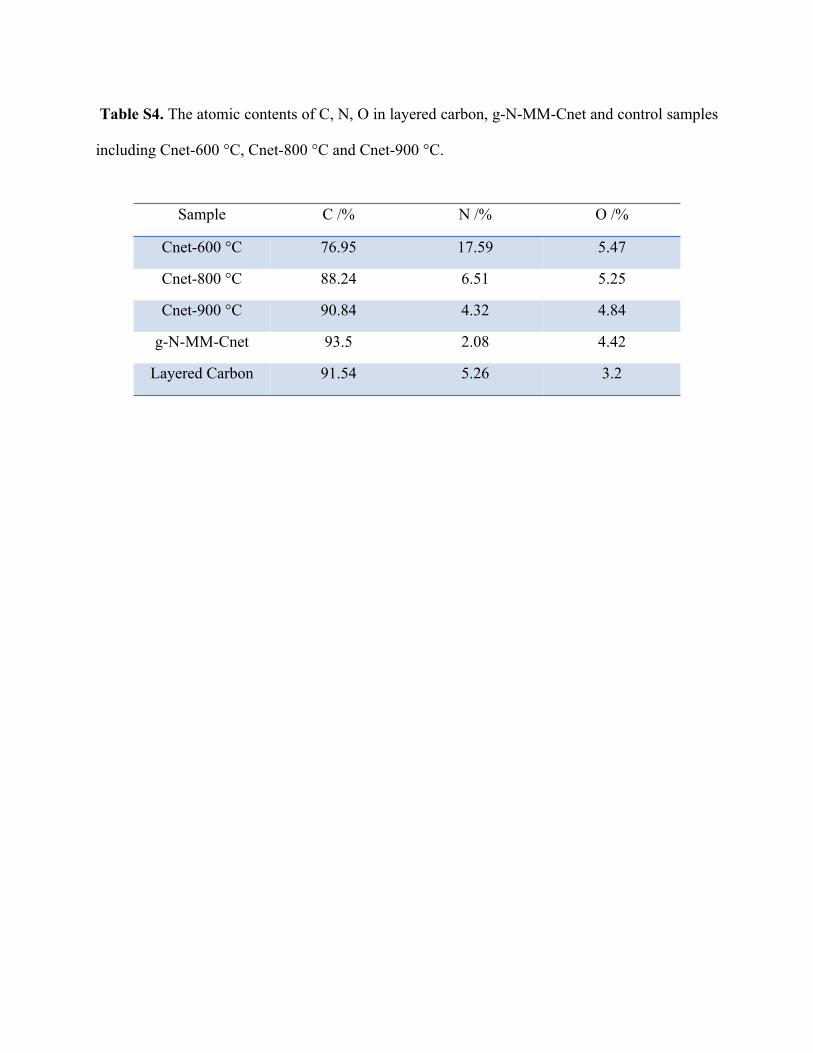
Table S4. The atomic contents of C, N, O in layered carbon, g-N-MM-Cnet and control samples
including Cnet-600 °C, Cnet-800 °C and Cnet-900 °C.
Sample C /% N /% O /%
Cnet-600 °C 76.95 17.59 5.47
Cnet-800 °C 88.24 6.51 5.25
Cnet-900 °C 90.84 4.32 4.84
g-N-MM-Cnet 93.5 2.08 4.42
Layered Carbon 91.54 5.26 3.2
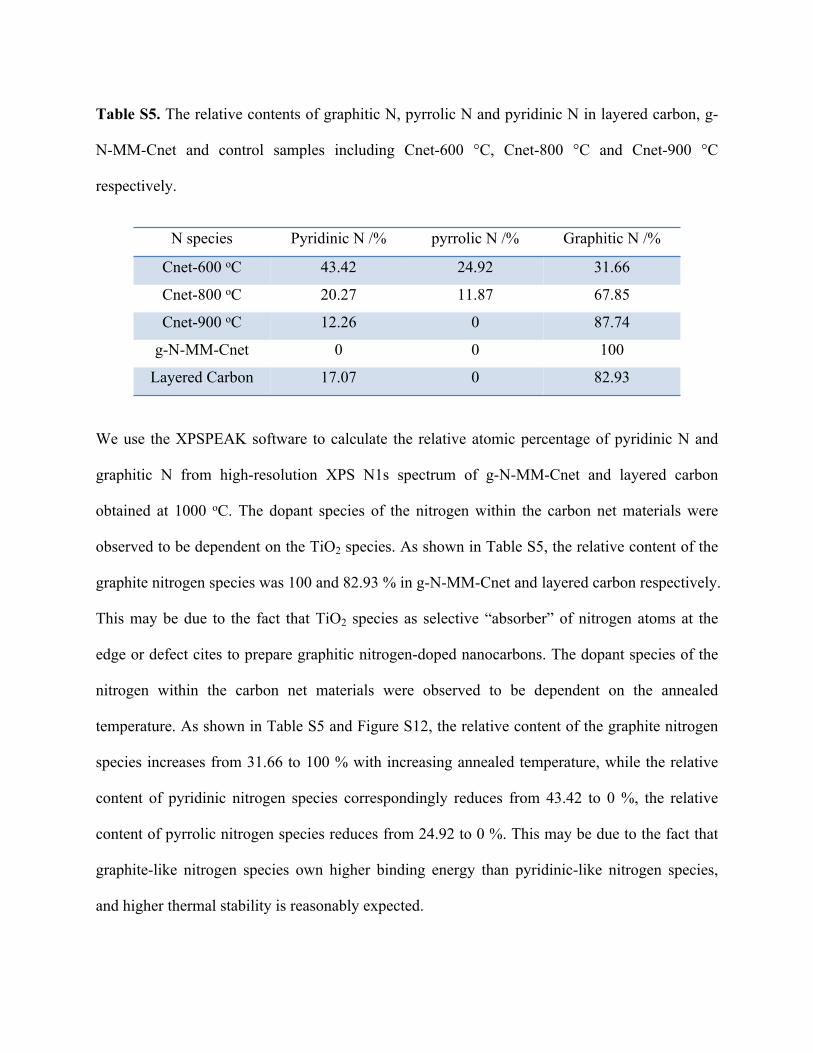
Table S5. The relative contents of graphitic N, pyrrolic N and pyridinic N in layered carbon, g-
N-MM-Cnet and control samples including Cnet-600 °C, Cnet-800 °C and Cnet-900 °C
respectively.
N species Pyridinic N /% pyrrolic N /% Graphitic N /%
Cnet-600 oC 43.42 24.92 31.66
Cnet-800 oC 20.27 11.87 67.85
Cnet-900 oC 12.26 0 87.74
g-N-MM-Cnet 0 0 100
Layered Carbon 17.07 0 82.93
We use the XPSPEAK software to calculate the relative atomic percentage of pyridinic N and
graphitic N from high-resolution XPS N1s spectrum of g-N-MM-Cnet and layered carbon
obtained at 1000 oC. The dopant species of the nitrogen within the carbon net materials were
observed to be dependent on the TiO2 species. As shown in Table S5, the relative content of the
graphite nitrogen species was 100 and 82.93 % in g-N-MM-Cnet and layered carbon respectively.
This may be due to the fact that TiO2 species as selective “absorber” of nitrogen atoms at the
edge or defect cites to prepare graphitic nitrogen-doped nanocarbons. The dopant species of the
nitrogen within the carbon net materials were observed to be dependent on the annealed
temperature. As shown in Table S5 and Figure S12, the relative content of the graphite nitrogen
species increases from 31.66 to 100 % with increasing annealed temperature, while the relative
content of pyridinic nitrogen species correspondingly reduces from 43.42 to 0 %, the relative
content of pyrrolic nitrogen species reduces from 24.92 to 0 %. This may be due to the fact that
graphite-like nitrogen species own higher binding energy than pyridinic-like nitrogen species,
and higher thermal stability is reasonably expected.
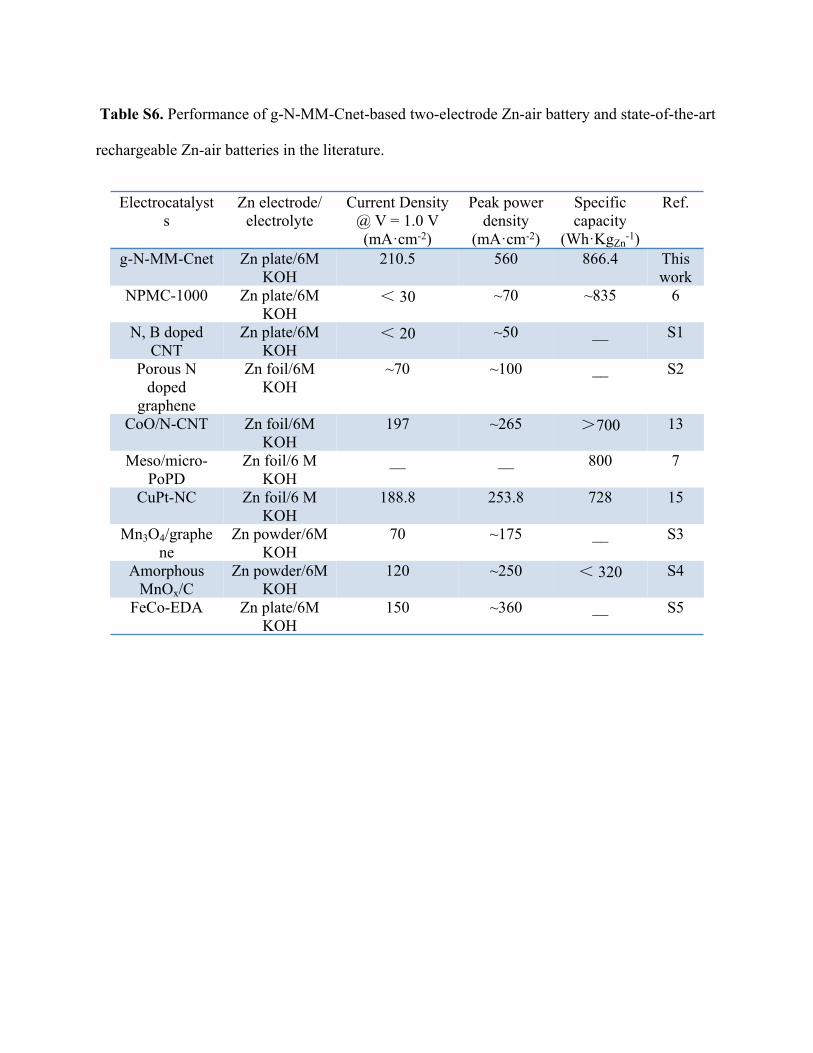
Table S6. Performance of g-N-MM-Cnet-based two-electrode Zn-air battery and state-of-the-art
rechargeable Zn-air batteries in the literature.
Electrocatalysts
Zn electrode/ electrolyte
Current Density @ V = 1.0 V (mA·cm-2)
Peak power density
(mA·cm-2)
Specific capacity
(Wh·KgZn-1)
Ref.
g-N-MM-Cnet Zn plate/6M KOH
210.5 560 866.4 This work
NPMC-1000 Zn plate/6M KOH
< 30 ~70 ~835 6
N, B doped CNT
Zn plate/6M KOH
< 20 ~50 __ S1
Porous N doped
graphene
Zn foil/6M KOH
~70 ~100 __ S2
CoO/N-CNT Zn foil/6M KOH
197 ~265 >700 13
Meso/micro-PoPD
Zn foil/6 M KOH
__ __ 800 7
CuPt-NC Zn foil/6 M KOH
188.8 253.8 728 15
Mn3O4/graphene
Zn powder/6M KOH
70 ~175 __ S3
Amorphous MnOx/C
Zn powder/6M KOH
120 ~250 < 320 S4
FeCo-EDA Zn plate/6M KOH
150 ~360 __ S5
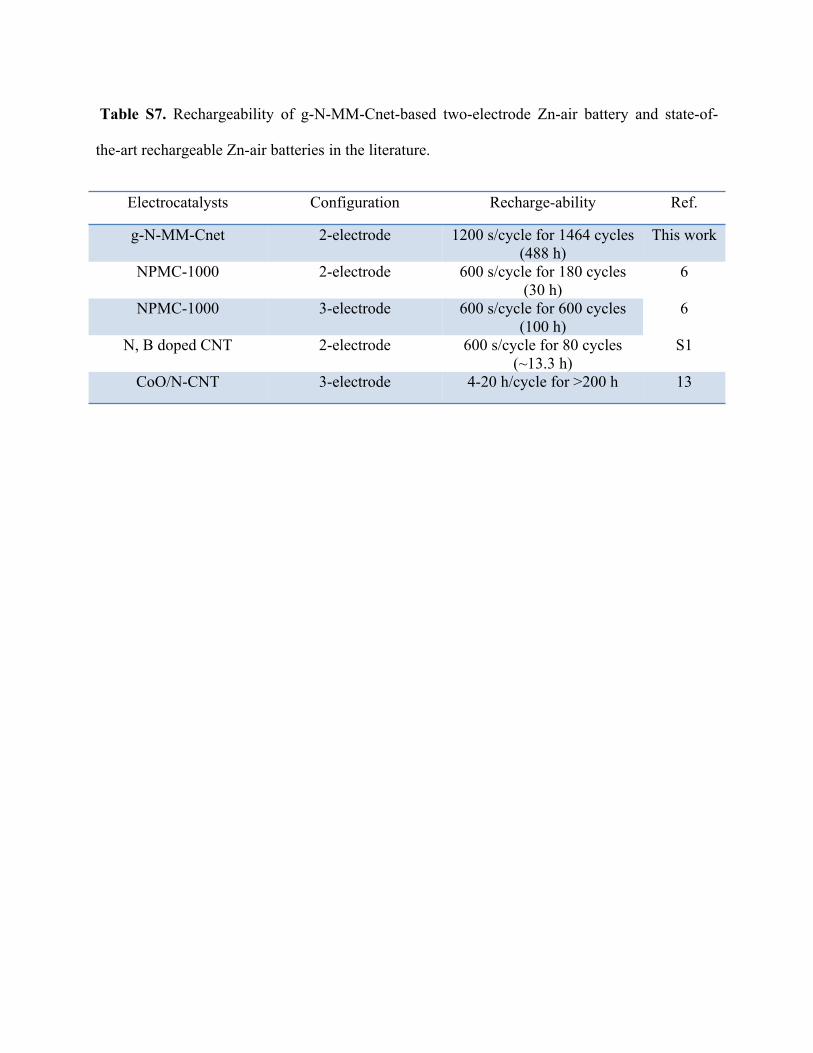
Table S7. Rechargeability of g-N-MM-Cnet-based two-electrode Zn-air battery and state-of-
the-art rechargeable Zn-air batteries in the literature.
Electrocatalysts Configuration Recharge-ability Ref.
g-N-MM-Cnet 2-electrode 1200 s/cycle for 1464 cycles (488 h)
This work
NPMC-1000 2-electrode 600 s/cycle for 180 cycles (30 h)
NPMC-1000 3-electrode 600 s/cycle for 600 cycles (100 h)
6
6
N, B doped CNT 2-electrode 600 s/cycle for 80 cycles (~13.3 h)
S1
CoO/N-CNT 3-electrode 4-20 h/cycle for >200 h 13

References
S
1
Y
.
M
.
L
i
u
,
S
.
C
h
e
n
,
X
.
Q
u
a
n
,
H
.

T
.
Y
u
,
H
.
M
.
Z
h
a
o
,
Y
.
B
.
Z
h
a
n
g
a
n
d

G
.
H
.
C
h
e
n
,
J
.
P
h
y
s
.
C
h
e
m
.
C,
2
0
1
3
,
1
1

7
,
1
4
9
9
2
-
1
4
9
9
8
.
S
2
Y
.
Q
.
S
u
n
,
C
.
L
i
a

n
d
G
.
Q
.
S
h
i
,
J
.
M
a
t
e
r
.
C
h
e
m
.,
2
0
1
2
,
2

2
,
1
2
8
1
0
-
1
2
8
1
6
.
S
3
J
.
S
.
L
e
e
,
T
.
L
e
e

,
H
.
K
.
S
o
n
g
,
J
.
C
h
o
a
n
d
B
.
S
.
K
i
m
,

E
n
e
r
g
y
E
n
v
i
r
o
n
.
S
c
i
.,
2
0
1
1
,
4
,
4
1
4
8
-
4
1

5
4
.
S
4
J
.
S
.
L
e
e
,
G
.
S
.
P
a
r
k
,
H
.
I
.
L

e
e
,
S
.
T
.
K
i
m
,
R
.
G
.
C
a
o
,
M
.
L
.
L
i
u

a
n
d
J
.
C
h
o
,
N
a
n
o
L
e
t
t
.,
2
0
1
1
,
1
1
,
5
3
6
2

-
5
3
3
6
.
S
5
Z
.
C
h
e
n
,
J
.
Y
.
C
h
o
i
,
H
.
J
.

W
a
n
g
,
H
.
L
i
a
n
d
Z
.
W
.
C
h
e
n
,
J
.
P
o
w
e

r
S
o
u
r
c
e
s,
2
0
1
1
,
1
9
6
,
3
6
7
3
-
3
6
7
7
.