Embed Size (px)
Citation preview

2 3
Nitrogen Uptake in CornNitrogen (N) use averages 18% and 13% of the variable
costs in a corn-corn and corn-soybean rotation, respectively (Duffy, 2014). Thus, growers must use N efficiently, applying the right rate at the appropriate time to coincide with crop uptake. New research shows that growers must also have a “season-long” N perspective to ensure that crop yield is not limited by insufficient N throughout the entire period of crop uptake.
Increase in Nitrogen Use EfficiencyN application rates on corn acres in the U.S. increased until
about 1980, then plateaued at about 140 lbs N/acre (Figure 1). At the same time, average U.S. corn grain yields increased by about two bu/acre per year (Figure 1). Thus, nitrogen use efficiency (NUE, bu/lb N) has increased significantly. This is due to improved hybrid genetics and agronomic practices.
y = 1.8511x + 69.759
60
70
80
90
100
110
120
130
140
150
160
170
180
60
70
80
90
100
110
120
130
140
150
1965 1970 1975 1980 1985 1990 1995 2000 2005 2010
Gra
in Y
ield
(bu
/acr
e)
Nitr
ogen
(lb
s/ac
re)
bu/acre
lbs N/acre
R2 = 0.8636
Figure 1. Historical nitrogen application rates and grain yields on corn acres in the U.S. Source: USDA.
Grain Nitrogen Content Developing a clear understanding of corn N requirements
at high and low yield levels and under various N supply conditions is integral to NUE improvements. Pioneer studies have shown that the average protein content in a set of modern, elite corn hybrids is 9 to 10% (at yields of 200 to 250 bu/acre). In this high yield example, 1,060 to 1,260 lbs/acre of protein were produced. Converting this to a nitrogen basis, the grain removed approximately 140 to 210 lbs of N/acre, as each unit of N supports 6.25 units of protein production.
The plant’s N demand for grain development is roughly proportional to the grain yield. A review of the most recent literature for modern corn hybrids indicates that when yields exceed 200 bu/acre, grain N removal averages 139 lbs N/acre. The Iowa State University reference guide, Corn Growth and Development, reports an almost identical amount of N in the grain – 137 lb N/acre at yield levels of 25 bu/acre (Figure 2).
Timing and Source of N Uptake
The importance of N uptake prior to flowering cannot be overstated as this N supports critical ear shoot development, kernel number, and potential kernel size. For this reason, corn growers have traditionally targeted N availability to this period and considered post-flowering applications to be of little value. However, extensive research conducted over the last five years has shown that nitrogen needed for grain development
Figure 2. Seasonal N uptake (lbs N/acre) separated into leaf, stalk, tassel, husk+cob, and grain material for a typical corn crop. (Abendroth et al., 2011).
Nitr
ogen
Upt
ake
(lb N
/acr
e)
Perc
ent
(%)
of T
otal
Nitr
ogen
Vegetative (V) Stage Reproductive (R) Stage
© Iowa State University Extension200
160
120
80
80
100
40
40
60
000
E 3 6 69 14 18 1 2 3 4 5
500 1000 1500 2000 2500
20
Stalk and Leaf SheathsLeaf BladesTasselShanks, Husks and CobGrain
originates from both remobilized N (from leaves, stalks, cobs and husks) and continued N uptake from the soil.
A DuPont Pioneer study was conducted at Macomb, IL, in 2012, comparing a “normal” rate of 200 lb N/acre with a “low” rate of 50 lbs N /acre. Resulting yields averaged 250 bu/acre for the normal rate, and 100 bu/acre for the low N rate. In the normal N environment, 130, 170, and 301 lbs N/acre were taken up by V12, R1 and R6, respectively (Figure 3).
Figure 3. Seasonal N uptake (lbs N/acre) for hybrids grown under normal (top) and low (bottom) N supply near Sciota, IL, 2011.
Seas
onal
N U
ptak
e (lb
s N
/acr
e)
0
20
40
60
80
V12 R1 R3 R6
Low N Environment
Vegetative N Grain N
Remobilized N = 31 lbs/acre
Reproductive N = 27 lbs/acre
Seas
onal
N U
ptak
e (lb
s N
/acr
e)
Normal N Environment
0
50
100
150
200
250
300
V12 R1 R3 R6
Remobilized N = 63 lbs/acre
Reproductive N = 132 lbs/acre
Vegetative N Grain N
3
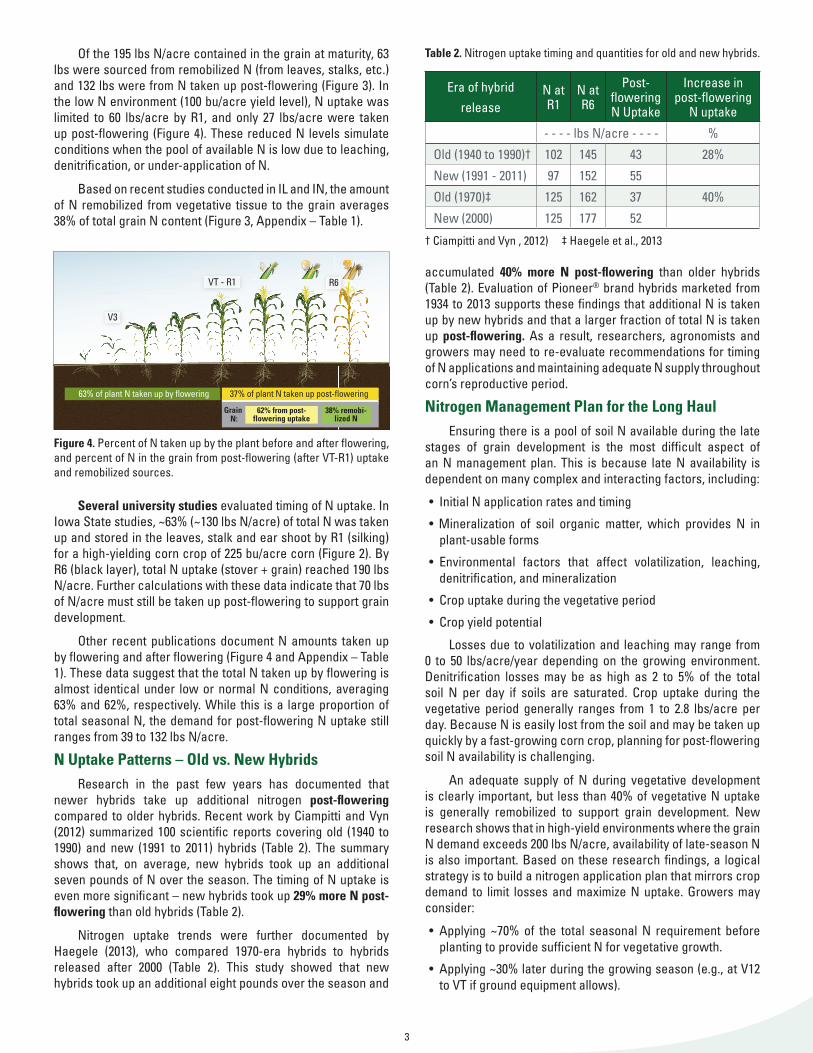
Table 2. Nitrogen uptake timing and quantities for old and new hybrids.Of the 195 lbs N/acre contained in the grain at maturity, 63 lbs were sourced from remobilized N (from leaves, stalks, etc.) and 132 lbs were from N taken up post-flowering (Figure 3). In the low N environment (100 bu/acre yield level), N uptake was limited to 60 lbs/acre by R1, and only 27 lbs/acre were taken up post-flowering (Figure 4). These reduced N levels simulate conditions when the pool of available N is low due to leaching, denitrification, or under-application of N.
Based on recent studies conducted in IL and IN, the amount of N remobilized from vegetative tissue to the grain averages 38% of total grain N content (Figure 3, Appendix – Table 1).
Figure 4. Percent of N taken up by the plant before and after flowering, and percent of N in the grain from post-flowering (after VT-R1) uptake and remobilized sources.
V3
VT - R1 R6
63% of plant N taken up by flowering
62% from post-flowering uptake
38% remobi-lized N
Grain N:
37% of plant N taken up post-flowering
Several university studies evaluated timing of N uptake. In Iowa State studies, ~63% (~130 lbs N/acre) of total N was taken up and stored in the leaves, stalk and ear shoot by R1 (silking) for a high-yielding corn crop of 225 bu/acre corn (Figure 2). By R6 (black layer), total N uptake (stover + grain) reached 190 lbs N/acre. Further calculations with these data indicate that 70 lbs of N/acre must still be taken up post-flowering to support grain development.
Other recent publications document N amounts taken up by flowering and after flowering (Figure 4 and Appendix – Table 1). These data suggest that the total N taken up by flowering is almost identical under low or normal N conditions, averaging 63% and 62%, respectively. While this is a large proportion of total seasonal N, the demand for post-flowering N uptake still ranges from 39 to 132 lbs N/acre.
N Uptake Patterns – Old vs. New HybridsResearch in the past few years has documented that
newer hybrids take up additional nitrogen post-flowering compared to older hybrids. Recent work by Ciampitti and Vyn (2012) summarized 100 scientific reports covering old (1940 to 1990) and new (1991 to 2011) hybrids (Table 2). The summary shows that, on average, new hybrids took up an additional seven pounds of N over the season. The timing of N uptake is even more significant – new hybrids took up 29% more N post-flowering than old hybrids (Table 2).
Nitrogen uptake trends were further documented by Haegele (2013), who compared 1970-era hybrids to hybrids released after 2000 (Table 2). This study showed that new hybrids took up an additional eight pounds over the season and
Era of hybrid release
N at R1
N at R6
Post-flowering N Uptake
Increase in post-flowering
N uptake
- - - - lbs N/acre - - - - %
Old (1940 to 1990)† 102 145 43 28%
New (1991 - 2011) 97 152 55
Old (1970)‡ 125 162 37 40%
New (2000) 125 177 52
† Ciampitti and Vyn , 2012) ‡ Haegele et al., 2013
accumulated 40% more N post-flowering than older hybrids (Table 2). Evaluation of Pioneer® brand hybrids marketed from 1934 to 2013 supports these findings that additional N is taken up by new hybrids and that a larger fraction of total N is taken up post-flowering. As a result, researchers, agronomists and growers may need to re-evaluate recommendations for timing of N applications and maintaining adequate N supply throughout corn’s reproductive period.
Nitrogen Management Plan for the Long HaulEnsuring there is a pool of soil N available during the late
stages of grain development is the most difficult aspect of an N management plan. This is because late N availability is dependent on many complex and interacting factors, including:
• Initial N application rates and timing
• Mineralization of soil organic matter, which provides N in plant-usable forms
• Environmental factors that affect volatilization, leaching, denitrification, and mineralization
• Crop uptake during the vegetative period
• Crop yield potential
Losses due to volatilization and leaching may range from 0 to 50 lbs/acre/year depending on the growing environment. Denitrification losses may be as high as 2 to 5% of the total soil N per day if soils are saturated. Crop uptake during the vegetative period generally ranges from 1 to 2.8 lbs/acre per day. Because N is easily lost from the soil and may be taken up quickly by a fast-growing corn crop, planning for post-flowering soil N availability is challenging.
An adequate supply of N during vegetative development is clearly important, but less than 40% of vegetative N uptake is generally remobilized to support grain development. New research shows that in high-yield environments where the grain N demand exceeds 200 lbs N/acre, availability of late-season N is also important. Based on these research findings, a logical strategy is to build a nitrogen application plan that mirrors crop demand to limit losses and maximize N uptake. Growers may consider:
• Applying ~70% of the total seasonal N requirement before planting to provide sufficient N for vegetative growth.
• Applying ~30% later during the growing season (e.g., at V12 to VT if ground equipment allows).

4 5
» This planned late application also provides the option of replacing N lost due to high rainfall conditions typical in May and June in many locations.
• Adding a nitrification inhibitor to the late application to help delay N release until closer to or after flowering.
» This option depends on soil N availability at the time of application, as well as the time of application relative to the crop development stage.
ConclusionsEvaluation of your N plan is essential to maximizing yield
and minimizing N cost. The largest unknown in the system is documentation of the soil N pool that is available for crop uptake. Environmental and cultural parameters that directly impact the soil N pool are rainfall, temperature, soil type, and N application dates and amounts. By including these parameters in environmental models, an estimate of available N can be calculated.
Comparing crop growth and development to projected yield potential can further identify whether available soil N will meet crop demand for aggressive yield targets. DuPont Pioneer released EncircaSM Yield in 2014 to help growers more effectively manage critical crop production inputs, including nitrogen. Encirca Yield gives growers access to insights that explicitly account for financial risk and tools that allow them to monitor and manage soil N in real-time at a finer spatial scale than ever before. With these tools, growers can improve both profitability and environmental quality.
Resources / CreditsTo view references and other resources, follow this link:
https://www.pioneer.com/home/site/us/agronomy/library/n-uptake-corn/#resources
Thanks to Jason DeBruin, DuPont Pioneer Research Scientist, Macomb, Illinois for authoring this article.
AppendixTable 1. Summary of plant N uptake at R1 and R6, grain N uptake at R6, N uptake post flowering, and the percent of plant N taken up post flowering along with the percent of grain N contributed by N remobilization from vegetative tissue for recent publications from studies conducted in IN and IL between 2009 and 2012.
Lead author, year of
publicationYear State N
rate YieldN in plant at R1
N in plant at R6
N in grain at R6
N uptake post
flowering1
N contribution in the grain from remobilization2
N taken up by flowering
as a %
N taken up post-flower-ing as a %
lbs / acre
bu / acre -------------lbs / acre ------------- lbs/
acre ---%--- ----%----
Haegele, 2013 2009-10 IL 0 107 44 66 47 22 25 53% 66 33
2009-10 IL 60 162 89 111 77 22 55 71% 80 20
2009-10 IL 225 213 125 177 127 52 75 59% 71 29
Bender, 2013a 2009-10 IL 240 221 155 266 124 111 13 10% 58 42
Bender, 2013b 2010 IL 240 225 165 255 148 90 58 39% 65 35
Ciampitti, 2013 2010-11 IN 0 105 82 127 79 45 34 43% 65 35
2010-11 IN 200 202 169 241 158 72 86 54% 70 30
Ciampitti, 2010 2009 IN 0 124 73 120 70 47 23 33% 61 39
2009 IN 295 166 109 190 110 81 29 26% 57 43
Ciampitti, 2010 2009 IN 0 118 71 121 63 50 13 21% 59 41
2009 IN 295 136 107 180 88 73 15 17% 59 41
DeBruin, 20113 2011 IL 230 180 137 226 164 89 75 46% 60 39
2011 IL 0 80 35 84 52 49 3 6% 41 58
DeBruin, 20123 2012 IL 200 250 168 301 195 132 62 32% 56 44
2012 IL 0 100 63 90 58 27 31 53% 70 30
Min 0 80 35 66 47 22 3 6% 41 20
Max 295 250 169 301 195 132 86 71% 80 58
Average 132 159 106 170 104 64 40 38% 63 371 N uptake post flowering = N in plant at R6 - N in plant at R1. 2 N contribution in the grain (lbs N/acre) from remobilization = N in plant at R6 - N uptake post flowering.3 Internal DuPont Pioneer studies, unpublished.

5
Herculex® Insect Protection technology by Dow AgroSciences and Pioneer Hi-Bred. Herculex® and the HX logo are registered trademarks of Dow AgroSci-ences LLC.
LL - Contains the LibertyLink® gene for resistance to Liberty® herbicide. Liberty®, LibertyLink® and the Water Droplet Design are trademarks of Bayer.
RR2 - Contains the Roundup Ready® Corn 2 gene that provides crop safety for over-the-top applications of labeled glyphosate herbi-cides when applied according to label directions.
YGCB - The YieldGard® Corn Borer gene offers a high level of re-sistance to European corn borer, southwestern corn borer and southern cornstalk borer; moderate resistance to corn earworm and common stalk borer; and above average resistance to fall ar-myworm. Contains the YieldGard® Corn Borer gene.
YieldGard®, the YieldGard Corn Borer design and Roundup Ready® are regis-tered trademarks used under license from Monsanto Company.
YGCB, HX1, LL, RR2 - Optimum® Intrasect® contains the Herculex® I gene and the YieldGard® Corn Borer gene for resistance to corn borer.
HX1 - Contains the Herculex® I Insect Protection gene which provides protection against European corn borer, southwestern corn borer, black cutworm, fall armyworm, western bean cut-worm, lesser corn stalk borer, southern corn stalk borer, and sugarcane borer; and suppresses corn earworm.
HXX - Herculex® XTRA contains the Herculex I and Herculex RW genes.
The foregoing is provided for informational use only. Please contact your Pioneer sales professional for information and suggestions specific to your operation. Product performance is variable and depends on many factors such as moisture and heat stress, soil type, management practices and environmen-tal stress as well as disease and pest pressures. Individual results may vary.
All Pioneer products are hybrids unless designated with AM1, AM, AMRW, and AMXT, in which case they are brands.
All products are trademarks of their manufacturers
Pioneer® brand products are provided subject to the terms and conditions of purchase which are part of the labeling and pur-chase documents.
®, SM, TM Trademarks and service marks of Pioneer. Pioneer ® brand products are provided subject to the terms and conditions of purchase which are part of the labeling and purchase documents. © 2014, PHII.
The DuPont Oval Logo is a registered trademark of DuPont.