Embed Size (px)
Citation preview

STUDENT NAME ________________________________________(please print)
Gra
de 5
New JerseyStudent Learning Assessment–Science(NJSLA–S) Practice Test
Grade
5
FORM
A
Copyright © 2021 by New Jersey Department of Education
All rights reserved.

Copyright © 2021 by the New Jersey Department of Education. No part of this publication may be reproduced, redistributed, or transmitted by any means without prior express written permission by the New Jersey Department of Education. All rights reserved.

This test booklet contains several different types of test questions. See the samples below, which will help you understand how to respond to each question type.
When answering questions in this test, be sure to write your answers in your answer document. Only the answers you write in your answer document will be scored.
Sample Item 1. Multiple-Choice (Select one answer.)
Sample Item 2. Multi-Select (Select multiple answers.)
Sample Items
Which claim about the Sun is accurate?
A. The Sun appears smaller and brighter than other stars because it is theclosest star to Earth.
B. The Sun appears larger and brighter than any other star because it isthe closest star to Earth.
C. The Sun appears larger and less bright than other stars because it is thefarthest star from Earth.
D. The Sun appears smaller and less bright than any other star because itis the farthest star from Earth.
Select two answers for this item. The risk of an earthquake happening is higher
A. in the South than in Alaska.
B. on the West Coast than in the Northeast.
C. on the East Coast than on the West Coast.
D. in Alaska than in the center of the country.
E. in the center of the country than on the West Coast.
1Science
3
4
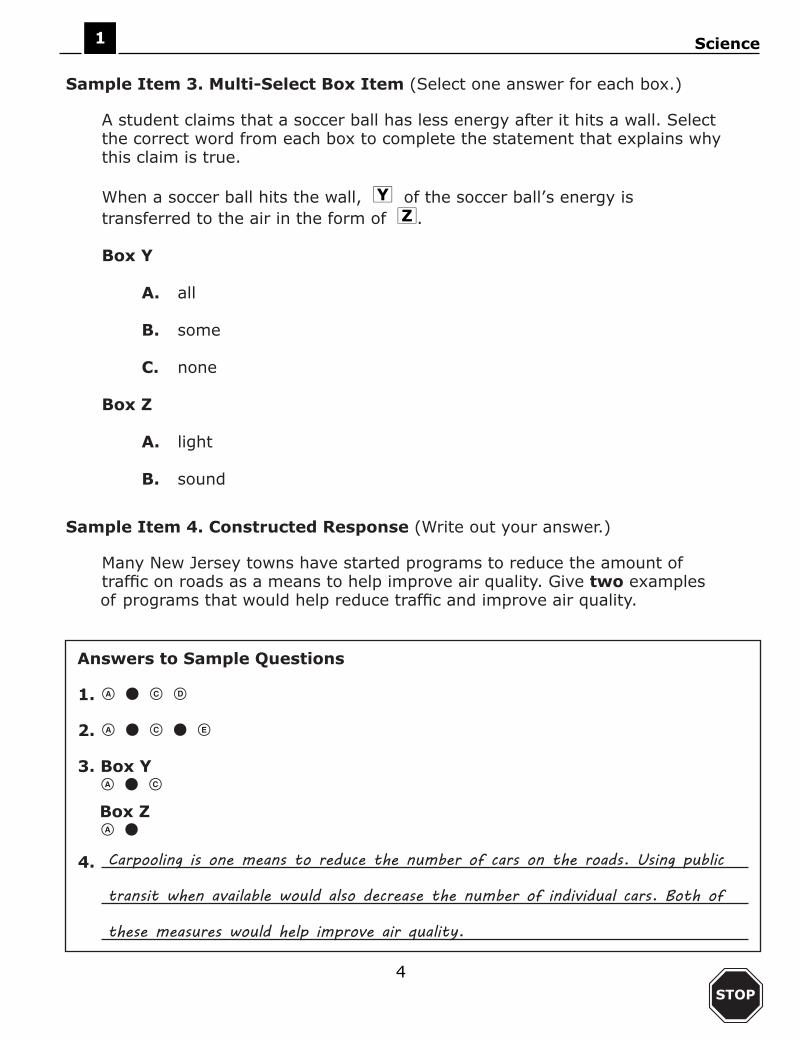
Sample Item 3. Multi-Select Box Item (Select one answer for each box.)
Sample Item 4. Constructed Response (Write out your answer.)
A student claims that a soccer ball has less energy after it hits a wall. Select the correct word from each box to complete the statement that explains why this claim is true.
When a soccer ball hits the wall, of the soccer ball’s energy is transferred to the air in the form of .
Box Y
A. all
B. some
C. none
Box Z
A. light
B. sound
Many New Jersey towns have started programs to reduce the amount of on roads as a means to help improve air quality. Give two examples
of programs that would help reduce and improve air quality.
1 Science

5
Directions:
Today you will take Unit 1 of the Grade 5 New Jersey Student Learning Assessment - Science (NJSLA-S) Test.
Follow the directions to answer each question. Mark your answers by completely in the circles in your answer document. Only answers you provide in your answer document will be scored. Do not make any pencil marks outside the circles in your answer document. If you need to change an answer, be sure to erase your answer completely.
If a question asks you to show or explain your work, you must do so to receive full credit. Write your response in the space provided in your answer document. Only responses written within the provided space will be scored.
If you do not know the answer to a question, you may go on to the next question. If you early, you may review your answers and any questions you did not answer in this unit ONLY. Do not go past the stop sign.
1Science
Unit 1 Practice Test

6
1 Science
Use the information below to answer questions 1 and 2.
An electric current can produce motion.
A simple electric motor in two steps of development is shown in Figure 1.

7
1Science
1. In the image showing the wire spinning, energy is being converted from oneform to another. In your answer folder, choose the option that correctlymatches each part of the electric motor with the role it plays in theconversion of energy.
2. Which device could be operated with a similar conversion of electrical energyto motion energy?
A.
A.
B.
B.
C.
C.
D.
D.
a radio
a remote-controlled car
a light bulb
a television set

8
1 Science
Use the information below to answer questions 3 and 4.
Figure 1 shows two identical soccer balls thrown at a wall, but one soccer ball bounces back farther away from the wall than the other.
Two students threw a soccer ball against a wall that was 15 feet away, as shown. The dot on each wall shows where the soccer ball hit it. The distance each soccer ball bounced back from the wall is shown.

9
1Science
3. Which observation provides evidence that student 1 threw the ball with moreenergy than student 2?
4. A student claims that the soccer ball has less energy after it hits the wall.Explain if this claim is true.
Complete the sentence by choosing the correct answers from the boxes.
When the soccer ball hits the wall, of the soccer ball’s energy is transferredto the air in the form of .
Box Y
A.
B.
C.
A.
D.
B.
The ball bounced back closer to student 1 than student 2.
C.
The ball bounced back closer to student 2 than student 1.
all
The ball hit the wall at a higher point for student 1 than student 2.
some
The ball hit the wall at a higher point for student 2 than student 1.
none
A.
B.
light
sound
Box Z

10
1 Science
Use the information below to answer questions 5 and 6.
A student on the way to school in January observes that some icy roads have been treated with sand and others with salt.
Snow and ice make roads dangerous and difficult to drive. Spreading sand or salt on roads helps make roads safer. Table 1 shows a comparison between salt and sand treatments.
Table 1. Using Salt or Sand on Roads
Characteristic Sand Salt
Tires skid less in the iceor snow
Yes No
Melts ice or snow No Yes
Cost Less expensive More expensive
Temperature for use Any Above 10°F
Environmental issues
• Collects in drainageditches
• Mixes withgroundwater
• Mixes withgroundwater
• Kills vegetation• Damages roads

11
1Science
5. A student claims that sand is better than salt to treat snow-covered winterroads. Which statement best supports this claim?
6. For each road condition given, indicate whether sand or salt is the bettertreatment.
Snow-covered roads with an air temperature of 0°F
A.
Icy roads with air temperature of 20°F
B.
Icy roads with air temperature of 5°C
C.
A.
D.
B.
Sand has no negative environmental effects.
Salt
Sand melts ice and is less expensive than salt.
Sand
Sand provides grip for tires and melts ice on roads.
A.
Sand provides grip for tires and is less expensive than salt.
B.
Salt
Sand
A.
B.
Salt
Sand

12
1 Science
Use the information below to answer questions 7–9.
At night, a street light appears bigger and brighter than other street lights on the same street, just like some stars in the sky.
A student lives on a street that is long and straight. While walking home at night, the student observes three street lights at different distances. Data about each light are shown in Table 1.
Table 1. Brightness and Distances of Street Lights
Street Light BrightnessDistance from the
Student (km)
X Medium 1
Y Low 2
Z Very low 3

13
1Science
In Table 2, data about three stars are shown.
Table 2. Brightness and Distances of Three Stars
Star Brightness Distance from Earth
The Sun Very high Far
Arcturus Very low Farther
Polaris Very, very low Farthest

14
1 Science
7. Which statement describes how the brightness of light relates to distance?
8. Describe how the brightness of a star appears to change because of distance.
Complete the sentences by choosing the correct answers from the boxes.
Based on Tables 1 and 2, street light has the same brightness as Arcturus.If the student moves away from Arcturus, the brightness of this star wouldappear to .
Box Y
A.
B.
C.
A.
D.
B.
The less bright the street light appears, the closer the student is to it.
C.
The brighter the street light appears, the closer the student is to it.
X
The less bright the star appears, the closer it is to Earth.
The brighter the star appears, the farther it is from Earth.
A.
B.
C.
Y
Z
increase
decrease
stay the same
Box Z

15
1Science
9. Which claim is accurate?
A.
B.
C.
D.
The Sun appears smaller and brighter than other stars because it is theclosest star to Earth.
The Sun appears larger and brighter than any other star because it is theclosest star to Earth.
The Sun appears larger and less bright than other stars because it is thefarthest star from Earth.
The Sun appears smaller and less bright than any other star because it isthe farthest star from Earth.

16
1 Science
Use the information below to answer questions 10–12.
Earthquakes can strike anywhere on Earth, but they occur more frequently in certain areas.
Figure 1 highlights areas in the United States from lowest to highest risk of experiencing an earthquake.

17
1Science
10. Which is a valid statement, based on the map?
The highest risk of an earthquake happening is
11. Based on the map, choose the option that shows the locations in correctorder from highest (top) to lowest (bottom) risk of an earthquakehappening.
A.
A.
B.
B.
C.
C.
D.
D.
on the West Coast.
Northern AlaskaNorthern Central United StatesNorthern New JerseySouthern New JerseySouthern portion of the West Coast
on the East Coast.
Southern portion of the West CoastNorthern AlaskaNorthern New JerseySouthern New JerseyNorthern Central United States
in the Northeast.
Northern New JerseySouthern New JerseyNorthern AlaskaSouthern portion of the West CoastNorthern Central United States
in the South.
Northern Central United StatesSouthern New JerseyNorthern New JerseyNorthern AlaskaSouthern portion of the West Coast

18
1 Science
12. Locations where earthquakes occur are found around the world, but whenviewed on a map, they are observed to follow a pattern.
The map shows five locations numbered 1 to 5. Identify the two locationswhere major earthquakes would most likely occur in the future.
Select the two correct locations from the five options.
A.
B.
C.
D.
E.
Location 1
Location 2
Location 3
Location 4
Location 5

19
1Science
GO ON TO NEXT PAGE

20
1 Science
Use the information below to answer questions 13–17.
Once a welcome part of the ecosystem in many New Jersey woodlands, the white-tailed deer are now unwelcome residents.
Overpopulation of deer has been an issue in New Jersey for many years.
Table 1 shows the population of white-tailed deer in New Jersey from 1850–2015.
Table 1. White-tailed Deer Population
Year Deer Population
1850 75,000
1900 50,000
1950 85,000
1960 90,000
1970 95,000
1980 110,000
1990 190,000
2000 155,000
2010 115,000
2015 100,000

21
1Science
GO ON TO NEXT PAGE

22
1 Science
13. This item has two parts. First, answer Part A. Then answer Part B.
Part A
Researchers count deer at the same time and same locations each year. Usingthe data in Table 1, choose the bar graph showing the number of deerrecorded for each given year.
A.
B.

23
1Science
C.
D.
(Item 13 continued)

24
1 Science
A.
B.
14. Which questions should scientists study in order to best understand thechanging deer populations throughout the last 25 years?
Select the two of the five questions.
C.
A.
decreased
B.
increased
C.
stayed the same
D.
A.
E.
B.
When are deer more active?
decreasing
Has the average size of a deer changed?
increasing
How much deer habitat has been lost to housing development?
Part B
Select from the boxes to describe the pattern shown in the deer populationdata.
The deer population until 1990 and then the population started .
Box Y
Has the number of the deer’s natural predators changed?
Why does the color of the deer’s coat change from summer to winter?
Box Z
(Item 13 continued)

25
1Science
15. Town planners in New Jersey have created possible solutions to reduce thedeer population. Based on the data in Table 1, in what year did theseprograms first start showing results?
A.
B.
C.
D.
E.
1980
1990
2000
2010
2015

26
1 Science
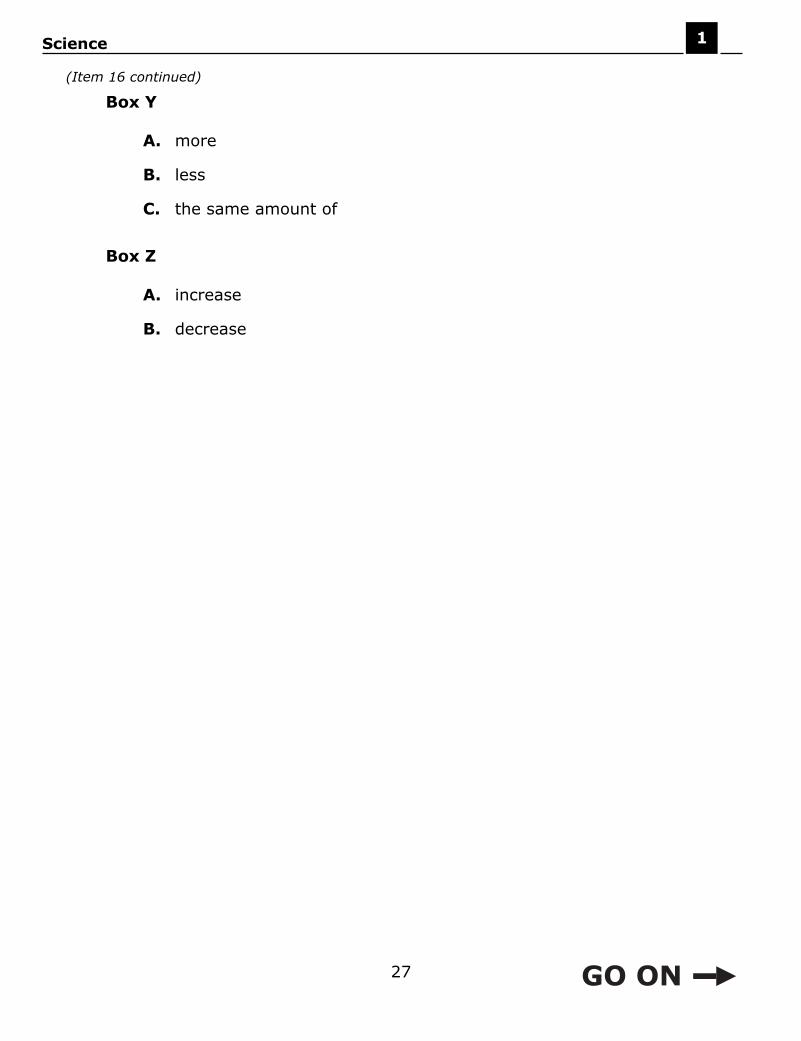
16. The development of land has caused the deer populations in some parts ofNew Jersey to more than triple over the past years. Deer density is how manydeer are counted in a specific area. Table 2 shows the deer density and landdevelopment levels for a location in Mercer County, NJ.
Based on Table 2, predict how deer populations and land development affectpeople and their environment.
Complete the sentences by choosing the correct answers from the boxes.
Deer density as land development increases. This is a result of deer inthe specific area, which causes a(n) in problems for people and theirenvironment.
Box X
Table 2. Deer Density and Land Development
Year
Land Development (change from open
land tohouses andbusinesses)
Deer Density (number of deer
per acre)
1940 Low 31
1970 Medium 56
1980 Medium 72
1990 Very High 101
2000 High 112
2010 High 114
A.
B.
C.
increases
decreases
stays the same
27
1Science
A.
B.
increase
decrease
A.
B.
C.
more
less
the same amount of
Box Y
Box Z
(Item 16 continued)

28
1 Science
17. Many New Jersey towns have started programs to decrease the deerpopulation and reduce the negative effects that deer are having on peopleand the environment.
Some of the solutions to decrease deer populations are shown in Table 3.
Choose two solutions for reducing deer populations and explain why each ofthese solutions would be more effective than the solutions not chosen.
Enter your response in your answer document. Support your answerwith evidence from the data in Table 3.
Explain why each of the other two solutions would be less effective.
Enter your response in your answer document. Support your answerwith evidence from the data in Table 3.
Table 3. Solutions to Deer Overpopulation
Solution Description
Increased hunting • Change hunting laws to allow moredeer to be hunted in a season
Move deer out of area • Trap and move deer to places thatcan support a large population
Block and barricade• Build barriers and fences to keep
deer away from roads, farms, andbackyards
Sprays • Use chemicals to keep deer awayfrom roads, farms, and backyards

1Science
29
STOP
You have reached the end of Unit 1 of the test.
• Review your answers from Unit 1.