Embed Size (px)
Citation preview
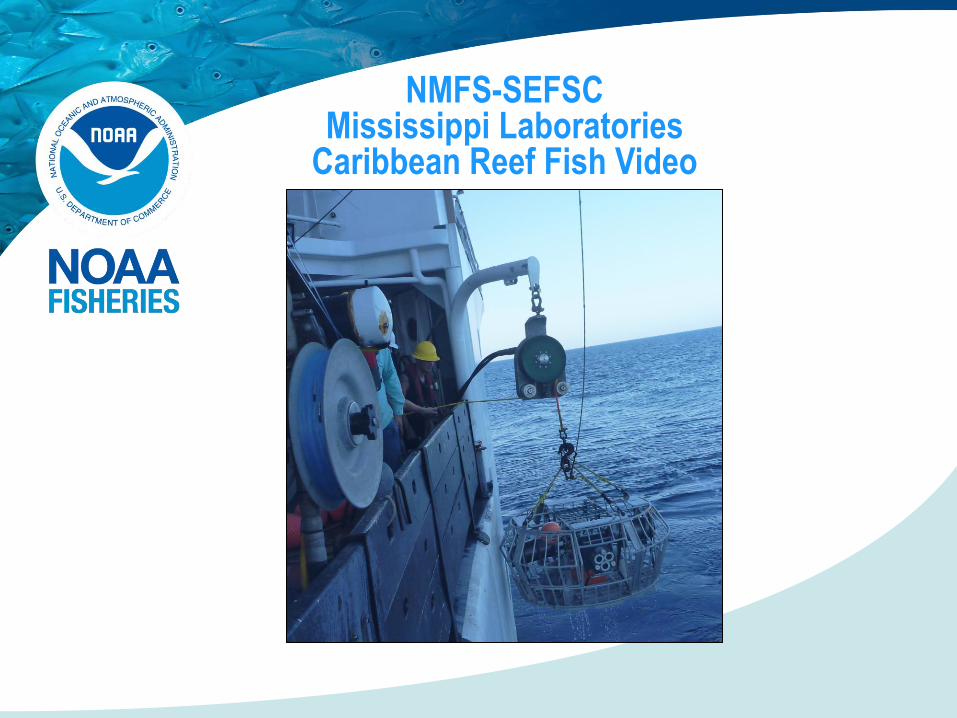
NMFS-SEFSC Mississippi Laboratories
Caribbean Reef Fish Video
U.S. Department of Commerce | National Oceanic and Atmospheric Administration | NOAA Fisheries | Page 2
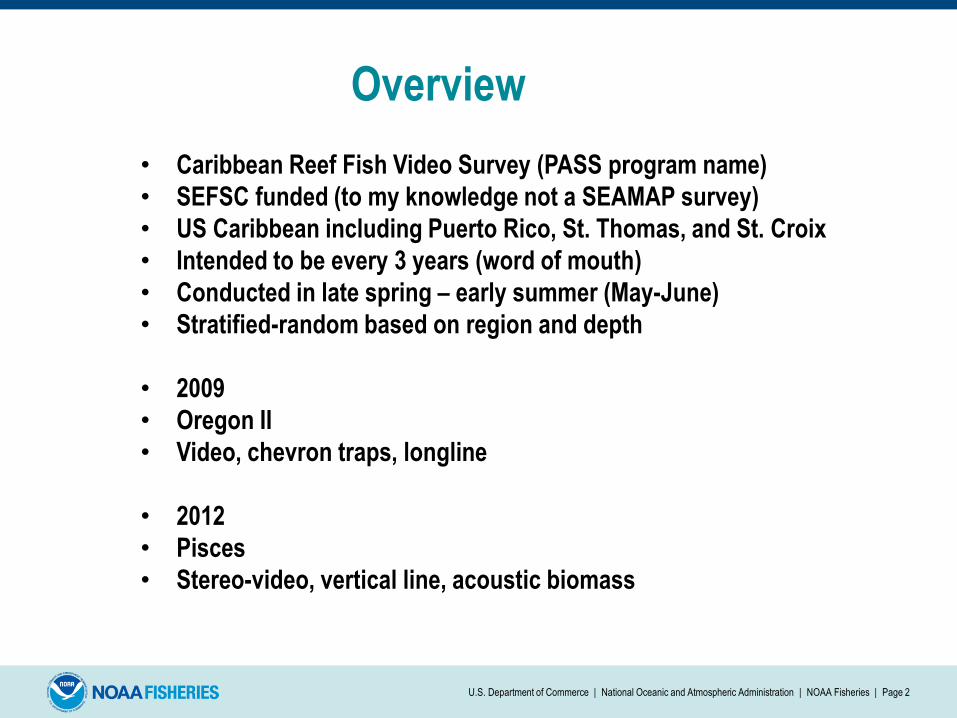
Overview
• Caribbean Reef Fish Video Survey (PASS program name)
• SEFSC funded (to my knowledge not a SEAMAP survey)
• US Caribbean including Puerto Rico, St. Thomas, and St. Croix
• Intended to be every 3 years (word of mouth)
• Conducted in late spring – early summer (May-June)
• Stratified-random based on region and depth
• 2009
• Oregon II
• Video, chevron traps, longline
• 2012
• Pisces
• Stereo-video, vertical line, acoustic biomass
U.S. Department of Commerce | National Oceanic and Atmospheric Administration | NOAA Fisheries | Page 3
Objectives
Primary:
Designed to provide fishery-independent abundance indices of reef fish
stocks in U.S. Caribbean waters using cameras, traps and vertical line catch
gear (bandit reels). Additionally collect length, age, weight, reproductive
data.
Secondary:
Collect bathymetry data
Provide map of relief and classify habitat
Research designs based on habitat stratification
Acoustic biomass data to couple with EBM or EWE models
Similar to the SEAMAP Reef Fish Video Survey in the GOM
U.S. Department of Commerce | National Oceanic and Atmospheric Administration | NOAA Fisheries | Page 4
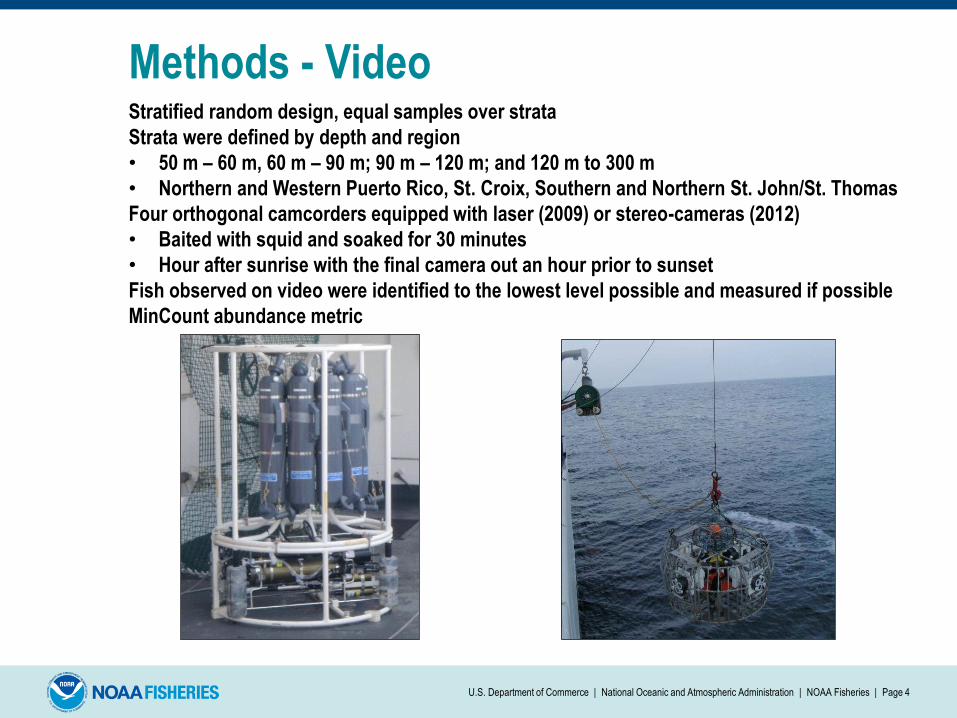
Methods - Video Stratified random design, equal samples over strata
Strata were defined by depth and region
• 50 m – 60 m, 60 m – 90 m; 90 m – 120 m; and 120 m to 300 m
• Northern and Western Puerto Rico, St. Croix, Southern and Northern St. John/St. Thomas
Four orthogonal camcorders equipped with laser (2009) or stereo-cameras (2012)
• Baited with squid and soaked for 30 minutes
• Hour after sunrise with the final camera out an hour prior to sunset
Fish observed on video were identified to the lowest level possible and measured if possible
MinCount abundance metric
U.S. Department of Commerce | National Oceanic and Atmospheric Administration | NOAA Fisheries | Page 5
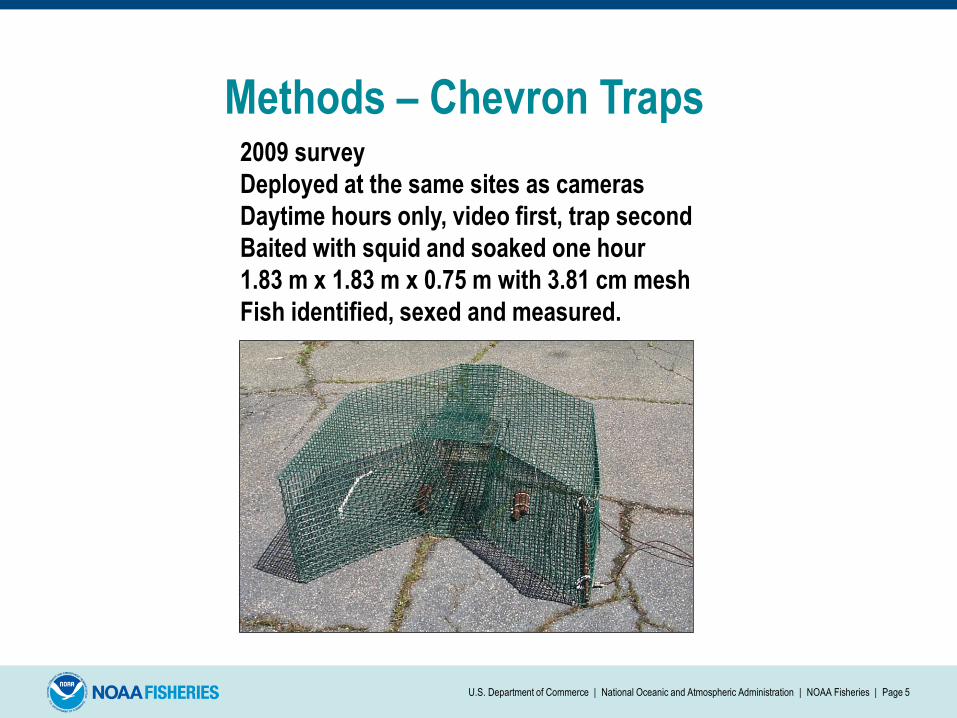
Methods – Chevron Traps 2009 survey
Deployed at the same sites as cameras
Daytime hours only, video first, trap second
Baited with squid and soaked one hour
1.83 m x 1.83 m x 0.75 m with 3.81 cm mesh
Fish identified, sexed and measured.
U.S. Department of Commerce | National Oceanic and Atmospheric Administration | NOAA Fisheries | Page 6
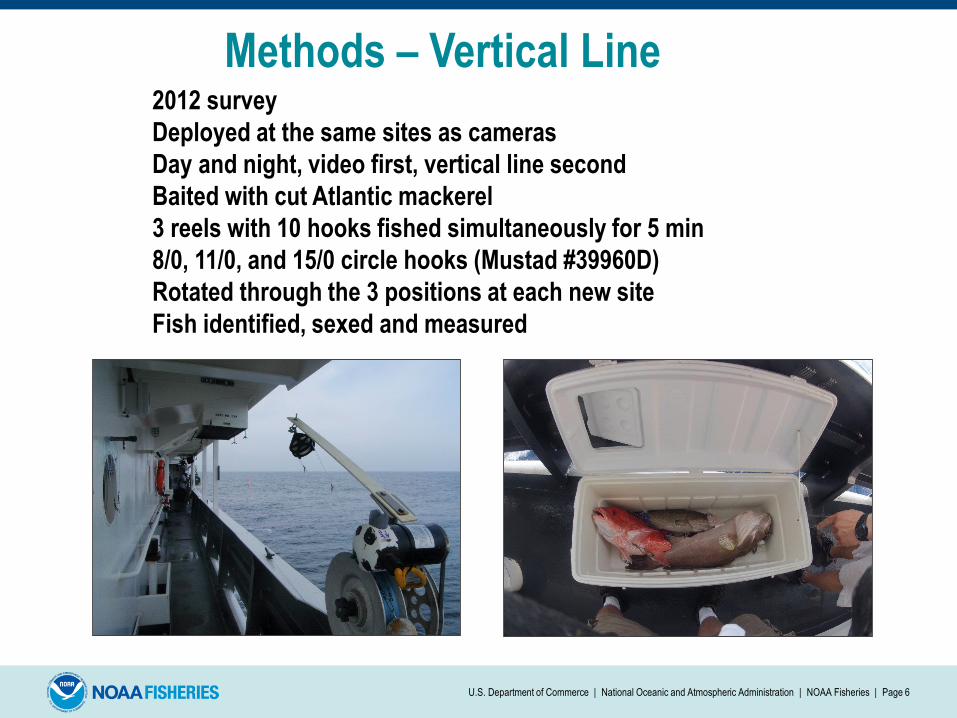
Methods – Vertical Line 2012 survey
Deployed at the same sites as cameras
Day and night, video first, vertical line second
Baited with cut Atlantic mackerel
3 reels with 10 hooks fished simultaneously for 5 min
8/0, 11/0, and 15/0 circle hooks (Mustad #39960D)
Rotated through the 3 positions at each new site
Fish identified, sexed and measured
U.S. Department of Commerce | National Oceanic and Atmospheric Administration | NOAA Fisheries | Page 7
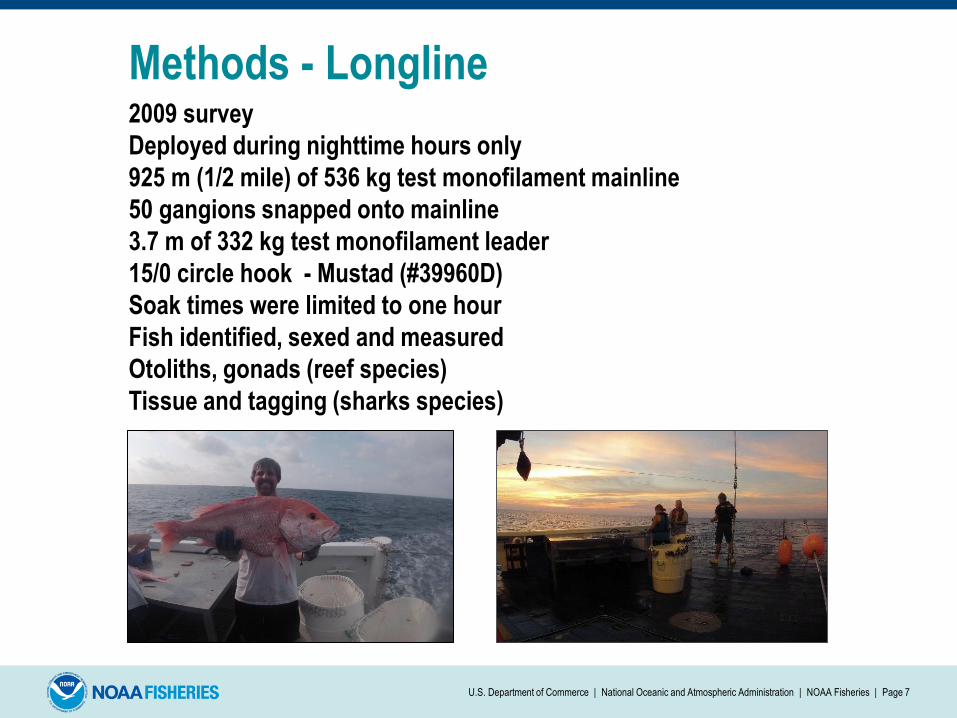
Methods - Longline 2009 survey
Deployed during nighttime hours only
925 m (1/2 mile) of 536 kg test monofilament mainline
50 gangions snapped onto mainline
3.7 m of 332 kg test monofilament leader
15/0 circle hook - Mustad (#39960D)
Soak times were limited to one hour
Fish identified, sexed and measured
Otoliths, gonads (reef species)
Tissue and tagging (sharks species)
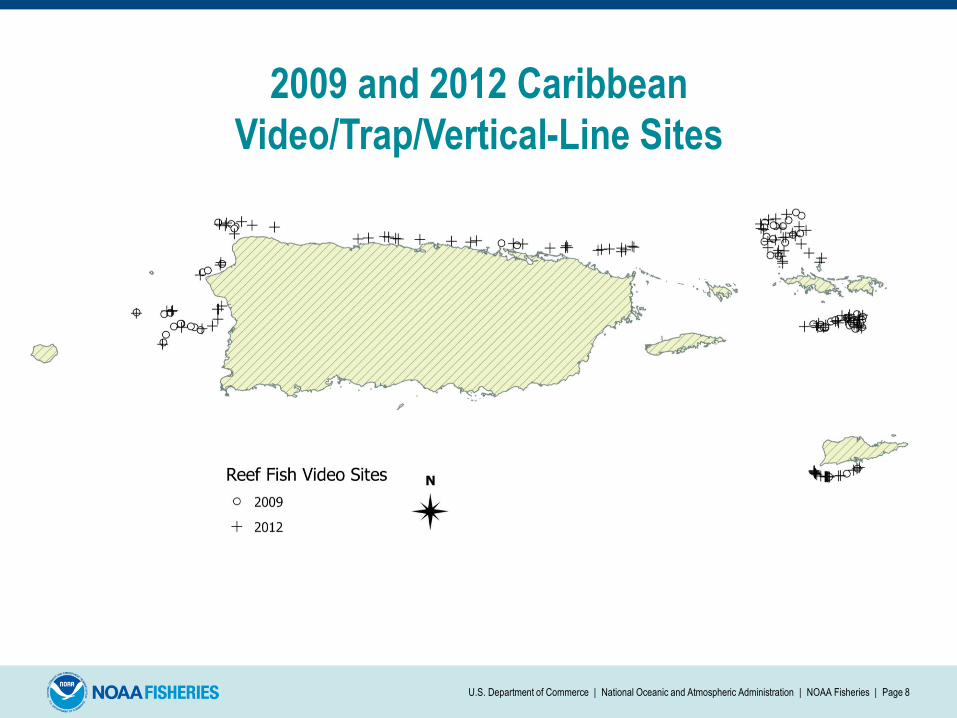
2009 and 2012 Caribbean
Video/Trap/Vertical-Line Sites
U.S. Department of Commerce | National Oceanic and Atmospheric Administration | NOAA Fisheries | Page 8
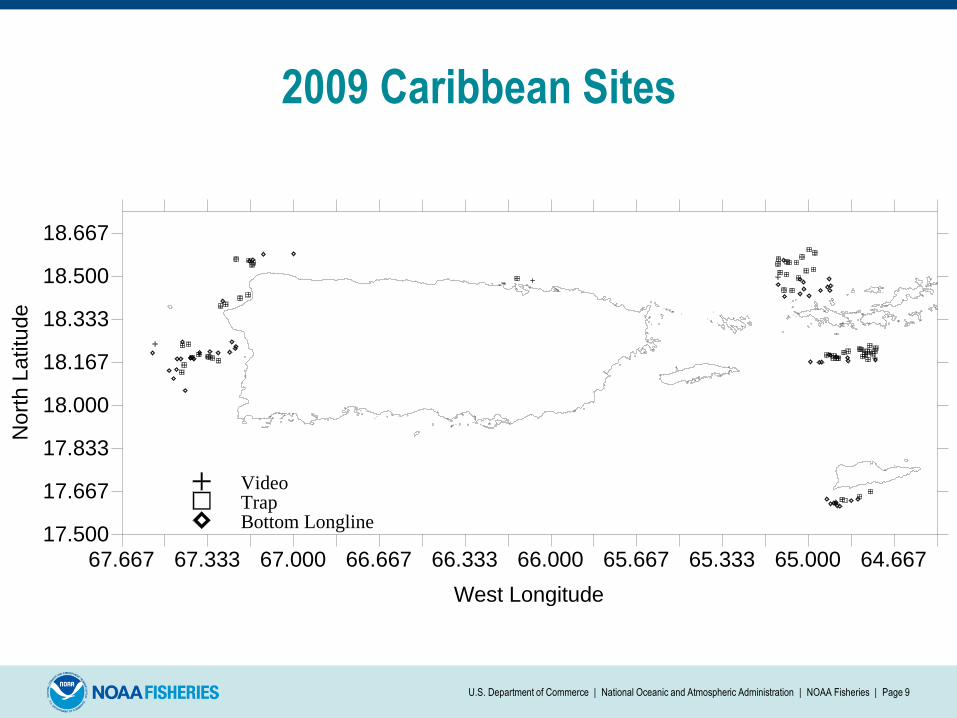
2009 Caribbean Sites
U.S. Department of Commerce | National Oceanic and Atmospheric Administration | NOAA Fisheries | Page 9
67.667 67.333 67.000 66.667 66.333 66.000 65.667 65.333 65.000 64.667
West Longitude
17.500
17.667
17.833
18.000
18.167
18.333
18.500
18.667
No
rth
La
titu
de
VideoTrapBottom Longline
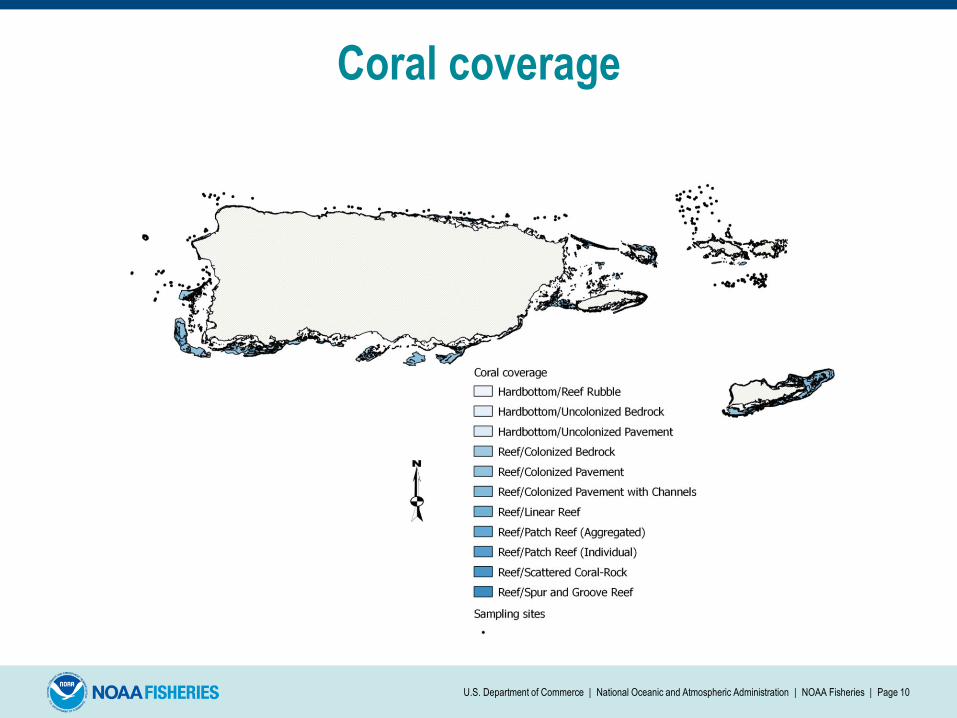
Coral coverage
U.S. Department of Commerce | National Oceanic and Atmospheric Administration | NOAA Fisheries | Page 10
U.S. Department of Commerce | National Oceanic and Atmospheric Administration | NOAA Fisheries | Page 11
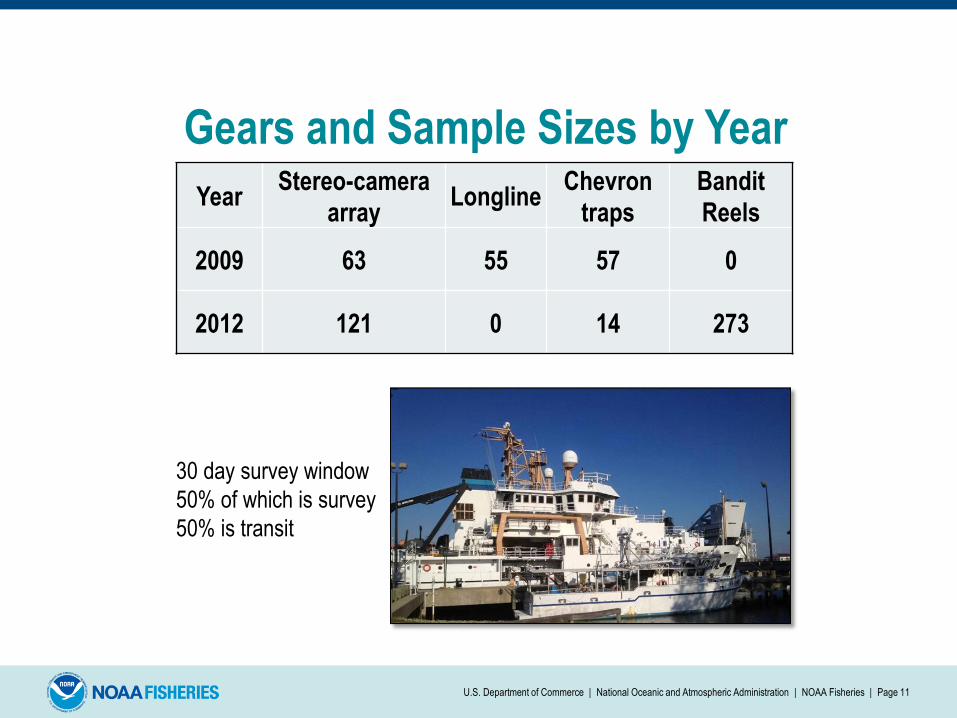
Year Stereo-camera
array Longline
Chevron
traps Bandit
Reels
2009 63 55 57 0
2012 121 0 14 273
Gears and Sample Sizes by Year
30 day survey window
50% of which is survey
50% is transit
U.S. Department of Commerce | National Oceanic and Atmospheric Administration | NOAA Fisheries | Page 12
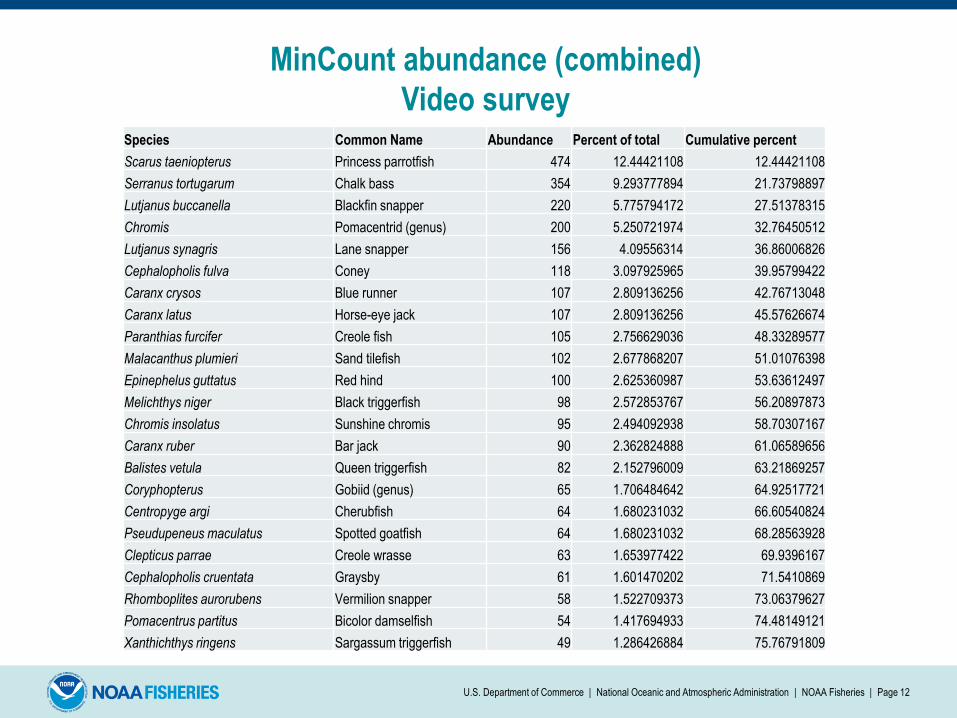
MinCount abundance (combined)
Video survey Species Common Name Abundance Percent of total Cumulative percent
Scarus taeniopterus Princess parrotfish 474 12.44421108 12.44421108
Serranus tortugarum Chalk bass 354 9.293777894 21.73798897
Lutjanus buccanella Blackfin snapper 220 5.775794172 27.51378315
Chromis Pomacentrid (genus) 200 5.250721974 32.76450512
Lutjanus synagris Lane snapper 156 4.09556314 36.86006826
Cephalopholis fulva Coney 118 3.097925965 39.95799422
Caranx crysos Blue runner 107 2.809136256 42.76713048
Caranx latus Horse-eye jack 107 2.809136256 45.57626674
Paranthias furcifer Creole fish 105 2.756629036 48.33289577
Malacanthus plumieri Sand tilefish 102 2.677868207 51.01076398
Epinephelus guttatus Red hind 100 2.625360987 53.63612497
Melichthys niger Black triggerfish 98 2.572853767 56.20897873
Chromis insolatus Sunshine chromis 95 2.494092938 58.70307167
Caranx ruber Bar jack 90 2.362824888 61.06589656
Balistes vetula Queen triggerfish 82 2.152796009 63.21869257
Coryphopterus Gobiid (genus) 65 1.706484642 64.92517721
Centropyge argi Cherubfish 64 1.680231032 66.60540824
Pseudupeneus maculatus Spotted goatfish 64 1.680231032 68.28563928
Clepticus parrae Creole wrasse 63 1.653977422 69.9396167
Cephalopholis cruentata Graysby 61 1.601470202 71.5410869
Rhomboplites aurorubens Vermilion snapper 58 1.522709373 73.06379627
Pomacentrus partitus Bicolor damselfish 54 1.417694933 74.48149121
Xanthichthys ringens Sargassum triggerfish 49 1.286426884 75.76791809
U.S. Department of Commerce | National Oceanic and Atmospheric Administration | NOAA Fisheries | Page 13
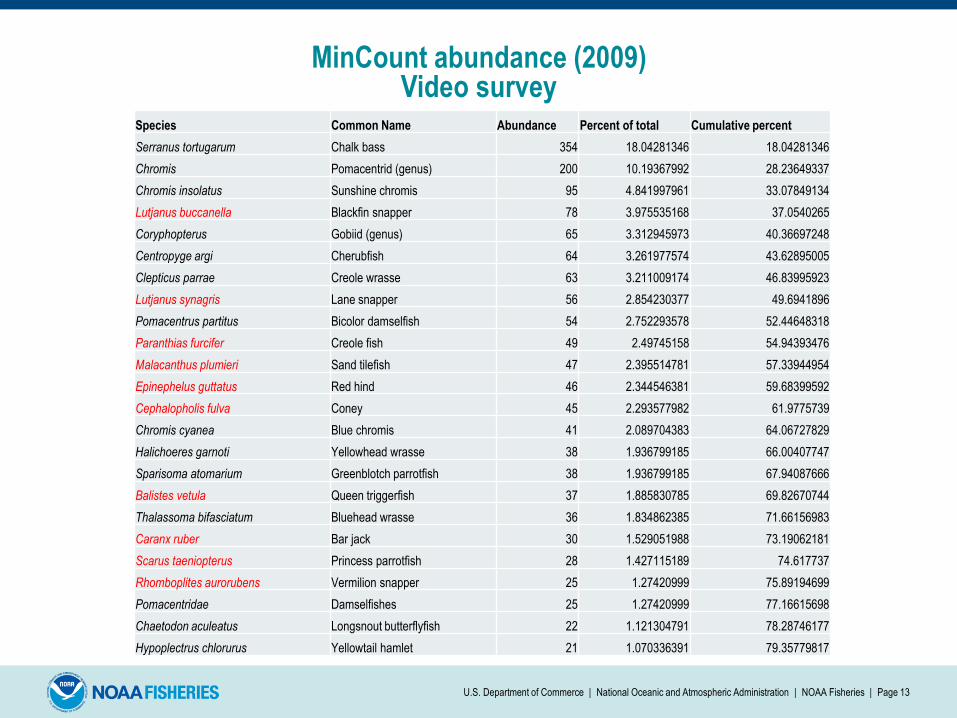
Species Common Name Abundance Percent of total Cumulative percent
Serranus tortugarum Chalk bass 354 18.04281346 18.04281346
Chromis Pomacentrid (genus) 200 10.19367992 28.23649337
Chromis insolatus Sunshine chromis 95 4.841997961 33.07849134
Lutjanus buccanella Blackfin snapper 78 3.975535168 37.0540265
Coryphopterus Gobiid (genus) 65 3.312945973 40.36697248
Centropyge argi Cherubfish 64 3.261977574 43.62895005
Clepticus parrae Creole wrasse 63 3.211009174 46.83995923
Lutjanus synagris Lane snapper 56 2.854230377 49.6941896
Pomacentrus partitus Bicolor damselfish 54 2.752293578 52.44648318
Paranthias furcifer Creole fish 49 2.49745158 54.94393476
Malacanthus plumieri Sand tilefish 47 2.395514781 57.33944954
Epinephelus guttatus Red hind 46 2.344546381 59.68399592
Cephalopholis fulva Coney 45 2.293577982 61.9775739
Chromis cyanea Blue chromis 41 2.089704383 64.06727829
Halichoeres garnoti Yellowhead wrasse 38 1.936799185 66.00407747
Sparisoma atomarium Greenblotch parrotfish 38 1.936799185 67.94087666
Balistes vetula Queen triggerfish 37 1.885830785 69.82670744
Thalassoma bifasciatum Bluehead wrasse 36 1.834862385 71.66156983
Caranx ruber Bar jack 30 1.529051988 73.19062181
Scarus taeniopterus Princess parrotfish 28 1.427115189 74.617737
Rhomboplites aurorubens Vermilion snapper 25 1.27420999 75.89194699
Pomacentridae Damselfishes 25 1.27420999 77.16615698
Chaetodon aculeatus Longsnout butterflyfish 22 1.121304791 78.28746177
Hypoplectrus chlorurus Yellowtail hamlet 21 1.070336391 79.35779817
MinCount abundance (2009) Video survey
U.S. Department of Commerce | National Oceanic and Atmospheric Administration | NOAA Fisheries | Page 14
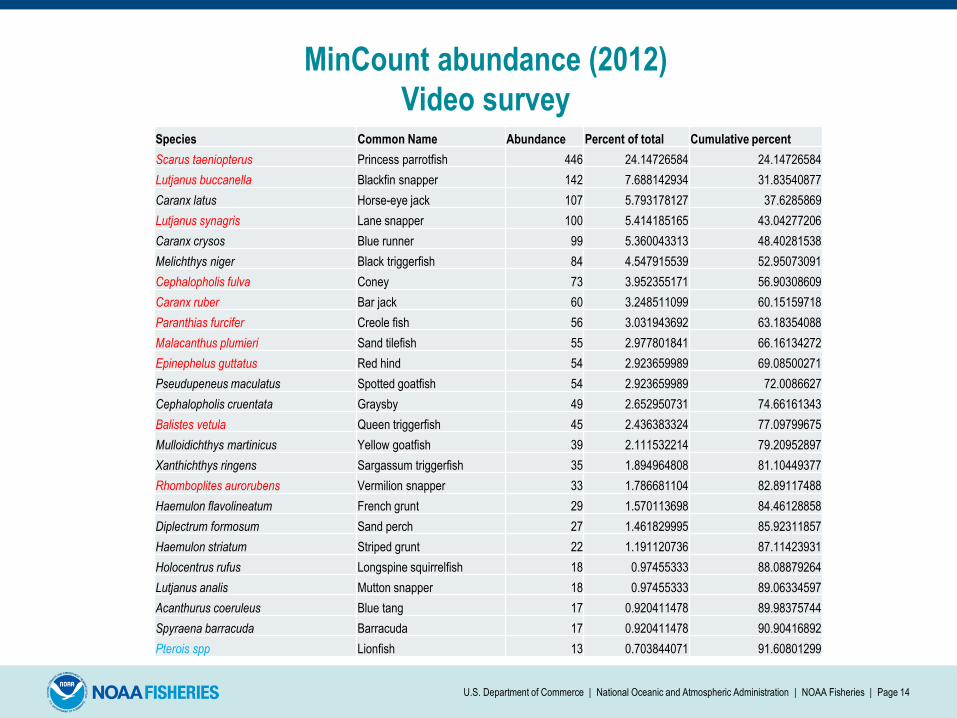
Species Common Name Abundance Percent of total Cumulative percent
Scarus taeniopterus Princess parrotfish 446 24.14726584 24.14726584
Lutjanus buccanella Blackfin snapper 142 7.688142934 31.83540877
Caranx latus Horse-eye jack 107 5.793178127 37.6285869
Lutjanus synagris Lane snapper 100 5.414185165 43.04277206
Caranx crysos Blue runner 99 5.360043313 48.40281538
Melichthys niger Black triggerfish 84 4.547915539 52.95073091
Cephalopholis fulva Coney 73 3.952355171 56.90308609
Caranx ruber Bar jack 60 3.248511099 60.15159718
Paranthias furcifer Creole fish 56 3.031943692 63.18354088
Malacanthus plumieri Sand tilefish 55 2.977801841 66.16134272
Epinephelus guttatus Red hind 54 2.923659989 69.08500271
Pseudupeneus maculatus Spotted goatfish 54 2.923659989 72.0086627
Cephalopholis cruentata Graysby 49 2.652950731 74.66161343
Balistes vetula Queen triggerfish 45 2.436383324 77.09799675
Mulloidichthys martinicus Yellow goatfish 39 2.111532214 79.20952897
Xanthichthys ringens Sargassum triggerfish 35 1.894964808 81.10449377
Rhomboplites aurorubens Vermilion snapper 33 1.786681104 82.89117488
Haemulon flavolineatum French grunt 29 1.570113698 84.46128858
Diplectrum formosum Sand perch 27 1.461829995 85.92311857
Haemulon striatum Striped grunt 22 1.191120736 87.11423931
Holocentrus rufus Longspine squirrelfish 18 0.97455333 88.08879264
Lutjanus analis Mutton snapper 18 0.97455333 89.06334597
Acanthurus coeruleus Blue tang 17 0.920411478 89.98375744
Spyraena barracuda Barracuda 17 0.920411478 90.90416892
Pterois spp Lionfish 13 0.703844071 91.60801299
MinCount abundance (2012)
Video survey
U.S. Department of Commerce | National Oceanic and Atmospheric Administration | NOAA Fisheries | Page 15
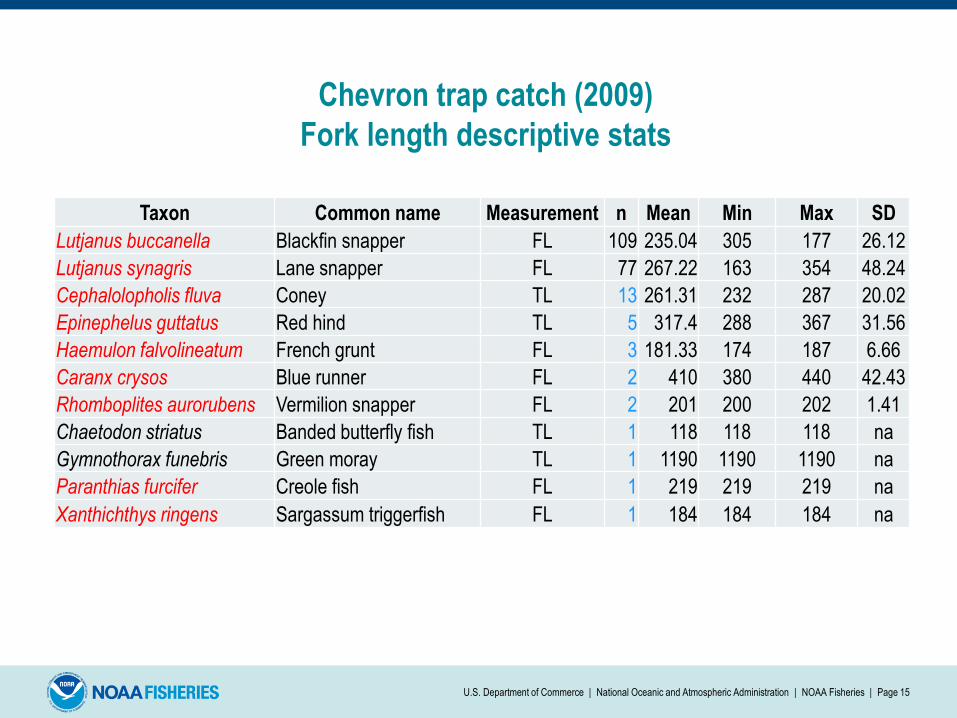
Chevron trap catch (2009)
Fork length descriptive stats
Taxon Common name Measurement n Mean Min Max SD
Lutjanus buccanella Blackfin snapper FL 109 235.04 305 177 26.12
Lutjanus synagris Lane snapper FL 77 267.22 163 354 48.24
Cephalolopholis fluva Coney TL 13 261.31 232 287 20.02
Epinephelus guttatus Red hind TL 5 317.4 288 367 31.56
Haemulon falvolineatum French grunt FL 3 181.33 174 187 6.66
Caranx crysos Blue runner FL 2 410 380 440 42.43
Rhomboplites aurorubens Vermilion snapper FL 2 201 200 202 1.41
Chaetodon striatus Banded butterfly fish TL 1 118 118 118 na
Gymnothorax funebris Green moray TL 1 1190 1190 1190 na
Paranthias furcifer Creole fish FL 1 219 219 219 na
Xanthichthys ringens Sargassum triggerfish FL 1 184 184 184 na
U.S. Department of Commerce | National Oceanic and Atmospheric Administration | NOAA Fisheries | Page 16
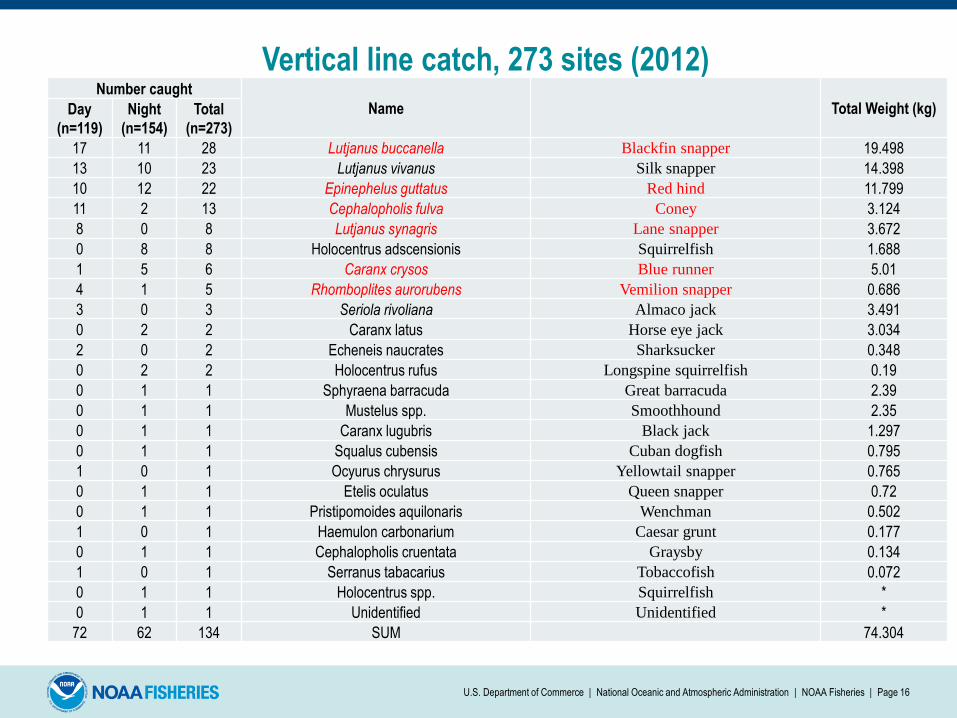
Vertical line catch, 273 sites (2012)
Number caught
Name Total Weight (kg) Day
(n=119) Night
(n=154) Total
(n=273)
17 11 28 Lutjanus buccanella Blackfin snapper 19.498
13 10 23 Lutjanus vivanus Silk snapper 14.398
10 12 22 Epinephelus guttatus Red hind 11.799
11 2 13 Cephalopholis fulva Coney 3.124
8 0 8 Lutjanus synagris Lane snapper 3.672
0 8 8 Holocentrus adscensionis Squirrelfish 1.688
1 5 6 Caranx crysos Blue runner 5.01
4 1 5 Rhomboplites aurorubens Vemilion snapper 0.686
3 0 3 Seriola rivoliana Almaco jack 3.491
0 2 2 Caranx latus Horse eye jack 3.034
2 0 2 Echeneis naucrates Sharksucker 0.348
0 2 2 Holocentrus rufus Longspine squirrelfish 0.19
0 1 1 Sphyraena barracuda Great barracuda 2.39
0 1 1 Mustelus spp. Smoothhound 2.35
0 1 1 Caranx lugubris Black jack 1.297
0 1 1 Squalus cubensis Cuban dogfish 0.795
1 0 1 Ocyurus chrysurus Yellowtail snapper 0.765
0 1 1 Etelis oculatus Queen snapper 0.72
0 1 1 Pristipomoides aquilonaris Wenchman 0.502
1 0 1 Haemulon carbonarium Caesar grunt 0.177
0 1 1 Cephalopholis cruentata Graysby 0.134
1 0 1 Serranus tabacarius Tobaccofish 0.072
0 1 1 Holocentrus spp. Squirrelfish *
0 1 1 Unidentified Unidentified *
72 62 134 SUM 74.304
U.S. Department of Commerce | National Oceanic and Atmospheric Administration | NOAA Fisheries | Page 17
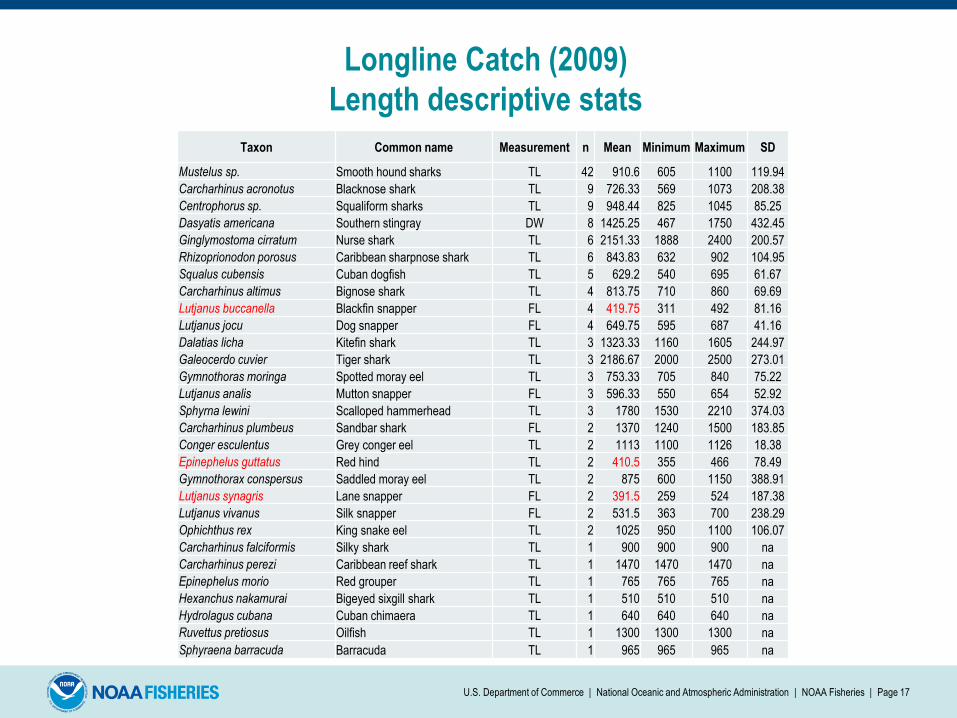
Longline Catch (2009)
Length descriptive stats
Taxon Common name Measurement n Mean Minimum Maximum SD
Mustelus sp. Smooth hound sharks TL 42 910.6 605 1100 119.94
Carcharhinus acronotus Blacknose shark TL 9 726.33 569 1073 208.38
Centrophorus sp. Squaliform sharks TL 9 948.44 825 1045 85.25
Dasyatis americana Southern stingray DW 8 1425.25 467 1750 432.45
Ginglymostoma cirratum Nurse shark TL 6 2151.33 1888 2400 200.57
Rhizoprionodon porosus Caribbean sharpnose shark TL 6 843.83 632 902 104.95
Squalus cubensis Cuban dogfish TL 5 629.2 540 695 61.67
Carcharhinus altimus Bignose shark TL 4 813.75 710 860 69.69
Lutjanus buccanella Blackfin snapper FL 4 419.75 311 492 81.16
Lutjanus jocu Dog snapper FL 4 649.75 595 687 41.16
Dalatias licha Kitefin shark TL 3 1323.33 1160 1605 244.97
Galeocerdo cuvier Tiger shark TL 3 2186.67 2000 2500 273.01
Gymnothoras moringa Spotted moray eel TL 3 753.33 705 840 75.22
Lutjanus analis Mutton snapper FL 3 596.33 550 654 52.92
Sphyrna lewini Scalloped hammerhead TL 3 1780 1530 2210 374.03
Carcharhinus plumbeus Sandbar shark FL 2 1370 1240 1500 183.85
Conger esculentus Grey conger eel TL 2 1113 1100 1126 18.38
Epinephelus guttatus Red hind TL 2 410.5 355 466 78.49
Gymnothorax conspersus Saddled moray eel TL 2 875 600 1150 388.91
Lutjanus synagris Lane snapper FL 2 391.5 259 524 187.38
Lutjanus vivanus Silk snapper FL 2 531.5 363 700 238.29
Ophichthus rex King snake eel TL 2 1025 950 1100 106.07
Carcharhinus falciformis Silky shark TL 1 900 900 900 na
Carcharhinus perezi Caribbean reef shark TL 1 1470 1470 1470 na
Epinephelus morio Red grouper TL 1 765 765 765 na
Hexanchus nakamurai Bigeyed sixgill shark TL 1 510 510 510 na
Hydrolagus cubana Cuban chimaera TL 1 640 640 640 na
Ruvettus pretiosus Oilfish TL 1 1300 1300 1300 na
Sphyraena barracuda Barracuda TL 1 965 965 965 na
U.S. Department of Commerce | National Oceanic and Atmospheric Administration | NOAA Fisheries | Page 18
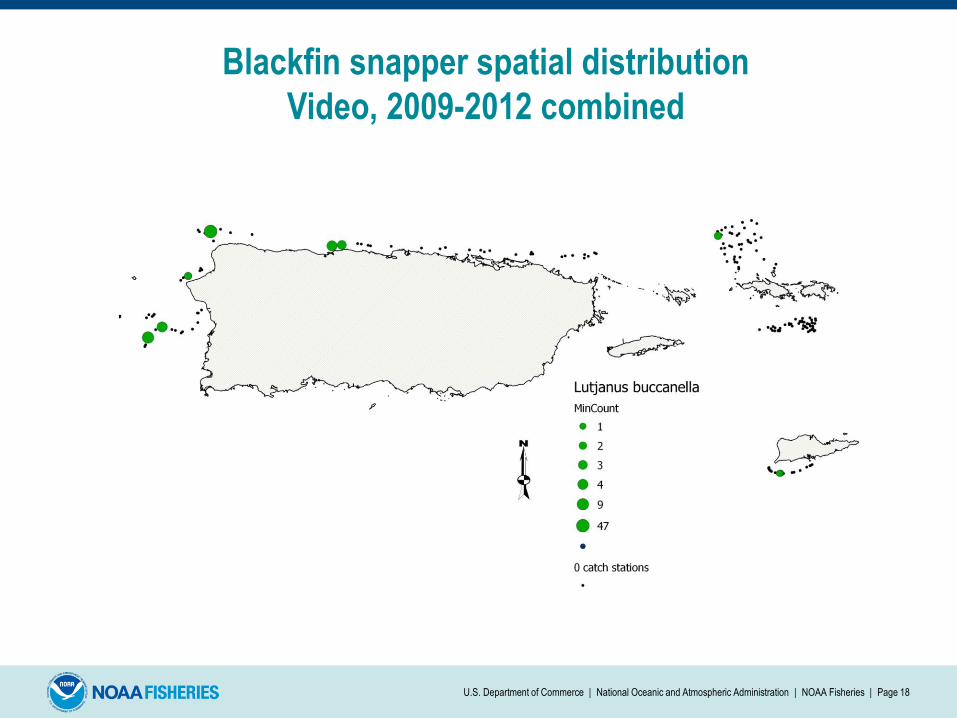
Blackfin snapper spatial distribution
Video, 2009-2012 combined
U.S. Department of Commerce | National Oceanic and Atmospheric Administration | NOAA Fisheries | Page 19
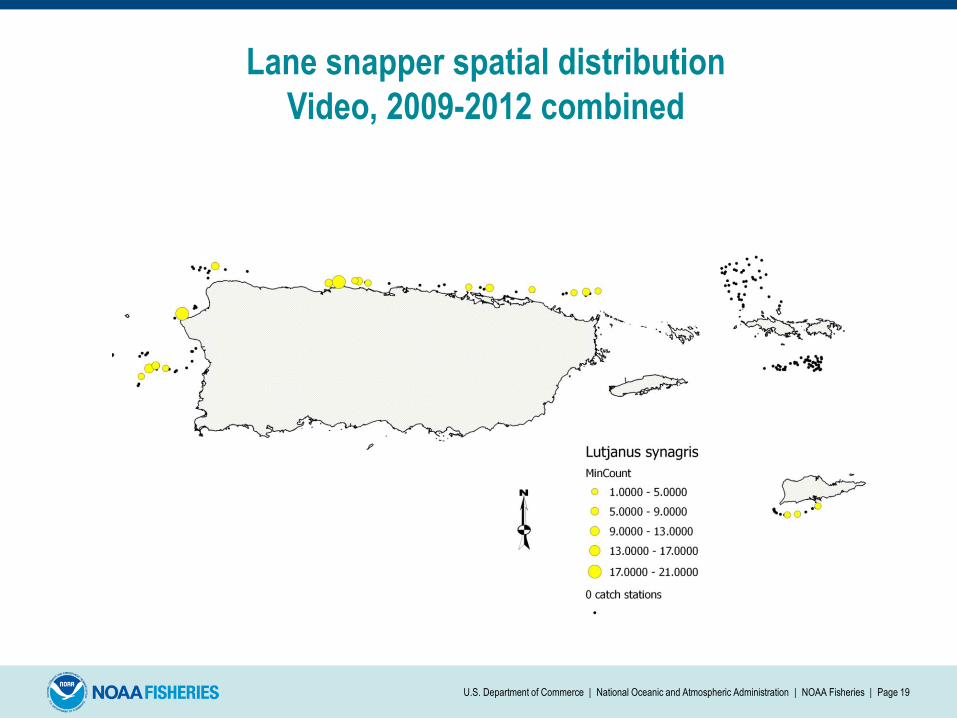
Lane snapper spatial distribution
Video, 2009-2012 combined
U.S. Department of Commerce | National Oceanic and Atmospheric Administration | NOAA Fisheries | Page 20
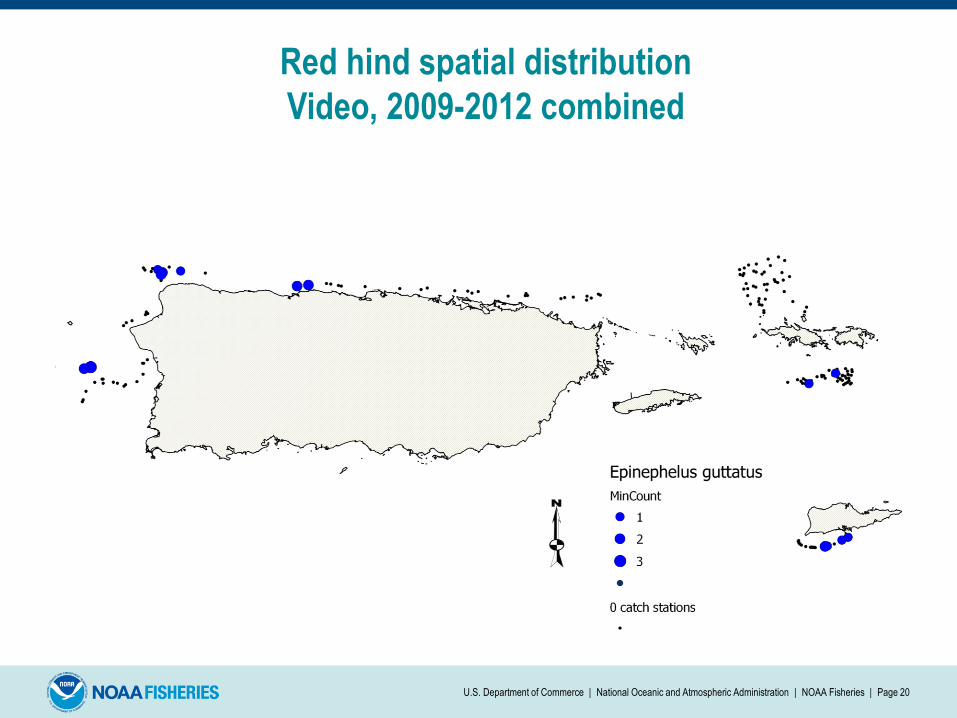
Red hind spatial distribution
Video, 2009-2012 combined
U.S. Department of Commerce | National Oceanic and Atmospheric Administration | NOAA Fisheries | Page 21
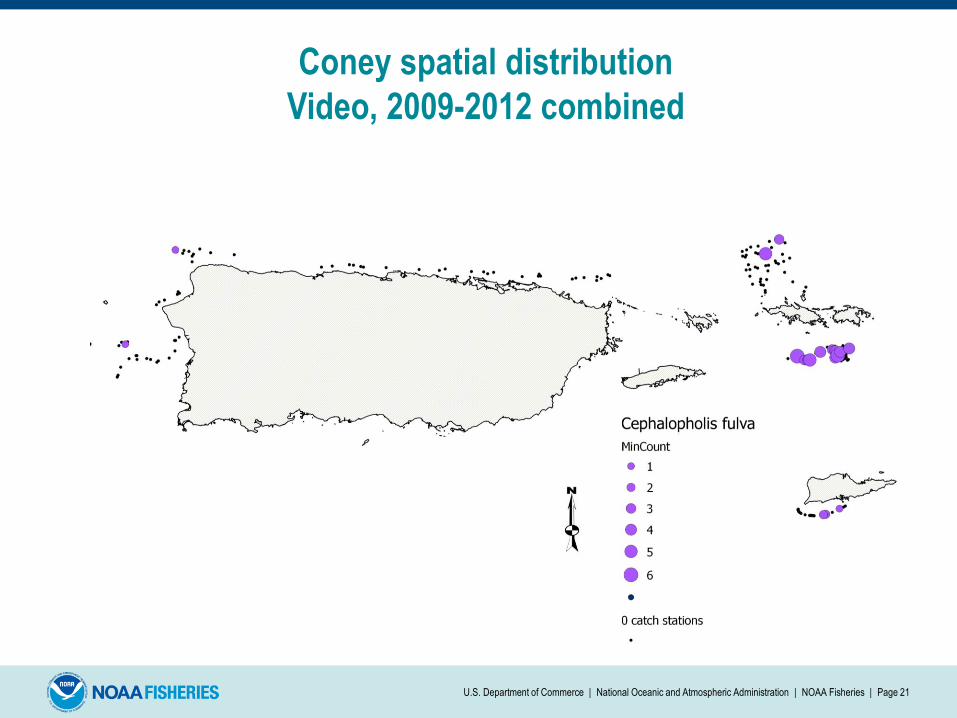
Coney spatial distribution
Video, 2009-2012 combined
U.S. Department of Commerce | National Oceanic and Atmospheric Administration | NOAA Fisheries | Page 22
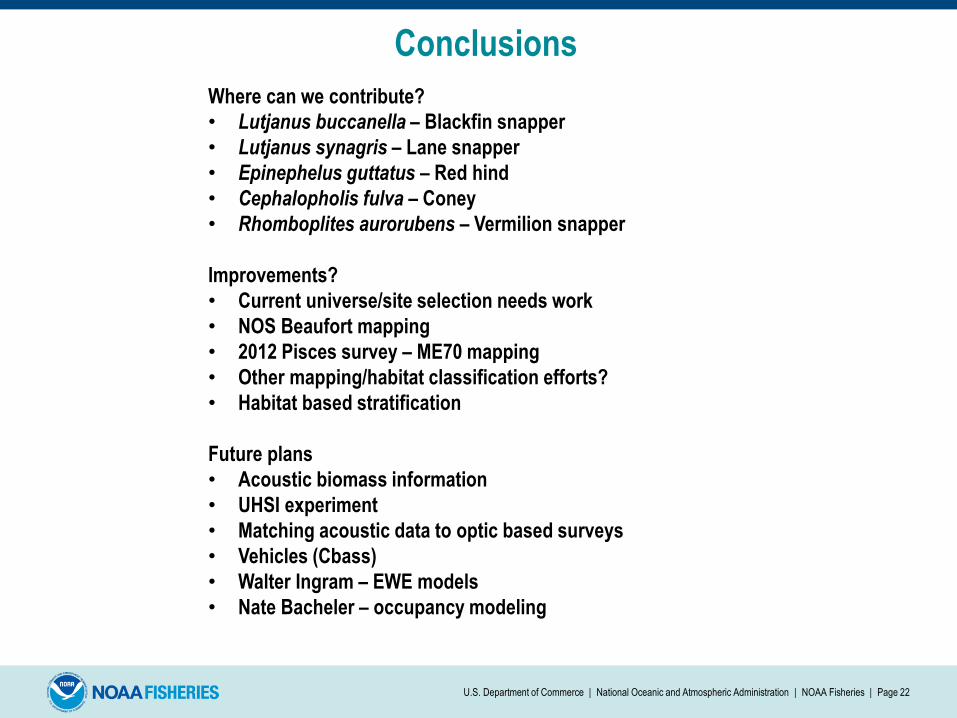
Conclusions
Where can we contribute?
• Lutjanus buccanella – Blackfin snapper
• Lutjanus synagris – Lane snapper
• Epinephelus guttatus – Red hind
• Cephalopholis fulva – Coney
• Rhomboplites aurorubens – Vermilion snapper
Improvements?
• Current universe/site selection needs work
• NOS Beaufort mapping
• 2012 Pisces survey – ME70 mapping
• Other mapping/habitat classification efforts?
• Habitat based stratification
Future plans
• Acoustic biomass information
• UHSI experiment
• Matching acoustic data to optic based surveys
• Vehicles (Cbass)
• Walter Ingram – EWE models
• Nate Bacheler – occupancy modeling

U.S. Department of Commerce | National Oceanic and Atmospheric Administration | NOAA Fisheries | Page 23
Questions?