Embed Size (px)
Citation preview

No More Gambling with the NumbersNo More Gambling with the Numbers
2009 Positive Behavior SupportSummer Conference
July 9 & 10, 2009Baton Rouge, Louisiana
Session 22A 9:30Session 22B 12:45
2009 Positive Behavior SupportSummer Conference
July 9 & 10, 2009Baton Rouge, Louisiana
Session 22A 9:30Session 22B 12:45
The Importance of Data-Based Decision Making
The Importance of Data-Based Decision Making
Who Cares About Data?
Who Cares About Data?
Administration
PBS Team
All Staff
Students
Parents
Administration
PBS Team
All Staff
Students
Parents
Types of Discipline Data to
Analyze
Types of Discipline Data to
AnalyzeOffice Referral
Minor Infraction
Suspension
ISS/Detention
Survey
Office Referral
Minor Infraction
Suspension
ISS/Detention
Survey
Discipline DatabasesDiscipline Databases
District/State Information Reporting System
SWIS, School Cop, JPAM, Pentamation, E Schools Plus, SIS
Individual School Excel Spread Sheets
District/State Information Reporting System
SWIS, School Cop, JPAM, Pentamation, E Schools Plus, SIS
Individual School Excel Spread Sheets
Average Referrals per Day / Month
By Environment By Location By Motivation By Problem Behavior By Staff Member Student Percent of Referrals Top Offenders
Average Referrals per Day / Month
By Environment By Location By Motivation By Problem Behavior By Staff Member Student Percent of Referrals Top Offenders
Report OptionsReport Options

Average Referrals per day per
Month
Average Referrals per day per
Month
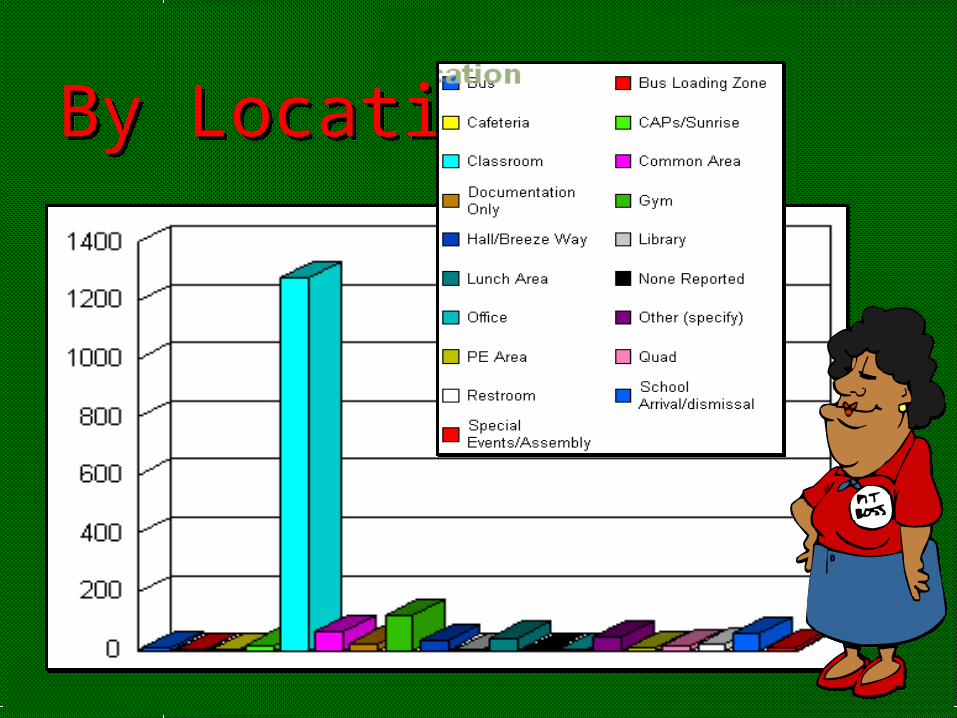
By LocationBy Location

By Environmental FactorsBy Environmental Factors
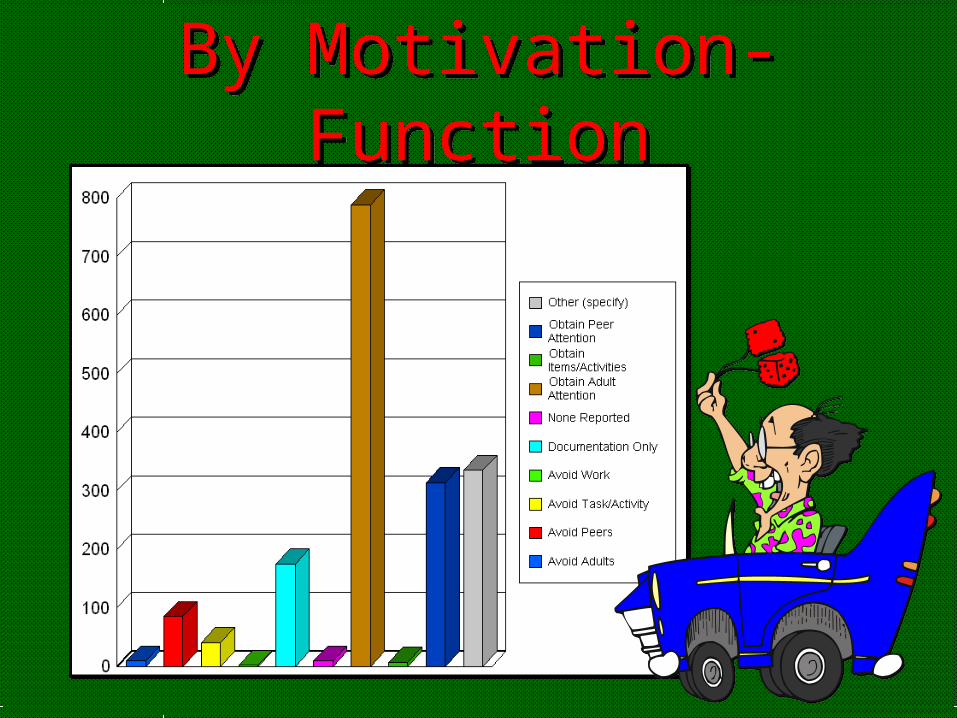
By Motivation-FunctionBy Motivation-Function
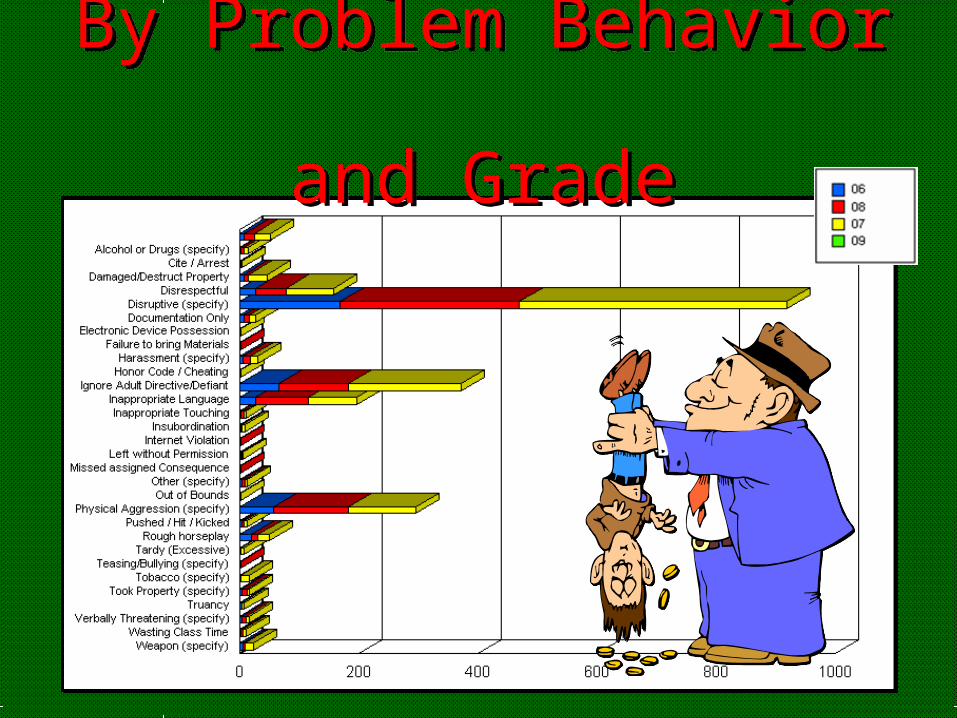
By Problem Behavior and Grade
By Problem Behavior and Grade
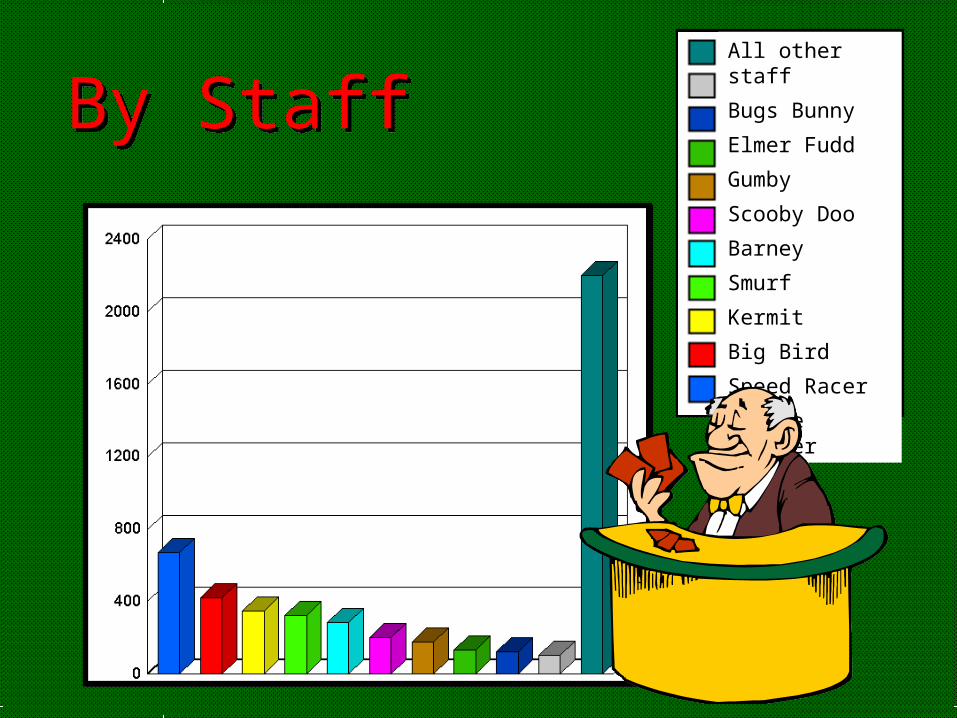
By StaffBy StaffAll other staff
Bugs Bunny
Elmer Fudd
Gumby
Scooby Doo
Barney
Smurf
Kermit
Big Bird
Speed Racer
Cookie Monster
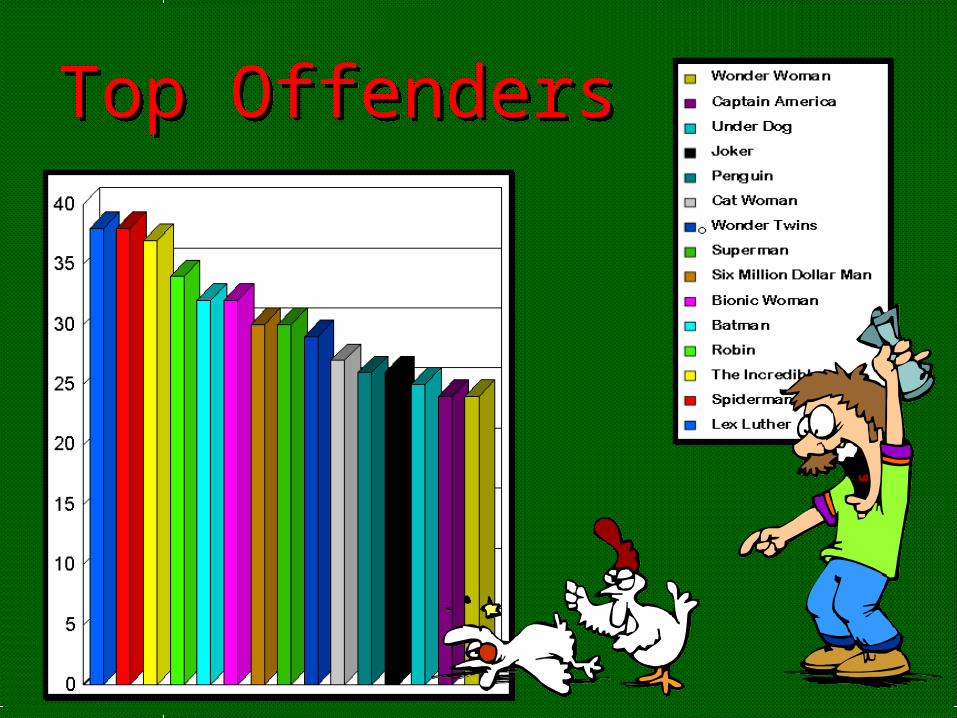
Top OffendersTop Offenders
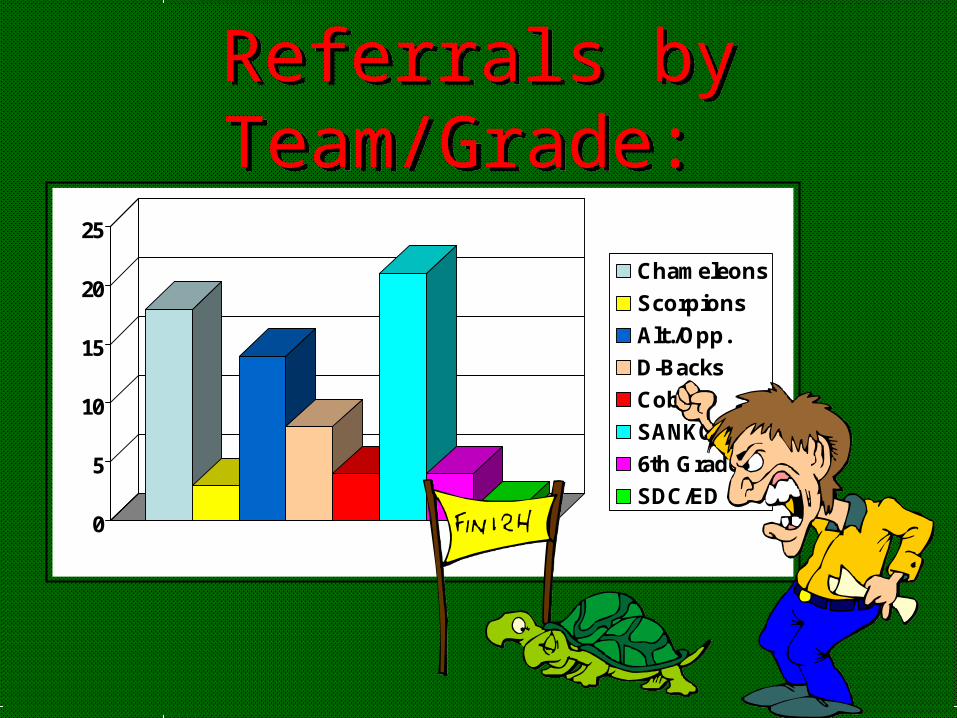
Referrals by Team/Grade: Referrals by Team/Grade:
0
5
10
15
20
25
Chameleons
Scorpions
Alt./Opp.
D-Backs
Cobras
SANKOFA
6th Grade
SDC/ED
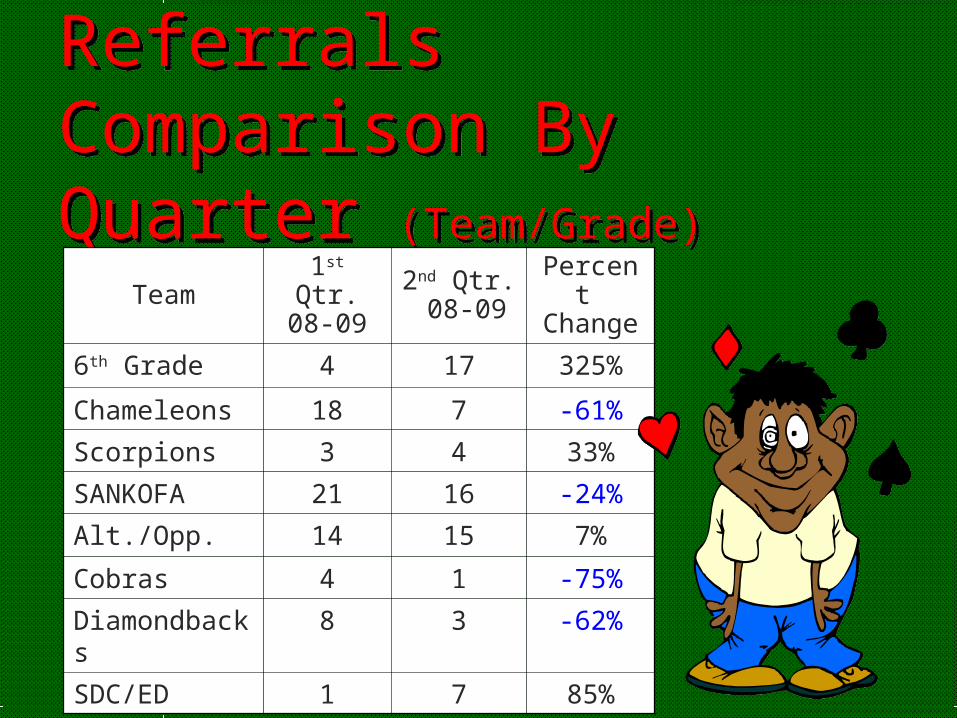
Referrals Comparison By Quarter (Team/Grade)
Referrals Comparison By Quarter (Team/Grade)
Team 1st Qtr.08-09
2nd Qtr. 08-09
Percent Change
6th Grade 4 17 325%
Chameleons 18 7 -61%
Scorpions 3 4 33%
SANKOFA 21 16 -24%
Alt./Opp. 14 15 7%
Cobras 4 1 -75%
Diamondbacks
8 3 -62%
SDC/ED 1 7 85%
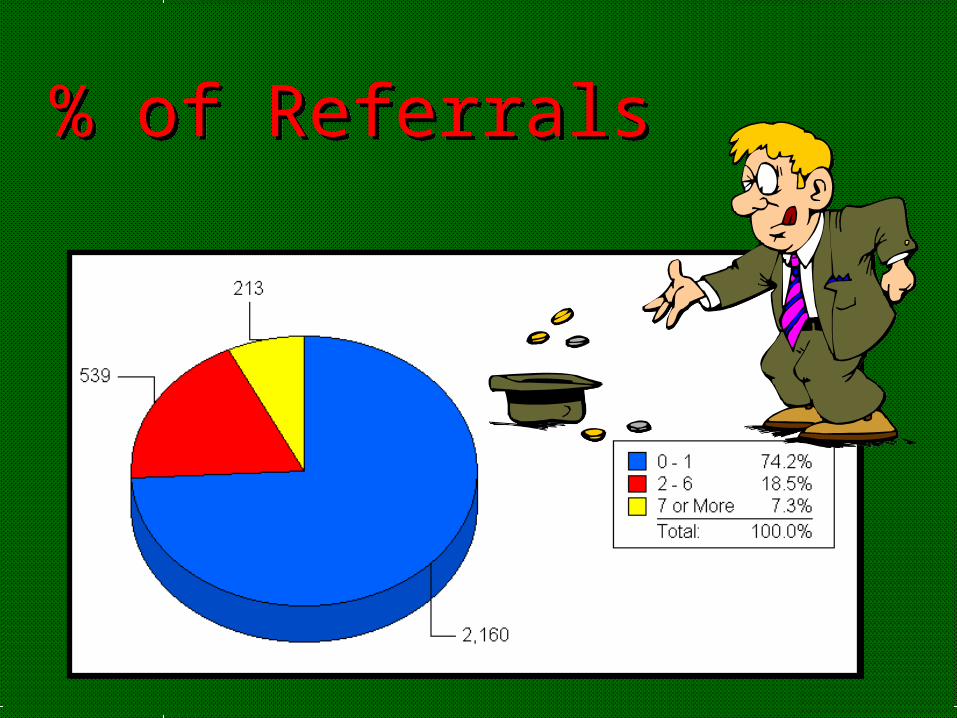
% of Referrals% of Referrals
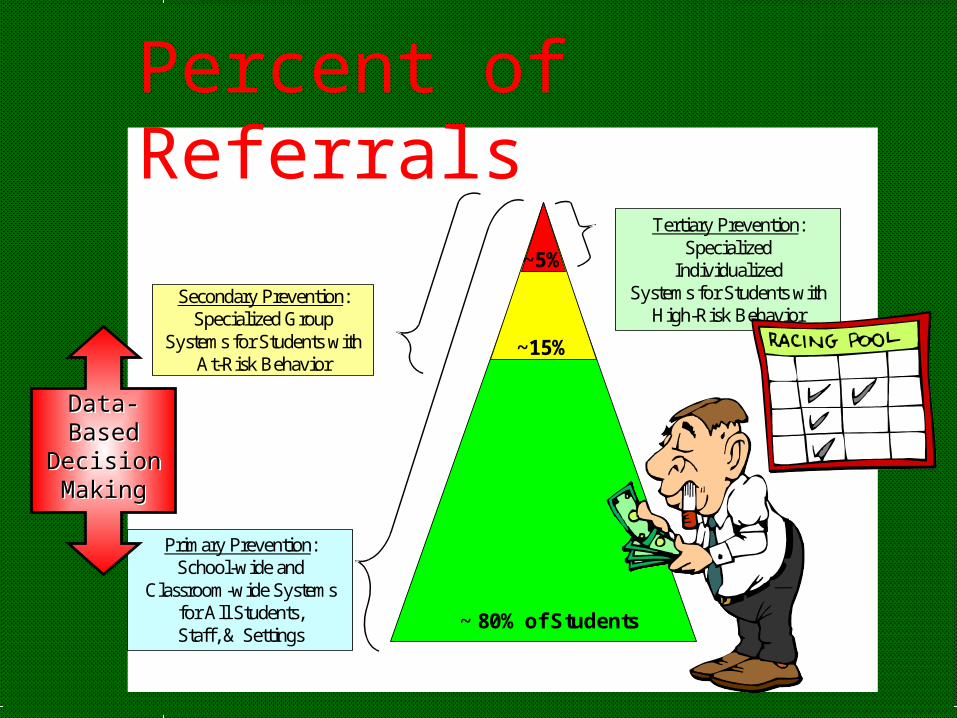
Primary Prevention:School-wide and
Classroom-wide Systems for All Students,Staff, & Settings
Secondary Prevention:Specialized Group
Systems for Students with At-Risk Behavior
Tertiary Prevention:Specialized
IndividualizedSystems for Students with
High-Risk Behavior
~ 80% of Students
~15%
~5%
Percent of Referrals
Data-Based
Decision Making
Data-Based
Decision Making
Suspension DataSuspension Data
Number of students suspended
Days missed/month By grade By track Top offenders What else?
Number of students suspended
Days missed/month By grade By track Top offenders What else?
Questions to ConsiderQuestions to Consider How do we decide which
reports to generate?
How often should discipline data be reviewed?
Should data be shared with staff? with students?
How do we decide which reports to generate?
How often should discipline data be reviewed?
Should data be shared with staff? with students?
Examples of Data Based Decisions
Examples of Data Based Decisions
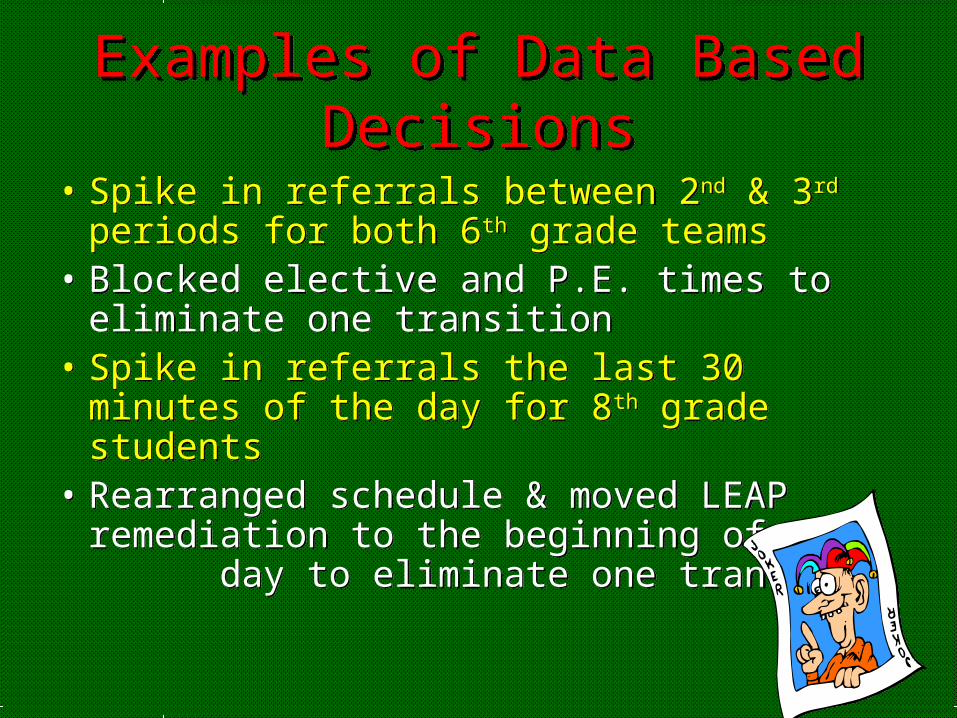
• Spike in referrals between 2nd & 3rd periods for both 6th grade teams
• Blocked elective and P.E. times to eliminate one transition
• Spike in referrals the last 30 minutes of the day for 8th grade students
• Rearranged schedule & moved LEAP remediation to the beginning of the day to eliminate one transition
Data Based Decisions, Cont.
Data Based Decisions, Cont.
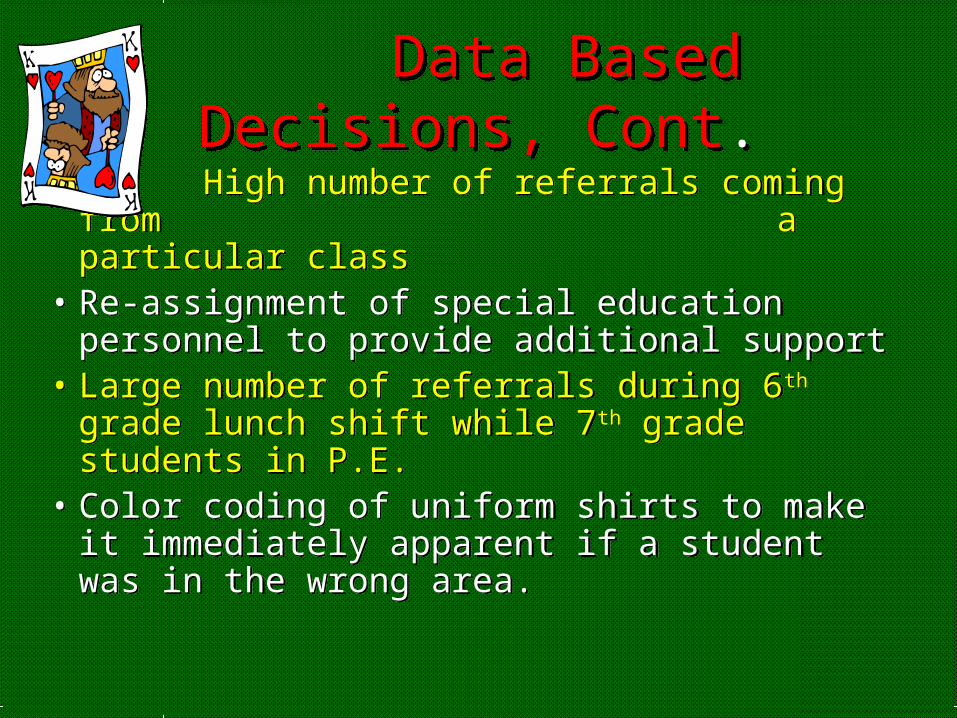
• High number of referrals coming from a particular class
• Re-assignment of special education personnel to provide additional support
• Large number of referrals during 6th grade lunch shift while 7th grade students in P.E.
• Color coding of uniform shirts to make it immediately apparent if a student was in the wrong area.

Data Based Decisions, Cont.Data Based Decisions, Cont.
• High number of referrals for certain teachers after other possible contributing factors have been eliminated
• Development of after school support mtgs. to work on classroom management
• Suspension data revealed frequent fights• Developed “Peaceful Day Count-Up”
competition between teams with high powered reinforcement activities

Data Based Decisions, Cont.Data Based Decisions, Cont.• High number of referrals for “Disrespect”• Survey staff and students: #1 to get information on how they
define disrespect including specific examples
#2 to get ideas on consequences when students/staff demonstrate the expectation & when they fail to meet the requirements
• Implement consensus plan developed by team after analyzing staff/student input
• High number of referrals for “Disrespect”• Survey staff and students: #1 to get information on how they
define disrespect including specific examples
#2 to get ideas on consequences when students/staff demonstrate the expectation & when they fail to meet the requirements
• Implement consensus plan developed by team after analyzing staff/student input

We will decrease the number of students who have We will decrease the number of students who have multiple days of detention not served by 50%, or multiple days of detention not served by 50%, or approximately 53 students, by the end of the 2approximately 53 students, by the end of the 2ndnd quarter as measured by our Detention data base.quarter as measured by our Detention data base.
Action Plan GoalAction Plan Goal

Strategies to Meet Action Plan Detention Goal:
Every Friday, A.P.’s/Community Resource Worker will make phone calls/home visits to students who have >1 detention not served.
Campus Security Officers will escort 2 students/day to detention 15 minutes prior to the end of school.
Using a current detention list, teachers will conduct a check during 4th Period every Thursday. Teachers will black out the yellow intramural sticker for all students owing >1 detention.
A.P.’s will issue new stickers and privileges will be renewed, once detentions are served.

YOUR TURNYOUR TURNAnalyze the charts on your handout and be
prepared to share the conclusions of your group.For each graph address these points:
A) What is this data showing you? B) What additional information would you need?C) What types of strategies/interventions would you begin to discuss and think about as your team analyzed this chart?C) What might be an appropriate action plan goal?

Please complete your evaluations
Please complete your evaluations
Sheryl Nix & Nancy TurmanSession 22A 9:30Session 22B 12:45

Credit & Thanks for original content & graphics:
Credit & Thanks for original content & graphics:
Jacquelin PatrickJacquelin Patrick Suzy JohnsSuzy Johns
Youth Services District MODEL CoachesSan Bernardino City Unified School District
Adapted & Presented by:Nancy Turman /
![NAVAL POSTGRADUATE SCHOOL Monterey, …M UNCLASSIFIED.UNLM. -ED C] SA!VE AS PPT 0 DT C USERS UNCLASSIFIED 22a NAME OF RESPOS BL.E ND'v ~ - 22b TELEPHONE (Include Area Code) 22c 0"1](https://img.pdfslide.net/doc/110x75/5fcc3b17837c8c56fc152a24/naval-postgraduate-school-monterey-m-unclassifiedunlm-ed-c-save-as-ppt-0-dt.jpg)