Embed Size (px)
Citation preview

The R/V Fulmar
The three central California National Marine Sanctuaries and the ports where the R/V Fulmar docks
NOAA Teacher at Sea Log:
Deborah Moraga
NOAA Ship: Fulmar Mission: ACCESS (Applied California Current Ecosystem Studies) Geographical area of cruise: Cordell Bank, Gulf of the Farallones and Monterey Bay National Marine Sanctuaries Date: July 20‐28, 2010
Overview The R/V Fulmar sets out from the dock early each morning. This ACCESS cruise has 5 members of the scientific team and myself (the NOAA Teacher at Sea.) There are two crew members for a total 8 people onboard. ACCESS is an acronym for Applied California Current Ecosystem Studies. This is a partnership between PRBO Conservation Science, Cordell Bank National Marine Sanctuary and the Gulf of the Farallones National Marine Sanctuary. These groups of conservation scientists are working together to better understand the impacts that different organisms have on the marine ecosystem off the coast of central California. They do this so that policy makers (government groups) have the most accurate data to help them make informed decisions on how the productive waters off the coast can be a resource for us and still protect the wildlife. You can read a more in depth explanation at http://www.accessoceans.org The R/V Fulmar is a 67 foot Marine Grade Aluminum catamaran (a multi hulled vessel.) This vessel can travel 400 miles before refueling and can reach 27 knots (30 miles per hour) with a cruising speed of 22 knots (25.3 miles per hour.) Although that may sound slow compared to the cars we drive… you have to take into account that there can be 10 foot waves to go over out on the ocean.

Immersion suit for safety
Flying Bridge
Marine scientist scanning for wildlife
The Fulmar’s homeport (where the boat ties up to dock most of the time) is in Monterey Bay, CA. For this cruise we will come into port (dock) in Bodega Bay, Sausalito, and Half Moon Bay. Each morning the crew wakes up an hour before the time we start out for the day. They check the oil and look over the engines, start the engines, disconnect the shore power and get the boat ready to sail out for a ten hour day. Today (July 23, 2010) we left at 0700 (7:00 a.m.) out of Bodega Bay. Bodega Bay is on the coast of Sonoma county, California. It is from Bodega Bay that we will travel offshore to the “lines” that we will be surveying. Today we will survey lines one and two. Then after the day’s work is done, we will sail into port, tie up to the dock and have dinner. The scientists and crew members sleep on the boat in the berths (bunks) that are located in the hulls of the boat.
Surveys “Okay, take a survey of the types of pets your classmates have at home. Then create a graph.” How many times have math teachers assigned that assignment and expected that students knew how to survey? Today I received firsthand knowledge of how a survey takes place. Up on the flying bridge (about 5.5 meters from the surface of the ocean) scientists are surveying birds and marine mammals. There is a protocol that each follows. Here, the protocol is basically a list of agreed upon rules on how to count the marine life seen on the ocean. One researcher inputs the data into a waterproof laptop…imagine chilling at the pool and being able to surf the web! There are other researchers sitting alongside and calling out the types of birds and marine mammals they see. The researchers surveying the birds and mammals use not only their eyes but also binoculars. After the researcher spots and identifies the birds or mammals, they call out their findings to the recording scientist in a code like fashion, doing this allows for the data to be inputted faster. The team can travel miles without

Krill collected by the Trucker Trawl
Researcher recording observations on the flying bridge
Pacific White Sided dolphins bow riding
seeing any organisms or there may be so many that the scientist at the laptop has a tough time keeping up. In this case the surveying scientist may have to write down their findings and report them when there is a break in the action. Imagine that you are driving down the highway with your family. You have been asked to count the number humans, cows, horses, goats, dogs, cats, cars or trash on your trip. How would you make sure that your family members didn’t double count and still record all that you see? This is where protocols (instruction/rules) come in. So, let us say that you are behind the driver, and your brother or sister is in the backseat next to the window. There is also a family member in the passenger seat up front (yeah they called ‘shot gun’ before you did.) This is much like the seating arrangement on the flying bridge of the R/V Fulmar. So how could you split up the road and area around the road so that you do not count something twice? You could split the area that you see into two parts. Take your left arm and stick it straight out the window. Have your sister/brother stick their right arm out their side window. If we drew an arc from your arm to your sibling’s arm it would be 180 degrees. Of the 180 degree arc, you are responsible for counting everything from your arm to the middle of the windshield. So, you are responsible for 90 degrees and your sibling has the other 90 degrees from the middle of the windshield to their arm. Once you start counting you need to record the data you are collecting. Can you write and count at the same time? Not very well, so we need someone to record the data. There are actually a lot of points of data that you need to enter. You need to tell the recorder…
• Cue: How did you see the item you are counting?
• Method: Were you searching by eye or using a pair of binoculars?

Krill
Entering observations
Krill
Recoding the data from the field
Pacific White Sided Dolphin
Deploying the CTD
Bringing in the Hoop Net
Deploying the Tucker Trawl
Collecting data from the CTD
• Bearing: The angle that the item is from the car as related to the front of the car.
• Reticle: How far the item was from your car when you first observed it (you would use your binoculars for this measurement).
• Which side of the car are you on and who is dong the observing?
• Behavior: What was the organism doing when you spotted it? Was it traveling, feeding or milling (just hanging out)?
You also have to determine the age and sex of the organism. You need to record the species of the organism and how many you observed. Now that is all for the species above the ground… what would you do for the animals below the road surface? On the R/V Fulmar they collect species from below the surface of the ocean and data about the water. They do this several different ways…
1. CTD: Conductivity, Temperature, and Depth. This is a tool that records the physical properties of the ocean. It records…
a. Salinity (amount of salt in the water) b. Temperature (how hot or cold the water is) c. Depth (how far the instrument travels below
the surface) d. How much chlorophyll is in the water e. Turbidity (how murky or clear the water is) f. How much oxygen is in the water
2. Hoop Net: Looks like a very heavy hula hoop. Except
this hoop has a cone shaped cylinder made of fine mesh attached to it. At the apex of the cone, a small PVC container, called a cod end, is attached. Zooplankton (tiny swimming animals) and some phytoplankton (tiny marine plants) are funneled into the cod end of the net as it is towed behind the boat. When the net comes back to the boat, the researchers take off the cod end and use this sample of organisms.
3. Tucker Trawl: Is like three hoop nets attached together. The cool thing about this big net is that the scientists can close each net at different depths. As

Map of the transect lines
Retrieving the Hoop Net
Phytoplankton Net
the net is towed behind the boat they “close” each net to capture zooplankton at different depths. The tucker trawl is used primarily to collect krill
Transects
Have you ever lost something in your room? Perhaps it was your homework? The bus is coming and you have to find your binder. So you start tearing your room apart. By the time the bus is five minutes away… you room looks like a disaster and you can’t remember where exactly you have looked and yet, still no binder.
Imagine a group of scientists 30 miles offshore, doing that same type of “looking” for organisms, with the captain piloting (driving) the boat any which way. Just like your binder that was missed when you were looking for it, number and location of organisms in parts of the ocean would be missing from the data set.
So if you wanted a systematic way to look for your homework that is lost in your room, you would imagine a grid. You would have lines running from one wall to another. These lines would be parallel to each other. You would walk along the line looking for you binder. When you came to the end of the line (at your wall) you would then start on another line. By walking back and forth in your room in this systematic way, you will not miss any part of your room.
You have just traveled along a transect line. A transect is a path you travel and as you do you are counting and recording data. On the R/V Fulmar, scientists are counting birds, marine mammals, and collecting krill. By counting how many and what kinds of organisms are along the transect line, scientists will be able to calculate the density of organisms in a given area. There are several different types on lines that we survey. There are the near shore transects…which extend 12 kilometers from the shore (that is as long as running back a forth a football field 131 times). Offshore lines are 50 to 60 kilometers from the coast. Imagine how many football fields that would be!
Density… Take your right hand and put it in your right front pocket of your pants and pull out all the coins you have in your pocket. Looking down at your hand you count 10 dimes. Now do the same for your left hand. You found you have two dimes. The “area” those coins were located is equal… meaning your pockets are the same size. The density of coins in your pockets is greater in your right pocket because there are more coins per square inch than in your left pocket.
The researchers on the ACCESS cruise use the data they have collected out in the field (in this case the field is the three central California National Marine Sanctuaries) to calculate the density of the organisms they are researching. They are counting and recording the number of organisms and their location so they can create graphs and maps that show the distribution of those organisms in the waters off the coast.
Why do they need this information? The data starts to paint a picture of the health of the ecosystem in this part of the world. With that information, they can make suggestions as to how resources are used and how to protect the waters off the California coast. By using data that has been collected over many years, suggestions can be made on how the ocean can still be utilized (used) today while insuring that future generations of humans, marine mammals, birds and krill have the same opportunities.
Bow of R/V Fulmar
Humpback Whale
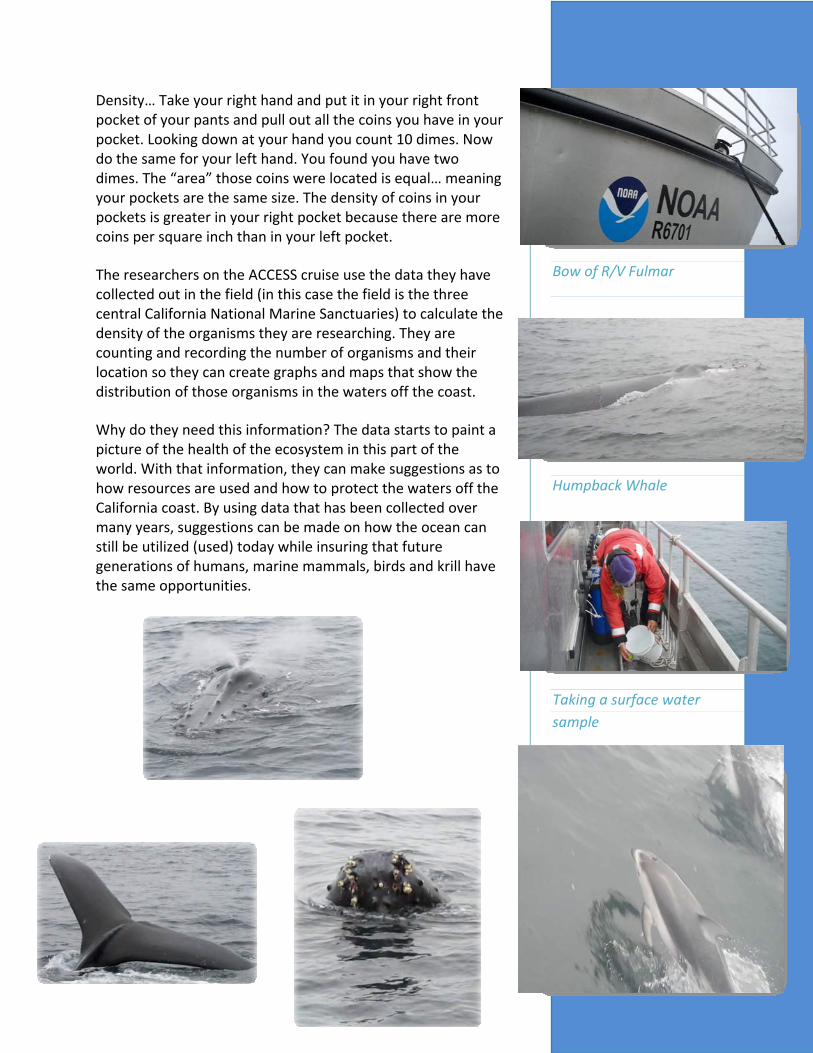
Taking a surface water sample


![C3 2012-1 [Moraga] (con Pauta)](https://img.pdfslide.net/doc/110x75/55cf92a4550346f57b9846b6/c3-2012-1-moraga-con-pauta.jpg)