Embed Size (px)
Citation preview
PLEASE 00 Nor REMOVE FRCM LIBRARY
REPORT OF INVESTIGATIONS/1989
Noise Test Report: Handheld Pneumatic Rotary Drill
By Robert R. Stein and William W. Aljoe
BUREAU OF MINES
UNITED STATES DEPARTMENT OF THE INTERIOR
Mission: As the Nation's principal conservation agency, the Department of the Interior has responsibility for most 01 our nationally-owned public lands and natural and cultural resources. This includes fostering wise use of our land and water resources, protecting our fish and wildlife, preserving the environmental and cultural values of our national parks and historical places, and providing for the enjoymenl of life through outdoor recreation. The Department assesses our energy and mineral resources and works to assure that their development is in the best interests of all our people. The Department also promotes the goals of the Take Pride in America campaign by encouraging stewardship and citizen responsibility for the public lands and promoting citizen participation in their care. The Department also has a major responsibility for American Indian reservation communities and for people who live in Island Territories under U.S. Administration.
Report of Investigations 9269
Noise Test Report: Handheld Pneumatic Rotary Drill
By Robert R. Stein and William W. Aljoe
UNITED STATES DEPARTMENT OF THE INTERIOR Manuel Lujan, Jr., Secretary
BUREAU OF MINES T S Ary, Director
Library of Congress Cataloging in Publication Data:
Stein, Robert R. Noise test report: handheld pneumatic rotary drill I by Robert R Stein and
William W. AJjoc.
(Report of investigations; 9269)
Bibliography: p. 11
Sup!. of Docs. no.: I 2823:9269.
1. Rotary percussion drills-Noise. 2. Pneumatic tools-Noise. !. Aljoc, William W. II. Title. m. Series: Report of investigations (United States. Bureau of Mines); 9269.
TN345.S74 1989 622'.8-dc19 89-600040
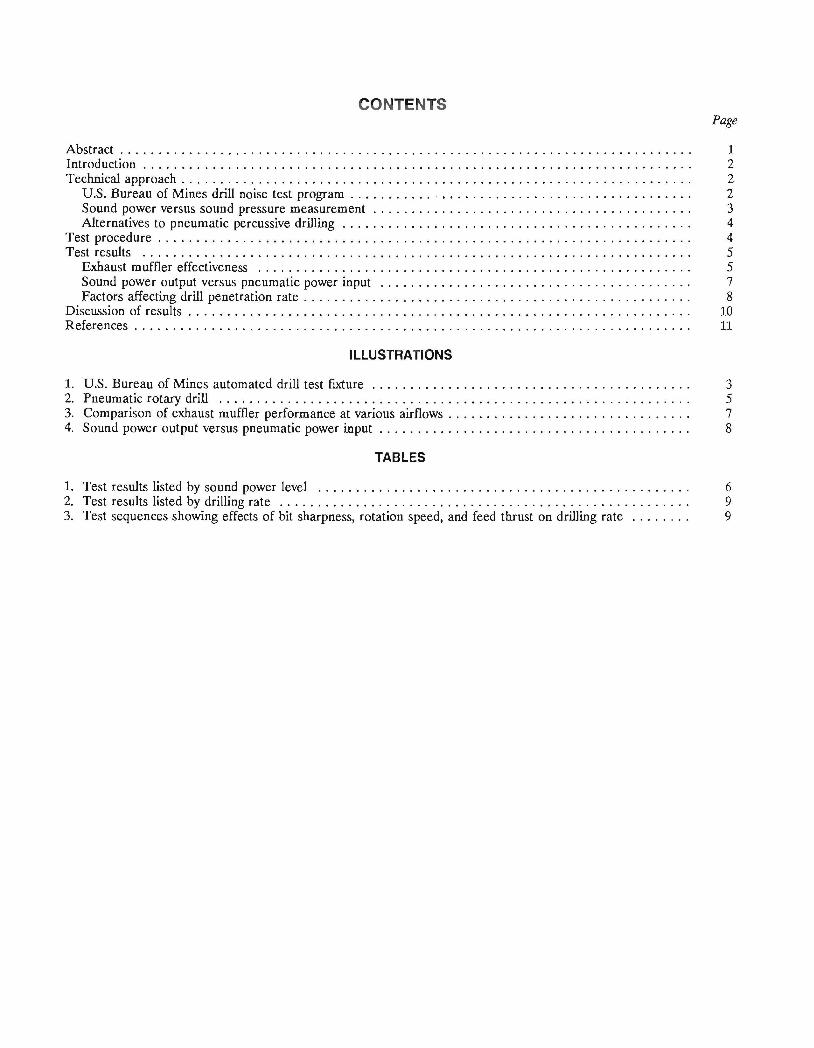
CONTENTS Page
Abstract. . . . . . . . . . . . . . . . . . . . . . . . . . . . . . . . . . . . . . . . . . . . . . . . . . . . . . . . . . . . . . . . . . . . . . . . . . . 1 Introduction . . . . . . . . . . . . . . . . . . . . . . . . . . . . . . . . . . . . . . . . . . . . . . . . . . . . . . . . . . . . . . . . . . . . . . . . 2 Technical approach. . . . . . . . . . . . . . . . . . . . . . . . . . . . . . . . . . . . . . . . . . . . . . . . . . . . . . . . . . . . . . . . . . . 2
U.S. Bureau of Mines drill noise test program ........... , . . . . . . . . . . . . . . . . . . . . . . . . . . . . . . . . . 2 Sound power versus sound pressure measurement . . . . . . . . . . . . . . . . . . . . . . . . . . . . . . . . . . . . . . . . . . 3 Alternatives to pneumatic percussive drilling . . . . . . . . . . . . . . . . . . . . . . . . . . . . . . . . . . . . . . . . . . . . . . 4
Test procedure . . . . . . . . . . . . . . . . . . . . . . . . . . . . . . . . . . . . . . . . . . . . . . . . . . . . . . . . . . . . . . . . . . . . . . 4 Test results ........................................................................ 5
Exhaust muffler effectiveness ......................................................... 5 Sound power output versus pneumatic power input ......................................... 7 Factors affecting drill penetration rate . . . . . . . . . . . . . . . . . . . . . . . . . . . . . . . . . . . . . . . . . . . . . . . . . . . 8
Discussion of results . . . . . . . . . . . . . . . . . . . . . . . . . . . . . . . . . . . . . . . . . . . . . . . . . . . . . . . . . . . . . . . . . . 10 References ........................................... , . . . . . . . . . . . . . . . . . . . . . . . . . . . . . 11
ILLUSTRATIONS
1. U.S. Bureau of Mines automated drill test flxture .......................................... 3 2. Pneumatic rotary drill .............................................................. 5 3. Comparison of exhaust muffler performance at various airflows. . . . . . . . . . . . . . . . . . . . . . . . . . . . . . . . 7 4. Sound power output versus pneumatic power input . . . . . . . . . . . . . . . . . . . . . . . . . . . . . . . . . . . . . . . . . 8
TABLES
1. Test results listed by sound power level ................................................. 6 2. Test results listed by drilling rate ...................................................... 9 3. Test sequences showing effects of bit sharpness, rotation speed, and feed thrust on drilling rate ........ 9
UNIT OF MEASURE ABBREVIATIONS USF.O IN THIS REPORT
cfm cubic foot per minute hp horsepower
dB decibel in inch
dBA decibel, A-weighted kHZ kilohertz
ft foot lbf pound (force)
fe square foot pSI pound per square inch
ff cubic foot s second
fpm foot per minute W watt
h hour
NOISE TEST REPORT: HANDHELD PNEUMATIC ROTARY DRILL
By Robert R. Stein 1 and William W. Aljoe 1
ABSTRACT
Using an automated drill test fooure, the U .S. Bureau of Mines measured the sound power levels produced by a small, pneumatic, rotary roof drill. A series of tests was conducted to determine (1) the relative effectiveness of several drill muffling schemes and (2) the relationship between drill sound power and pneumatic power supplied to the drill. The influence of rotation rate (i.e., airflow) and feed thrust on the penetration rate of the drill was also noted.
IMining engineer. Pittsburgh Research Center, U.S. Bureau of Mines, Pittsburgh, PA.
2
INTRODUCTION
Percussion drills used in the mining industry produce noise that can cause exposures of 10 to 20 times the limits allowed by Federal noise regulations. Typical noise levels experienced by percussion drill operators are 110 to 120 dBA. Approximately 60,000 percussion drills are being used in the mining industry (1)/ and many more are used in the construction industry. No easy solution exists to the drill noise problem; at present, reduction in noise severity is the most realistic goal.
Many attempts to control the noise emanating from percussion drills have been made, through the use of either retrofit noise control treatments (2-6) or new drill design features (7-10). These attempts have been moderately successful, resulting in noise reductions of up to 15 dBA at the drill operator position. Unfortunately, some of the noise-controlled drills have rather impractical features from an operational standpoint (e.g., reduced drilling rates, muffler freezing, excessive weight and bulk). Furthermore, in most cases the "quieted" noise levels are still above lao dBA; at this level, operator exposure would have to be limited to only 2 h per day to maintain compliance with Federal noise regulations.
Probably the most effective means of preventing overexposure to drill noise has been to place the operator
in an acoustical cab. Noise reductions of up to 20 dBA have been achieved through this technique, and in several cases the noise level measured inside the cab has been below 90 dBA (6). If the drill is mounted on a large piece of mobile equipment Gumbo rig) in an area of unrestricted headroom, an acoustical cab would be the preferred means of noise control.
However, many mining situations involve severe space restrictions that preclude the use of a jumbo-mounted drill of any type, let alone one equipped with an acoustical cab. In fact, the handheld pneumatic percussion drill, one of the most serious noise offenders in the mining industry today, is still widely used in various underground operations because of its compactness, flexibility, reliability, and low cost.
As part of its program to promote health and safety in mining, the u.s. Bureau of Mines studies various aspects of noise control. Because the handheld drill is the machine for which at-source noise controls are needed the most, it was chosen as the initial focus of research at the Bureau's in-house drill noise test facility at the Pittsburgh Research Center. This report describes tests conducted with a pneumatic rotary drill, which is a potentially quieter alternative to the pneumatic percussion drill.
TECHNICAL APPROACH
U.S. BUREAU OF MINES DRILL NOISE TEST PROGRAM
A detailed understanding of percussive and rotary drill design characteristics and their effect on noise is an important part of any effort to reduce the noise problem. The Bureau has undertaken an extensive research effort to significantly enhance the body of knowledge on the subject through an in-depth drill noise test program. Part of this test program, the evaluation of a small, pneumatic all-rotary drill, is described in this report. It is hoped
2ltalic numbers in parentheses refer to items in the list of references at the end of this report.
that well-controlled drill noise tests of this type can provide valuable but heretofore unavailable quantitative information on the sound power levels produced by different types and models of drills. Noise variations resulting from differences in drill operating parameters can also be investigated and quantified.
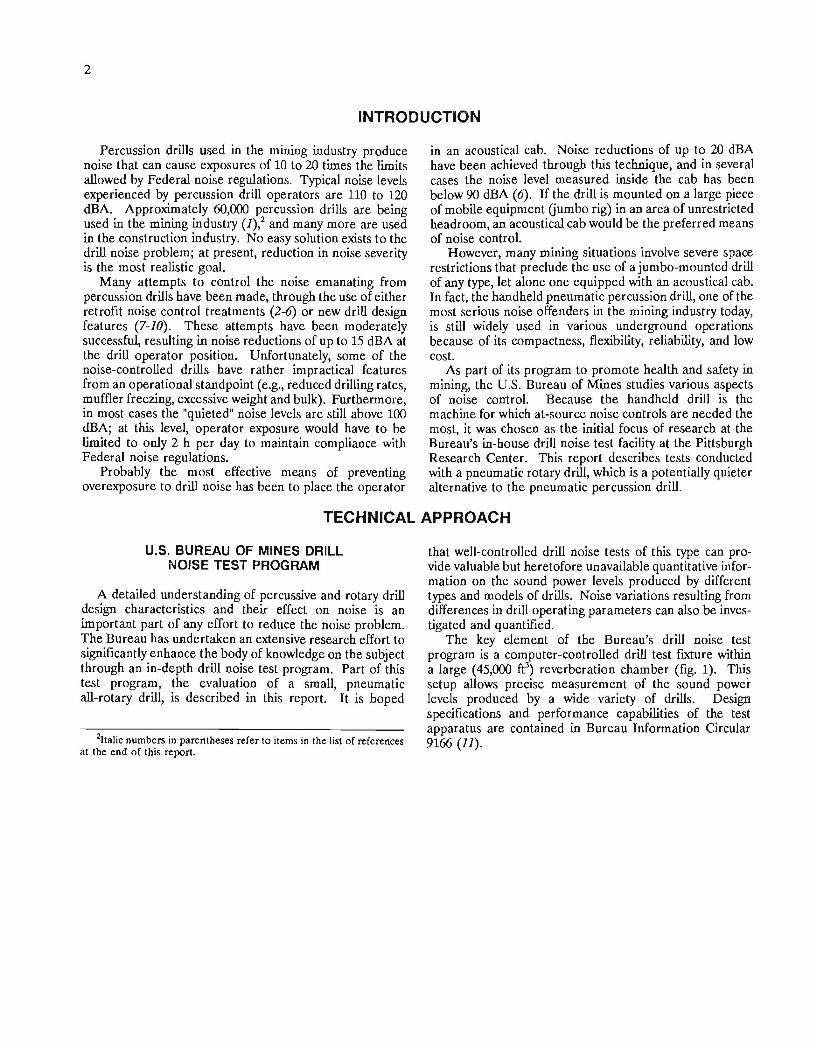
The key element of the Bureau's drill noise test program is a computer-controlled drill test fixture within a large (45,000 tr) reverberation chamber (fig. 1). This setup allows precise measurement of the sound power levels produced by a wide variety of drills. Design specifications and performance capabilities of the test apparatus are contained in Bureau Information Circular 9166 (11).
3
Figure 1.-U. S. Bureau of MInes automated drill test fixture.
SOUND POWER VERSUS SOUND PRESSURE MEASUREMENT
Sound power is a measure of the rate at which
SPL = PWL + 10 log [(0/4 r2) + (4/a S)] + 10 dB,
where SPL sound pressure level, dB,
acoustical energy is emitted by a noise source; it is usually PWL sound power level of the source, dB, expressed as sound power level, in decibels, by the formula ~: 0 directivity factor; its value is a' function
of the angle from the acoustical center of the noise source to the measurement point,
PWL = 10 log (W 8':C/W reU,
where PWL sound power level, dB,
Wac< actual sound power, W,
and Wr<l reference sound power, 10-12 W.
The most important distinction between sound power level and sound pressure level, the quantity most commonly associated with noise, is that sound power is a fundamental property of the noise source itself. Conversely, sound pressure is dependent on the distance from the noise source, the direction from the source, and the acoustical properties of the environment · in which it is measured. The relationship between the sound power and sound pressure level at any point in the environment can be quantified (13):
r
a
and S
distance from the source, ft,
average absorption coefficient of the environment,
total surface area of all reflecting surfaces in the environment, fe.
When considering drill noise, sound power is the quantity of greatest interest because (1) it allows direct noise comparisons to be made among different types and models of drills and (2) it can be used to predict the sound pressure levels that will occur in other environments, given their acoustical characteristics.
4
The directivity factor mentioned above reflects the tendelrlcy of a sound source to radiate more noise in one direction than in others. The greatest disadvantage of the exi.:stir:lg drill noise test setup is that directivity information is unattainable because of the reverberant nalure of the acoustical environment; however, most mining situations provide highly reverberant environments that largely negate the directivity of any noise source.
ALTERNATIVES TO PNEUMATIC PERCUSSIVE DRILLING
The two processes of any pneumatic drill are the action of the piston within drill body to radiated from both the body and the drill rod) and the exhaust of the air to the It is therefore logical to assume that which lack per'cus,sio:n, and lack air exl1lau1;t, would be than their pneumatic-percussive the hydraulically powered rotary roof drills used in underground coal mines usually produce noise levels of 93 to 97 dBA at the operator position (14).
Howel/er, several fundamental prc,blf;ms prohibit the widespread use of hydraulic, drills as a universal re~)lac::eDrlerlt for drills. First, most
drills on the market today are machine" too to meet the operational demands
qua.rtelrs, lclcat.ioIlIS, odd drilling angles) now haIldheld pmmDrlat;ic percussion drills.
hy<lralwic or pneumatic, are peliletrating hard-rock formations
cornplre~;1Ve stn;:njl:thglre~a:tf~r than 20,000 psi) at acc:epltab.le advance rates. a result of these two con:sLnUUllS, rotary drills are not considered a "quiet" alternative to handheld pneumatic percussion drills currently
in mines that are located in hard formations, mainly metal-nonmetal mines.
Although rotary drilJs are generally unsuitable for drilling in very hard formations, they represent a realistic alternative for coal mines, which are usually surrounded soft to moderately hard strata. This report covers the noise and performance aspects of a handheld pneumatic drill, one of several models now being used in coaJ mines.
While hydraulic percussion drills are an alternative to pneumatic percussion drills, they are more both to purchase and to operate than drills powered by compressed air. They are usually economically attractive to mines that rely on drilling and blasting as their means of winning rock. Hydraulically powered drills are also being tested by the Bureau and will be the subject of future Reports of Investigations.
TEST PROCEDURE
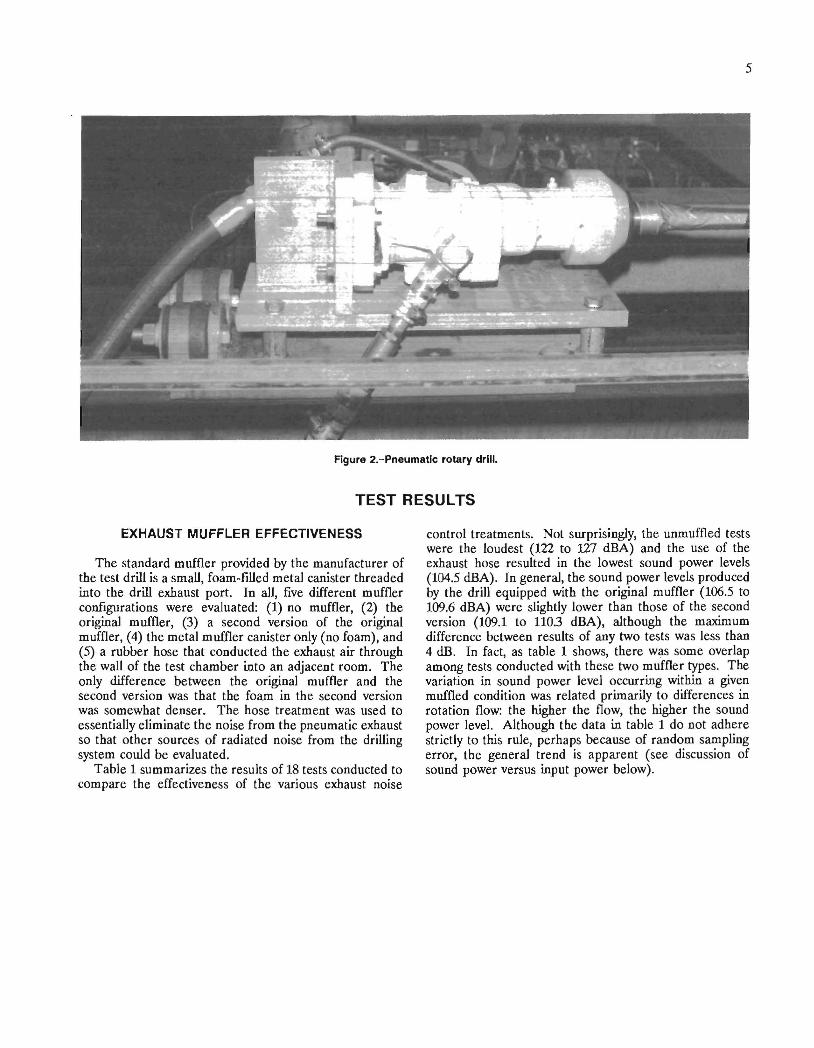
The handheld pneumatic rotary drill used in the tests is to drill rooiliolt holes and install bolts in unjder'gfi)UIld coal mines and other mines with relatively soft strata. Its configuration is similar to that of the handheld stopers or jackleg drills common to American hard-rock mines. The drill body is mounted on top of an air leg that provides the thrust necessary for drilling. The controls for the drill are mounted on a handle that pivots out from the air leg. The test drilJ is an all-rotary (no percussion) drill and is generally not suitable for use in rock with compressive strength greater than 28,000 Its primary use in American mining has been as an 21110Ii::ifV roof bolter in 10ngwaU mines.
The drill was mounted on one of the feeds of the Bureau's automated drill test fixture (fig. 2). A total of 30 horizontal holes were drilled-28 in concrete and 2 in Barre granite. Only the holes in concrete were suitable for detailed data analysis because of the slow pelletlratilon rates in a medium much that for which the All holes were 4 to 6 ft in length, with a Tests were conducted over a wide range of the drill; rotation flows ranged from and feed thrusts from 4QO to 900 lbf. were measured
and recorded at 4-s int''''I'V~Is.·
the test chamber were recorcled Test data were for two (1) to
determine the effectiveness of several mlllttliingschemes for the drill exhaust and to a mathe-llH':U""<U n~laliolllshilP between and the
SUpphf~d to the drill For purpose of COllsisted of a of a hole in which opf~rating parameters-rot:aticln flow and
thrusl:-rern,aUled rel:ati'V'ely narrow range· Drill rates sound power
were aVf;ra~(ed over that portion of the hole. This method of test was valid because, except during collaring, sound power was unrelated to hole depth.3 Drill penetration rates were examined during the tests in order to that the drill was correctly. Anal-
of the rate was not primary focus of the test program; however, the data provided by the drill test fixture provided some interesting information on the factors required for good drill penetration.
:J.:rhe apparent lack of drill steel noise is a notable advantage of rotary drills over percussion drills (15).
5
Figure 2.-Pneumatic rotary drill.
TEST RESULTS
EXHAUST MUFFLER EFFECTIVENESS
The standard muffler provided by the manufacturer of the test drill is a small, foam-filled metaJ canister threaded into the drill exhaust port. In aJl, five different muffler configurations were evaluated: (1) no muffler, (2) the originaJ muffler, (3) a second version of the original muffler, (4) the metal muffler canister only (no foam), and (5) a rubber hose that conducted the exhaust air through the wall of the test chamber into an adjacent room. The only difference between the original muffler and the second version was that the foam in the second version was somewhat denser. The hose treatment was used to essentially eliminate the noise from the pneumatic exhaust so that other sources of radiated noise from the drilling system couJd be evaluated.
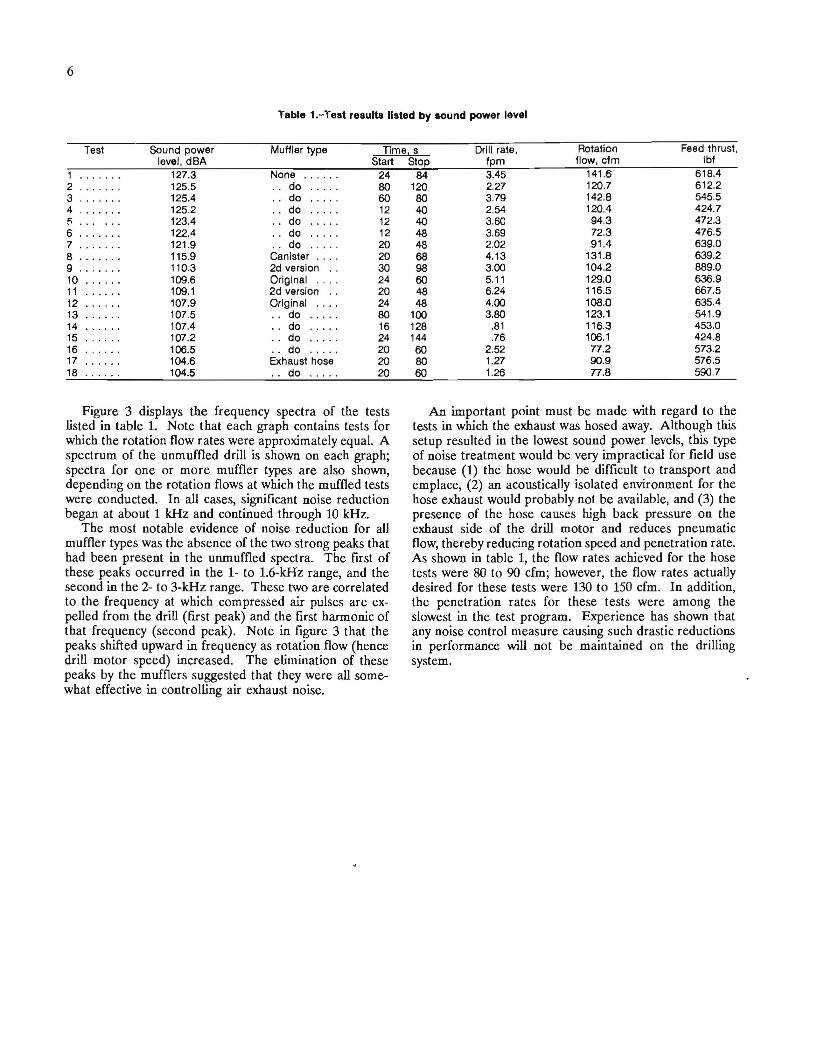
Table 1 summarizes the results of 18 tests conducted to compare the effectiveness of the various exhaust noise
control treatments. Not surprisingly, the unmuffled tests were the loudest (122 to 127 dBA) and the use of the exhaust hose resulted in the lowest sound power levels (104.5 dBA). In generaJ, the sound power levels produced by the drill equipped with the originaJ muffler (106.5 to 109.6 dBA) were slightly lower than those of the second version (109.1 to 110.3 dBA), aJthough the maximum difference between results of any two tests was less than 4 dB. In fact, as table 1 shows, there was some overlap among tests conducted with these two muffler types. The variation in sound power level occurring within a given muffled condition was related primariJy to differences in rotation flow: the higher the flow, the higher the sound power level. Although the data in table 1 do not adhere strictly to this rule, perhaps because of random sampling error, the generaJ trend is apparent (see discussion of sound power versus input power below).
6
Table 1.-Test results listed by lound power level
Test Sound power Muffler type Time, s Drill rate, Rotation Feed thrust, Ibf level, dBA Start
1 127.3 None ...... 24 2 125.5 do 80 3 125.4 do 60 4 125.2 do 12 ~ 123.4 do 12 6 122.4 do 12 7 121.9 do 20 8 115.9 Canister .... 20 9 110.3 2d version .. 30 10 109.6 Original .... 24 11 109.1 2d version .. 20 12 107.9 Original .... 24 13 107.5 do 80 14 107.4 · . do . . .. . 16 15 107.2 · . do . .... 24 16 106.5 · . do . .. .. 20 17 104.6 Exhaust hose 20 18 104.5 do 20
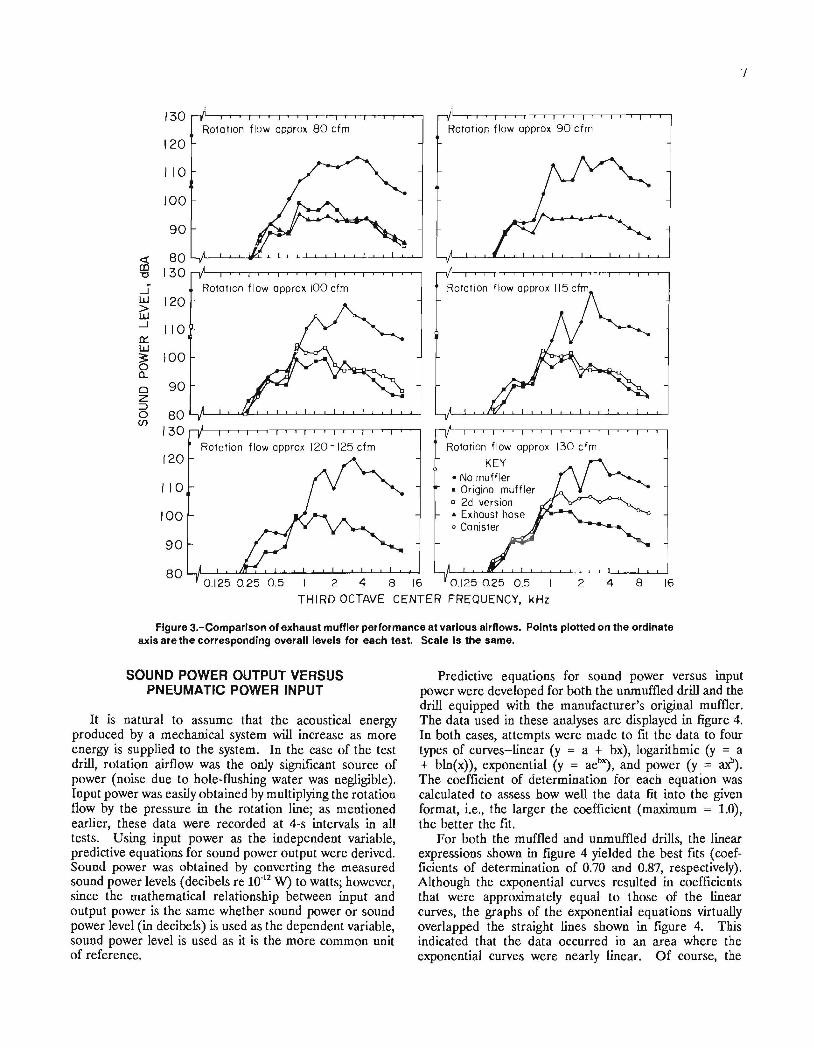
Figure 3 displays the frequency spectra of the tests listed in table 1. Note that each graph contains tests for which the rotation flow rates were approximately equal. A spectrum of the unmuffled drill is shown on each graph; spectra for one or more muffler types are also shown, depending on the rotation flows at which the muffled tests were conducted. In all cases, significant noise reduction began at about 1 kHz and continued through 10 kHz.
The most notable evidence of noise reduction for all muffler types was the absence of the two strong peaks that had been present in the unmuffled spectra. The first of these peaks occurred in the 1- to 1.6-kHz range, and the second in the 2- to 3-kHz range. These two are correlated to the frequency at which com pressed air pulses are expelled from the drill (first peak) and the first harmonic of that frequency (second peak). Note in figure 3 that the peaks shifted upward in frequency as rotation flow (hence drill motor speed) increased. The elimination of these peaks by the mufflers suggested that they were all somewhat effective in controlling air exhaust noise.
Stop fpm flow, cfm
84 3.45 141.6 618.4 120 2.27 120.7 612.2 80 3.79 142.8 545.5 40 2.54 120.4 424.7 40 3.60 94.3 472.3 48 3.69 72.3 476.5 48 2.02 91.4 639.0 68 4.13 131.8 639.2 98 3.00 104.2 889.0 60 5.11 129.0 636.9 48 6.24 116.5 667.5 48 4.00 108.0 635.4
100 3.80 123.1 541.9 128 .81 116.3 453.0 144 .76 106.1 424.8 60 2.52 n.2 573.2 80 1.27 90.9 576.5 60 1.26 n.8 590.7
An important point must be made with regard to the tests in which the exhaust was hosed away. Although this setup resulted in the lowest sound power levels, this type of noise treatment would be very impractical for field use because (1) the hose would be difficult to transport and emplace, (2) an acoustically isolated environment for the hose exhaust would probably not be available, and (3) the presence of the hose causes high back pressure on the exhaust side of the drill motor and reduces pneumatic flow, thereby reducing rotation speed and penetration rate. As shown in table 1, the flow rates achieved for the hose tests were 80 to 90 cfm; however, the flow rates actually desired for these tests were 130 to 150 cfm. In addition, the penetration rates for these tests were among the slowest in the test program. Experience has shown that any noise control measure causing such drastic reductions in performance will not be maintained on the drilling system.
130
120
110
100
90
<t 80 CD 130 "'0
~ w 120 (iJ -.J 110 c:: w 3: 100 0 0-
0 90 z ::J
80 0 en
130
120
110
100
90
Rotation flow approx 80 cfm
Rotation flow approx 100 cfm
Rotation flowapprox 120 -125 cfm
Rotation flow approx 90 cfm
Rotation flow approx 115 cfm
Rotation flow approx 130 cfm
KEY • No muffler • Original muffler o 2d version .. Exhaust hose o Canister
80~~~illL~~~~~~~~~~
I 2 4 8 16 0..125 0.25 0..5 I 2 4 8 16
THIRD OCTAVE CENTER FREQUENCY, kHz
Figure 3.-Comparlson of exhaust muffler performance at various airflows. Points plotted on the ordinate axis are the corresponding overall levels for each test. Scale Is the same.
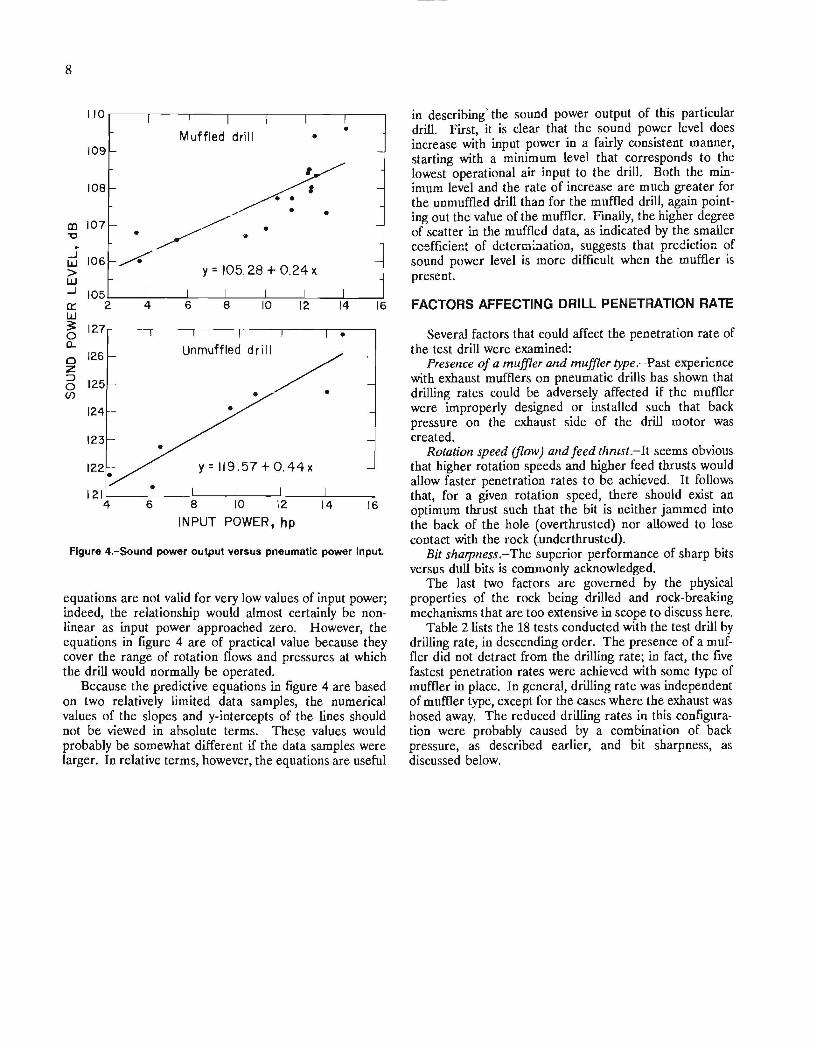
SOUND POWER OUTPUT VERSUS PNEUMATIC POWER INPUT
It is natural to assume that the acoustical energy produced by a mechanical system will increase as more energy is supplied to the system. In the case of the test drill, rotation airflow was the only significant source of power (noise due to hole-flushing water was negligible). Input power was easily obtained by multiplying the rotation flow by the pressure in the rotation line; as mentioned earlier, these data were recorded at 4-s intervals in all tests. Using input power as the independent variable, predictive equations for sound power output were derived. Sound power was obtained by converting the measured sound power levels (decibels re 10.12 W) to watts; however, since the mathematical relationship between input and output power is the same whether sound power or sound power level (in decibels) is used as the dependent variable, sound power level is used as it is the more common unit of reference.
Predictive equations for sound power versus input power were developed for both the unrnuffled drill and the drill equipped with the manufacturer's original muffler. The data used in these analyses are displayed in figure 4. In both cases, attempts were made to fit the data to four types of curves-linear (y = a + bx), logarithmic (y = a + bln(x)), exponential (y = aeb
") , and power (y = ai'). The coefficient of determination for each equation was calculated to assess how well the data fit into the given format, i.e., the larger the coefficient (maximum = 1.0), the better the fit.
For both the muffled and unrnuffled drills, the linear expressions shown in figure 4 yielded the best fits (coefficients of determination of 0.70 and 0.87, respectively). Although the exponential curves resulted in coefficients that were approximately equal to those of the linear curves, the graphs of the exponential equations virtually overlapped the straight lines shown in figure 4. This indicated that the data occurred in an area where the exponential curves were nearly linear. Of course, the
I
8
IIO.----,----.----.----,---,,---.----~
109
108
co 107 "0
~ 106 > w
• Muffled drill •
y = 105.28 + 0.24 x
~ 105~ __ _L ____ L-__ -L __ ~L_ __ ~ __ ~ __ ~ 0:: 2 w
6 8 10 12 14
3 127,----.----.-----.----.----~--__. o • 0-o 126 Z
6 125 (j)
124
123
unmuffled drill/
121L-__ -L ____ ~ ____ ~ __ ~L_ __ ~ ____ ~
16
4 6 8 10 12 14 16 INPUT POWER, hp
Figure 4.-Sound power output versus pneumatic power Input
equations are not valid for very low values of input power; indeed, the relationship would almost certainly be nonlinear as input power approached zero. However, the equations in figure 4 are of practical value because they cover the range of rotation flows and pressures at which the drill would normally be operated.
Because the predictive equations in figure 4 are based on two relatively limited data samples, the numerical values of the slopes and y-intercepts of the lines should not be viewed in absolute terms. These values would probably be somewhat different if the data samples were larger. In relative terms, however, the equations are useful
in describing' the sound power output of this particular drill. First, it is clear that the sound power level does increase with input power in a fairly consistent manner, starting with a minimum level that corresponds to the lowest operational air input to the drill. Both the minimum level and the rate of increase are much greater for the unmuffled drill than for the muffled drill, again pointing out the value of the muffler. Finally, the higher degree of scatter in the muffled data, as indicated by the smaller ccefficiec~ of determ:.aation, suggests that prediction of sound power level is more difficult when the muffler is present.
FACTORS AFFECTING DRILL PENETRATION RATE
Several factors that could affect the penetration rate of the test drill were examined:
Presence of a muffler and muffler type.-Past experience with exhaust mufflers on pneumatic drills has shown that drilling rates could be adversely affected if the muffler were improperly designed or installed such that back pressure on the exhaust side of the drill motor was created.
Rotation speed (flow) and feed thmst.-It seems obvious that higher rotation speeds and higher feed thrusts would allow faster penetration rates to be achieved. It follows that, for a given rotation speed, there should exist an optimum thrust such that the bit is neither jammed into the back of the hole (overthrusted) nor allowed to lose contact with the rock (.underthrusted).
Bit sharpness.-The superior performance of sharp bits versus dull bits is commonly acknowledged.
The last two factors are governed by the physical properties of the rock being drilled and rock-breaking mechanisms that are too extensive in scope to discuss here.
Table 2 lists the 18 tests conducted with the test drill by drilling rate, in descending order. The presence of a muffler did not detract from the drilling rate; in fact, the five fastest penetration rates were achieved with some type of muffler in place. In general, drilling rate was independent of muffler type, except for the cases where the exhaust was hosed away. The reduced drilling rates in this configuration were probably caused by a combination of back pressure, as described earlier, and bit sharpness, as discussed below.
9
Table 2.-Test results listed by drilling rate
Test Drill rate, Muffler type Time, s Sound pm'.'er Rotation Feed thrust, Ibf fpm Start Stop level, dBA flow, cfm
11 6.24 2d version .. 20 48 109.1 116.5 667.5 10 ...... 5.11 Original 24 60 109.6 129.0 636.9 8 ...... . 4.13 Canister ... 20 68 115.9 131.8 639.2 12 ...... 4.00 Original . .. 24 48 107.9 108.0 635.4 13 ...... 3.80 .. do ..... 80 100 107.5 123.1 541.9 3 3.79 None 60 80 125.4 142.8 545.5 6 3.69 .. do ..... 12 48 122.4 72.3 476.5 5 3.60 · . do ..... 12 40 123.4 94.3 472.3 1 3.45 .. do ..... 24 84 127.3 141.6 618.4 9 3.00 2d version .. 30 98 110.3 104.2 889.0 4 2.54 None ..... 12 40 P5.~ 12Q.4 424.7 16 ... . .. 2.02 Original . .. 20 60 106.5 77.2 573.2 2 ... . ... 2.27 None . .... 80 120 125.5 120.7 612.2 7 •••• I •• 2.02 · . do ..... 20 48 121.9 91.4 639.0 17 1.27 Exhaust hose 20 80 104.6 90.9 576.5 18 1.26 .. do ..... 20 60 104.5 77.8 590.7 14 .81 Original ... 16 128 107.4 116.3 453.0 15 .76 · . do ..... 24 144 107.2 106.1 424.8
Table 3.-Test sequences showing effects of bit sharpness, rotation speed, and feed thrust on drilling rate
Test Bit condition Muffler type Time, S Sound power Drill rate, Rotation Feed thrust, (holes drilled) Start Stop level, dBA fpm flow,cfm Ibf
SEQUENCE A 11 ... . New ..... 2d version .. 20 48 109.1 6.24 116.5 667.5 10 I ••• 1 hole .... Original .... 24 60 109.6 5.11 129.0 636.9 8 2 holes Canister ... 20 68 115.9 4.13 131.8 639.2 1 ..... 3 holes None ...... 24 84 127.3 3.45 141.6 618.4 2 ..... 4 holes · . do . .... 80 120 125.5 2.27 120.7 612.2 7 ..... 4 holes · . do . .... 20 48 121.9 ?C1'2 91.4 639.0 17 6 holes Exhaust hose 20 80 104.6 1.27 90.9 576.5 18 5 holes · . do . .... 20 60 104.5 1.26 77.8 590.7
SEQUENCE B
3 Used! .. " None ...... 60 80 125.4 3.79 142.8 545.5 6 do. l do 12 48 122.4 3.69 72.3 476.5 5 · . dO.! . .. do 12 40 123.4 3.60 94.3 472.3 4 · . do. l . .. · . do . .... 12 40 125.2 2.54 120.4 424.7
SEQUENCE C
12 Used! .... Original .... 24 48 107.9 4.00 108.0 635.4 13 · . dO.! do 80 100 107.5 3.80 123.1 541.9 16 · . dO.! · . do . .... 20 60 106.5 2.52 77.2 573.2
SEQUENCE D
9 .... . 2 2d version .. 30 98 Dull ":1" 14 ... . Very d~11 Original .... 16 128 15 .... .. do. · . do . .... 24 144
lBit slightly worn but not dull; number of holes drilled unknown. 2More than 10 holes drilled.
From the test sequences listed in table 3, it appears that bit sharpness was the primary factor affecting drilJ penetration rate, with rotation flow and feed thrust effects becoming apparent where bit sharpness remained approximately the same from test to test. The effect of bit sharpness can be seen most clearly in sequence A. Test 11 began with a sharp, new bit, and the penetration rate for this test was higher than in any other test with this drill. The drilling rate in the next two tests (10 and 8) went down significantly, despite the fact that rotation flows were higher and feed thrusts were approximately equal to those of test 11. The downward trend in penetration rate continued in tests 1, 2, 7, 17, and 18, although the low rates in
110.3 3.00 104.2 889.0 107.4 .81 116.3 453.0 107.2 .76 106.1 424.8
tests 17 and 18 may have been partially due to the back pressure induced by the exhaust hose.
After test 18, the bit was replaced by a different (used) bit that was in somewhat better condition. The drilling rates in sequence B also indicate a downward trend in penetration rate with bit wear, although the effect is not as marked as it was in sequence A. Tests 3 and 4 revealed that feed thrust and rotation speed do have some effect on penetration; the feed thrust and rotation flow were higher in test 3, with a corresponding increase in drilling rate. In fact, the drilling rate during test 3 was slightly higher than in tests 6 and 5, even through the bit was duller. This
10
indicates that feed thrust and rotation speed assume greater importance as the bit becomes dull.
The relative importance of rotation flow and feed thrust in terms of penetration rate could not be determined clearly from the available data. Comparison of tests in sequence C, all run with a slightly worn bit, shows that rotation and thrust must be applied in the proper ratio in order to achieve the maximum possible penetration. For example, test 16 may have been overthrusted for the given rotation speed, and test 13 may have been a bit underthrusted. Test 12 appears to have an optimum rotationto-thrust ratio; however, this ratio may vary, depending on the drilling medium.
Sequence D of table 3 shows how a dull bit can slow the penetration rate substantially. Test 9 was run with the same specified operating parameters as test 11 (the test with the fastest drilling rate) but with a dull bit rather than a sharp one. The drilling rate in test 9 was less than half of the rate in test 11. The higher feed thrust and lower rotation flow of test 9 versus test 11 probably resulted from the drill bit being jammed against the back of the hole. Tests 14 and 15 were run with very dull bits; penetration rates were much lower than those of tests in sequence C, which had similar operatmg parameters but only slightly worn bits.
DISCUSSION OF RESULTS
The laboratory tests of the handheld, pneumatic, rotary drill roof bolter provided the data needed to characterize the noise generated during its operation. The sound power levels produced by the drill with several types of mufflers on the drill exhaust allowed a valid assessment of the noise reduction attained through the use of these mufflers. The relationship between pneumatic power supplied to the drill and sound power output was dermed. Factors affecting the drill penetration rate were analyzed.
When formulating conclusions with regard to the test results presented here, it must be recognized that the number of tests (18) may not be sufficient to define all of the effects of drill operating parameters on noise and performance. On one hand, defining the noise reduction provided by mufflers was relatively simple; only a few tests were necessary to define the reduction provided by a given muffler to within the error limits inherent in the noisemeasuring instrumentation. Conversely, many more tests would have been needed to define a complete matrix yielding the effects of all possible combinations of operating parameters such as the relative importance of bit sharpness, rotation speed, and feed thrust. Such studies, although possible with the available test apparatus, are not consistent with the main goal of the drill test facilities, which is to define the acoustic power of drilling systems under a variety of operational conditions that are representative of those found in actual use. The 18 tests discussed here represent a compromise between the need to characterize the sound power output of a drilling system over a realistic range of operating conditions with the desire to fuUy study the effects of operational parameters on a particular drill.
Given the limitations described above, the following conclusions could be reached with regard to the test drill:
1. Exhaust mufflers reduced the sound power level by 12 to 17 dBA, with the larger reductions occurring at higher rotation speeds. No significant difference in noise reduction was noted between the original and second (denser foam) versions of the muffler. The use of a metal canister muffler (no foam) was less effective, with a sound power level reduction of about 10 dBA.
2. The greatest noise reduction with exhaust mufflers occurred in two distinct frequency ranges-1.0 to 1.6 kHz and 2.0 to 3.0 kHz. These frequency ranges correspond to the frequency at which compressed air pulses are expelled from the drill (1.0 to 1.6 kHz) and the first harmonic of this frequency. This confirmed that air exhaust was indeed the primary noise source on the unmuffled drill and that the mufflers were performing their intended role.
3. The sound power levels produced by the drill increased with increasing pneumatic input power in a fairly consistent manner, starting with a minimum level that corresponded to the lowest operational air input to the drill. Linear regression of the sound power and input power data yielded correlation coefficients of 0.70 to 0.87. Both the minimum level and the rate of increase were much greater for the unmuffled drill than for the muffled drill.
4. Bit sharpness emerged as the factor with the greatest influence on drill penetration rate. Rotation speed and feed thrust appeared to have significant but secondary effects, becoming apparent only under conditions of equivalent bit sharpness. The relative importance of rotation speed and feed thrust in terms of penetration was unclear; during tests, a trial-and-error process had to be used to arrive at the optimum combination to produce the maximum possible drilling rate.
11
REFERENCES
1. Patterson, W. N., G. G. Huggins, and A G. Galai tsis. Noise of Diesel-Powered Underground Mining Equipment: Impact, Prediction, and Control (contract H0346046, Bolt Beranek and Newman, Inc.) . BuMines OFR 58-75, 1975,227 pp.; NIlS PB 243 896.
2. Visnapuu, A , and J. W. Jensen. Noise Reduction of a Pneumatic Rock Drill. BuMines R1 8082, 1975, 23 pp.
3. Summers, C. R , and J. N. Murphy. Noise Abatement of Pneumatic Rock Drill. BuMines R1 7998, 1974,45 pp.
4. George, D. L., and N. J. Matteo. Development of Noise Control Technology for Pneum'\t!c Jumbo Drills (contract H0395029, Ingersoll-Rand Res., Inc.). BuMines OFR 100-81, 1980, 61 pp.; NIlS PB 81-237414.
5. Dixon, N. R , and M. N. Rub in. Development of a Prototype Retrofit Noise Control Treatm~nt for Jumbo Drills (contract H0387006, Bolt Beranek and Newman, rnc.). BuMines OFR 111-83, 1982, 106 pp.; NIlS PB 83-218800.
6. U.S. Mine Safety and Health Administration, Health and Safety Technology Centers, Staff (comp.). Noise Control Abstracts. 1983, 45 pp.
7. Dutta, P. K, and P. W. Runstadler. Development of Commercial Quiet Rock Drills (contract J0177125, Creare Products, Inc.). BuMines OFR 143-84, 1983, 114 pp.; NIlS PB 84--232644.
8. Dutta, P. K , and W. N. Patterson. Development of Noise Control Technology for Jumbo Drills (contract H0395025,
• U S GOVERNMENT PRINTING OFFICE: 611-01 2100.111
Creare Products, Inc.). BuMines OFR 21-86, 1985, 67 pp.; NIlS PB 86-165081.
9. Hawkes, I. , and D. W. Wright. Development of Prototype Quiet Hard Rock Stoper Drill-Volume I (contract H0I13034, Creare Products, Inc.). BuMines OFR 128-85, 1985, 62 pp.; NIlS PB 86-139722.
10. Patterson, W. N. Development of Prototype Quiet Hard Rock Stoper Drill-Volume" (contract H0I13034, Creare Products, Inc.) . BuMines OFR 20-86, 1985,37 pp.; NIlS PB 86-165073.
11. A1joe, W. W., R R Stein, and R C. Bartholomae. Test Apparatus for Measuring Sound Power Levels of Drills. BuMines IC 9166, 1987,35 pp.
12. Harris, C. M. Handbook of Noise Control. McGraw-Hili, 2d ed., 1979, 708 pp.
13. Lord, H. W., W. S. Gately, and H . A Evensen. Noise Control for Engir.eers. l'.'!.cGraw-Hill, 1980,435 pp.
14. Giardino, D. A , and L. C. Marraccini. Noise in the Mining Industry-An Overview. U.S. Dep. Labor, MSHA IR 1129, 1981, 10 pp.
15. Hawkes, I., D. D. Wright, and P. K Dutta. Development of a Quiet Rock Drill . Volume 2: Sources of Drill Rod Noise (contract JOI55099, Ivor Hawkes Associates). BuMines OPR 132-78, 1977, 77 pp.; NIlS PB 289 716.
INT-BU.OF MINES,PGH.,PA 28986


![Universal handheld - Pneumatic & electric automation ... handheld type CPX−MMI−1 Commissioning and diagnosing CPXterminals Universal handheld Manual 534 825 en 0305NH [668 828]](https://img.pdfslide.net/doc/110x75/5aae259e7f8b9a59478bacf8/universal-handheld-pneumatic-electric-automation-handheld-type-cpxmmi1.jpg)