Embed Size (px)
Citation preview
International Journal of Science and Research (IJSR) ISSN (Online): 2319-7064
Index Copernicus Value (2013): 6.14 | Impact Factor (2013): 4.438
Volume 4 Issue 6, June 2015
www.ijsr.net Licensed Under Creative Commons Attribution CC BY
Non-Conventional Energy Sources in Agriculture in
Haryana (India)
Roop Raj1, Dr. Surendar Kumar Gupta
2
1Department of Economics, Jodhpur National University, Jodhpur, Rajasthan (India)
2Maharaja Agrasen Institute of Management and Technology, Jagadhari (Haryana), India
Abstract: The agriculture of India has undergone a dramatic transformation since independence due to the introduction of modern
scientific inputs. Having achieved self-sufficiency in food production at aggregate level, agriculture is now required to diversify the
fields of production for income generation, employment expansion, poverty alleviation and export promotion. Haryana State has the
prime position of being one of the major contributors to the central food-grain pool of India. The increased use of energy builds up the
productive capacity of agriculture and is the main sources of sustained agricultural growth. The structure of energy consumption in
agriculture in Haryana has changed substantially, with a huge shift from animal and human labour towards tractors for farming
operation and electricity and diesel used for groundwater irrigation. But the temporal use of different sources of energy inputs in
agricultural production has to be empirically analyzed and inferences drawn so as to develop future strategies to create conditions for
sustainable pattern of development. The overall performance of energy use from non conventional sources in Haryan’s agriculture has
been spectacular. The changes in the number of tractors and Tubewells & pumping sets, power consumption, pesticides and fertilizers
are depicted. the use of fertilizers has increased tremendously. The Herfindahle indices of Tractors, tubewells, pumping sets, power
consumption, pesticides and fertilizers have been increased to 5563.93, 2913.18, 9120.65, 1483.51 and 10699.39 respectively in 2011-12.
Keywords: Energy sources, agriculture, Haryana, fertilizers, pesticides, power consumption
1. Introduction
Energy is a vital input for social and economic development
(Wijarso 1983). As a result of the generalization of
agricultural, industrial and domestic activities, the demand
for energy has increased remarkably, especially in emergent
countries (Khoshoo 2007). However, most of the world's
energy sources are derived from conventional sources-fossil
fuels such as coal, oil, and natural gases (Mishra et al. 1995).
These fuels are often termed non-renewable or conventional
energy sources. Although, the available quantity of these
fuels are extremely large, they are nevertheless finite and so
will in principle 'run out' at some time in the future (Rani et
al. 2009). In the quest to sustain galloping economic activity,
the dependence on coal and oil has soared at a phenomenal
rate over the years. The problem will be compounded due to
fast depletion of fossil fuel deposits, quality of fuels, heavy
price to be paid for basic materials plus their transportation
cost and above all the environmental degradation caused by
the use of conventional energy sources (Tomer and Kapoor
1998). Under such conditions, environment friendly and
pollution-free, non-conventional and renewable energy
sources known as 'clean and green energy' have emerged as
important alternatives to conventional energy sources
(Kumar et al. 1985, Vanita 2012). The renewable energy
sources are clean and inexhaustible as they rely on sun, wind,
water, biomass, etc., as primary sources of energy.
Renewable energy sources are essentially flows of energy,
whereas the fossil and nuclear fuels are, in essence, stocks of
energy (Gangwar 1998, Gupta et al. 1980).
Adequate capital investments and intensive research and
development must be undertaken to provide adequate future
energy for the future generations of Asian countries
(Vidyanathan 1980, Singh and Singh 1991). Efforts are in
progress for creating awareness among the people for use of
non-conventional energy resources even in the country like
Indonesia where oil is abundant and heavily subsidized
keeping in mind environmental sustainability (Chand et al.
2007, Go 2010). Seventy percent of India’s population lives
in its rural areas distributed over 580,000 villages.
Obviously, a substantial portion of the total energy demand
in the country is in rural sector (Gupta and Singh 1996). In
the absence of conventional energy supply the rural economy
lacked adequate growth. For rural areas, energy planning
involves use of a mix of locally available renewable
resources with some conventional resources to meet the
energy needs of the population.
The agriculture of India has undergone a dramatic
transformation since independence. This significant
development was due to the introduction of modern scientific
inputs and the use of high yielding variety seeds (HYVs),
controlled irrigation, chemical fertilizers, plant protection
chemicals (insecticides and pesticides) and mechanical
power in tested management packages (Kumar et al. 1985).
Agricultural development can be measured by looking up at
the increased production year after year and infrastructure
development can be analyzed with the facilities associated
with it. So, the increase in number of tube-wells, tractors,
fertilizers and pesticides can be a good parameter to measure
the development in agriculture (Dendukuri and Mittal 1993).
Haryana state has the prime position of being one of the
major contributors to the central food-grain pool of India
(Pandey et al. 1981, Sardana et al. 1997). This paper
describes in brief about these non-conventional energy
sources and their usage in agriculture in Haryana (India).
Paper ID: SUB155918 2665
International Journal of Science and Research (IJSR) ISSN (Online): 2319-7064
Index Copernicus Value (2013): 6.14 | Impact Factor (2013): 4.438
Volume 4 Issue 6, June 2015
www.ijsr.net Licensed Under Creative Commons Attribution CC BY
2. Materials and Methods
2.1 Study Area
Haryana is one of the smallest States and also, agriculturally
dominant northern state of India situated between 27o37’ to
30o35’ Latitude and between 74
o28’ to 77
o 36’ Longitude,
covering an area of about 44,212 km2. It occupies 1.35% of
the total geographical area of the country having 17th
position in area (having 4.4 million hectares of land) among
28 states. The cropping intensity in the state is more than 180
percent, which indicates that the state has cropping intensity
higher than the national average.
2.2 Data Collection
The inferences drawn from this study are based on secondary
data collected from various issues of statistical abstracts of
Haryana, published by the Directorate of Economics and
Statistics, Government of Haryana and the Agricultural
Statistics at a glance, published by Ministry of Agriculture,
Government of India.
Figure 1: Map of India showing location of Haryana State
3. Results and Discussion
Notwithstanding significant progress in manufacturing and
service sectors, agriculture sector continues to play a major
role in the State economy contributing about 14.5 percent to
its Gross Domestic Product (GDP) as well as providing
employment to 51 percent of the work force (Vidyanathan
1980). Even in case of industrial employment, agriculture
based industries account for more than 31 percent.
The overall performance of energy use from non
conventional sources in Haryana’s agriculture (Rani et al.
2009, Tomer and Kapoor 1998) has been spectacular. The
changes in the number of tractors and Tubewells and
pumping sets, power consumption, pesticides and fertilizers
are depicted in the Table no. 1.
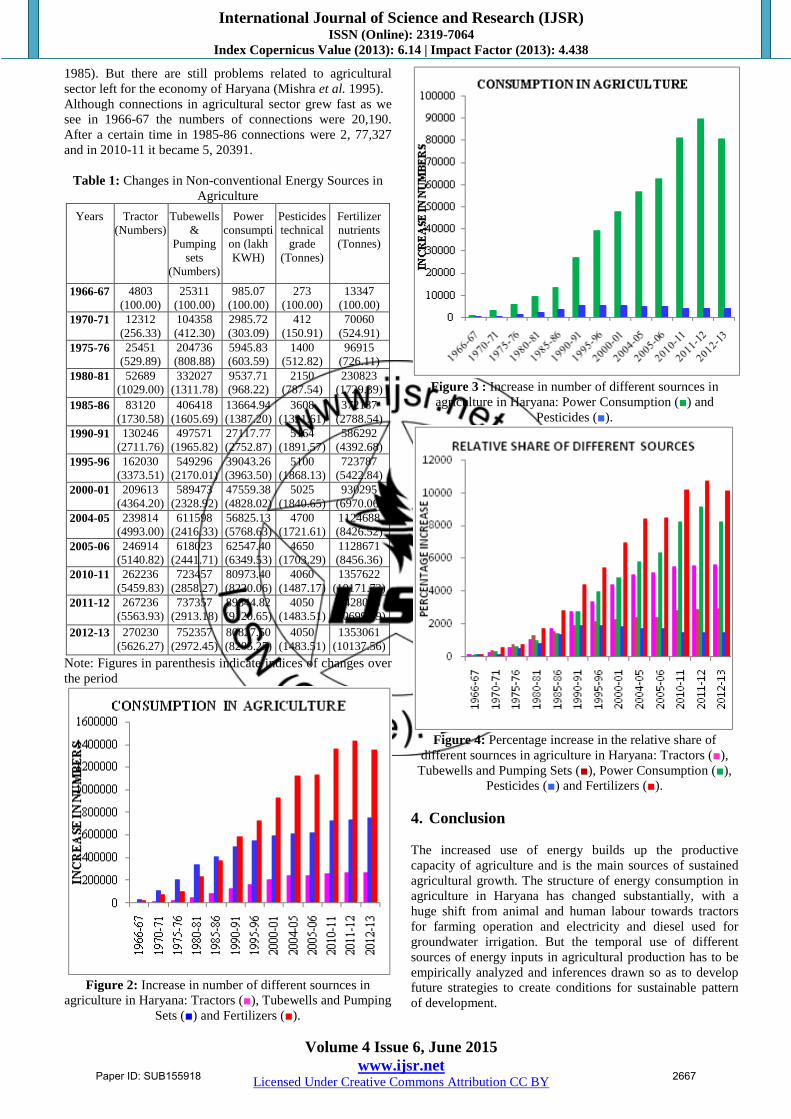
In this table, it is shown that the number of tractors in
Haryana in 1966-67 was 4803 which was raised to 2.7 lakh
in 2012-13 (Vanita 2012). The number of pumping sets and
tubewells was 25311 in 1966-67 which increased
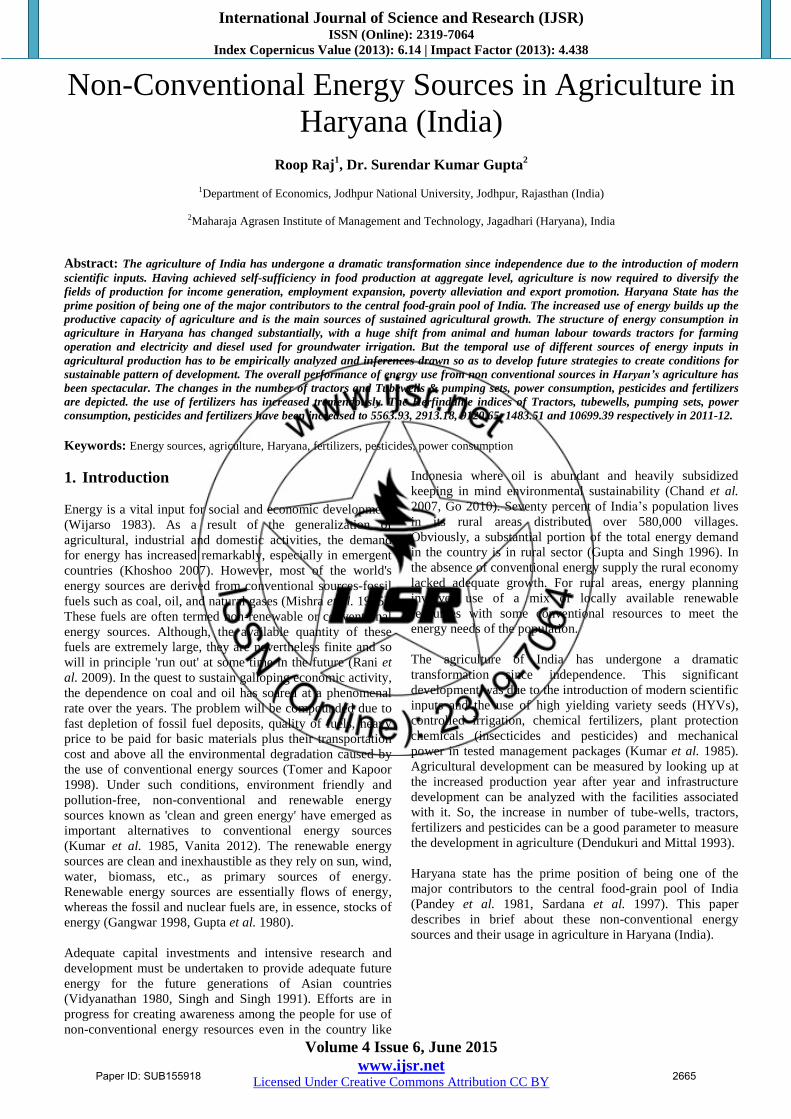
tremendously in 2012-13 to 752357. Similarly, the power
(electricity) consumption in the agricultural sector was
985.07 lakh KWH in 1966-67 (Vanita 2012) and it was
reported to be 80827.50 lakh KWH in 2012-13 increasing
continuously (Table no.1, Fig. No. 2,3). The use of pesticides
in technical grade was 273 tonnes in 1966-67 and in 2012-13
it was 4050 tonnes which shows a fluctuation in its use by
the farmers. The use of pesticides first increased up to 1990-
91, but in recent years, their use is restricted to a limit, which
shows that pesticides have harmful effects also on agriculture
system. The fertilizers (nutrients) were consumed
tremendously as 13347 tonnes in 1966-67 and increased to
1428048 tonnes in 2011-12, but it also decreased on a value
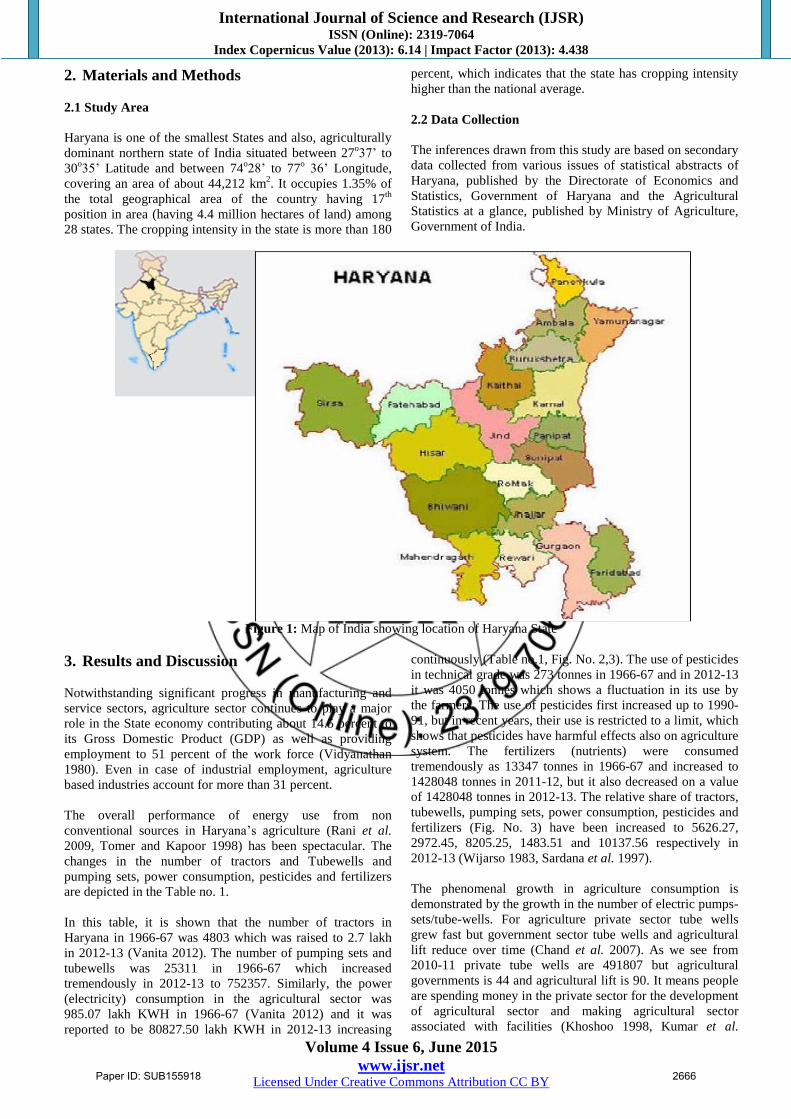
of 1428048 tonnes in 2012-13. The relative share of tractors,
tubewells, pumping sets, power consumption, pesticides and
fertilizers (Fig. No. 3) have been increased to 5626.27,
2972.45, 8205.25, 1483.51 and 10137.56 respectively in
2012-13 (Wijarso 1983, Sardana et al. 1997).
The phenomenal growth in agriculture consumption is
demonstrated by the growth in the number of electric pumps-
sets/tube-wells. For agriculture private sector tube wells
grew fast but government sector tube wells and agricultural
lift reduce over time (Chand et al. 2007). As we see from
2010-11 private tube wells are 491807 but agricultural
governments is 44 and agricultural lift is 90. It means people
are spending money in the private sector for the development
of agricultural sector and making agricultural sector
associated with facilities (Khoshoo 1998, Kumar et al.
Paper ID: SUB155918 2666
International Journal of Science and Research (IJSR) ISSN (Online): 2319-7064
Index Copernicus Value (2013): 6.14 | Impact Factor (2013): 4.438
Volume 4 Issue 6, June 2015
www.ijsr.net Licensed Under Creative Commons Attribution CC BY
1985). But there are still problems related to agricultural
sector left for the economy of Haryana (Mishra et al. 1995).
Although connections in agricultural sector grew fast as we
see in 1966-67 the numbers of connections were 20,190.
After a certain time in 1985-86 connections were 2, 77,327
and in 2010-11 it became 5, 20391.
Table 1: Changes in Non-conventional Energy Sources in
Agriculture
Years Tractor
(Numbers)
Tubewells
&
Pumping
sets
(Numbers)
Power
consumpti
on (lakh
KWH)
Pesticides
technical
grade
(Tonnes)
Fertilizer
nutrients
(Tonnes)
1966-67 4803
(100.00)
25311
(100.00)
985.07
(100.00)
273
(100.00)
13347
(100.00)
1970-71 12312
(256.33)
104358
(412.30)
2985.72
(303.09)
412
(150.91)
70060
(524.91)
1975-76 25451
(529.89)
204736
(808.88)
5945.83
(603.59)
1400
(512.82)
96915
(726.11)
1980-81 52689
(1029.00)
332027
(1311.78)
9537.71
(968.22)
2150
(787.54)
230823
(1729.39)
1985-86 83120
(1730.58)
406418
(1605.69)
13664.94
(1387.20)
3608
(1321.61)
372187
(2788.54)
1990-91 130246
(2711.76)
497571
(1965.82)
27117.77
(2752.87)
5164
(1891.57)
586292
(4392.68)
1995-96 162030
(3373.51)
549296
(2170.01)
39043.26
(3963.50)
5100
(1868.13)
723787
(5422.84)
2000-01 209613
(4364.20)
589473
(2328.92)
47559.38
(4828.02)
5025
(1840.65)
930295
(6970.06)
2004-05 239814
(4993.00)
611598
(2416.33)
56825.13
(5768.63)
4700
(1721.61)
1124688
(8426.52)
2005-06 246914
(5140.82)
618023
(2441.71)
62547.40
(6349.53)
4650
(1703.29)
1128671
(8456.36)
2010-11 262236
(5459.83)
723457
(2858.27)
80973.40
(8220.06)
4060
(1487.17)
1357622
(10171.73)
2011-12 267236
(5563.93)
737357
(2913.18)
89844.82
(9120.65)
4050
(1483.51)
1428048
(10699.39)
2012-13 270230
(5626.27)
752357
(2972.45)
80827.50
(8205.25)
4050
(1483.51)
1353061
(10137.56)
Note: Figures in parenthesis indicate indices of changes over
the period
Figure 2: Increase in number of different sournces in
agriculture in Haryana: Tractors (■), Tubewells and Pumping
Sets (■) and Fertilizers (■).
Figure 3 : Increase in number of different sournces in
agriculture in Haryana: Power Consumption (■) and
Pesticides (■).
Figure 4: Percentage increase in the relative share of
different sournces in agriculture in Haryana: Tractors (■),
Tubewells and Pumping Sets (■), Power Consumption (■),
Pesticides (■) and Fertilizers (■).
4. Conclusion
The increased use of energy builds up the productive
capacity of agriculture and is the main sources of sustained
agricultural growth. The structure of energy consumption in
agriculture in Haryana has changed substantially, with a
huge shift from animal and human labour towards tractors
for farming operation and electricity and diesel used for
groundwater irrigation. But the temporal use of different
sources of energy inputs in agricultural production has to be
empirically analyzed and inferences drawn so as to develop
future strategies to create conditions for sustainable pattern
of development.
Paper ID: SUB155918 2667
International Journal of Science and Research (IJSR) ISSN (Online): 2319-7064
Index Copernicus Value (2013): 6.14 | Impact Factor (2013): 4.438
Volume 4 Issue 6, June 2015
www.ijsr.net Licensed Under Creative Commons Attribution CC BY
References
[1] Chand, R., Raju, S.S. and Pandey, L.M. (2007) Growth
crisis in agriculture: Severity and options at national
and state level. Economic and Political Weekly, 42
(26): 2528-2533.
[2] Dendukuri, G. and Mittal, J.P. (1993) Household
energy needs of a village in the Rayalaseema area of
Andhra Pradesh, India. Energy Conservation and
Management, 34(12): 1273–86.
[3] Gangwar, A.C. (1998) Trends and determinants of
energy use in Haryana. Indian Journal of Agriculture
Economics, 53(2): 293.
[4] Go, I. (2010) Agricultural Statistics at a Glance 2010
and previous issues. Directorate of Economics and
Statistics, Ministry of Agriculture, Govt. of India, New
Delhi.
[5] Gupta, C.L., Rao, U.K. and Vasudevaraju, V.A. (1980)
Domestic energy consumption in India (Pondicherry
region). Energy, 5(12): 1213–22.
[6] Gupta, D.D. and Singh, D. (1996) Diversification of
cropping and production pattern in Haryana. Indian
Journal of Agriculture Economics, 51(4): 304-309.
[7] Khoshoo, T.N. (1998) Sustaining development in the
developing countries. Current Science, 75: 652-660.
[8] Kumar, S.T., Vasudevan, P. and Patwardhan, S.V.
(1985) Pattern of non conventional energy
consumption and availability in the Indian domestic
sector- a case study. Agricultural Wastes, 12(1): 55–60.
[9] Mishra, M.K., Sahu, N.C., Rao, G.B. and Nisanka, S.K.
(1995) Domestic fuel energy consumption in an Indian
urban ecosystem. Biomass Bioenergy, 9(6): 473–486.
[10] Pandey, U.K., Suhag, K.S. and Sharma, V. (1981)
District wise structural changes in Haryana’s
agriculture. Indian Journal of Agriculture Economics,
36(4): 187.
[11] Rani D., Singh, V., Dahiya, R.P. and Kumar, A. (2009)
Energy consumption pattern of a decentralized
community in northern Haryana. Renewable and
Sustainable Energy Reviews, 13: 194-200.
[12] Sardana, P.K., Manocha, V. and Gangwar, A.C. (1997)
Growth and variation in agricultural performance in
Haryana. Indian Journal of Agriculture Economics,
52(2): 387-392.
[13] Singh, V.K. and Singh, H. (1991) Post green-revolution
changes in the production pattern in Haryana
agriculture. Indian Journal of Agriculture Economics,
46 (5): 481.
[14] Statistical Abstract of Haryana, 2012-13.
[15] Tomer, B.S. and Kapoor, K. (1998) Farm energy use in
Haryana. Indian Journal of Agriculture Economics,
53(2): 291.
[16] Vanita (2012) Rural electrification: a case study
haryana. Academica, 2 (4): 207-216.
[17] Vidyanathan, A. (1980) An analysis of agricultural
growth. Journal of Indian Society of Agricultural
Statistics, 32(1): 1-22.
[18] Wijarso (1983) Energy conservation measures in
Indonesia. Energy, 8(1-2): 93–6.
Paper ID: SUB155918 2668