Embed Size (px)
Citation preview

Available online at www.sciencedirect.com
Biomaterials 29 (2008) 2359e2369www.elsevier.com/locate/biomaterials
Non-invasive optical characterization of biomaterial mineralization
Sharad Gupta a, Martin Hunter a, Peggy Cebe b, Jonathan M. Levitt a,David L. Kaplan a, Irene Georgakoudi a,*
a Department of Biomedical Engineering, Tufts University, 4 Colby Street, Medford, MA 02155, USAb Department of Physics and Astronomy, Tufts University, 4 Colby Street, Medford, MA 02155, USA
Received 19 December 2007; accepted 28 January 2008
Available online 3 March 2008
Abstract
Current approaches to study biomaterial mineralization are invasive and prevent dynamic characterization of this process within the samesample. Polarized light scattering spectroscopy (LSS) may offer a non-invasive alternative for assessing the levels of mineralization as wellas some aspects of the organization of the mineral deposits. Specifically, we used LSS to characterize the formation of hydroxyapatite depositson three types of silk films (water-annealed, methanol-treated and polyaspartic acid (PAA)-mixed) following 1, 3, 5 and 7 cycles of minerali-zation. We found that the total light scattering intensity provided a quantitative measure of the degree of mineralization as confirmed by thermalgravimetric analysis (TGA). The PAA-mixed silk films yielded the highest level of mineral deposition and the water-annealed ones the least,consistent with the b sheet content of the films prior to the onset of mineralization. The wavelength dependence of the singly backscattered lightwas consistent with a self-affine fractal morphology of the deposited films within scales in the range of 150e300 nm; this was confirmed byFourier analysis of scanning electron microscopy (SEM) images of the corresponding films. The deposits of minerals in the water-annealed filmswere predominantly flake-like, with positively correlated density fluctuations (Hurst parameter, H> 0.5), whereas methanol-treated and PAA-mixed silk films resulted in densely-packed, bulk mineral deposits with negatively correlated density fluctuations (H< 0.5). Therefore, LSScould serve as a valuable tool for understanding the role of biomaterial properties in mineral formation, and, ultimately, for optimizing bioma-terial designs that yield mineral deposits with the desired organization.� 2008 Elsevier Ltd. All rights reserved.
Keywords: Silk; Fibroin; Tissue engineering; Polarization; Light scattering
1. Introduction
Nature synthesizes hierarchical, self-assembled, organic/biomineral complex composites under ambient conditionswith superior mechanical properties. These composite sys-tems provide a rich ground for insight into mechanisms ofbiomineralization and novel material design [1]. In general,biomineralization can be divided in two categories: biologi-cally induced mineralization, in which an organism modifiesits local microenvironment to establish conditions suitablefor the chemical precipitation of extracellular mineralphases, or boundary organized biomineralization, in which
* Corresponding author. Fax: þ1 617 627 3231.
E-mail address: [email protected] (I. Georgakoudi).
0142-9612/$ - see front matter � 2008 Elsevier Ltd. All rights reserved.
doi:10.1016/j.biomaterials.2008.01.034
inorganic particles are grown within or on a matrix generatedby an organism [2,3]. The biological substances which pro-duce biologically induced mineralization do not strictly con-trol the crystallization process, resulting in mineral particleswithout unique morphology and with a broad particle sizedistribution [4]. In contrast, boundary organized biomineral-ization provides better control over size, morphology andcrystallographic orientation of the mineralized particles [5].The central tenet in the regulation of mineral deposition inbiological systems is that organic matrices control the nucle-ation and growth of the inorganic structure. This control isexerted through the use of organic macromolecules that pro-vide sites of nucleation and dictate crystal orientation andcrystal morphology; however, these events are not wellcharacterized.
2360 S. Gupta et al. / Biomaterials 29 (2008) 2359e2369
A better understanding of the mineralization process andcrystal formation in biocomposites may provide a way to en-gineer new types of high performance materials in laborato-ries. Further, these types of mineralized systems havesignificant relevance and impact in areas of biomaterials andbone repair/regeneration treatments. These biominerals oftenhave nanoscale crystal morphologies at the beginning, buttheir orientation, size and shape change at different stages ofmineralization. Scanning electron microscopy (SEM) hasbeen traditionally used as a characterization technique to studythe detailed surface topography and crystal morphology of themineral deposits [6]. However, SEM is an invasive technique,as are most of the other commonly used methods to study min-eralized samples, such as X-ray diffraction, X-ray photoelec-tron spectroscopy (XPS), and transmission electronmicroscopy (TEM). Therefore, time dependent measurementsat different stages of mineralization on the same sample arenot possible. Fourier transform infrared (FTIR) spectroscopyis a non-invasive technique and has been used for molecularcharacterization of the mineralized samples, but it lacks theability to provide morphological information and its use islimited in samples with high water content. Further, in bio-medical imaging for bone formation, micro computed tomog-raphy or X-ray analysis are most often used to assess bonedensity and mineral distribution. These methods are effectivefor biomaterial and tissue assessments. However, their spatialresolution is insufficient to characterize the detailed mineralmicrostructure, and their sensitivity is not adequate to monitorearly stages of mineralization. These approaches are alsodestructive, thus tissues cannot be monitored on a real timebasis.
Light scattering spectroscopy (LSS) has been used exten-sively in biomedical research to find small scale morphologi-cal changes in human tissues and cells [7e10]. LSS has alsobeen performed in vivo to detect non-invasive changes in nu-clear morphology in pre-cancerous lesions in the esophagus,colon, oral cavity, bladder and the cervix [8e10]. This ap-proach relies on the fact that the intensity of the light scatteredoff the structures that have a different refractive index fromtheir surroundings varies as a function of wavelength and scat-tering angle in a manner that depends on the size, shape andrefractive index of the scatterer. Therefore, we sought to assessthe use of LSS as a non-invasive means to characterize theamount and organization of minerals deposited on silk films.
Silk fibroin is a fibrous protein with high mechanicalstrength and elasticity, which has been used as biomaterialfor scaffolds in tissue engineering to produce bone, ligamentsand skin in-vitro [11e13]. Unlike native silk fibroin, whosestructure includes a high percentage of aligned b sheets anda helices, regenerated silk fibroin adopts a random coil confor-mation in solution and is intrinsically amorphous when formedinto solid materials. A number of processing approaches havebeen developed to enhance formation of b sheet and a-helicaldomains in these materials, in order to influence the solubility,biocompatibility, thermal and mechanical properties of thematerial [14,15]. This can be accomplished by physico-chemical treatment such as application of mechanical forces
(stretching, shearing, rolling, spinning or compressing), ther-mal treatment, and immersion in selected organic solventssuch as methanol, which causes dehydration of the hydratedstructure, leading to crystallization, i.e. higher b sheet content[16e21]. Silk fibroin protein has been used as an organic mac-romolecule to regulate mineralization in silk films [22]. It hasalso been shown that co-processing of the silk with polyas-partic acid leads to an increase in the control and level of min-eral deposits on silk fiber mats [6].
In the present work, we examined the use of LSS asa method to assess the progression of mineralization in threedifferent types of silk films (water-annealed, methanol-treatedand polyaspartic acid (PAA)-mixed) exhibiting different levelsof crystallinity. To gain a better understanding of the origins ofthe LSS signals, we compared the LSS analysis results withstandard thermal techniques and SEM. We demonstrate thatLSS may serve as a useful non-invasive tool to assess notonly the amount, but also the organization of mineral deposits.Further, it is a technique that can be used at early stages ofmineralization, offering early insight in dynamic processes atorganiceinorganic interfaces. As such, it offers a novelapproach that could result in improved monitoring, under-standing and control of biomineralization.
2. Materials and methods
2.1. Silk film preparation
To extract the silk fibroin protein, Bombyx mori silkworm cocoons were
boiled for 30 min in an aqueous solution of 0.02 M Na2CO3 and rinsed thor-
oughly with water to extract the glue-like sericin proteins. The extracted silk
was then dissolved in 9.3 M LiBr solution at 60 �C, yielding a 20% (w/v)
solution. This solution was dialyzed in water using Slide-a-Lyzer dialysis cas-
settes (Pierce, MWCO 3500). The final concentration of aqueous fibroin solu-
tion was 8.0% w/v, which was determined by weighing the remaining solid
after drying. Pure silk films were cast by pouring the silk fibroin solution
into polystyrene petri dishes and allowing them to dry at ambient temperature
in a hood for 2 days. To increase the b sheet content, the films were kept in
a water-filled vacuumed (less than 10�3 mmHg) desiccator for approximately
24 h (water annealed). To further induce b sheet content some films were also
immersed in a 90% methanol solution for about 10 h (methanol-treated). Poly-
aspartic acid (PAA) films were prepared by adding 0.2% PAA in the aqueous
fibroin solution (PAA-mixed). The thickness of all films was approximately
90� 5 mm as assessed using a Leica DMIRE2 microscope equipped with
a spectral confocal TCS SP2 scanner (Wetzlar, Germany).
For each mineralization cycle the films were kept in a 0.2 M CaCl2solution for 20 min and then allowed to dry at room temperature. Subse-
quently, the films were moved to a 0.12 M aqueous Na2HPO4 solution for
20 min [6]. Di-calcium phosphate (CaHPO4) mineral deposits were formed
on the surface of silk fibroin films after each mineralization cycle. Each film
was subject to seven mineralization cycles.
2.2. Light scattering spectroscopy
The LSS system used in this study has been described in detail previously
[23]. Briefly, the set-up acquired the scattering angle- and wavelength-
dependent intensity of light scattered in the backward direction. Light in the
450e700 nm region from a 500 W Xenon lamp was collimated and linearly po-
larized before illuminating the sample at 45� from the surface normal in order
to avoid detecting specular reflections. The backscattered light was detected
through an analyzer that was placed either parallel (Ipar) or perpendicular (Iperp)
to the polarizer. Singly scattered photons maintained their initial polarization,
while multiply scattered photons are depolarized and consist of equal amounts
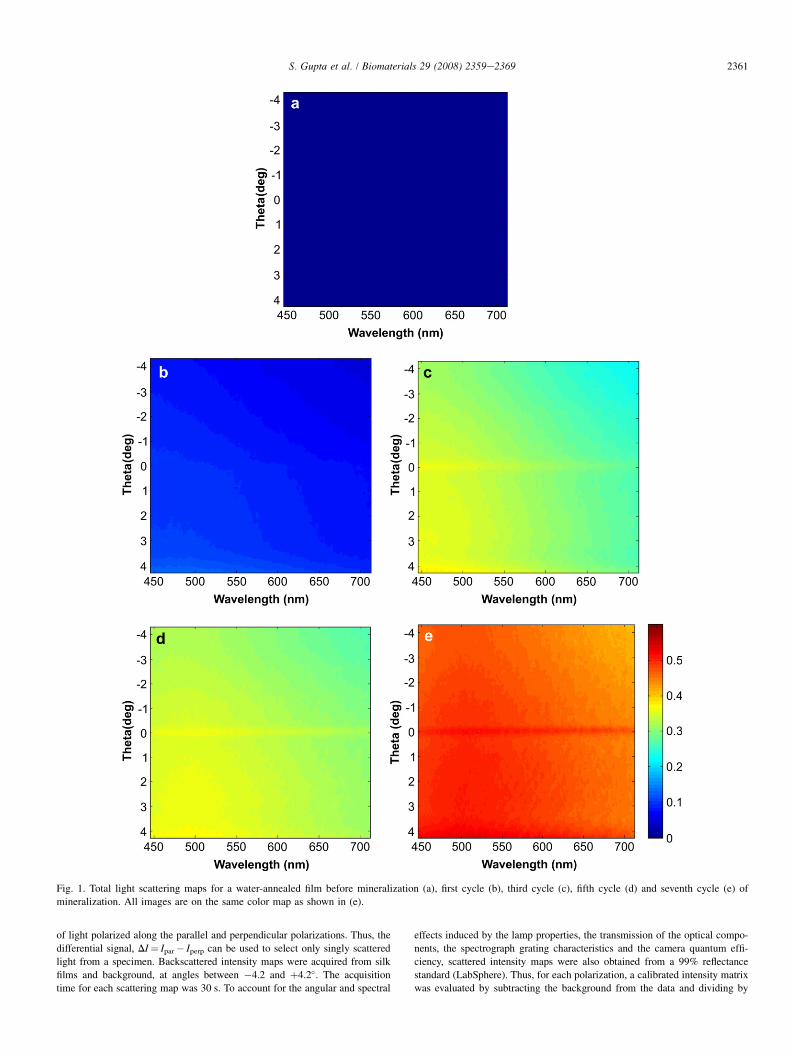
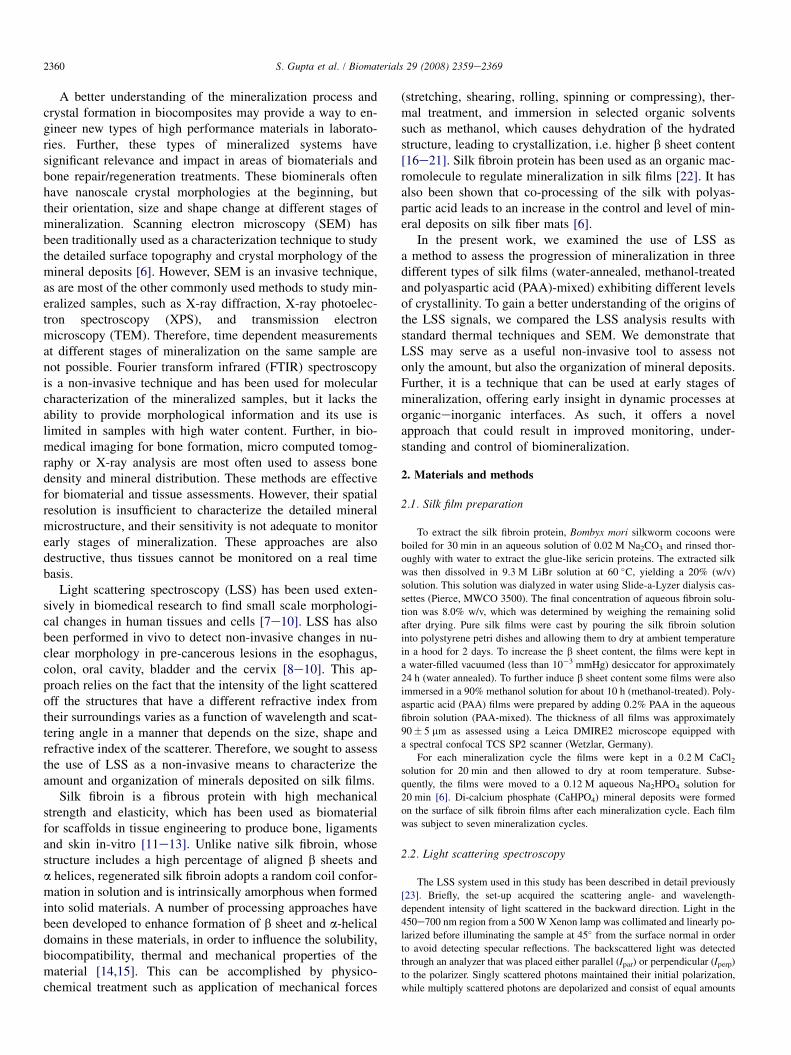
Fig. 1. Total light scattering maps for a water-annealed film before mineralization (a), first cycle (b), third cycle (c), fifth cycle (d) and seventh cycle (e) of
mineralization. All images are on the same color map as shown in (e).
2361S. Gupta et al. / Biomaterials 29 (2008) 2359e2369
of light polarized along the parallel and perpendicular polarizations. Thus, the
differential signal, DI¼ Ipar� Iperp can be used to select only singly scattered
light from a specimen. Backscattered intensity maps were acquired from silk
films and background, at angles between �4.2 and þ4.2�. The acquisition
time for each scattering map was 30 s. To account for the angular and spectral
effects induced by the lamp properties, the transmission of the optical compo-
nents, the spectrograph grating characteristics and the camera quantum effi-
ciency, scattered intensity maps were also obtained from a 99% reflectance
standard (LabSphere). Thus, for each polarization, a calibrated intensity matrix
was evaluated by subtracting the background from the data and dividing by

2362 S. Gupta et al. / Biomaterials 29 (2008) 2359e2369
the reflectance standard map. LSS data were acquired from three films of each
type included in this study.
To analyze the differential (i.e. DI(l)) wavelength-dependent LSS data,
a model described in detail previously [24] assuming self-affine fractal mor-
phology of the scatterers (i.e. mineral deposits) was used. The characteristic
property of a fractal object is scale invariance. In the case of a self-similar frac-
tal, the scale invariance is isotropic (an object appears indistinguishable at
varying scales), whereas self-affinity implies anisotropic scale invariance
i.e., a self-affine fractal function f(x) has a variance, S(x)¼ hjf(xþ a)� f(x)j2i,which scales according to S(bx) f bHS(x), where the Hurst parameter, H, is
limited to the range 0<H< 1 [25]. In self-similar fractals, scale invariance
often results from a highly organized, iterative generative process (e.g., the
progressive branching in fern leaves or human lung architecture). Self-affinity,
on the other hand, is associated with random (or quasi-random) processes [26].
Brownian motion, for example, is a self-affine process: the projection of
a ‘‘drunkard’s walk’’ on any particular spatial axis, as a function of time, is
a self-affine function with a value of H¼ 0.5. Fractional values of H smaller
than, or greater than, H¼ 0.5 imply varying degrees of persistence (positive
correlations), or anti-persistence (negative correlations), superimposed on an
underlying random process.
Self-affine fractal organization has been observed widely in nature [26],
including CT images of trabecular bone [27]. According to the self-affine frac-
tal model we used to analyze the LSS data, the wavelength dependence of the
singly scattered light is described by the expression:
DIðlÞfl�4 1�1þ ð4pL=lÞ2
�a ð1Þ
L is the fractal upper scale (the upper bound of fractal correlation lengths) and
the exponent a is related to the Hurst parameter, H, via:
H ¼ a�DE=2 ð2Þ
where, DE is the Euclidean dimension of the scattering system (i.e., DE¼ 1, 2
or 3 for filamentous, sheet-like or bulk scatterers, respectively) [25]. We note
that Eq. (1) is valid under the Born approximation, which applies to weakly-
scattering systems [24]. We expect this equation to hold for the topmost layer
(few hundred nanometers) of our mineral films, for which the optical path
difference of incident and scattered rays is small despite the high refractive
index of the hydroxyapatite films (n w 1.6) [28].
2.3. Thermal measurements
Fig. 2. Total integrated intensity of water-annealed (- solid square),
MeOH-treated ( solid circles) and PAA-mixed silk films ( solid triangles)
at different cycles of mineralization.
To estimate the b sheet content in the three different types of films, tem-
perature modulated differential scanning calorimetry (TMDSC) was used, as
described previously [29]. Specifically, we employed reversing heat capacity
curves to determine the heat capacity increment, DCp, at the glass transition
temperature, Tg, of each film type. The reversing heat capacity in TMDSC rep-
resents a heat effect that is reversible within the range of the temperature mod-
ulation employed in these measurements. The glass transition temperature is
the temperature that defines the change in the physical properties of amor-
phous materials from a solid-like to a liquid-like phase. Only the mobile frac-
tion of the silk fibroin contributes to the principal glass transition step. Thus,
DCp is directly proportional to the mobile fraction of the silk protein and in-
versely proportional to the rigid fraction of the protein. It has been shown that
over 97% of this rigid fraction consists of crystalline b sheets and the crystal-
line fraction of the silk protein, fc, within a sample examined by TMDSC can
be related to DCp using the expression: DCp¼ 0.475� 0.494� fc [29]. Sam-
ples with weight of about 5e8 mg were placed into aluminum pans and heated
in a TA Instruments 2920 DSC, which was purged with a dry nitrogen gas flow
of 30 mL/min. The instrument was calibrated for empty cell baseline and with
indium for heat flow and temperature. The samples were heated at 4 �C/min
from room temperature to w230 �C, i.e. the degradation temperature of the
fibroin molecule [29], with a modulation period of 60 s and temperature am-
plitude of 0.315 �C. To calculate the specific reversing heat capacity increment
DCp, a tangent was drawn along the specific reversing heat capacity curve
before the glass transition temperature and extrapolated up to 230 �C. The per-
pendicular distance between the heat capacity at 230 �C and this tangent was
defined as DCp.
The mineral content in different films was estimated from thermogravimet-
ric measurements (TGA). TGA is used primarily for determining thermal sta-
bility of polymers. Besides providing information on thermal stability, TGA
may be used to characterize polymers through weight loss of a known entity
and the residual weight of the sample [30,31]. In the case of mineralized
silk films the residual weights were correlated with amount of mineralization
in each film. TGA measurements were performed using a TA 500Q machine.
Samples were heated up to 600 �C with a step of 10 �C/min under an inert
nitrogen atmosphere.
2.4. SEM measurements
A small part of silk film was removed after LSS data acquisition, coated with
gold and examined using a LEO Gemini 982 Field Emission Gun SEM (Thorn-
wood, NY) to assess the morphology of mineral deposits on the films. In order to
characterize quantitatively the organization of mineral deposits as revealed by
10,000� SEM images, Fourier analysis was used. Specifically, we determined
the angularly averaged power spectral density (PSD) as a function of spatial fre-
quency, k, for each image. Our PSD spectra showed inverse power law behavior
at high spectral frequencies, and a consistent tendency to level off (k-indepen-
dence) at low values of k. As described by Schmitt and Kumar [32], this behavior
is characteristic of a self-affine fractal with an upper scale, L, limiting the range
of fractal correlations, and can be described by the following equation:
FðkÞf 1�1þ k2L2
�m ð3Þ
where 1/L is the spatial frequency at which the PSD function transitions from
inverse power law, F(k) f k�d, to k-independence, and the power exponent
d¼ 2m is related to the Hurst parameter via:
H ¼ ðd� 1Þ=2 ð4Þ
Although some of our PSD spectra followed Eq. (3) closely, many exhibited
additional low-frequency components that deviated from Eq. (3). Quantitative
analysis of our SEM images, therefore, was only performed in the inverse power
law (fractal) regime at high spatial frequencies, by fitting to a simple inverse power
law, F(k) f k�d over the range 6 mm�1< k< 22 mm�1. The Hurst parameters
thus obtained were compared to those derived via differential LSS (Eq. (2)).
2.5. Statistical analysis
To assess the level of significance in the differences of parameters charac-
terizing the different types of films we performed a standard two-tailed t-test

2363S. Gupta et al. / Biomaterials 29 (2008) 2359e2369
[33]. The reported correlation coefficients were calculated using a built-in
Matlab function.
3. Results and discussion
3.1. Quantitative assessment of mineralization in silk filmusing light scattering spectroscopy
Wavelength and scattering angle-dependent light scatteringmaps were acquired from water-annealed, methanol-treatedand PAA-mixed silk films prior to and following 1, 3, 5 and7 mineralization cycles. The sum of the maps acquired alongthe parallel and perpendicular polarizations relative to the in-cident light represent the total amount of light backscatteredfrom these films. An example of a set of such maps from a wa-ter-annealed silk film is shown in Fig. 1. Water-annealed and
Fig. 3. (a) Specific reversing heat capacity Cp of MeOH-treated (dot line), water-ann
the heating rate of 4 �C/min. Inset shows the method of DCp calculation for MeOH
treated (dots) and PAA-mixed film (dash) after seventh cycle of mineralization. PAA
(c) Correlation (correlation coefficient of 0.8924) of light scattering intensity and T
films.
methanol-treated films were almost transparent before miner-alization and did not scatter much of the incident light, as ev-ident from the very low intensity of the map shown in Fig. 1a.A significant growth in scattering intensity was observed aftereach cycle of mineralization for all types of films, consistentwith the maps included in Fig. 1bee. This is explicitly shownin Fig. 2, which includes the mean integrated intensity of thelight scattered over the entire detected wavelength and angularrange from three films of each type.
3.2. b sheet assessment of silk films using TMDSC
The light scattered intensity detected from the PAA-mixedfilms is significantly higher than that detected from the water-annealed and methanol-treated films prior to mineralization( p< 0.001). This is consistent with the more hazy appearance
ealed (dash line) and PAA-mixed (solid line) films during TMDSC scanning at
-treated films. (b) TGA thermograms of water-annealed (solid line), MeOH-
-mixed films demonstrate the highest residual weights at higher temperatures.
GA residual weights for water-annealed, MeOH-treated and PAA-mixed silk
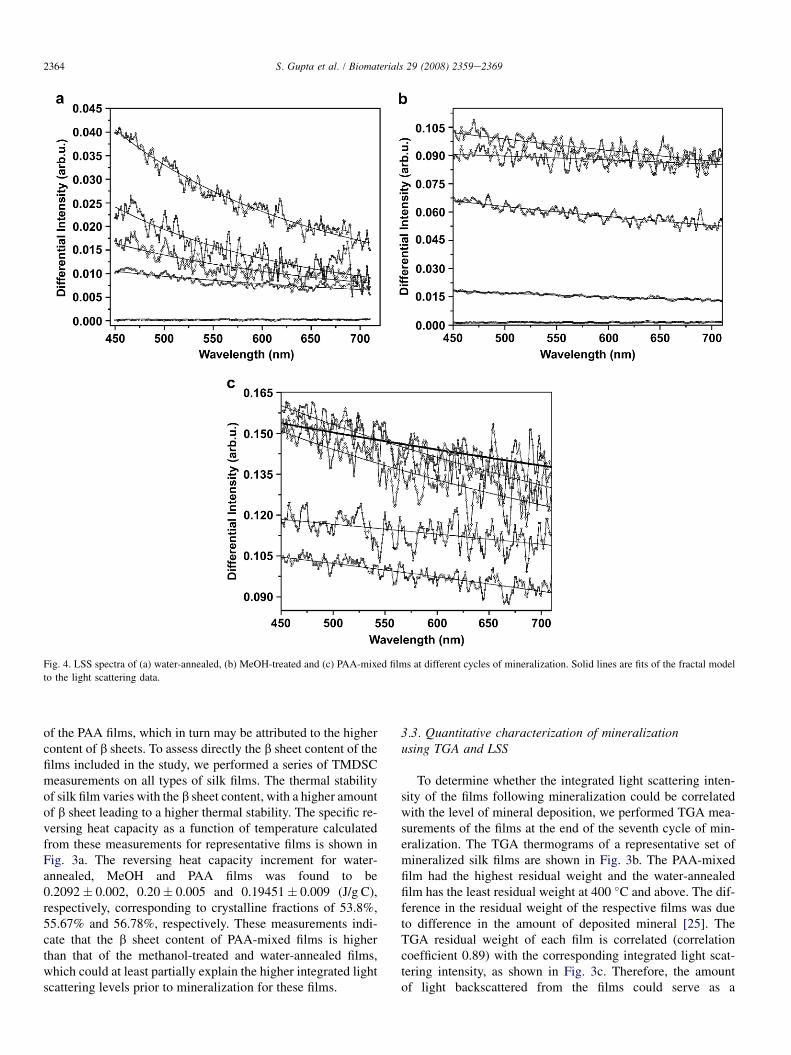
Fig. 4. LSS spectra of (a) water-annealed, (b) MeOH-treated and (c) PAA-mixed films at different cycles of mineralization. Solid lines are fits of the fractal model
to the light scattering data.
2364 S. Gupta et al. / Biomaterials 29 (2008) 2359e2369
of the PAA films, which in turn may be attributed to the highercontent of b sheets. To assess directly the b sheet content of thefilms included in the study, we performed a series of TMDSCmeasurements on all types of silk films. The thermal stabilityof silk film varies with the b sheet content, with a higher amountof b sheet leading to a higher thermal stability. The specific re-versing heat capacity as a function of temperature calculatedfrom these measurements for representative films is shown inFig. 3a. The reversing heat capacity increment for water-annealed, MeOH and PAA films was found to be0.2092� 0.002, 0.20� 0.005 and 0.19451� 0.009 (J/g C),respectively, corresponding to crystalline fractions of 53.8%,55.67% and 56.78%, respectively. These measurements indi-cate that the b sheet content of PAA-mixed films is higherthan that of the methanol-treated and water-annealed films,which could at least partially explain the higher integrated lightscattering levels prior to mineralization for these films.
3.3. Quantitative characterization of mineralizationusing TGA and LSS
To determine whether the integrated light scattering inten-sity of the films following mineralization could be correlatedwith the level of mineral deposition, we performed TGA mea-surements of the films at the end of the seventh cycle of min-eralization. The TGA thermograms of a representative set ofmineralized silk films are shown in Fig. 3b. The PAA-mixedfilm had the highest residual weight and the water-annealedfilm has the least residual weight at 400 �C and above. The dif-ference in the residual weight of the respective films was dueto difference in the amount of deposited mineral [25]. TheTGA residual weight of each film is correlated (correlationcoefficient 0.89) with the corresponding integrated light scat-tering intensity, as shown in Fig. 3c. Therefore, the amountof light backscattered from the films could serve as a
2365S. Gupta et al. / Biomaterials 29 (2008) 2359e2369
non-invasive indicator of the level of mineral deposition. Theaddition of the PAA provides a significant increase in carboxylgroup content, chemistry known to promote nucleation andcrystal growth [6,22]. The TMDSC and TGA measurementsindicate that higher levels of crystallinity yield higher levelsof mineralization. This correlation may reflect the more orderedstructures in more highly crystalline materials, perhaps induc-ing more organization for the serine hydroxyl groups presentin the crystalline domains, as possible sites of mineral nucle-ation. Further, the increased b sheet content may also inducemore organization in the less crystalline domains in the silkstructures as well, altering location of nucleating groups,such as the aspartic and glutamic acid side chains (w3% ofthe total amino acids) containing carboxyl groups, furtheroptimizing locations for nucleation and crystal growth.
3.4. Assessment of mineral deposit organization usingLSS and SEM
The wavelength and angle-dependent features of singlybackscattered light have been used to assess subtle differencesin the organization of sub-cellular organelles that occur duringthe development of pre-cancerous lesions [7e10,34]. As thetechnique relies on the presence of refractive index variations,we sought to determine whether it could also be used to charac-terize the organization of the minerals deposited on the film sur-face, since their refractive index is different from that of air andthe underlying film. To identify the spectral features of the lightthat is scattered in the backward direction after undergoing a sin-gle-scattering event, we subtract the LSS maps acquired alongthe parallel and perpendicular directions of polarization relativeto that of the incident light. The wavelength-dependent featuresof these residually-polarized LSS spectra, DI(l), at q¼ 1� froma representative set of water-annealed, methanol-treated andPAA-mixed films prior to and following 1, 3, 5 and 7 minerali-zation cycles is shown in Fig. 4. We observe that the single-scat-tering intensity of mineralized films decreased with increasing
Fig. 5. Plot of fractal parameters ‘a’ (a) and upper scale ‘L’ (b) f
wavelength in a manner consistent with a self-affine fractalmorphology of the mineral deposits as described by Eq. (1).Fig. 5 summarizes the self-affine fractal parameters a and L ob-tained from analysis of the LSS spectra of the different filmsshown in Fig. 4. Methanol-treated and PAA-mixed filmsshowed similar power exponents (1.75< a< 2.0) and little sen-sitivity to the mineralization cycle. Water-annealed films, on theother hand, showed markedly lower power exponents(0.95< a< 1.7) and a trend towards lower values at highermineralization cycles. For all films, the fractal upper scalevalues were constrained to the range 150 nm< L< 350 nm,indicating the dominant LSS single-scattering signature wasfrom submicron morphological features of these films.
As discussed above, the exponent a contains informationabout the fractal organization of a mineral film (Hurst param-eter, H ) as well as about the dominant film topology (DE).Since H can vary between 0<H< 1, the range of a valuesallowed for each Euclidean dimension is 0.5< a1< 1.5,1.0< a2< 2.0 and 1.5< a3< 2.5 for DE¼ 1, 2 and 3, respec-tively. This suggests that in water-annealed films the dominantfilm topology contributing to LSS spectra, DI(l), was DE¼ 1and/or 2, whereas in methanol-treated and PAA-mixed filmsthe dominant single-scattering contributions arose fromDE¼ 2 and/or 3 features.
For the case of water-annealed films, the ambiguity in filmtopology derived via differential LSS can be removed by vi-sual inspection of the SEM images from these films. A valueof DE¼ 1 would imply the dominant surface morphology tobe composed of a random (or near-random) network of min-eral filaments of submicron diameter and mesh size on theorder of L (180e250 nm in water-annealed films). No suchfeatures were evident in the SEM images of the water-an-nealed films (Fig. 6), even at 30,000� magnification(Fig. 7a), thereby ruling out a filamentous fractal film mor-phology (DE¼ 1). This implies that the differential LSS signalfrom the water-annealed films is dominated by single scatter-ing from sheet-like fragments or flakes in the mineral surface
or water-annealed, MeOH-treated and PAA-mixed silk films.
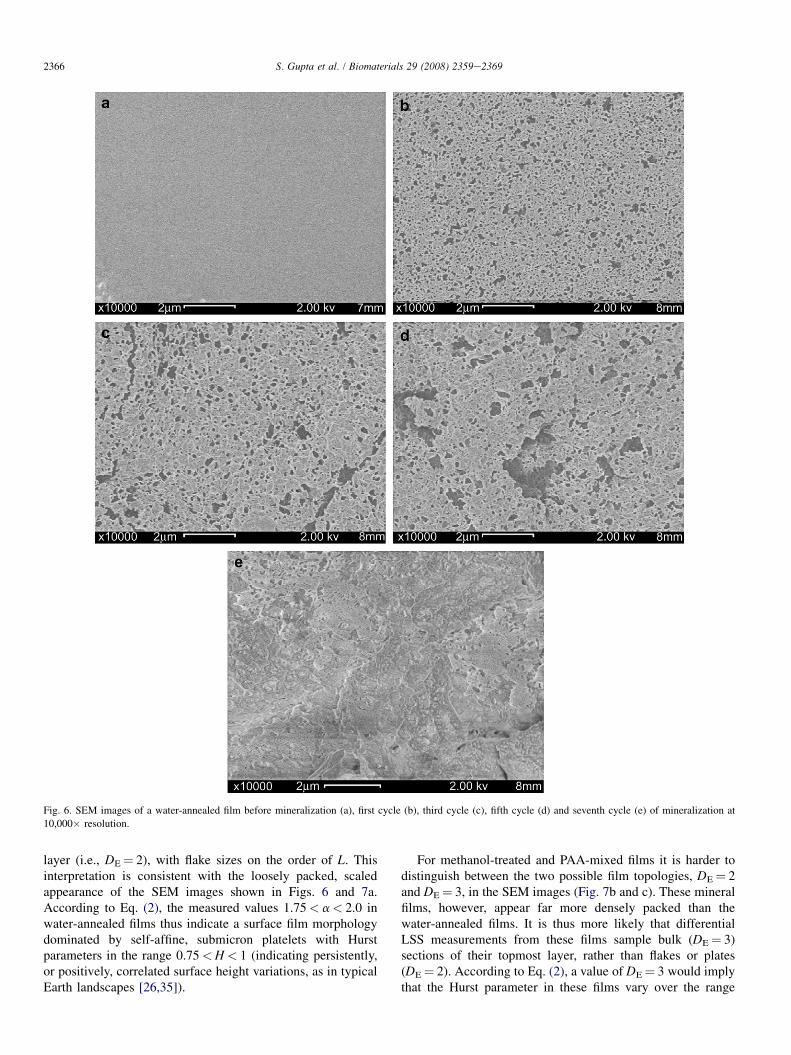
Fig. 6. SEM images of a water-annealed film before mineralization (a), first cycle (b), third cycle (c), fifth cycle (d) and seventh cycle (e) of mineralization at
10,000� resolution.
2366 S. Gupta et al. / Biomaterials 29 (2008) 2359e2369
layer (i.e., DE¼ 2), with flake sizes on the order of L. Thisinterpretation is consistent with the loosely packed, scaledappearance of the SEM images shown in Figs. 6 and 7a.According to Eq. (2), the measured values 1.75< a< 2.0 inwater-annealed films thus indicate a surface film morphologydominated by self-affine, submicron platelets with Hurstparameters in the range 0.75<H< 1 (indicating persistently,or positively, correlated surface height variations, as in typicalEarth landscapes [26,35]).
For methanol-treated and PAA-mixed films it is harder todistinguish between the two possible film topologies, DE¼ 2and DE¼ 3, in the SEM images (Fig. 7b and c). These mineralfilms, however, appear far more densely packed than thewater-annealed films. It is thus more likely that differentialLSS measurements from these films sample bulk (DE¼ 3)sections of their topmost layer, rather than flakes or plates(DE¼ 2). According to Eq. (2), a value of DE¼ 3 would implythat the Hurst parameter in these films vary over the range
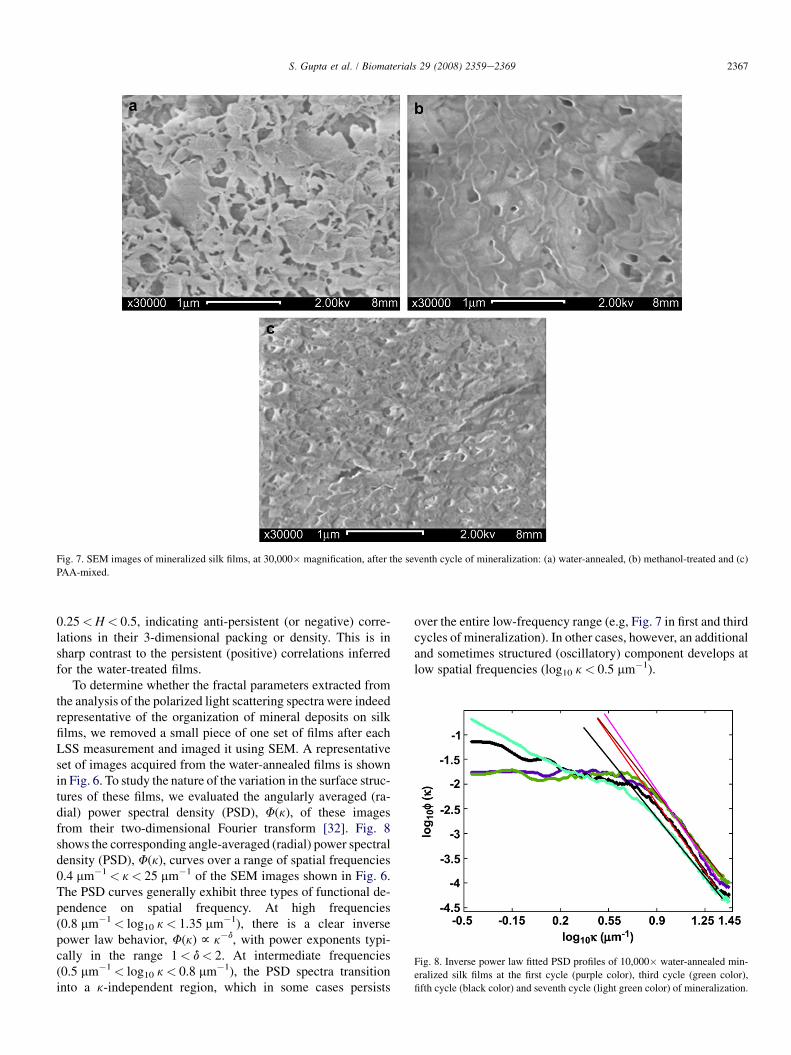
Fig. 7. SEM images of mineralized silk films, at 30,000� magnification, after the seventh cycle of mineralization: (a) water-annealed, (b) methanol-treated and (c)
PAA-mixed.
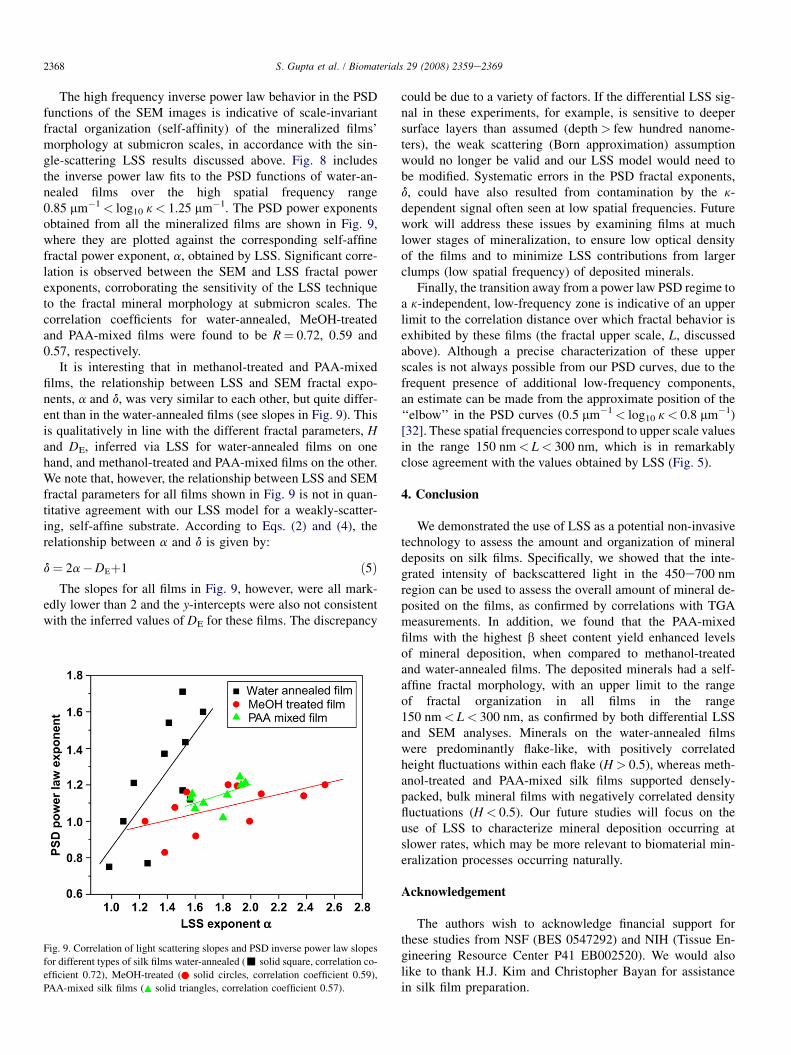
Fig. 8. Inverse power law fitted PSD profiles of 10,000� water-annealed min-
eralized silk films at the first cycle (purple color), third cycle (green color),
fifth cycle (black color) and seventh cycle (light green color) of mineralization.
2367S. Gupta et al. / Biomaterials 29 (2008) 2359e2369
0.25<H< 0.5, indicating anti-persistent (or negative) corre-lations in their 3-dimensional packing or density. This is insharp contrast to the persistent (positive) correlations inferredfor the water-treated films.
To determine whether the fractal parameters extracted fromthe analysis of the polarized light scattering spectra were indeedrepresentative of the organization of mineral deposits on silkfilms, we removed a small piece of one set of films after eachLSS measurement and imaged it using SEM. A representativeset of images acquired from the water-annealed films is shownin Fig. 6. To study the nature of the variation in the surface struc-tures of these films, we evaluated the angularly averaged (ra-dial) power spectral density (PSD), F(k), of these imagesfrom their two-dimensional Fourier transform [32]. Fig. 8shows the corresponding angle-averaged (radial) power spectraldensity (PSD), F(k), curves over a range of spatial frequencies0.4 mm�1< k< 25 mm�1 of the SEM images shown in Fig. 6.The PSD curves generally exhibit three types of functional de-pendence on spatial frequency. At high frequencies(0.8 mm�1< log10 k< 1.35 mm�1), there is a clear inversepower law behavior, F(k) f k�d, with power exponents typi-cally in the range 1< d< 2. At intermediate frequencies(0.5 mm�1< log10 k< 0.8 mm�1), the PSD spectra transitioninto a k-independent region, which in some cases persists
over the entire low-frequency range (e.g, Fig. 7 in first and thirdcycles of mineralization). In other cases, however, an additionaland sometimes structured (oscillatory) component develops atlow spatial frequencies (log10 k< 0.5 mm�1).
2368 S. Gupta et al. / Biomaterials 29 (2008) 2359e2369
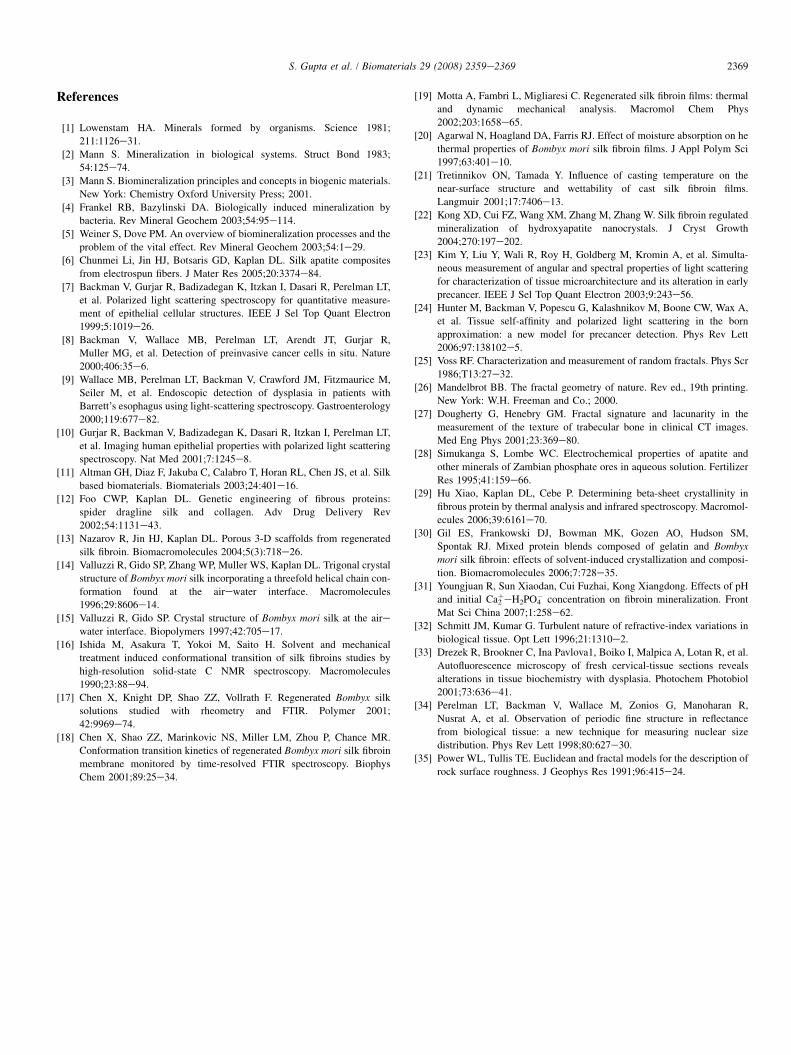
The high frequency inverse power law behavior in the PSDfunctions of the SEM images is indicative of scale-invariantfractal organization (self-affinity) of the mineralized films’morphology at submicron scales, in accordance with the sin-gle-scattering LSS results discussed above. Fig. 8 includesthe inverse power law fits to the PSD functions of water-an-nealed films over the high spatial frequency range0.85 mm�1< log10 k< 1.25 mm�1. The PSD power exponentsobtained from all the mineralized films are shown in Fig. 9,where they are plotted against the corresponding self-affinefractal power exponent, a, obtained by LSS. Significant corre-lation is observed between the SEM and LSS fractal powerexponents, corroborating the sensitivity of the LSS techniqueto the fractal mineral morphology at submicron scales. Thecorrelation coefficients for water-annealed, MeOH-treatedand PAA-mixed films were found to be R¼ 0.72, 0.59 and0.57, respectively.
It is interesting that in methanol-treated and PAA-mixedfilms, the relationship between LSS and SEM fractal expo-nents, a and d, was very similar to each other, but quite differ-ent than in the water-annealed films (see slopes in Fig. 9). Thisis qualitatively in line with the different fractal parameters, Hand DE, inferred via LSS for water-annealed films on onehand, and methanol-treated and PAA-mixed films on the other.We note that, however, the relationship between LSS and SEMfractal parameters for all films shown in Fig. 9 is not in quan-titative agreement with our LSS model for a weakly-scatter-ing, self-affine substrate. According to Eqs. (2) and (4), therelationship between a and d is given by:
d¼ 2a�DEþ1 ð5ÞThe slopes for all films in Fig. 9, however, were all mark-
edly lower than 2 and the y-intercepts were also not consistentwith the inferred values of DE for these films. The discrepancy
Fig. 9. Correlation of light scattering slopes and PSD inverse power law slopes
for different types of silk films water-annealed (- solid square, correlation co-
efficient 0.72), MeOH-treated ( solid circles, correlation coefficient 0.59),
PAA-mixed silk films ( solid triangles, correlation coefficient 0.57).
could be due to a variety of factors. If the differential LSS sig-nal in these experiments, for example, is sensitive to deepersurface layers than assumed (depth> few hundred nanome-ters), the weak scattering (Born approximation) assumptionwould no longer be valid and our LSS model would need tobe modified. Systematic errors in the PSD fractal exponents,d, could have also resulted from contamination by the k-dependent signal often seen at low spatial frequencies. Futurework will address these issues by examining films at muchlower stages of mineralization, to ensure low optical densityof the films and to minimize LSS contributions from largerclumps (low spatial frequency) of deposited minerals.
Finally, the transition away from a power law PSD regime toa k-independent, low-frequency zone is indicative of an upperlimit to the correlation distance over which fractal behavior isexhibited by these films (the fractal upper scale, L, discussedabove). Although a precise characterization of these upperscales is not always possible from our PSD curves, due to thefrequent presence of additional low-frequency components,an estimate can be made from the approximate position of the‘‘elbow’’ in the PSD curves (0.5 mm�1< log10 k< 0.8 mm�1)[32]. These spatial frequencies correspond to upper scale valuesin the range 150 nm< L< 300 nm, which is in remarkablyclose agreement with the values obtained by LSS (Fig. 5).
4. Conclusion
We demonstrated the use of LSS as a potential non-invasivetechnology to assess the amount and organization of mineraldeposits on silk films. Specifically, we showed that the inte-grated intensity of backscattered light in the 450e700 nmregion can be used to assess the overall amount of mineral de-posited on the films, as confirmed by correlations with TGAmeasurements. In addition, we found that the PAA-mixedfilms with the highest b sheet content yield enhanced levelsof mineral deposition, when compared to methanol-treatedand water-annealed films. The deposited minerals had a self-affine fractal morphology, with an upper limit to the rangeof fractal organization in all films in the range150 nm< L< 300 nm, as confirmed by both differential LSSand SEM analyses. Minerals on the water-annealed filmswere predominantly flake-like, with positively correlatedheight fluctuations within each flake (H> 0.5), whereas meth-anol-treated and PAA-mixed silk films supported densely-packed, bulk mineral films with negatively correlated densityfluctuations (H< 0.5). Our future studies will focus on theuse of LSS to characterize mineral deposition occurring atslower rates, which may be more relevant to biomaterial min-eralization processes occurring naturally.
Acknowledgement
The authors wish to acknowledge financial support forthese studies from NSF (BES 0547292) and NIH (Tissue En-gineering Resource Center P41 EB002520). We would alsolike to thank H.J. Kim and Christopher Bayan for assistancein silk film preparation.
2369S. Gupta et al. / Biomaterials 29 (2008) 2359e2369
References
[1] Lowenstam HA. Minerals formed by organisms. Science 1981;
211:1126e31.
[2] Mann S. Mineralization in biological systems. Struct Bond 1983;
54:125e74.
[3] Mann S. Biomineralization principles and concepts in biogenic materials.
New York: Chemistry Oxford University Press; 2001.
[4] Frankel RB, Bazylinski DA. Biologically induced mineralization by
bacteria. Rev Mineral Geochem 2003;54:95e114.
[5] Weiner S, Dove PM. An overview of biomineralization processes and the
problem of the vital effect. Rev Mineral Geochem 2003;54:1e29.
[6] Chunmei Li, Jin HJ, Botsaris GD, Kaplan DL. Silk apatite composites
from electrospun fibers. J Mater Res 2005;20:3374e84.
[7] Backman V, Gurjar R, Badizadegan K, Itzkan I, Dasari R, Perelman LT,
et al. Polarized light scattering spectroscopy for quantitative measure-
ment of epithelial cellular structures. IEEE J Sel Top Quant Electron
1999;5:1019e26.
[8] Backman V, Wallace MB, Perelman LT, Arendt JT, Gurjar R,
Muller MG, et al. Detection of preinvasive cancer cells in situ. Nature
2000;406:35e6.
[9] Wallace MB, Perelman LT, Backman V, Crawford JM, Fitzmaurice M,
Seiler M, et al. Endoscopic detection of dysplasia in patients with
Barrett’s esophagus using light-scattering spectroscopy. Gastroenterology
2000;119:677e82.
[10] Gurjar R, Backman V, Badizadegan K, Dasari R, Itzkan I, Perelman LT,
et al. Imaging human epithelial properties with polarized light scattering
spectroscopy. Nat Med 2001;7:1245e8.
[11] Altman GH, Diaz F, Jakuba C, Calabro T, Horan RL, Chen JS, et al. Silk
based biomaterials. Biomaterials 2003;24:401e16.
[12] Foo CWP, Kaplan DL. Genetic engineering of fibrous proteins:
spider dragline silk and collagen. Adv Drug Delivery Rev
2002;54:1131e43.
[13] Nazarov R, Jin HJ, Kaplan DL. Porous 3-D scaffolds from regenerated
silk fibroin. Biomacromolecules 2004;5(3):718e26.
[14] Valluzzi R, Gido SP, Zhang WP, Muller WS, Kaplan DL. Trigonal crystal
structure of Bombyx mori silk incorporating a threefold helical chain con-
formation found at the airewater interface. Macromolecules
1996;29:8606e14.
[15] Valluzzi R, Gido SP. Crystal structure of Bombyx mori silk at the aire
water interface. Biopolymers 1997;42:705e17.
[16] Ishida M, Asakura T, Yokoi M, Saito H. Solvent and mechanical
treatment induced conformational transition of silk fibroins studies by
high-resolution solid-state C NMR spectroscopy. Macromolecules
1990;23:88e94.
[17] Chen X, Knight DP, Shao ZZ, Vollrath F. Regenerated Bombyx silk
solutions studied with rheometry and FTIR. Polymer 2001;
42:9969e74.
[18] Chen X, Shao ZZ, Marinkovic NS, Miller LM, Zhou P, Chance MR.
Conformation transition kinetics of regenerated Bombyx mori silk fibroin
membrane monitored by time-resolved FTIR spectroscopy. Biophys
Chem 2001;89:25e34.
[19] Motta A, Fambri L, Migliaresi C. Regenerated silk fibroin films: thermal
and dynamic mechanical analysis. Macromol Chem Phys
2002;203:1658e65.
[20] Agarwal N, Hoagland DA, Farris RJ. Effect of moisture absorption on he
thermal properties of Bombyx mori silk fibroin films. J Appl Polym Sci
1997;63:401e10.
[21] Tretinnikov ON, Tamada Y. Influence of casting temperature on the
near-surface structure and wettability of cast silk fibroin films.
Langmuir 2001;17:7406e13.
[22] Kong XD, Cui FZ, Wang XM, Zhang M, Zhang W. Silk fibroin regulated
mineralization of hydroxyapatite nanocrystals. J Cryst Growth
2004;270:197e202.
[23] Kim Y, Liu Y, Wali R, Roy H, Goldberg M, Kromin A, et al. Simulta-
neous measurement of angular and spectral properties of light scattering
for characterization of tissue microarchitecture and its alteration in early
precancer. IEEE J Sel Top Quant Electron 2003;9:243e56.
[24] Hunter M, Backman V, Popescu G, Kalashnikov M, Boone CW, Wax A,
et al. Tissue self-affinity and polarized light scattering in the born
approximation: a new model for precancer detection. Phys Rev Lett
2006;97:138102e5.
[25] Voss RF. Characterization and measurement of random fractals. Phys Scr
1986;T13:27e32.
[26] Mandelbrot BB. The fractal geometry of nature. Rev ed., 19th printing.
New York: W.H. Freeman and Co.; 2000.
[27] Dougherty G, Henebry GM. Fractal signature and lacunarity in the
measurement of the texture of trabecular bone in clinical CT images.
Med Eng Phys 2001;23:369e80.
[28] Simukanga S, Lombe WC. Electrochemical properties of apatite and
other minerals of Zambian phosphate ores in aqueous solution. Fertilizer
Res 1995;41:159e66.
[29] Hu Xiao, Kaplan DL, Cebe P. Determining beta-sheet crystallinity in
fibrous protein by thermal analysis and infrared spectroscopy. Macromol-
ecules 2006;39:6161e70.
[30] Gil ES, Frankowski DJ, Bowman MK, Gozen AO, Hudson SM,
Spontak RJ. Mixed protein blends composed of gelatin and Bombyx
mori silk fibroin: effects of solvent-induced crystallization and composi-
tion. Biomacromolecules 2006;7:728e35.
[31] Youngjuan R, Sun Xiaodan, Cui Fuzhai, Kong Xiangdong. Effects of pH
and initial Ca2þeH2PO4
� concentration on fibroin mineralization. Front
Mat Sci China 2007;1:258e62.
[32] Schmitt JM, Kumar G. Turbulent nature of refractive-index variations in
biological tissue. Opt Lett 1996;21:1310e2.
[33] Drezek R, Brookner C, Ina Pavlova1, Boiko I, Malpica A, Lotan R, et al.
Autofluorescence microscopy of fresh cervical-tissue sections reveals
alterations in tissue biochemistry with dysplasia. Photochem Photobiol
2001;73:636e41.
[34] Perelman LT, Backman V, Wallace M, Zonios G, Manoharan R,
Nusrat A, et al. Observation of periodic fine structure in reflectance
from biological tissue: a new technique for measuring nuclear size
distribution. Phys Rev Lett 1998;80:627e30.
[35] Power WL, Tullis TE. Euclidean and fractal models for the description of
rock surface roughness. J Geophys Res 1991;96:415e24.