Embed Size (px)
Citation preview
Non-union Employee Compensation
City of Toronto: Toronto Public Service(excludes Agencies, Boards and Commissions)
Employee & Labour Relations Committee: June 5, 2012
Joseph P. Pennachetti Bruce L. Anderson Barbara Shulman
City Manager Executive Director, Director,
Human Resources Strategic Recruitment,
Compensation &
Employment Services
Why Now?
February 2011, City Council requested that "the City Manager review the Non-Union
Compensation Policy and report to City Council, by the end of 2011, providing any
such best practices recommendations to ensure a modern, affordable and
competitive compensation policy and program is in place for 2012 and beyond; and
including in the report any recommendations regarding the re-earnable
performance-based lump-sum payments for non-union employees who have
reached their respective maximum salary (job rate) for 2011.“
Such report was deferred until post 2012 collective bargaining negotiations
The Hay Group, through an RFP process, was contracted to provide consultation services
on compensation best practice. The Hay Group is a global human resources
management consulting firm providing services for private, public and not-for-profit public
sector employers world-wide.2
Background Information
Non-Union Employee Compensation: Council Approved Pay Policy
Non-union positions maximum salary (job rate) shall be set at the 75th percentile of
the broader public sector GTA marketplace. This percentile level was approved by
Council to:
i. Reflect the complexity of the City's organization, scope and size
ii. Ensure the City is a competitive employer relative to other comparable public
sector employers in the GTA
The 75th percentile means that the City pays, at the Job Rate, more than three
quarters of other comparable public sector employers and pays less than one
quarter of other comparable public sector employers. Council’s determination for
the 75th percentile pay line policy was based upon the need to be competitive in the
job market place in order to attract and retain high performing staff to work in a large
highly complex unionized organization.
3
Background Information cont.
Non-Union Employee Compensation: External Consultant Reviews
Two reviews undertaken of the City’s non-union employee compensation, conducted
by different external compensation consulting firms (Mercer in 2008 and Hay Group
in 2012) found that the City’s Maximum Salary (Job Rate) for senior managers, and
even more particularly pronounced for positions of Division Head, Deputy City
Manager and City Manager level, were near or below the 50th percentile
Non-union salary increases of 0.0% in 2009, 1.0% in 2010 and 2.25% in 2011 have
further widened the gap between the City’s non-union positions and the
marketplace.
Over the past 5-year period (2007-2011):
senior management have received a -7.06% lower cumulative total general
salary increases than city unionized employees; and
non-union employees have received a -3.89% lower cumulative total general
salary increases than city unionized employees.
At the same time, the City has continued to fall behind its comparator market
particularly given the continuation of general salary increases awarded at other
comparator GTA/municipal and regional employers.4
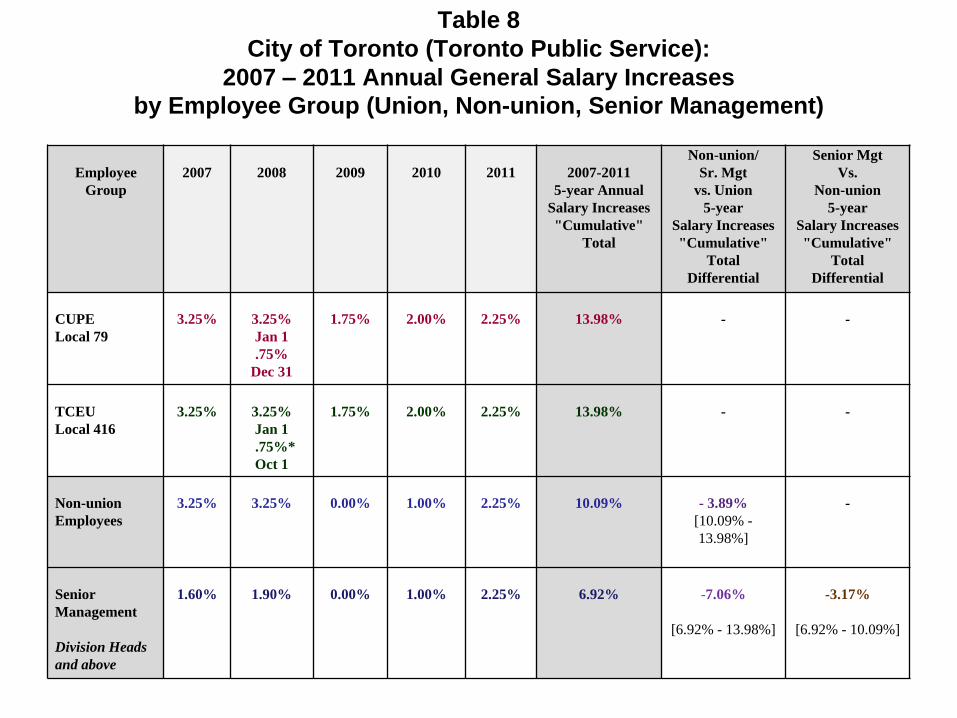
Table 8
City of Toronto (Toronto Public Service):
2007 – 2011 Annual General Salary Increases
by Employee Group (Union, Non-union, Senior Management)
Employee
Group
2007 2008 2009 2010 2011 2007-2011
5-year Annual
Salary Increases
"Cumulative"
Total
Non-union/
Sr. Mgt
vs. Union
5-year
Salary Increases
"Cumulative"
Total
Differential
Senior Mgt
Vs.
Non-union
5-year
Salary Increases
"Cumulative"
Total
Differential
CUPE
Local 79
3.25% 3.25%
Jan 1
.75%
Dec 31
1.75% 2.00% 2.25% 13.98% - -
TCEU
Local 416
3.25% 3.25%
Jan 1
.75%*
Oct 1
1.75% 2.00% 2.25% 13.98% - -
Non-union
Employees
3.25% 3.25% 0.00% 1.00% 2.25% 10.09% - 3.89%
[10.09% -
13.98%]
-
Senior
Management
Division Heads
and above
1.60% 1.90% 0.00% 1.00% 2.25% 6.92% -7.06%
[6.92% - 13.98%]
-3.17%
[6.92% - 10.09%]
6
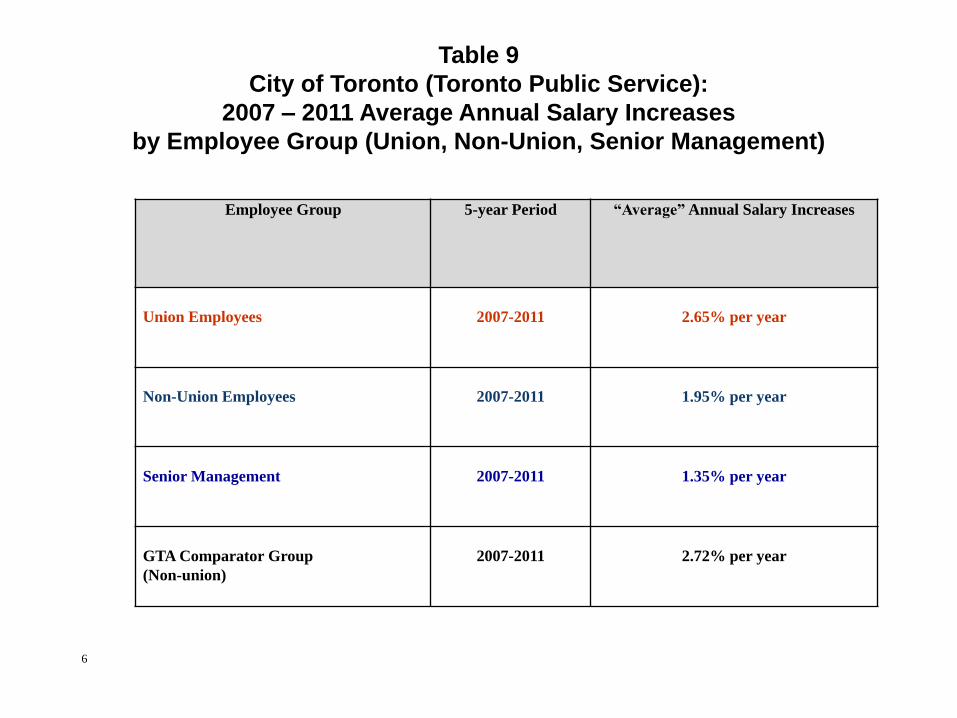
Employee Group 5-year Period “Average” Annual Salary Increases
Union Employees 2007-2011 2.65% per year
Non-Union Employees 2007-2011 1.95% per year
Senior Management 2007-2011 1.35% per year
GTA Comparator Group
(Non-union)
2007-2011 2.72% per year
Table 9
City of Toronto (Toronto Public Service):
2007 – 2011 Average Annual Salary Increases
by Employee Group (Union, Non-Union, Senior Management)
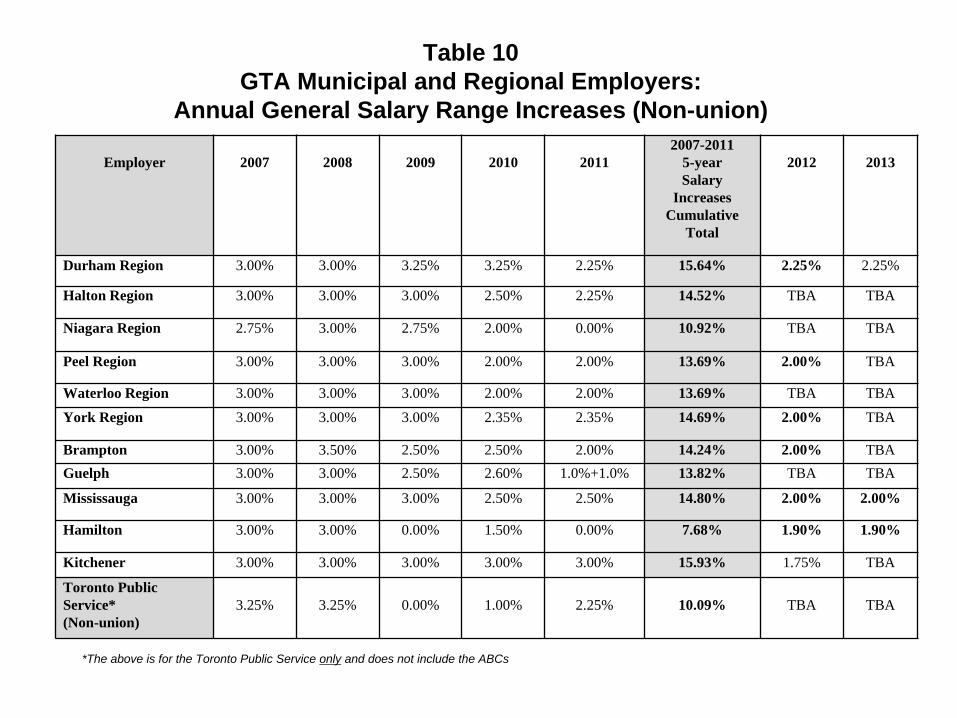
Table 10
GTA Municipal and Regional Employers:
Annual General Salary Range Increases (Non-union)
Employer 2007 2008 2009 2010 2011
2007-2011
5-year
Salary
Increases
Cumulative
Total
2012 2013
Durham Region 3.00% 3.00% 3.25% 3.25% 2.25% 15.64% 2.25% 2.25%
Halton Region 3.00% 3.00% 3.00% 2.50% 2.25% 14.52% TBA TBA
Niagara Region 2.75% 3.00% 2.75% 2.00% 0.00% 10.92% TBA TBA
Peel Region 3.00% 3.00% 3.00% 2.00% 2.00% 13.69% 2.00% TBA
Waterloo Region 3.00% 3.00% 3.00% 2.00% 2.00% 13.69% TBA TBA
York Region 3.00% 3.00% 3.00% 2.35% 2.35% 14.69% 2.00% TBA
Brampton 3.00% 3.50% 2.50% 2.50% 2.00% 14.24% 2.00% TBA
Guelph 3.00% 3.00% 2.50% 2.60% 1.0%+1.0% 13.82% TBA TBA
Mississauga 3.00% 3.00% 3.00% 2.50% 2.50% 14.80% 2.00% 2.00%
Hamilton 3.00% 3.00% 0.00% 1.50% 0.00% 7.68% 1.90% 1.90%
Kitchener 3.00% 3.00% 3.00% 3.00% 3.00% 15.93% 1.75% TBA
Toronto Public
Service*
(Non-union)
3.25% 3.25% 0.00% 1.00% 2.25% 10.09% TBA TBA
*The above is for the Toronto Public Service only and does not include the ABCs
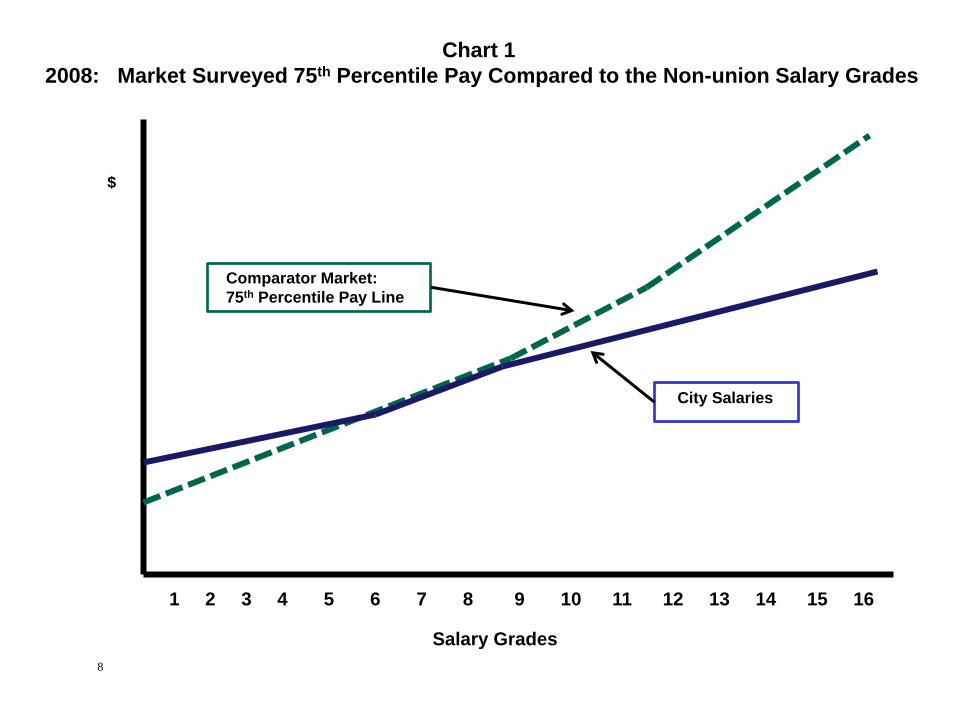
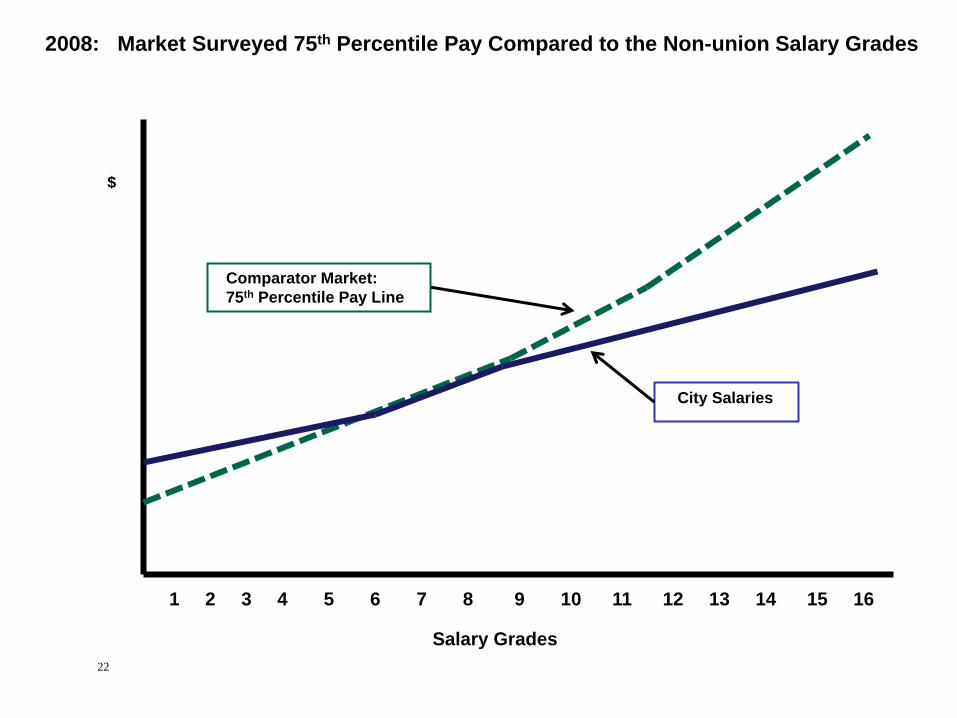
Chart 1
2008: Market Surveyed 75th Percentile Pay Compared to the Non-union Salary Grades
$
1 2 3 4 5 6 7 8 9 10 11 12 13 14 15 16
Salary Grades
Comparator Market:
75th Percentile Pay Line
City Salaries
8
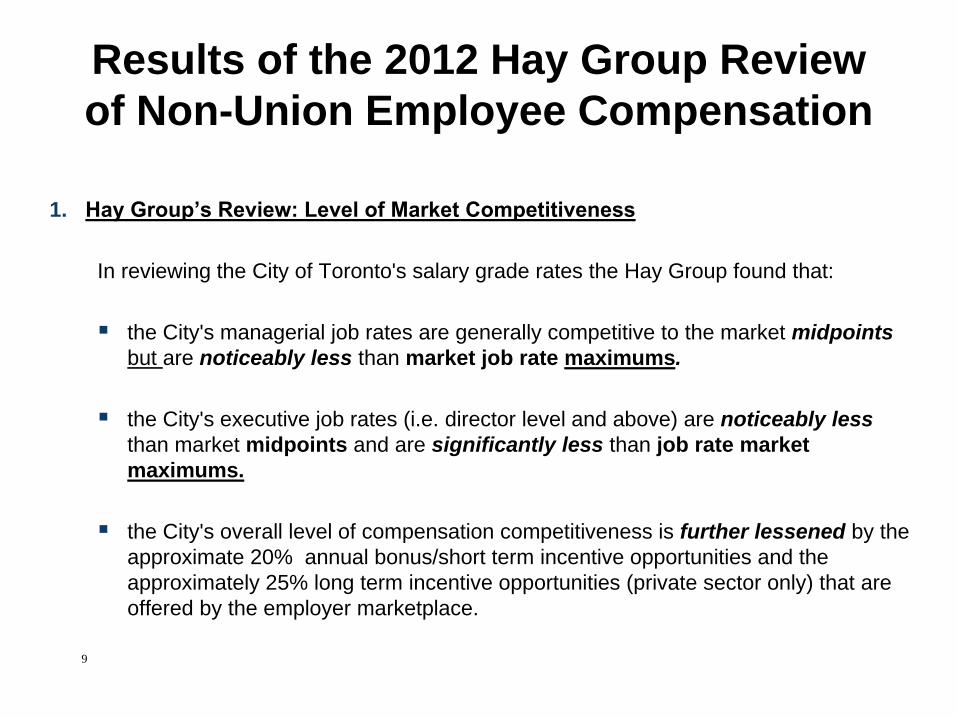
Results of the 2012 Hay Group Review
of Non-Union Employee Compensation
1. Hay Group’s Review: Level of Market Competitiveness
In reviewing the City of Toronto's salary grade rates the Hay Group found that:
the City's managerial job rates are generally competitive to the market midpoints
but are noticeably less than market job rate maximums.
the City's executive job rates (i.e. director level and above) are noticeably less
than market midpoints and are significantly less than job rate market
maximums.
the City's overall level of compensation competitiveness is further lessened by the
approximate 20% annual bonus/short term incentive opportunities and the
approximately 25% long term incentive opportunities (private sector only) that are
offered by the employer marketplace.
9
Results of the 2012 Hay Group Review
of Non-Union Employee Compensation cont.
2. Hay Group’s Review: Merit Performance Rewards
The City of Toronto has no mechanism in place to:
recognize and reward superior individual performers; and
encourage successful enterprise-wide City performance
10
18
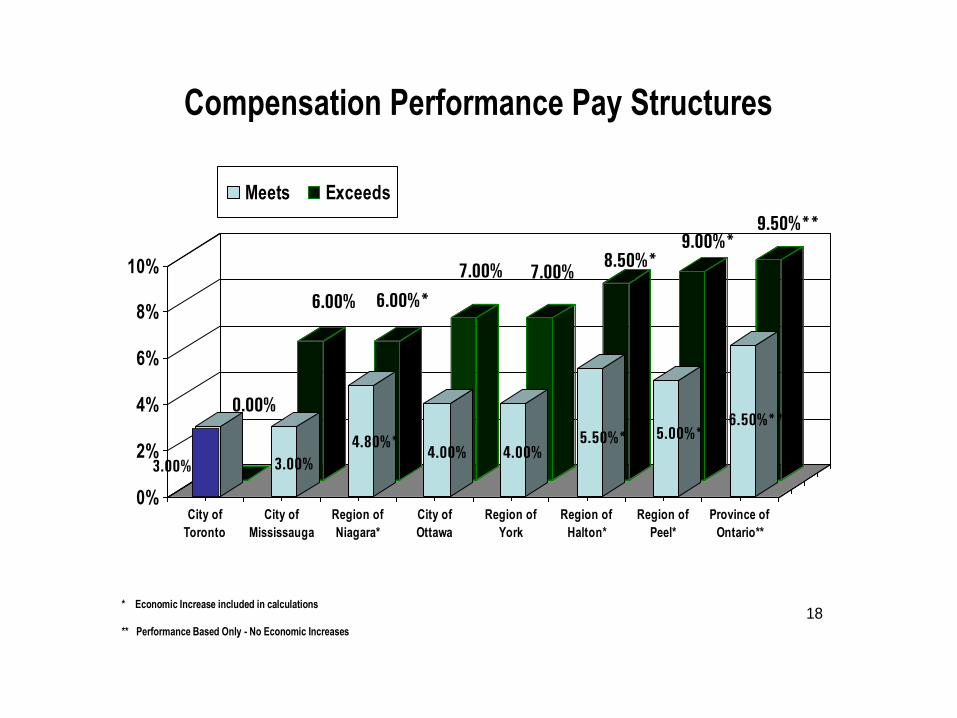
Compensation Performance Pay Structures
0.00%
6.00% 6.00%*
7.00% 7.00%8.50%*
9.00%*9.50%**
3.00% 3.00%
4.80%*4.00% 4.00%
5.50%* 5.00%*6.50%**
0%
2%
4%
6%
8%
10%
City of
Toronto
City of
Mississauga
Region of
Niagara*
City of
Ottawa
Region of
York
Region of
Halton*
Region of
Peel*
Province of
Ontario**
Meets Exceeds
* Economic Increase included in calculations
** Performance Based Only - No Economic Increases
Why Does Effective Compensation Matter?
Successful Cost-Effective and Customer-Service Driven Organizations have competitive
salaries and best practices compensation performance reward systems and these are
aligned with their organization’s goals and objectives.
An organization's current and future success is dependent upon its ability to recruit and
retain high performing individuals.
The retaining and attracting of high-performing leaders to maximize organizational
performance requires the need to have competitive salaries and effective performance
rewards systems.
The shrinking labour market is becoming a major challenge as baby boomers retire;
employers are competing for fewer and fewer available highly skilled individuals.
11
Why Does Effective Compensation Matter? cont.
In keeping with the Mayor and City Council's priorities, it is critical for the City to be
well positioned to retain and attract the employees best able to deliver on the
City's goals and priorities.
A substandard compensation and reward policy that is not best practices nor
competitive and that provides little incentive to effectively reward individual superior
performance will not help deliver on the Mayor's and City Council's priorities.
12
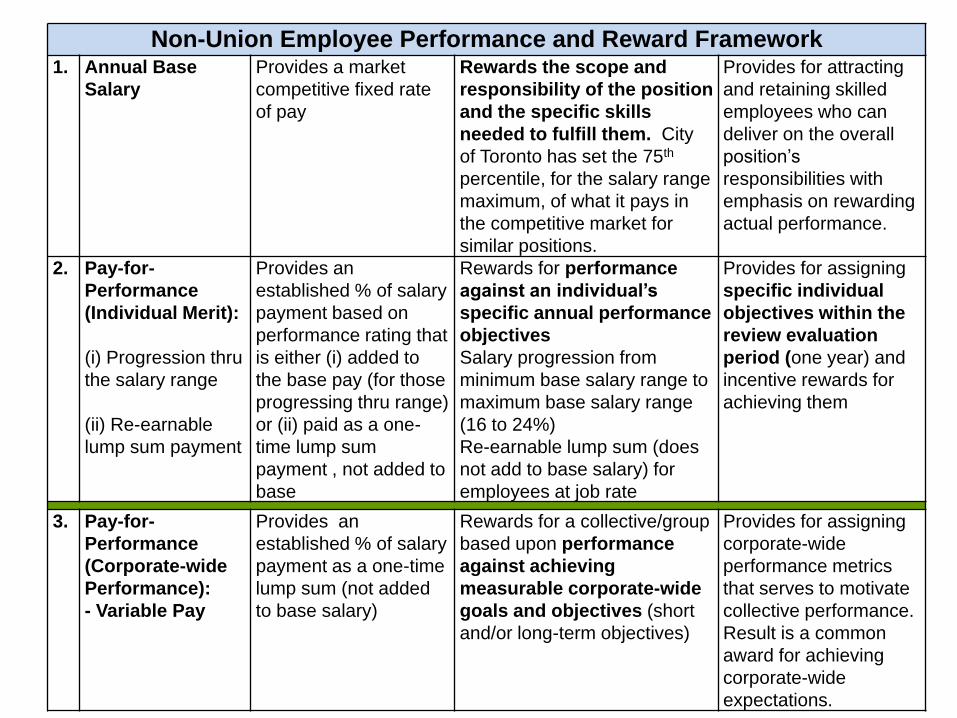
Non-Union Employee Performance and Reward Framework1. Annual Base
Salary
Provides a market
competitive fixed rate
of pay
Rewards the scope and
responsibility of the position
and the specific skills
needed to fulfill them. City
of Toronto has set the 75th
percentile, for the salary range
maximum, of what it pays in
the competitive market for
similar positions.
Provides for attracting
and retaining skilled
employees who can
deliver on the overall
position’s
responsibilities with
emphasis on rewarding
actual performance.
2. Pay-for-
Performance
(Individual Merit):
(i) Progression thru
the salary range
(ii) Re-earnable
lump sum payment
Provides an
established % of salary
payment based on
performance rating that
is either (i) added to
the base pay (for those
progressing thru range)
or (ii) paid as a one-
time lump sum
payment , not added to
base
Rewards for performance
against an individual’s
specific annual performance
objectives
Salary progression from
minimum base salary range to
maximum base salary range
(16 to 24%)
Re-earnable lump sum (does
not add to base salary) for
employees at job rate
Provides for assigning
specific individual
objectives within the
review evaluation
period (one year) and
incentive rewards for
achieving them
3. Pay-for-
Performance
(Corporate-wide
Performance):
- Variable Pay
Provides an
established % of salary
payment as a one-time
lump sum (not added
to base salary)
Rewards for a collective/group
based upon performance
against achieving
measurable corporate-wide
goals and objectives (short
and/or long-term objectives)
Provides for assigning
corporate-wide
performance metrics
that serves to motivate
collective performance.
Result is a common
award for achieving
corporate-wide
expectations.
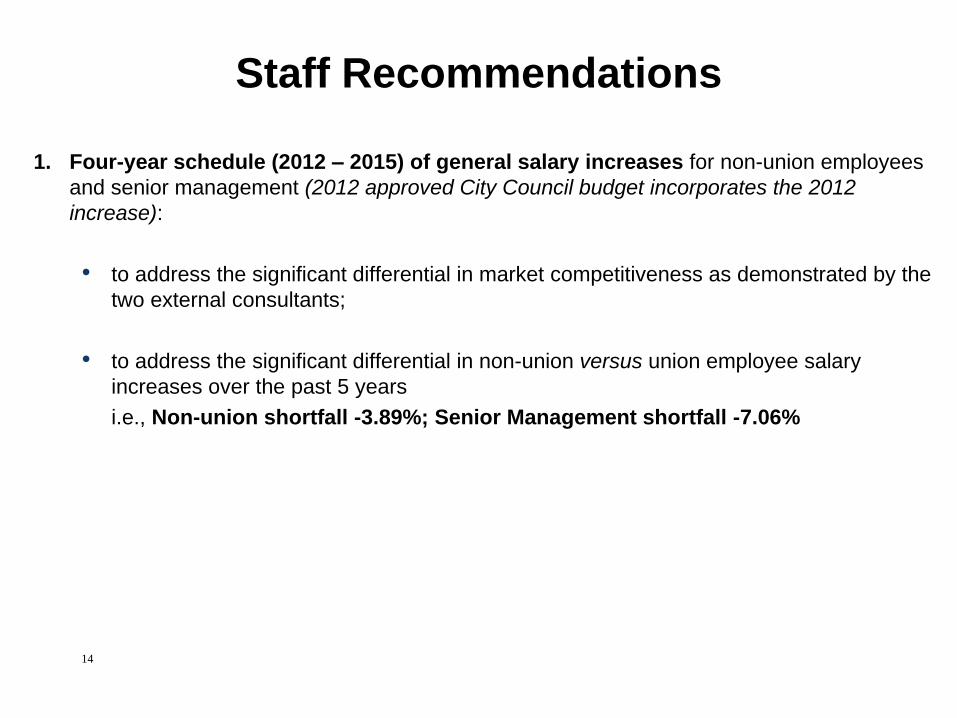
Staff Recommendations
1. Four-year schedule (2012 – 2015) of general salary increases for non-union employees
and senior management (2012 approved City Council budget incorporates the 2012
increase):
• to address the significant differential in market competitiveness as demonstrated by the
two external consultants;
• to address the significant differential in non-union versus union employee salary
increases over the past 5 years
i.e., Non-union shortfall -3.89%; Senior Management shortfall -7.06%
14
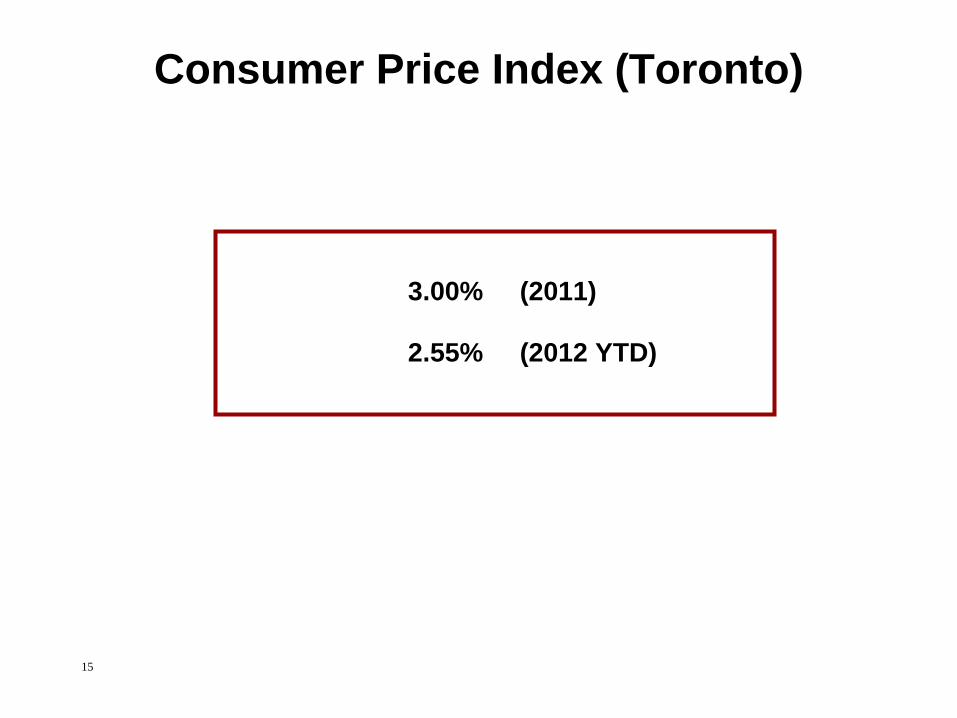
Consumer Price Index (Toronto)
3.00% (2011)
2.55% (2012 YTD)
15
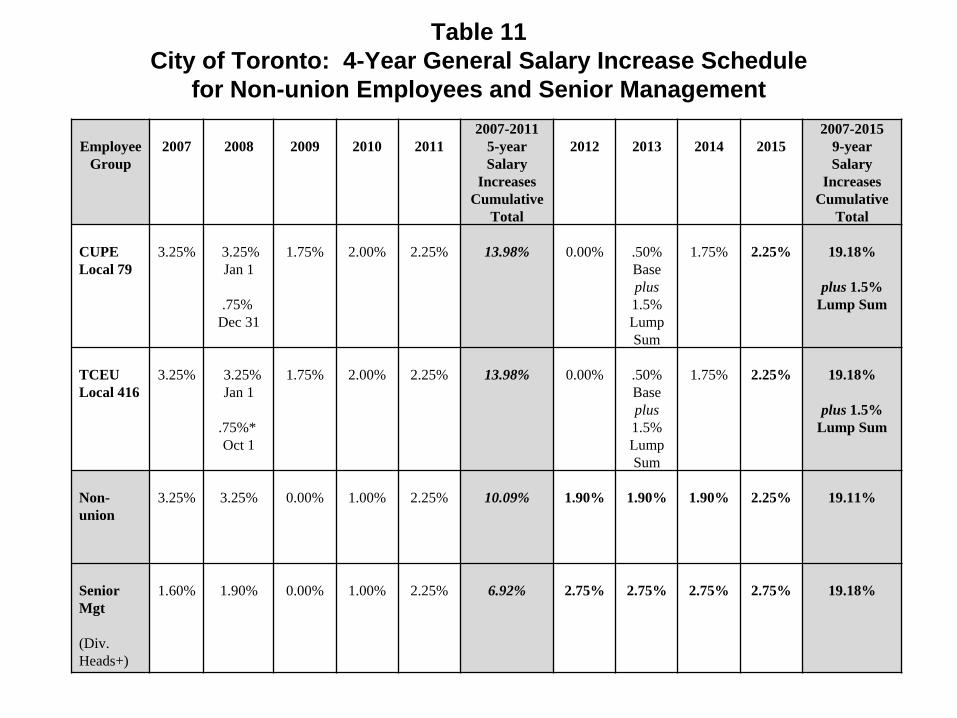
Table 11
City of Toronto: 4-Year General Salary Increase Schedule
for Non-union Employees and Senior Management
Employee
Group
2007 2008 2009 2010 2011
2007-2011
5-year
Salary
Increases
Cumulative
Total
2012 2013 2014 2015
2007-2015
9-year
Salary
Increases
Cumulative
Total
CUPE
Local 79
3.25% 3.25%
Jan 1
.75%
Dec 31
1.75% 2.00% 2.25% 13.98% 0.00% .50%
Base
plus
1.5%
Lump
Sum
1.75% 2.25% 19.18%
plus 1.5%
Lump Sum
TCEU
Local 416
3.25% 3.25%
Jan 1
.75%*
Oct 1
1.75% 2.00% 2.25% 13.98% 0.00% .50%
Base
plus
1.5%
Lump
Sum
1.75% 2.25% 19.18%
plus 1.5%
Lump Sum
Non-
union
3.25% 3.25% 0.00% 1.00% 2.25% 10.09% 1.90% 1.90% 1.90% 2.25% 19.11%
Senior
Mgt
(Div.
Heads+)
1.60% 1.90% 0.00% 1.00% 2.25% 6.92% 2.75% 2.75% 2.75% 2.75% 19.18%
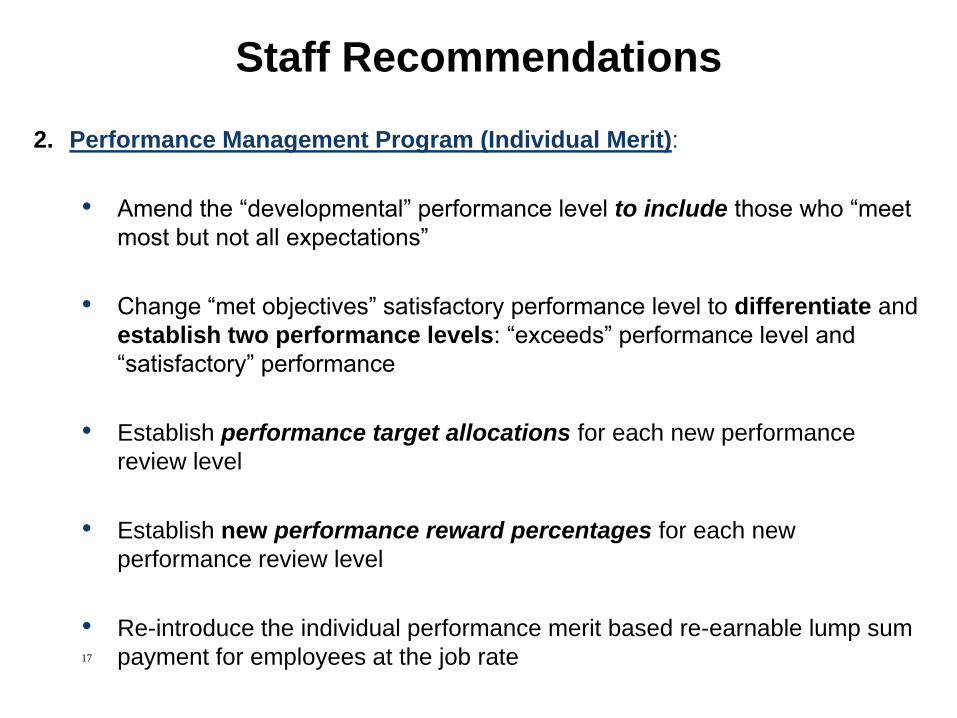
Staff Recommendations
2. Performance Management Program (Individual Merit):
• Amend the “developmental” performance level to include those who “meet
most but not all expectations”
• Change “met objectives” satisfactory performance level to differentiate and
establish two performance levels: “exceeds” performance level and
“satisfactory” performance
• Establish performance target allocations for each new performance
review level
• Establish new performance reward percentages for each new
performance review level
• Re-introduce the individual performance merit based re-earnable lump sum
payment for employees at the job rate17
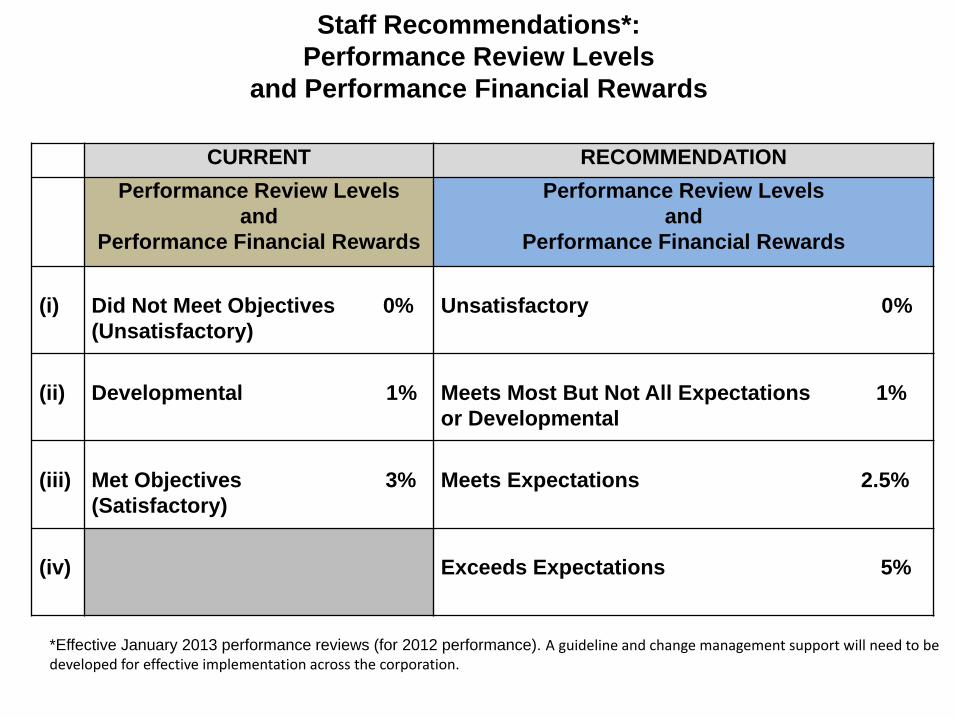
Staff Recommendations*:
Performance Review Levels
and Performance Financial Rewards
*Effective January 2013 performance reviews (for 2012 performance). A guideline and change management support will need to be developed for effective implementation across the corporation.
CURRENT RECOMMENDATION
Performance Review Levels
and
Performance Financial Rewards
Performance Review Levels
and
Performance Financial Rewards
(i) Did Not Meet Objectives 0%
(Unsatisfactory)
Unsatisfactory 0%
(ii) Developmental 1% Meets Most But Not All Expectations 1%
or Developmental
(iii) Met Objectives 3%
(Satisfactory)
Meets Expectations 2.5%
(iv) Exceeds Expectations 5%
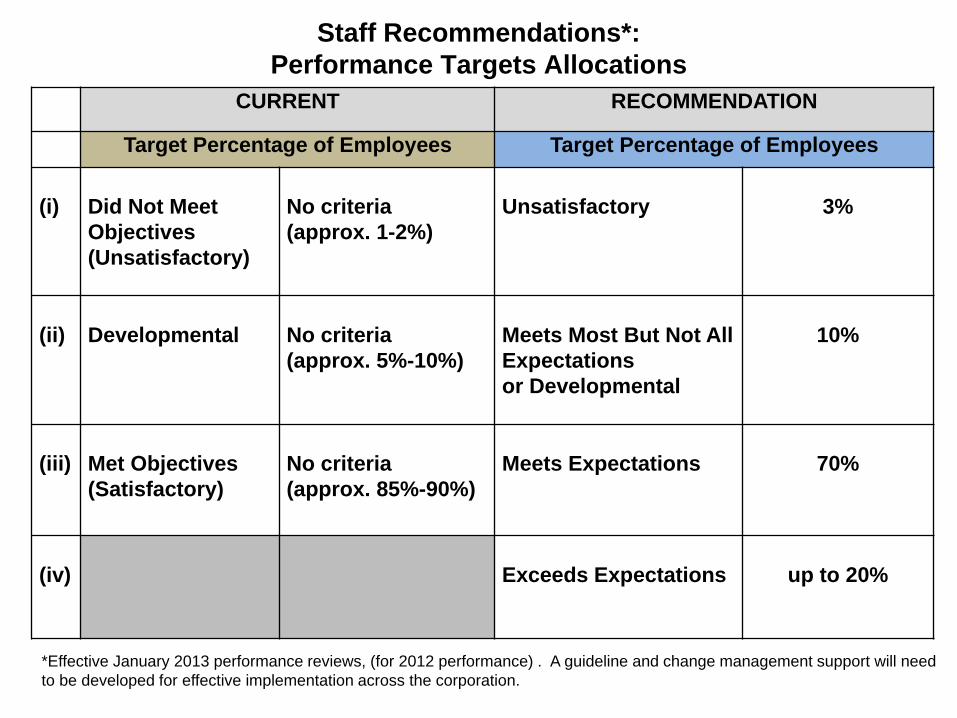
Staff Recommendations*:
Performance Targets Allocations
*Effective January 2013 performance reviews, (for 2012 performance) . A guideline and change management support will need
to be developed for effective implementation across the corporation.
CURRENT RECOMMENDATION
Target Percentage of Employees Target Percentage of Employees
(i) Did Not Meet
Objectives
(Unsatisfactory)
No criteria
(approx. 1-2%)
Unsatisfactory 3%
(ii) Developmental No criteria
(approx. 5%-10%)
Meets Most But Not All
Expectations
or Developmental
10%
(iii) Met Objectives
(Satisfactory)
No criteria
(approx. 85%-90%)
Meets Expectations 70%
(iv) Exceeds Expectations up to 20%
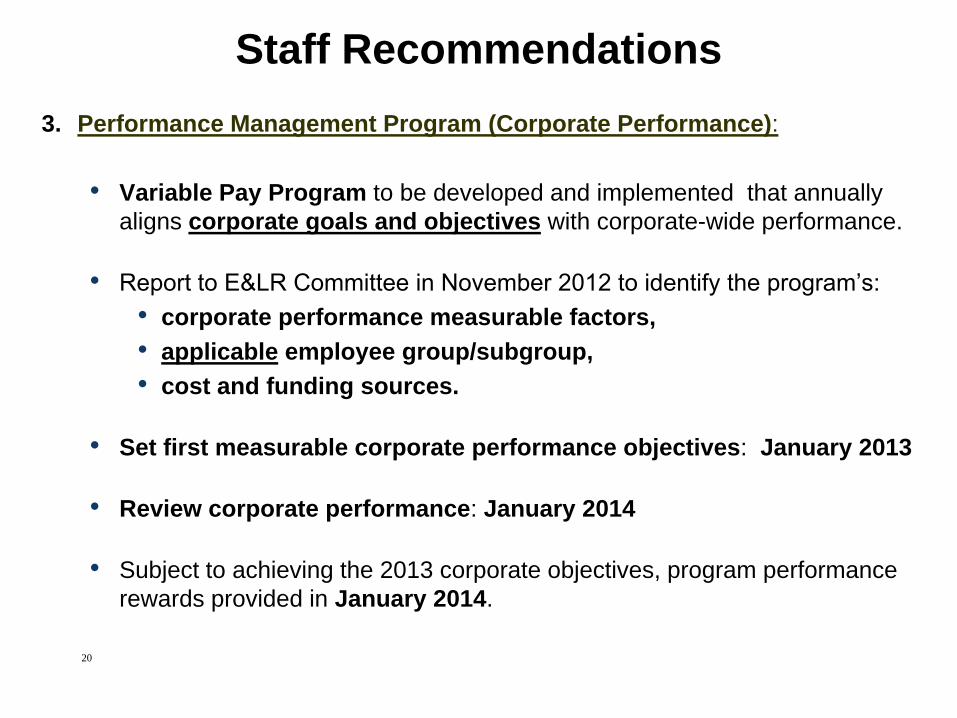
Staff Recommendations
3. Performance Management Program (Corporate Performance):
• Variable Pay Program to be developed and implemented that annually
aligns corporate goals and objectives with corporate-wide performance.
• Report to E&LR Committee in November 2012 to identify the program’s:
• corporate performance measurable factors,
• applicable employee group/subgroup,
• cost and funding sources.
• Set first measurable corporate performance objectives: January 2013
• Review corporate performance: January 2014
• Subject to achieving the 2013 corporate objectives, program performance
rewards provided in January 2014.
20
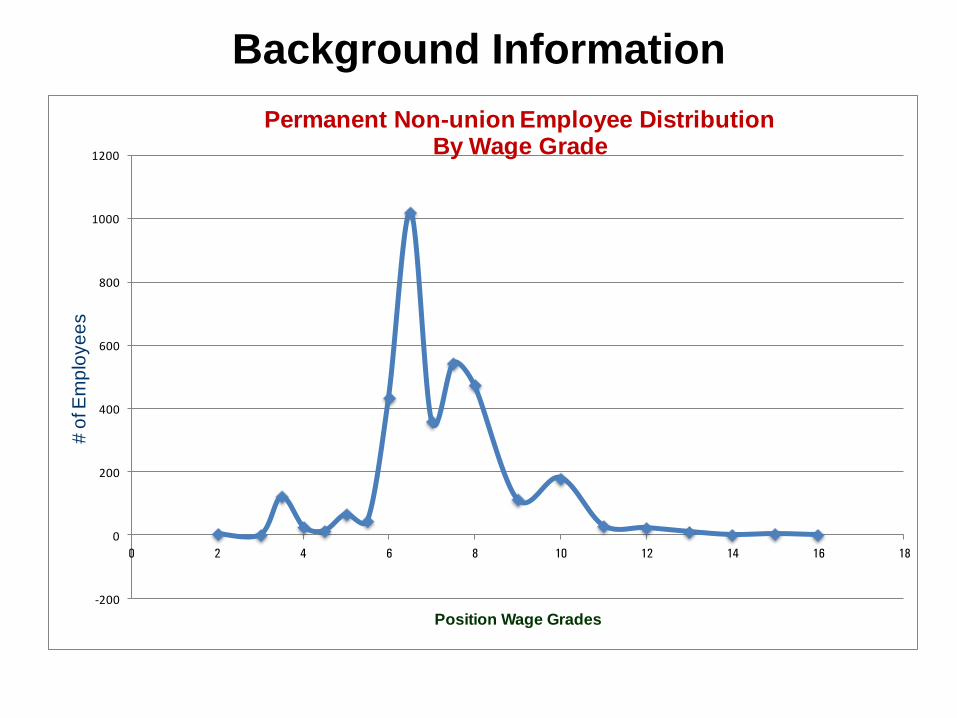
Background Information
-200
0
200
400
600
800
1000
1200
0 2 4 6 8 10 12 14 16 18
# o
f Em
plo
ye
es
Position Wage Grades
Permanent Non-union Employee DistributionBy Wage Grade
2008: Market Surveyed 75th Percentile Pay Compared to the Non-union Salary Grades
$
1 2 3 4 5 6 7 8 9 10 11 12 13 14 15 16
Salary Grades
Comparator Market:
75th Percentile Pay Line
City Salaries
22
Base Salary
(Salary
Grade
Range)
Merit
Pay
Base Salary
(Salary
Grade
Range)
Merit Pay
(Re-earnable)
Comparator
Market:
75th Percentile
Pay Line
Variable Pay
Individual Merit
Performance
Corporate-wide
Performance
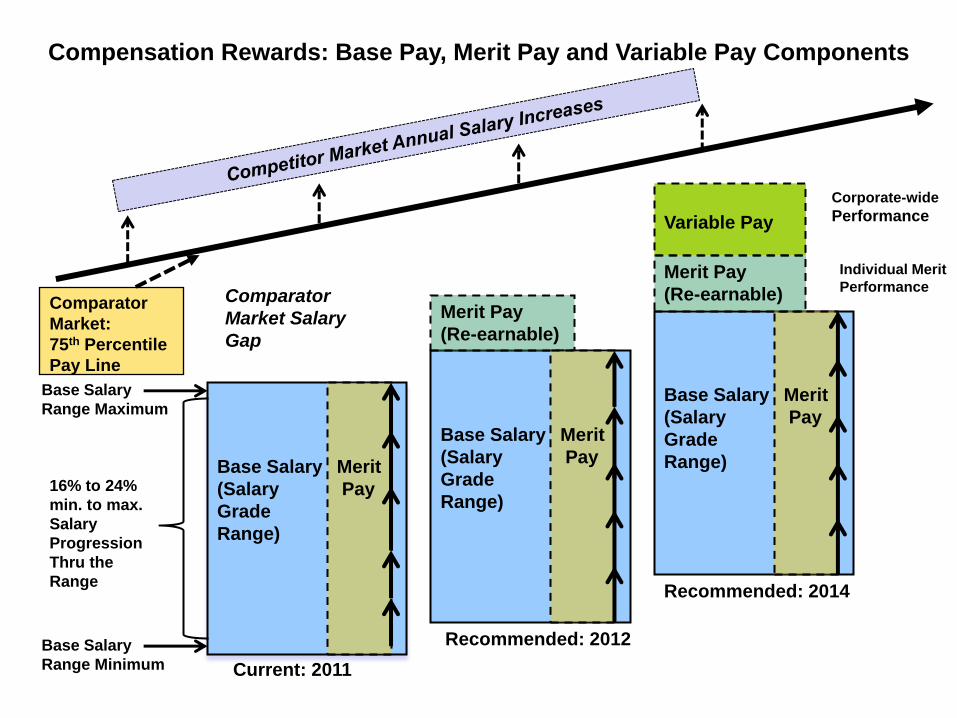
Compensation Rewards: Base Pay, Merit Pay and Variable Pay Components
Current: 2011
Comparator
Market Salary
Gap
Base Salary
Range Minimum
Base Salary
Range Maximum
16% to 24%
min. to max.
Salary
Progression
Thru the
Range
Recommended: 2012
Merit
Pay
Base Salary
(Salary
Grade
Range)
Recommended: 2014
Merit
Pay
Merit Pay
(Re-earnable)