Embed Size (px)
Citation preview
American Journal of Applied Sciences 5 (12): 1793-1803, 2008 ISSN 1546-9239 © 2008 Science Publications
Corresponding Author: Mohammad Amin Assareh, K.N. Toosi University of Technology, P.O. Box 15875-4416, Vali Asr St., Mirdamad Blvd., Tehran, Iran Tel: +98-912-1944337 Fax: +98-261-4314773
1793
Nonlinear Behavior of Single Piles in Jacket Type Offshore Platforms
Using Incremental Dynamic Analysis
Mohammad Amin Assareh and Behrouz Asgarian 1K.N. Toosi University of Technology, Civil Faculty, P.O. Box 15875-4416, Tehran, Iran
Abstract: The operation for offshore oil has become an important issue in the recent years. Offshore platforms are some of those structures which are built to withstand environmental and accidental loads during oil exploitation operation. One of the most usual types of these platforms is the Jacket Type Offshore Platform (JTOP) which can be divided into three important parts, which are Deck, Jacket and piles. In order to increase the safety, particular attention should be paid to earthquake excitations which are directly applied to the piles of these structures. Nonlinearity in piles and buckling of the struts are important issues which have to be considered by the designers of offshore platforms. The case of nonlinearity in piles and failure capture in these members has not effectively been covered by researchers. Incremental Dynamic Analysis (IDA) is a powerful tool to assess the capacity of a structure upon seismic loads. In this paper incremental dynamic analysis has been implemented on single piles considering soil-pile interactions and free field site response. The use of nonlinear materials and lateral load resisting elements in the incremental dynamic analysis done in this paper has made it possible to get promising insights for incorporation of appropriate limit states and applications of performance based engineering. Special Engineering Demand Parameters (EDP) and Intensity Measures (IM) have been introduced for the single pile dynamic analysis in jacket type offshore platforms. Key words: Incremental Dynamic Analysis (IDA), Intensity Measures (IM), Engineering Demand
Parameters (EDP), soil-pile-structure interactions
INTRODUCTION Excavation for oil in offshore areas has begun for several years. This industry relies on offshore structures as part of their existence. Steel platforms are one of the most common structural systems currently used for oil exploitation purposes. These structures are generally designed to resist environmental loads namely, functional loads and loads due to waves, currents, wind as well as earthquake excitations. Particular attention is being paid to ground motion induced loads in seismic active vicinities since these loads upon occurrence has influential contribution in lateral damage and collapse of a structure. Like other structures, all of these loads have a major effect on the foundations which in this case are piles. As such, the consequences of these effects should be accounted for in capacity and design of an offshore installation. Incremental Dynamic Analysis[1] is a powerful tool to assess the global and relatively local capacity of structures. Several insights can be obtained about dynamic characteristics of a structure as well as
providing useful inputs for applications of performance based engineering. IDA can be widely used not only in buildings but also in any type of costly and critical structure. IDA was well documented and introduced by Vamvatsikos and Cornell (2005)[1]. They used this concept to assess mostly the performance and reliability of structural frames in buildings but its application in offshore platforms and its effects on single piles has not been comprehensively investigated before. Intensity Measure of a scaled accelerogram is a non-negative scalar or a vector[2] that has been proposed to characterize the intensity of a ground motion and Engineering Demand Parameter is a non-negative scalar that characterizes the response of the structural model due to prescribed seismic loading. For any individual structural system, depending on its behavior and response, an appropriate IM and EDP as well as a measure of damage may be defined. In this paper the nonlinear behavior of single piles which were tested by the centrifuge at University of California at Davis is investigated under earthquake excitation.
Am. J. Applied Sci., 5 (12): 1793-1803, 2008
1794
SOIL-PILE-STRUCTURE INTERACTION The behavior of pile foundations under earthquake loading is an important factor affecting the performance of many essential structures such as offshore platforms, bridges and piers. Analysis and design procedures have been developed for evaluating pile behavior under earthquake loading. Dynamic p-y analysis is an equivalent modeling method that has a long history of development and application to seismic and offshore problems [e.g., Matlock et al. (1970)[3], Kagawa and Kraft (1980)[4] and Nogami et al. (1992)[5]] and can be performed with a number of different computer codes. This Paper describes an evaluation of an Incremental Dynamic Analysis of single piles (which are one of the essential members of offshore platforms), considering soil-pile-structure interactions. The results provide an evaluation of the analysis done to reliably capture soil-pile-structure interaction effects over a wide range of shaking intensities and earthquake motions. Predicting the behavior of pile foundations under earthquake loading is a complex problem involving consideration of earthquake characteristics, free field site response, soil profile characteristics, superstructure response and soil-pile-superstructure interaction. The most common design approach in the world today is to avoid inelastic behavior of piles and their connections below the ground surface, where damage would be difficult to detect or to repair. With the IDA analysis done in this paper broader discussions are made to capture the inelastic behaviors of piles under seismic loading. Various approaches have been developed for the dynamic response analysis of piles. One such method which will be used throughout this paper is the Beam on Nonlinear Winkler Foundation (BNWF) model, where the soil-pile interaction is approximated using parallel nonlinear soil-pile p-y springs (Matlock, 1970[3]). Other approaches that could be mentioned are the finite element method (Angelides and Roesset, 1980[6]) and the boundary element method (Sanchez, 1982[7]. Trochanis et al. (1991)[8] showed that the response of laterally loaded piles predicted using a BNWF formulation agreed well with static load test data and nonlinear 3-D finite element analyses. Trochanis et al. (1991)[8] used a degrading constitutive model to represent the p-y springs. Kagawa (1980)[4] further extended the BNWF analysis in seismic problems by including viscous dashpots with the nonlinear p-y springs to model the effects of radiation damping. The dynamic BNWF model as applied by Wang et al. (1998)[9] includes a linear "far-field" spring in parallel with the radiation damping dashpot and that
Soil
laye
rs
Cal
cula
ted
grou
nd m
otio
n fr
ee fi
eld
resp
ons
anal
ysis
Q - Z E le m e n tsQ - Z e le m e n t sP - Y a n d T - Z
e le m e n t s
S u p e r s t r u c t u r e
G r o u n d le v e l
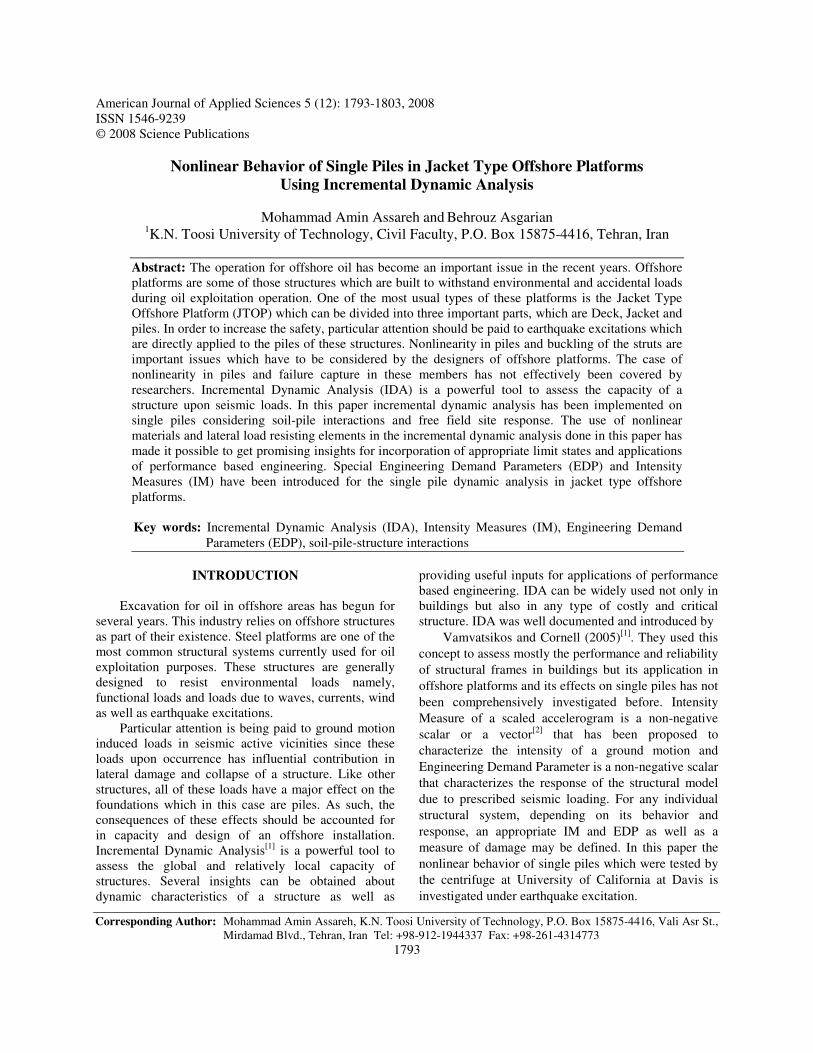
Fig. 1: A brief sketch of the configuration of Soil-Pile-
Structure interaction used in this research combination in series with a non-linear near-field spring. Another important problem regarding soil-pile- structure interaction is analyzing the response of soil profile and applying the ground motion properties to the soil. Various programs have been developed for evaluating soil response during earthquakes. In this paper the response of the soil profile was analyzed using CYCLIC1D (a 1D nonlinear finite element program) which is developed by Yang and Elgamal (2001)[10]. Nonlinear p-y element with gapping capabilities and t-z and q-z elements for the consideration of pile skin friction and end bearing resistance, were implemented in the nonlinear structural and geotechnical program OpenSEES[11] for dynamic analyses of the pile. Details of the free-field site response analyses, the nonlinear p-y, t-z and q-z element formulation and the dynamic analyses are described in the following discussions and are shown in a brief sketch in Fig. 1.
CENTRIFUGE EXPERIMENTS The data which are used in this paper were performed using the large shaking table on the 9-m-radius centrifuge at the University of California at Davis (Kutter et al. 1994)[12]. Models were tested in a flexible shear beam (FSB) container at a centrifugal acceleration of 30g. The FSB container consists of a series of stacked aluminum rings separated by soft rubber that enables the container to deform with the soil. The inside dimensions of the container are 1.7 m long, 0.7 m deep and 0.7 m wide. A wide variety of
Am. J. Applied Sci., 5 (12): 1793-1803, 2008
1795
Table 1: Single pile properties Pile Material Steel Pile Diameter 67 cm Pile Thickness 1.9 cm Pile Length 20.6 m Superstructure Mass 50968 kg Dense Sand Properties ϕ(deg) 40 γ’(KN m−3) 10.1 Soft Clay Properties γ’(KN m−3) 5.2 ε50 0.01 Cu/σ’v 0.45
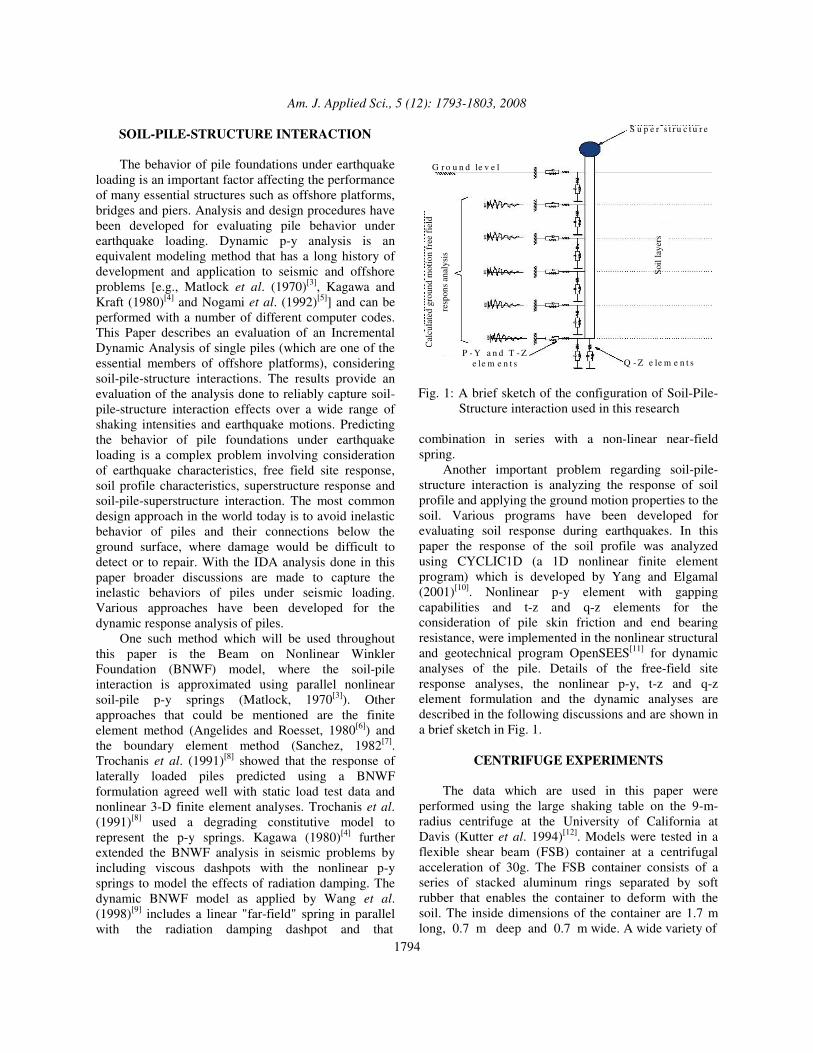
Fig. 2: Single pile configuration in the centrifuge tests experiments on dynamic behavior of single piles were carried out in Wilson et al. (1997)[13]. All results presented in Wilson et al. (1997)[13] were in prototype units. The soil profile, structural models and instrumentation for the tests described herein are illustrated in Fig. 2. The soil profile consisted of two horizontal soil layers. The lower layer was fine, uniformly graded and saturated Nevada sand at a dry density of 1.66 Mg m−3. The upper layer was reconstituted Bay Mud (LL = 88, PI = 48) placed in four equal layers, with each layer separated by filter paper to accelerate consolidation. The single-pile-supported system analyzed in the centrifuge tests consisted of a superstructure Weight attached to an extension of the pile which was 500 KN. The Properties of the tested Piles are shown in Table 1. Two of the centrifuge tests which were done by Wilson et al. (1997)[13] are named Csp4 and Csp5, were each of these two tests were shaken with several simulated earthquake events, as summarized in Table 2. Each event was a scaled version of a record prepared by filtering and integrating strong motion records from Port Island in the 1995 Hyogoken-Nambu (Kobe) earthquake or Santa Cruz in the 1989 Loma Prieta earthquake.
Table 2: Earthquake events used for pile experiments PGA (g) base Input Test 0.055 Kobe (1995) CSP4 0.06 Kobe (1995) CSP4 0.02 Kobe (1995) CSP4 0.2 Kobe (1995) CSP4 0.58 Kobe (1995) CSP4 0.04 Santa Cruz (1989) CSP5 0.12 Santa Cruz (1989) CSP5 0.3 Santa Cruz (1989) CSP5 0.6 Santa Cruz (1989) CSP5 0.7 Santa Cruz (1989) CSP5
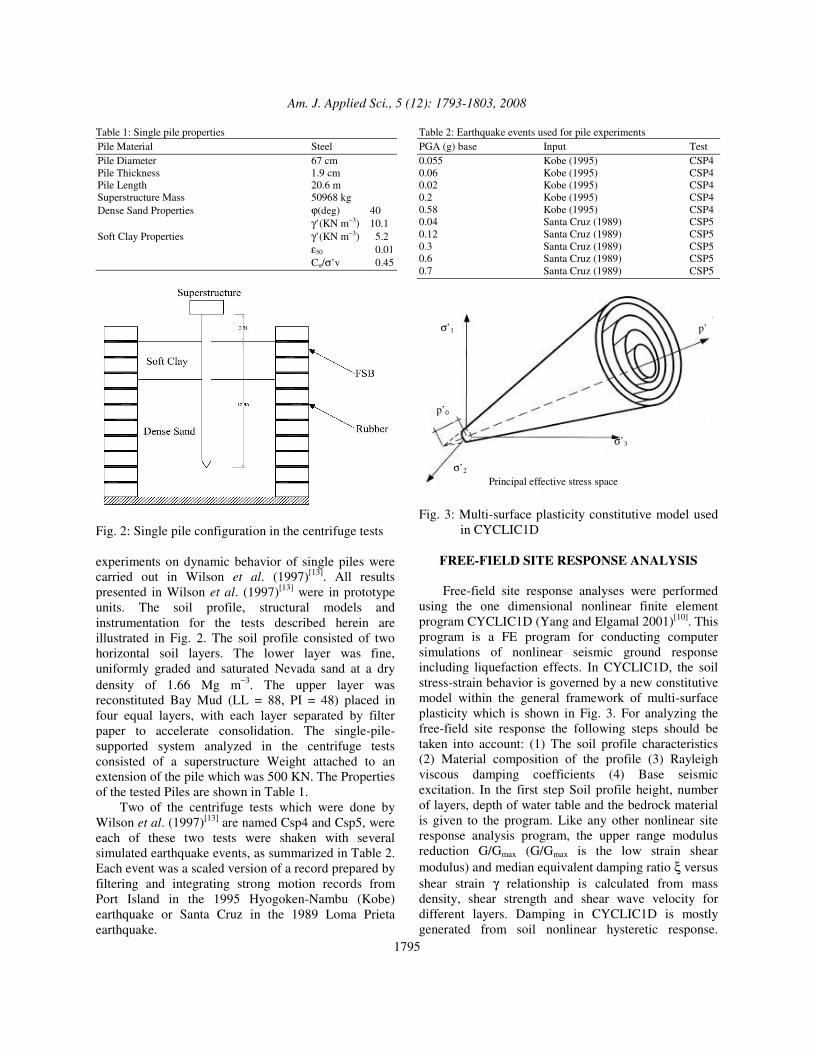
Principal effective stress space
σ’3
σ’2
σ’1 p’
p’0
Fig. 3: Multi-surface plasticity constitutive model used
in CYCLIC1D
FREE-FIELD SITE RESPONSE ANALYSIS Free-field site response analyses were performed using the one dimensional nonlinear finite element program CYCLIC1D (Yang and Elgamal 2001)[10]. This program is a FE program for conducting computer simulations of nonlinear seismic ground response including liquefaction effects. In CYCLIC1D, the soil stress-strain behavior is governed by a new constitutive model within the general framework of multi-surface plasticity which is shown in Fig. 3. For analyzing the free-field site response the following steps should be taken into account: (1) The soil profile characteristics (2) Material composition of the profile (3) Rayleigh viscous damping coefficients (4) Base seismic excitation. In the first step Soil profile height, number of layers, depth of water table and the bedrock material is given to the program. Like any other nonlinear site response analysis program, the upper range modulus reduction G/Gmax (G/Gmax is the low strain shear modulus) and median equivalent damping ratio ξ versus shear strain γ relationship is calculated from mass density, shear strength and shear wave velocity for different layers. Damping in CYCLIC1D is mostly generated from soil nonlinear hysteretic response.

Am. J. Applied Sci., 5 (12): 1793-1803, 2008
1796
Rayleigh type viscous damping may be assigned either by directly specifying two Rayleigh damping coefficients or by specifying two damping ratios for two different frequencies. For the soil profile of the pile tested herein, two different types of soil material is given to the program for both dense sand and soft clay. The bedrock is assumed rigid and is located a few meters below the pile tip. Soil properties are given to the program according to the geotechnical results and experiments mentioned in Table 1. The Rayleigh damping coefficients αm, βk (C = αm.M+βk.K) are given to the program as 0.108, 0.00173, respectively. For the IDA analyzes carried out in this paper, ten ground motion records were scaled and analyzed using this program. After every analysis is complete the displacement of all the layers is recorded, so that it could be used for dynamic behavior and IDA analysis of the single pile.
FE ANALYSIS AND VERIFICATION Pile elements: For modeling of the pile element in the finite element program OpenSEES (McKenna. 2000)[11], nonlinear beam column element is used. The single pile model is consisted of one meter long nonlinear beam column elements so that the p-y element would be able to attach to the pile in every layer. Nonlinear beam-column element models which have been widely used to model inelastic and cyclic behavior of steel structures are classified as finite element, phenomenological and physical theory models. Phenomenological and physical theory models are based on simplified hysteretic rules and consequently they are computationally less expensive, whereas their finite element counterparts are more versatile and sophisticated. The latter can be grouped into two major formulations: (1) displacement based formulation (2) force based formulation. Generally, displacement method (i.e., stiffness method), is based on well-known Hermitian shape functions in which equilibrium equations are satisfied in average sense whereas in force based method, equilibrium equations are strictly satisfied point-wise owing to its force interpolation functions for the internal forces which are exact for predominant uniaxial behavior of beam-column elements[14]. Nonlinear p-y elements: Nonlinear p-y behavior was modeled using the element described in OpenSEES by Boulanger et al. (2004)[15], which accounts for gapping and radiation damping. The p-y parameters for the soft clay were based on Matlock’s (1970)[3] recommendations and the p-y parameters for the underlying sand were based on [American Petroleum
Fig. 4: Results of P-Y behavior of Matlock model for clay and API model for sand and comparison with the analyzed model
Institute (API[16]) 1993] recommendations. The nonlinear p-y behavior is conceptualized as consisting of elastic (p-ye), plastic (p-yp) and gap (p-yg) components in series. The gap component consists of a nonlinear closure spring (pc-yg) in parallel with a nonlinear drag spring (pd-yg) as shown in Fig. 4. The backbone of the p-y curves for clay was based upon Matlock’s (1970) recommendations for soft clay and for the stiff clay recommendations for API was also used. One p-y element was tested with the finite element program OpenSEES and the resulting p-y curves match Matlock’s within a few percent over the entire range of y as shown in Fig. 4. For this study, the input parameters pult and y50 were also based upon Matlock’s (1970) equations which are as follows: ult u pP C BN= (1)
pu
'x JxN 3 9
C B
� �γ= + + ≤� �� �
(2)
50 50y 2.5B= ε (3) Where B = pile diameter; Np = lateral bearing capacity factor; γ’ = average buoyant unit weight; x = depth; Cu = undrained shear strength; and ε50 = strain corresponding to a stress of 50% of the ultimate stress in a laboratory stress-strain curve. ε50 Is given based on published laboratory test data in Table (1) and J was taken as 0.5 according to Matlock’s recommendations for soft clay. The gapping behavior includes a residual resistance that may be thought of as a drag force on the sides of the pile as it moves within the gap. This residual resistance is specified as a ratio of ultimate resistance Pult by a parameter Cd. This parameter is
Am. J. Applied Sci., 5 (12): 1793-1803, 2008
1797
assumed to be 0.3 for clay and 0.1 for sand according to the centrifuge tests. The backbone of the P-Y curves for sand layers was based on the American Petroleum Institute (API)[16] recommendations for sand. The ultimate lateral bearing capacity for sand has been found to vary from a value at shallow depths to a value at deep depths determined by the following two equations. ults 1 2P (C x C B) 'x= + γ (4) ultd 3P C B 'x= γ (5) Where Pult = ultimate resistance (force/unit length) (s = shallow, d = deep), γ’ = effective soil weight, x = depth, C1, C2, C3 = Coefficients determined from the graphs in API as a function of the friction angle, B = average pile diameter from surface to depth. At a given depth the equation giving the smallest value of Pult should be used as the ultimate bearing capacity. The resulting p-y curve from the analysis with OpenSEES closely reproduces the API curve over the entire range of y, as shown in Fig. 4. For this study, the input parameters Pult and y50 were also based on API recommendations. Radiation damping is modeled by a dashpot on the far-field elastic component (p-ye) as shown in Fig. 4. It is modeled with the dashpot coefficient based on the recommendations of Wang et al. (1998)[9] which is a modification of the work done by Berger (1977)[17]. According to this recommendation the damping coefficient is calculated by the following equation: sC 4 Bv= ρ (6) Where C is the damping coefficient, ρ is the density and Vs is the shear wave velocity of the soil. Dashpot coefficient is used to represent the loss of energy due to outgoing stress waves that the pile transmits to the soil. This dashpot arrangement, discussed in detail in Wang et al. (1998)[9]. Nonlinear t-z and q-z elements: Nonlinear t-z and q-z elements for skin friction resistance and end bearing resistance on the piles were modeled as elastic and plastic components in series as shown in Fig. 1. The ultimate skin friction resistance of the t-z elements in the clay and sand was calculated using the method presented in API[16]. For the sand, it was calculated using the shaft friction coefficient f = kp0 tanδ, where k is the coefficient of lateral earth pressure, P0 is the effective overburden pressure at the point and δ is the
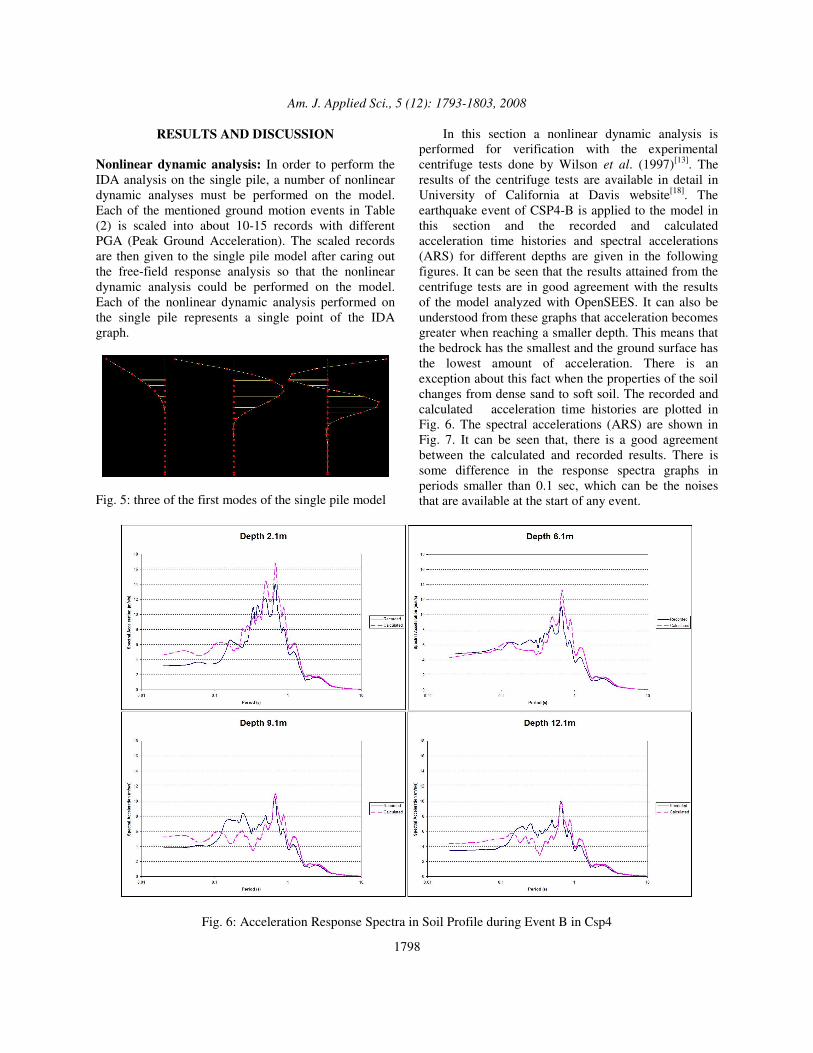
friction angle between the soil and pile wall. It is assumed in this paper that k is 0.8 for both tension and compression. For the clay layers the t-z elements are modeled according to the API recommendations. For cohesive soil shaft friction can be represented with f = αc, where α = 1 and c is the undrained shear strength of the soil at the point. Nonlinear q-z elements for the pile tip resistance were also modeled as elastic, plastic and gap components in series. The q-z element is modeled using the recommendations of API for sand (pile tip rests in dense sand). The configuration of p-y, t-z and q-z is shown in a sketch in Fig. 1. In the finite element program OpenSEES, the single pile (20.6 meters long and 1.9 cm thickness) was modeled using 21 nonlinear beam-column elements (every element is 1 meter long). These types of elements were chosen to carry out nonlinear analysis in the pile. The purpose of this is to detect damages which have occurred during dynamic analysis in the piles. Each of the pile nodes below the ground surface were connected to two nonlinear p-y elements (described earlier). The t-z elements were also placed on the nodes between the piles in every meter to apply the skin friction of the piles and for the end bearing resistance; a q-z element was installed under the pile. These nonlinear springs (p-y, t-z and q-z materials) were placed in the zero-length elements that are placed on the nodes of the pile and act as contact elements. Displacement time histories from the free-field site response analyses which were done with the program CYCLIC1D were input to the free-field ends (fixed nodes) of the zero-length elements containing the soil material. The solution technique involved Broyden iteration and the Newmark method with γ = 0.6 and β = 0.3025. It should be noted that high frequency noise can be developed in the pile accelerations when using the energy conserving form of the Newmark method (i.e., γ = 0.5 and β = 0.25)[15]. P-∆ Effects were included in the analysis using the P-∆ geometric transformation capabilities of the OpenSEES[11] program. After modeling the single pile in the program, an Eigen Value analysis was done to find the mode shapes and the fixed base period of structure. Results were in full agreement with the experimental work done by Wilson et al. (1997)[13]. In Fig. 5 some of the mode shapes exported from OpenSEES is illustrated with a large amplification. The straight horizontal lines represent the p-y elements of the soil a hysteretic analysis was done on the single pile to show the static behavior of the p-y elements which will be described in the next sections of this research.
Am. J. Applied Sci., 5 (12): 1793-1803, 2008
1798
RESULTS AND DISCUSSION Nonlinear dynamic analysis: In order to perform the IDA analysis on the single pile, a number of nonlinear dynamic analyses must be performed on the model. Each of the mentioned ground motion events in Table (2) is scaled into about 10-15 records with different PGA (Peak Ground Acceleration). The scaled records are then given to the single pile model after caring out the free-field response analysis so that the nonlinear dynamic analysis could be performed on the model. Each of the nonlinear dynamic analysis performed on the single pile represents a single point of the IDA graph.
Fig. 5: three of the first modes of the single pile model
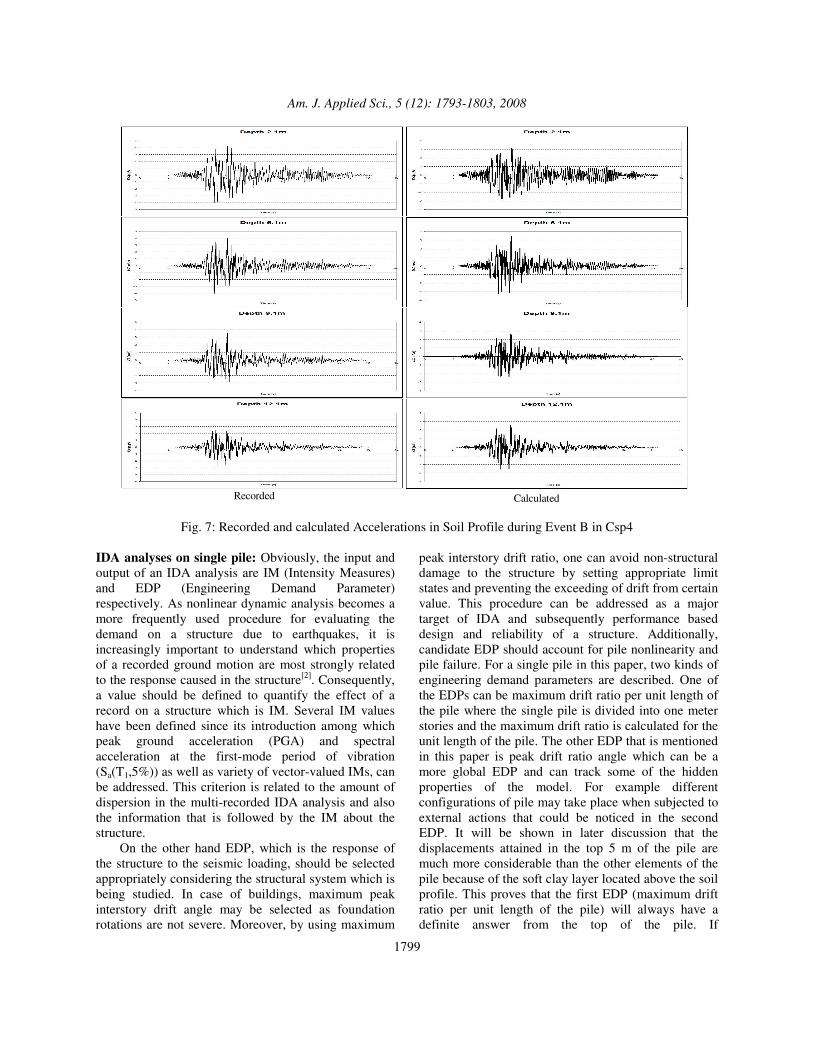
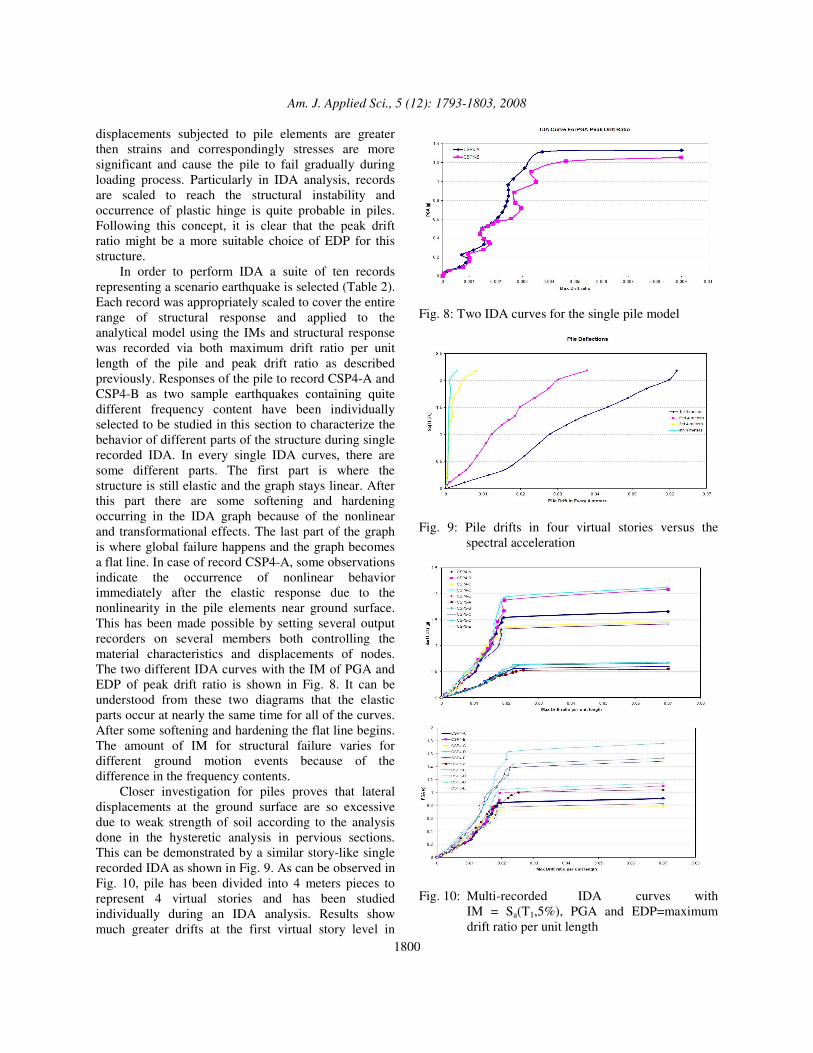
In this section a nonlinear dynamic analysis is performed for verification with the experimental centrifuge tests done by Wilson et al. (1997)[13]. The results of the centrifuge tests are available in detail in University of California at Davis website[18]. The earthquake event of CSP4-B is applied to the model in this section and the recorded and calculated acceleration time histories and spectral accelerations (ARS) for different depths are given in the following figures. It can be seen that the results attained from the centrifuge tests are in good agreement with the results of the model analyzed with OpenSEES. It can also be understood from these graphs that acceleration becomes greater when reaching a smaller depth. This means that the bedrock has the smallest and the ground surface has the lowest amount of acceleration. There is an exception about this fact when the properties of the soil changes from dense sand to soft soil. The recorded and calculated acceleration time histories are plotted in Fig. 6. The spectral accelerations (ARS) are shown in Fig. 7. It can be seen that, there is a good agreement between the calculated and recorded results. There is some difference in the response spectra graphs in periods smaller than 0.1 sec, which can be the noises that are available at the start of any event.
Fig. 6: Acceleration Response Spectra in Soil Profile during Event B in Csp4
Am. J. Applied Sci., 5 (12): 1793-1803, 2008
1799
Recorded Calculated
Fig. 7: Recorded and calculated Accelerations in Soil Profile during Event B in Csp4 IDA analyses on single pile: Obviously, the input and output of an IDA analysis are IM (Intensity Measures) and EDP (Engineering Demand Parameter) respectively. As nonlinear dynamic analysis becomes a more frequently used procedure for evaluating the demand on a structure due to earthquakes, it is increasingly important to understand which properties of a recorded ground motion are most strongly related to the response caused in the structure[2]. Consequently, a value should be defined to quantify the effect of a record on a structure which is IM. Several IM values have been defined since its introduction among which peak ground acceleration (PGA) and spectral acceleration at the first-mode period of vibration (Sa(T1,5%)) as well as variety of vector-valued IMs, can be addressed. This criterion is related to the amount of dispersion in the multi-recorded IDA analysis and also the information that is followed by the IM about the structure. On the other hand EDP, which is the response of the structure to the seismic loading, should be selected appropriately considering the structural system which is being studied. In case of buildings, maximum peak interstory drift angle may be selected as foundation rotations are not severe. Moreover, by using maximum
peak interstory drift ratio, one can avoid non-structural damage to the structure by setting appropriate limit states and preventing the exceeding of drift from certain value. This procedure can be addressed as a major target of IDA and subsequently performance based design and reliability of a structure. Additionally, candidate EDP should account for pile nonlinearity and pile failure. For a single pile in this paper, two kinds of engineering demand parameters are described. One of the EDPs can be maximum drift ratio per unit length of the pile where the single pile is divided into one meter stories and the maximum drift ratio is calculated for the unit length of the pile. The other EDP that is mentioned in this paper is peak drift ratio angle which can be a more global EDP and can track some of the hidden properties of the model. For example different configurations of pile may take place when subjected to external actions that could be noticed in the second EDP. It will be shown in later discussion that the displacements attained in the top 5 m of the pile are much more considerable than the other elements of the pile because of the soft clay layer located above the soil profile. This proves that the first EDP (maximum drift ratio per unit length of the pile) will always have a definite answer from the top of the pile. If
Am. J. Applied Sci., 5 (12): 1793-1803, 2008
1800
displacements subjected to pile elements are greater then strains and correspondingly stresses are more significant and cause the pile to fail gradually during loading process. Particularly in IDA analysis, records are scaled to reach the structural instability and occurrence of plastic hinge is quite probable in piles. Following this concept, it is clear that the peak drift ratio might be a more suitable choice of EDP for this structure. In order to perform IDA a suite of ten records representing a scenario earthquake is selected (Table 2). Each record was appropriately scaled to cover the entire range of structural response and applied to the analytical model using the IMs and structural response was recorded via both maximum drift ratio per unit length of the pile and peak drift ratio as described previously. Responses of the pile to record CSP4-A and CSP4-B as two sample earthquakes containing quite different frequency content have been individually selected to be studied in this section to characterize the behavior of different parts of the structure during single recorded IDA. In every single IDA curves, there are some different parts. The first part is where the structure is still elastic and the graph stays linear. After this part there are some softening and hardening occurring in the IDA graph because of the nonlinear and transformational effects. The last part of the graph is where global failure happens and the graph becomes a flat line. In case of record CSP4-A, some observations indicate the occurrence of nonlinear behavior immediately after the elastic response due to the nonlinearity in the pile elements near ground surface. This has been made possible by setting several output recorders on several members both controlling the material characteristics and displacements of nodes. The two different IDA curves with the IM of PGA and EDP of peak drift ratio is shown in Fig. 8. It can be understood from these two diagrams that the elastic parts occur at nearly the same time for all of the curves. After some softening and hardening the flat line begins. The amount of IM for structural failure varies for different ground motion events because of the difference in the frequency contents. Closer investigation for piles proves that lateral displacements at the ground surface are so excessive due to weak strength of soil according to the analysis done in the hysteretic analysis in pervious sections. This can be demonstrated by a similar story-like single recorded IDA as shown in Fig. 9. As can be observed in Fig. 10, pile has been divided into 4 meters pieces to represent 4 virtual stories and has been studied individually during an IDA analysis. Results show much greater drifts at the first virtual story level in
Fig. 8: Two IDA curves for the single pile model
Fig. 9: Pile drifts in four virtual stories versus the
spectral acceleration
Fig. 10: Multi-recorded IDA curves with
IM = Sa(T1,5%), PGA and EDP=maximum drift ratio per unit length
Am. J. Applied Sci., 5 (12): 1793-1803, 2008
1801
Fig. 11: Multi-recorded IDA curves with
IM = Sa(T1,5%), PGA and EDP=Peak drift ratio
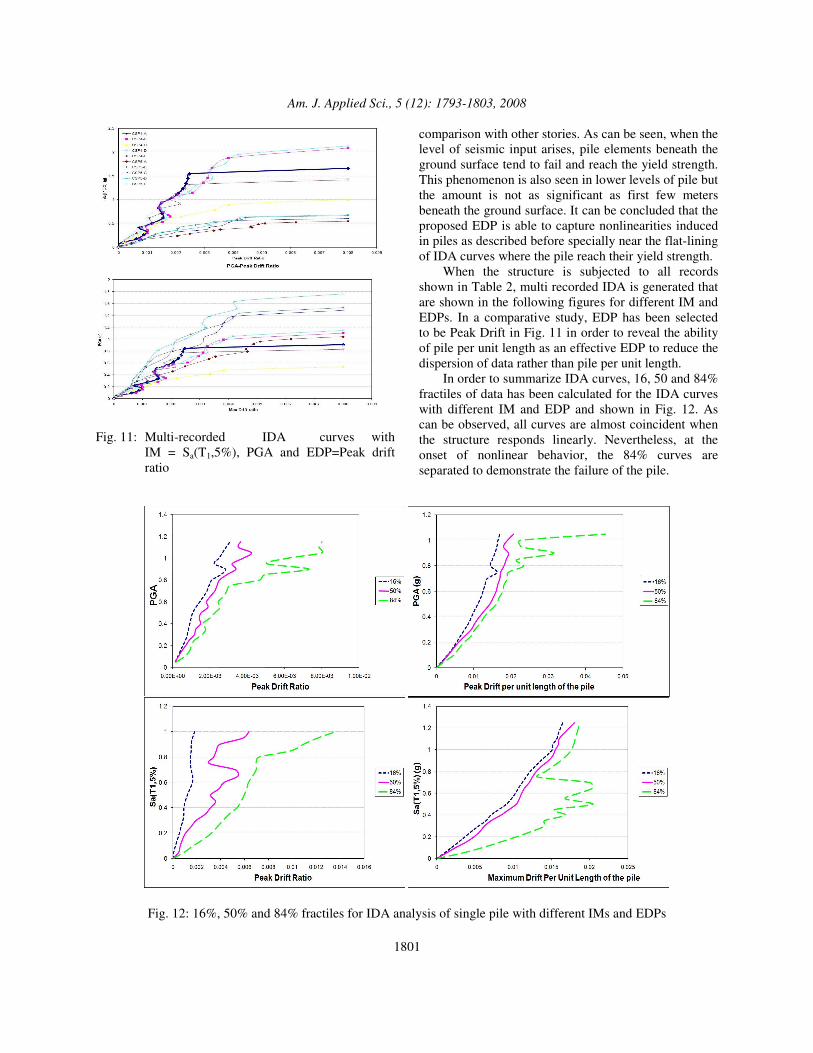
comparison with other stories. As can be seen, when the level of seismic input arises, pile elements beneath the ground surface tend to fail and reach the yield strength. This phenomenon is also seen in lower levels of pile but the amount is not as significant as first few meters beneath the ground surface. It can be concluded that the proposed EDP is able to capture nonlinearities induced in piles as described before specially near the flat-lining of IDA curves where the pile reach their yield strength. When the structure is subjected to all records shown in Table 2, multi recorded IDA is generated that are shown in the following figures for different IM and EDPs. In a comparative study, EDP has been selected to be Peak Drift in Fig. 11 in order to reveal the ability of pile per unit length as an effective EDP to reduce the dispersion of data rather than pile per unit length. In order to summarize IDA curves, 16, 50 and 84% fractiles of data has been calculated for the IDA curves with different IM and EDP and shown in Fig. 12. As can be observed, all curves are almost coincident when the structure responds linearly. Nevertheless, at the onset of nonlinear behavior, the 84% curves are separated to demonstrate the failure of the pile.
Fig. 12: 16%, 50% and 84% fractiles for IDA analysis of single pile with different IMs and EDPs
Am. J. Applied Sci., 5 (12): 1793-1803, 2008
1802
Results of summarized IDA for two different EDPs have been compared to study the differences between them. 16, 50 and 84% fractiles[1] have been calculated using both peak drift as well as maximum drift per unit length of pile as EDP. Obviously no apparent difference is seen when the intensity of seismic input is low but as IM arises, differences appears to be significant. In previous section, it was discussed that in the vicinity of PGA equal to 1g, piles reach their yield stress and loose strength and resistance rapidly and cause higher drifts. These drifts when incorporated into overall drift of the structure, show greater responses and cause instability sooner. Because of the high dispersion in the IDA curves with the IM of Sa(T1,5%), the fractiles of these curves are more dispersed, specially the 84% fractile.
CONCLUSION In this research incremental dynamic analysis has been performed on single piles which are one of the most vital parts of an offshore platform. Incremental dynamic analysis is a powerful tool for assessment of structures. It reveals dynamic characteristics of structures and provides useful information for performance based engineering and reliability of structures if suitable limit state values are defined. Powerful and verified element models were used to obtain the best simulation of the real structure. Moreover, analysis steps were accurately organized so that unwanted numerical instability problems are avoided. Soil-Pile interaction and nonlinear pile elements were completely described and used throughout the paper using the centrifuge test results available to the authors. Using nonlinear pile model, peak drift as a suitable engineering demand parameter was compared against other types of Engineering Demand Parameters. It was shown that regarding the structure application, peak drift can be utilized to account for both drifts per unit length as well as pile nonlinearity. Furthermore, setting appropriate limit states to establish a probabilistic database in order to assess the performance of the single piles needs further investigations and will be a suitable guide for the design of offshore structures.
REFERENCES 1. Vamvatsikos, D. and C.A. Cornell, 2000. Seismic
performance, capacity and reliability of structures as seen through incremental dynamic analysis. Report No. RMS-55, RMS Program, Stanford University, Stanford.
2. Baker, J. and C.A. Cornell, 2005. A Vector-Valued Ground Motion Intensity Measure for Probabilistic seismic demand analysis, Report No. RMS-89, Stanford University, Stanford.
3. Matlock, H., 1970. Correlations for design of laterally loaded piles in soft clay. Proc. 2nd Annual Offshore Technology Conference, 1: 577-594.
4. Kagawa, T. and L.M. Kraft, 1980. Soil-pile-structure interaction of offshore structures during an earthquake. Proceeding, 12th Annual Offshore Technology Conference, 3: 235-245.
5. Nogami, T., J. Otani, K. Konagai and H.L. Chen, 1992. Nonlinear soil-pile interaction model for dynamic lateral motion. J. Geotechnical Eng., ASCE, 118 (1): 89-106.
6. Angelides, D.C. and J.M. Roesset, 1980. Nonlinear dynamic stiffness of piles. Research Report R80-13, Dept. of Civil Eng., MIT, Cambridge, Massachusetts.
7. Sanchez, S.I., 1982. Static and dynamic stiffnesses of single piles, Research Report GR82-31. Dept. of Civil Eng., The University of Texas at Austin, Austin, Texas.
8. Trochanis, A.M., J. Bielak and P. Christiano, 1991. Simplified model for analysis of one or two piles. J. Geotechnical Eng., ASCE., 117 (3): 448-466.
9. Wang, S., B. Kutter, J. Chacko, D. Wilson, R. Boulanger and A. Abghari 1998. Nonlinear seismic soil-pile-structure interaction. Earthquake spectra, 14 (2): 377-396.
10. Elgamal, A., Z. Yang and E. Parra, 2002. Computational modeling of cyclic mobility and post-liquefaction site response. Soil Dynamic Earthquake Engineering, 22 (4): 259-271.
11. Mazzoni, S., F. McKenna, M. Scott and G. Fenves, 2006. OpenSEES Command Language Manual. 19th July.
12. Kutter, B.L., I.M. Idriss, T. Kohnke, J. Lakeland, X.S. Li, W. Sluis, X. Zeng, R. Tauscher, Y. Goto and I. Kubodera, 1994. Design of a large earthquake simulator at UC Davis. Proceedings Centrifuge 94, Leung, Lee and Tan, Eds., Balkema, Rotterdam, pp: 169-175.
13. Wilson, D.W., 1998. Soil-pile-superstructure interaction in liquefying sand and soft clay. Report No. UCD/CGM-98/04, Center for geotechnical modeling, University of California at Davis.
14. Neuenhofer, A. and F.C. Filippou, 2000. Geometrically nonlinear flexibility-based frame finite element. J. Struct. Engrg. ASCE. 1998, 124: 704-711.
Am. J. Applied Sci., 5 (12): 1793-1803, 2008
1803
15. Boulanger, R.W., B.L. Kutter, S.J. Brandenberg, P. Singh and D. Chang, 2003. Pile foundations in liquefied and laterally spreading ground during earthquakes: Centrifuge experiments and analyses. Report UCD/CGM-03/01, Center for Geotechnical Modeling, Univ. of California, Davis, CA, pp: 205.
16. API, 1993. Recommended Practice for Planning, Design and Constructing Fixed Offshore Platforms. API RP 2A-WSD, 20th Edn., American Petroleum Institute.
17. Berger, E., S.A. Mahin and R. Pyke, 1977. Simplified method for evaluating soil-pile-structure interaction effect. Proceedings of the 9th offshore technology conference, OTC paper 2954, Huston, Texas, 589-598.
18. U.C., Davis website http://nees.ucdavis.edu.