Embed Size (px)
Citation preview
American Journal of Applied Sciences 11 (5): 769-781, 2014 ISSN: 1546-9239 ©2014 Science Publication doi:10.3844/ajassp.2014.769.781 Published Online 11 (5) 2014 (http://www.thescipub.com/ajas.toc)
Corresponding Author: S. Anbumozhi, Department of ECE, Raja College of Engineering and Technology, Tamil Nadu 625 020, India
769 Science Publications
AJAS
PERFORMANCE ANALYSIS OF HIGH EFFICIENT AND LOW POWER ARCHITECTURE FOR FUZZY BASED IMAGE FUSION
1S. Anbumozhi and 2P.S. Manoharan
1Department of ECE, Raja College of Engineering and Technology, Tamil Nadu 625 020, India 2Department of EEE, Thiagarajar College of Engineering, Madurai 625 015, India
Received 2014-01-22; Revised 2014-02-01; Accepted 2014-02-21
ABSTRACT
Image fusion based on wavelet transform is the most commonly used image fusion method, which fuses the source images’ information in wavelet domain according to some fusion rules. But because of the uncertainties of the source images’ contributions to the fused image, how to design a good fusion rule to integrate as much information as possible into the fused image becomes the most important problem. This study proposed a image fusion algorithm based on wavelet transform and fuzzy reasoning. The edges in source images are detected using set of fuzzy rules. The hardware architecture for fuzzy based image fusion is proposed. This proposed hardware architecture reduces the hardware utilizations and best suitable for low power applications. The design possesses only two line memory buffers with very low computational complexity, thereby reducing the hardware cost and appropriate for several real-time applications. The proposed hardware architecture consumes 4179 gates and power consumption of 203.27 mW. Keywords: Fuzzy Reasoning, Fuzzy Rules, Image Fusion, Low Power
1. INTRODUCTION
Image fusion is a tool to combine multimodal images by using image processing techniques. Specifically it aims at the integration of disparate and complementary data in order to enhance the information apparent in the images, as well as to increase the reliability of the interpretation. This leads to more accurate data and increased utility. In addition, it has been stated that fused data provides for robust operational performance such as increased confidence, reduced ambiguity, improved reliability and improved classification. Image fusion is a procedure that aims at the integration of disparate and complementary data to enhance the information present in the source images as well as to increase the reliability of the interpretation. This process leads to more accurate data interpretation and utility.
A fusion process is nothing but a combination of salient information in order to synthesize an image with more information than individual image and synthesized
image is more suitable for visual perception. We use the term image fusion to denote a process by which multiple images or information from multiple images is combined. These images may be obtained from different types of sensors. With the availability of the multisensor data in many fields, such as remote sensing, medical imaging or machine vision, image fusion has emerged as a promising and important research area. In other words, Image fusion is a process of combining multiple input images of the same scene into a single fused image, which preserves full content information and also retaining the important features from each of the original images. The fused image should have more useful information content compared to the individual image. As far as the knowledge of the author, none of the image fusion method has been reported which deals with multi focus and multi modal images simultaneously.
So in this study we propose a novel region based image fusion algorithm for multifocus and multimodal images which also overcomes the limitations of different approaches.
S. Anbumozhi and P.S. Manoharan / American Journal of Applied Sciences 11 (5): 769-781, 2014
770 Science Publications
AJAS
2. RELATED WORKS
An algorithm based on Lifting Wavelet Transform (LWT) has been proposed in Gonzalez et al. (2013) to fuse multi-modality medical images. LWT allows in-place implementation of wavelet transform thereby reducing the memory requirement and computational time. LWT ensures faster image fusion. Also, a local feature-based fusion rule to extract features from multi-source images and improve fusion quality has been employed. Several experimentations were performed for the fusion of registered medical CT/MRI, CT/SPECT, MRI/PET images. Their results showed that their scheme has a good performance to fuse medical images effectively.
Bhatnagar et al. (2013) presented a fusion technique based on Non-Sub sampled Contourlet Transform (NSCT). The source medical images are first transformed by NSCT followed by combining low- and high-frequency components. Two different fusion rules based on phase congruency and directive contrast are proposed and used to fuse low- and high-frequency coefficients. Finally, the fused image is constructed by the inverse NSCT with all composite coefficients. Experimental results and comparative study show that the proposed fusion framework provides an effective way to enable more accurate analysis of multimodality images. Further, the applicability of the proposed framework is carried out by the three clinical examples of persons affected with Alzheimer, sub-acute stroke and recurrent tumor.
Rana and Arora (2013) explored different medical image fusion methods and their comparison to find out which fusion method gives better results based on the performance parameters. Here medical images of Magnetic Resonance Imaging (MRI) and Computed Tomography (CT) images are fused to form new image. This new fused image improves the information content for diagnosis. Fusing MRI and CT images provide more information to doctors and clinical treatment planning system. MRI provides better information on soft tissues whereas CT provides better information on denser tissues. Fusing these two images gives more information than single input image. In this study, wavelet transform, Principle Component Analysis (PCA) and Fuzzy Logic techniques are utilized for fusing these two images and results are compared. The fusion performance is evaluated on the basis of Root Mean Square Error (RMSE), Peak Signal to Noise Ratio (PSNR) and Entropy (H).
A wavelet-based medical image fusion scheme was proposed by Yang et al. (2010). The medical images to be fused are decomposed by the wavelet transform and then different fusion schemes are employed to combine the wavelet coefficients, i.e., visibility-based method for coefficients in low-frequency band and variance-based scheme for coefficients in high-frequency band. Then, a window-based reliability verification process is done to remove the noise and guarantee the homogeneity of the fused image. The inverse wavelet transform with all the complex wavelet coefficients gives the fused image. Experiments on simulated and real medical images were done and compared with existing methods to prove that the proposed method is effective than other fusion techniques.
Arunmozhi and Mohan (2013) has proposed a fusion algorithm based on wavelet decomposition methodology to fuse the hyper spectral images.This method has provided lower PSNR value in terms of image quality. Chen et al. (2011) has developed low-cost high-quality adaptive scalar processing technique for real-time multimedia applications. This method consumed more power due ti its complex architecture design. Jacobson et al. (2007) has developed a technique such as linear fusion of image sets for display. This methodology provided optimum enhancement of image sets for image fusion. Nagarajan et al. (2010) has proposed scalable approach to fusing spatiotemporal data to estimate streamflow via a Bayesian network. Tsagaris et al. (2005) has introduced fusion technique of hyperspectral data using segmented PCT for enhanced color representation.
An image fusion technique based on discrete wavelet transform using high boost filtering was proposed in Zaveri et al. (2011). The proposed algorithm achieved an accurate segmentation for region-based fusion using graph based normalized cut algorithm. The regions were extracted from the input registered source images using the resultant segmented image. Then the extracted regions were processed to fuse different regions using different fusion rules. The method was implemented on various registered images of multi-focus and multimodality categories and the fusion results were compared using standard reference based and non-reference based image fusion parameters. It has been observed from simulation results that the algorithm was consistent and preserved more information compared to earlier reported pixel based and region based fusion methods. Based and region based fusion methods.
S. Anbumozhi and P.S. Manoharan / American Journal of Applied Sciences 11 (5): 769-781, 2014
771 Science Publications
AJAS
3. PROPOSED FUSION ALGORITHM
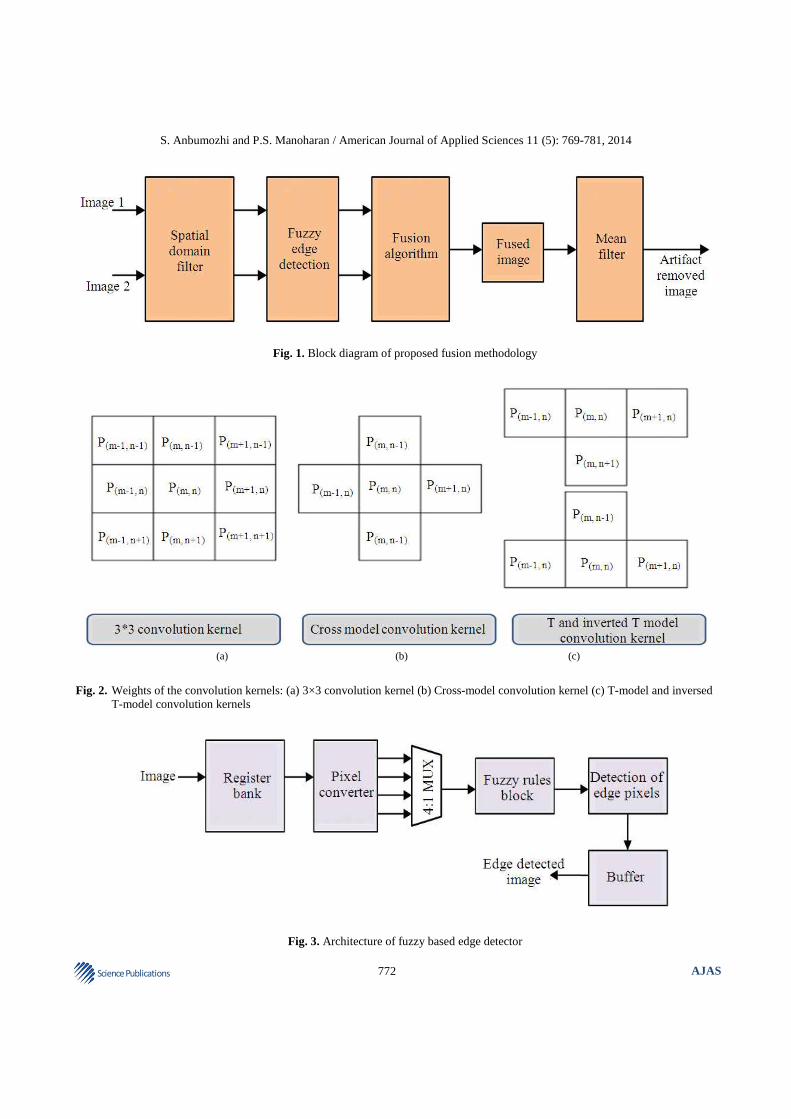
Figure 1 shows the block diagram of the proposed fusion algorithm. It consists of a spatial domain filter, fuzzy based edge detector, fusion block and mean filter. The spatial domain filter serves as a pre-filter to reduce blurring and aliasing artifacts produced by the bilinear interpolation. First, the input pixels of the original images are filtered by the spatial filter to enhance the edges and remove associated noise. Second, the filtered pixels are filtered again to smooth unwanted discontinuous edges of the boundary regions. Finally, the edge detected images are fused into a single image and artifacts present in it are removed using the mean filter. The details of each part will be described in the following sections.
3.1. Spatial Domain Filter
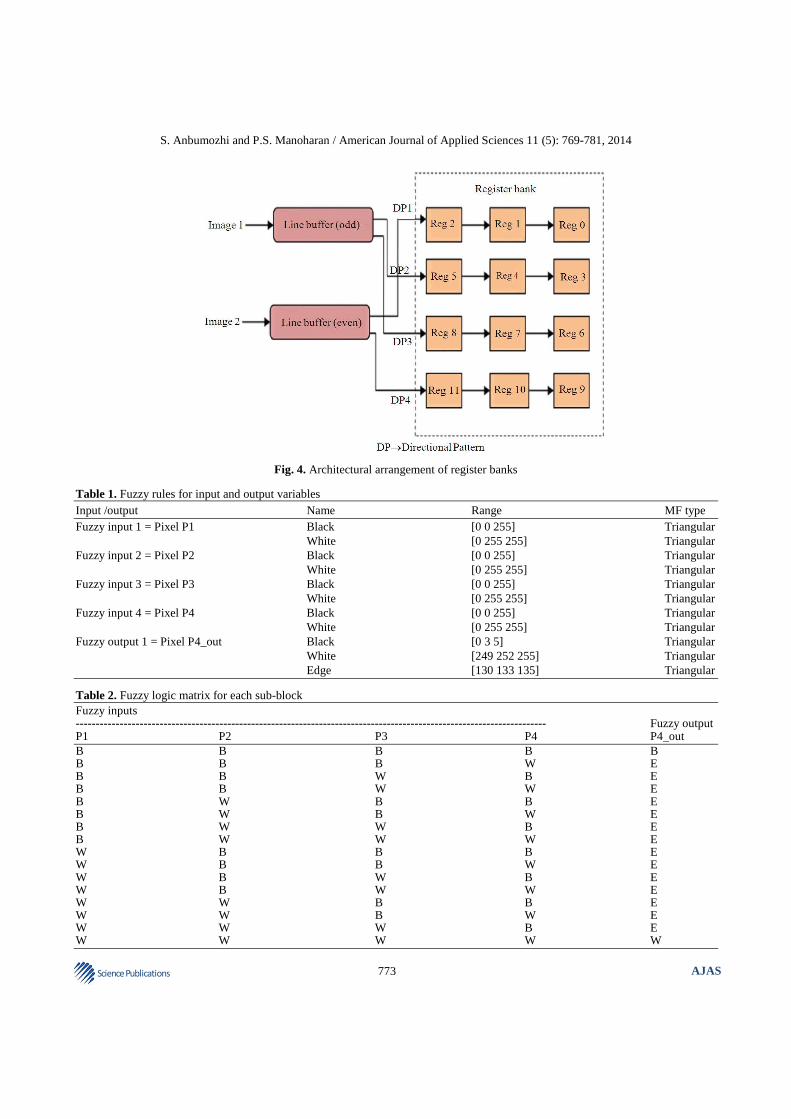
The spatial filter is a kind of high-pass filter and is used to reduce blurring artifacts. It is defined by a kernel to increase the intensity of a centre pixel relative to its neighboring pixels. The clamp filter, a kind of low-pass filter, is a 2-D Gaussian spatial domain filter and composed of a convolution kernel array. It usually contains a single positive value at the centre and is completely surrounded by ones. The clamp filter is used to reduce aliasing artifacts and smooth the unwanted discontinuous edges of the boundary regions. The sharpening spatial and clamp filters can be represented by convolution kernels. A larger size of convolution kernel will produce higher quality of images. However, a larger size of convolution filter will also demand more memory and hardware cost. For example, a 6×6 convolution filter demands at least a five-line-buffer memory and 36 arithmetic units, which is much more than the two-line-buffer memory and nine arithmetic units of a 3×3 convolution filter. In our previous work, each of the sharpening spatial and clamp filters was realized by a 2-D 3×3 convolution kernel as shown in Fig. 2a. It demands at least a four-line-buffer memory for two 3×3 convolution filters. For example, if the image width is 1920 pixels, 4×1920×8 bits of data should be buffered in memory as input for processing. To reduce the complexity of the 3×3 convolution kernel, a cross-model formed is used to replace the 3×3 convolution kernel, as shown in Fig. 2b. It successfully cuts down on four of nine parameters in the 3×3 convolution kernel.
Furthermore, to decrease more complexity and memory requirement of the cross-model convolution kernel, T-model and inversed T-model convolution kernels are proposed for realizing the sharpening spatial and clamp filters. As shown in Fig. 2c, the T-model
convolution kernel is composed of the lower four parameters of the cross-model and the inversed T-model convolution kernel is composed of the upper four parameters. In the proposed scaling algorithm, both the T-model and inversed T-model filters are used to improve the quality of the images simultaneously.
The T-model or inversed T-model filter is simplified from the 3×3 convolution filter of the previous work (Chan et al., 2011), which not only efficiently reduces the complexity of the convolution filter but also greatly decreases the memory requirement from two to one line buffer for each convolution filter. The T-model and the inversed T-model provide the low-complexity and low memory-requirement convolution kernels for the sharpening spatial and clamp filters to integrate the VLSI chip of the proposed low-cost image scaling processor.
3.2. Fuzzy Edge Detector
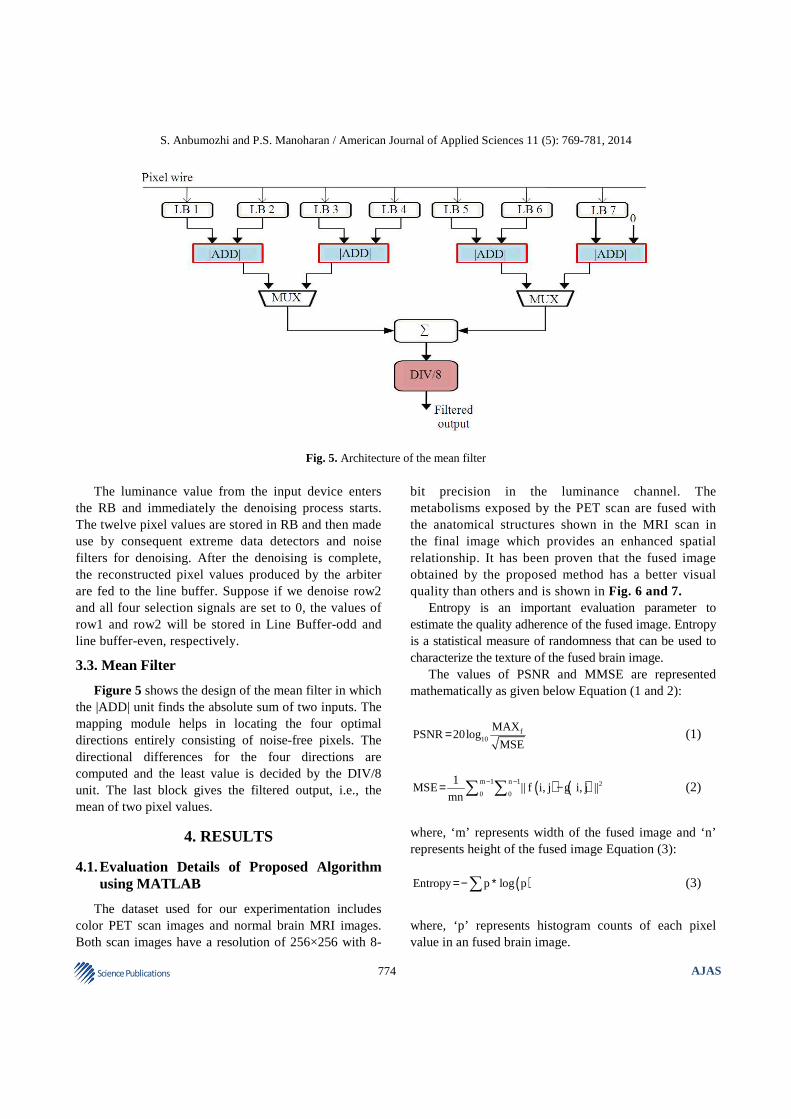
The edges of the image are detected based on fuzzy rules formulated. Figure 3 illustrates the edge detection procedure based on fuzzy rule formulation.
3.2.1. Fuzzy Logic Matrix
Fuzzy is a set or combination of rules and decisions. The proposed fuzzy system is designed with 4 inputs and a single output, such that the 4 inputs indicate the 4 pixels present in the window mask. In this, the number of fuzzy sets used for the input Black and White is 2 and for the output, 3 fuzzy sets are used. The Fuzzy rules are formulated as shown in Table 1 for the input and output variables.
The accuracy level of edge detection in the image will be improved by using fuzzy logic. 16 Fuzzy rules are constructed for every 2×2 pixel sub-block. The output value indicates to which fuzzy set (Black fuzzy set, White fuzzy set or Edge fuzzy set) the output pixel ‘P4’ belongs to. The fuzzy matrix is shown in Table 2. The notation ‘B’ represents black pixel and ‘W’ represents white pixel and ‘E’ represents edge pixel. For the construction of 2×2 sub block, the edge pixel is noted if any pixel variation occurs in this sub-block.
3.2.2. Register Bank
The Register Bank (RB) includes 12 registers-Reg0 to Reg11, which stores the 3×3 pixel values of the current mask. Figure 4 illustrates the arrangement of RB in which each 3 registers are connected in series to provide three pixel values of a row in mask and Reg4 keeps the luminance value of the current pixel to be denoised.
S. Anbumozhi and P.S. Manoharan / American Journal of Applied Sciences 11 (5): 769-781, 2014
772 Science Publications
AJAS
Fig. 1. Block diagram of proposed fusion methodology
(a) (b) (c)
Fig. 2. Weights of the convolution kernels: (a) 3×3 convolution kernel (b) Cross-model convolution kernel (c) T-model and inversed
T-model convolution kernels
Fig. 3. Architecture of fuzzy based edge detector
S. Anbumozhi and P.S. Manoharan / American Journal of Applied Sciences 11 (5): 769-781, 2014
773 Science Publications
AJAS
Fig. 4. Architectural arrangement of register banks Table 1. Fuzzy rules for input and output variables Input /output Name Range MF type Fuzzy input 1 = Pixel P1 Black [0 0 255] Triangular White [0 255 255] Triangular Fuzzy input 2 = Pixel P2 Black [0 0 255] Triangular White [0 255 255] Triangular Fuzzy input 3 = Pixel P3 Black [0 0 255] Triangular White [0 255 255] Triangular Fuzzy input 4 = Pixel P4 Black [0 0 255] Triangular White [0 255 255] Triangular Fuzzy output 1 = Pixel P4_out Black [0 3 5] Triangular White [249 252 255] Triangular Edge [130 133 135] Triangular Table 2. Fuzzy logic matrix for each sub-block Fuzzy inputs ---------------------------------------------------------------------------------------------------------------------- Fuzzy output P1 P2 P3 P4 P4_out B B B B B B B B W E B B W B E B B W W E B W B B E B W B W E B W W B E B W W W E W B B B E W B B W E W B W B E W B W W E W W B B E W W B W E W W W B E W W W W W
S. Anbumozhi and P.S. Manoharan / American Journal of Applied Sciences 11 (5): 769-781, 2014
774 Science Publications
AJAS
Fig. 5. Architecture of the mean filter
The luminance value from the input device enters the RB and immediately the denoising process starts. The twelve pixel values are stored in RB and then made use by consequent extreme data detectors and noise filters for denoising. After the denoising is complete, the reconstructed pixel values produced by the arbiter are fed to the line buffer. Suppose if we denoise row2 and all four selection signals are set to 0, the values of row1 and row2 will be stored in Line Buffer-odd and line buffer-even, respectively.
3.3. Mean Filter
Figure 5 shows the design of the mean filter in which the |ADD| unit finds the absolute sum of two inputs. The mapping module helps in locating the four optimal directions entirely consisting of noise-free pixels. The directional differences for the four directions are computed and the least value is decided by the DIV/8 unit. The last block gives the filtered output, i.e., the mean of two pixel values.
4. RESULTS
4.1. Evaluation Details of Proposed Algorithm using MATLAB
The dataset used for our experimentation includes color PET scan images and normal brain MRI images. Both scan images have a resolution of 256×256 with 8-
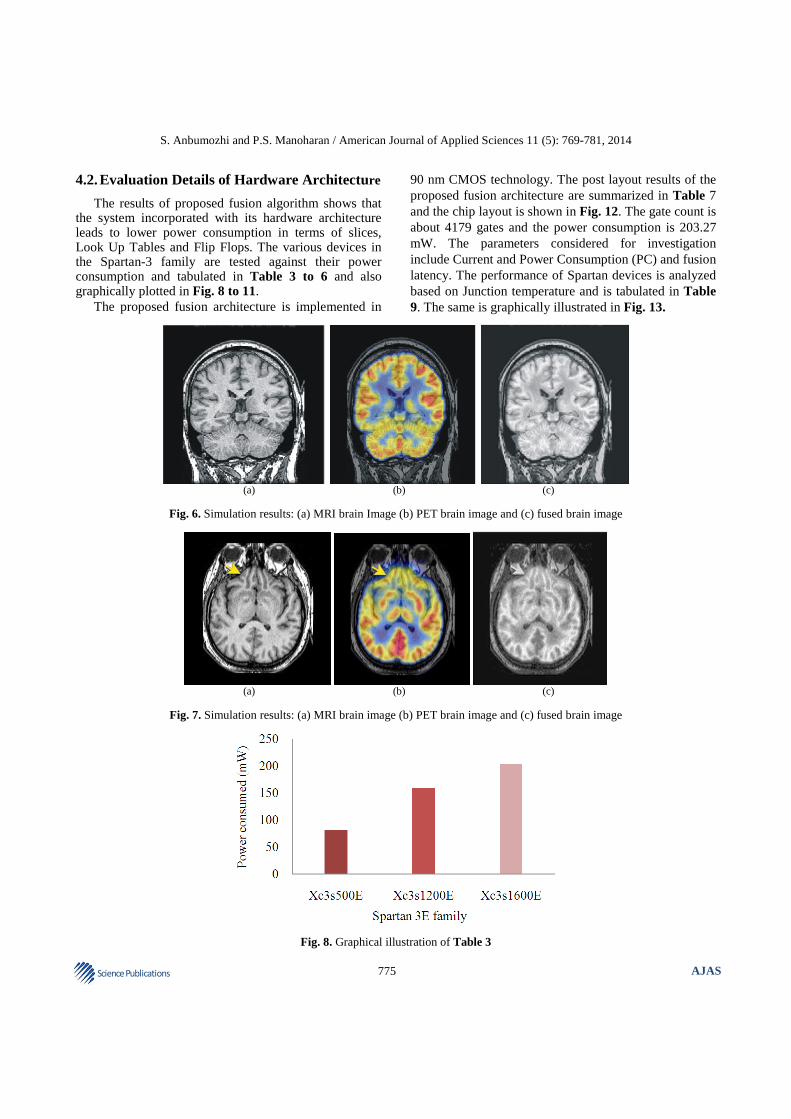
bit precision in the luminance channel. The metabolisms exposed by the PET scan are fused with the anatomical structures shown in the MRI scan in the final image which provides an enhanced spatial relationship. It has been proven that the fused image obtained by the proposed method has a better visual quality than others and is shown in Fig. 6 and 7.
Entropy is an important evaluation parameter to estimate the quality adherence of the fused image. Entropy is a statistical measure of randomness that can be used to characterize the texture of the fused brain image.
The values of PSNR and MMSE are represented mathematically as given below Equation (1 and 2):
10fMAX
PSNR 20logMSE
= (1)
( ) ( ) 2
0 0
m 1 n 11MSE || f i, j g i, j ||
mn
− −= −∑ ∑ (2)
where, ‘m’ represents width of the fused image and ‘n’ represents height of the fused image Equation (3):
( )Entropy p log p=− ∗∑ (3)
where, ‘p’ represents histogram counts of each pixel value in an fused brain image.
S. Anbumozhi and P.S. Manoharan / American Journal of Applied Sciences 11 (5): 769-781, 2014
775 Science Publications
AJAS
4.2. Evaluation Details of Hardware Architecture
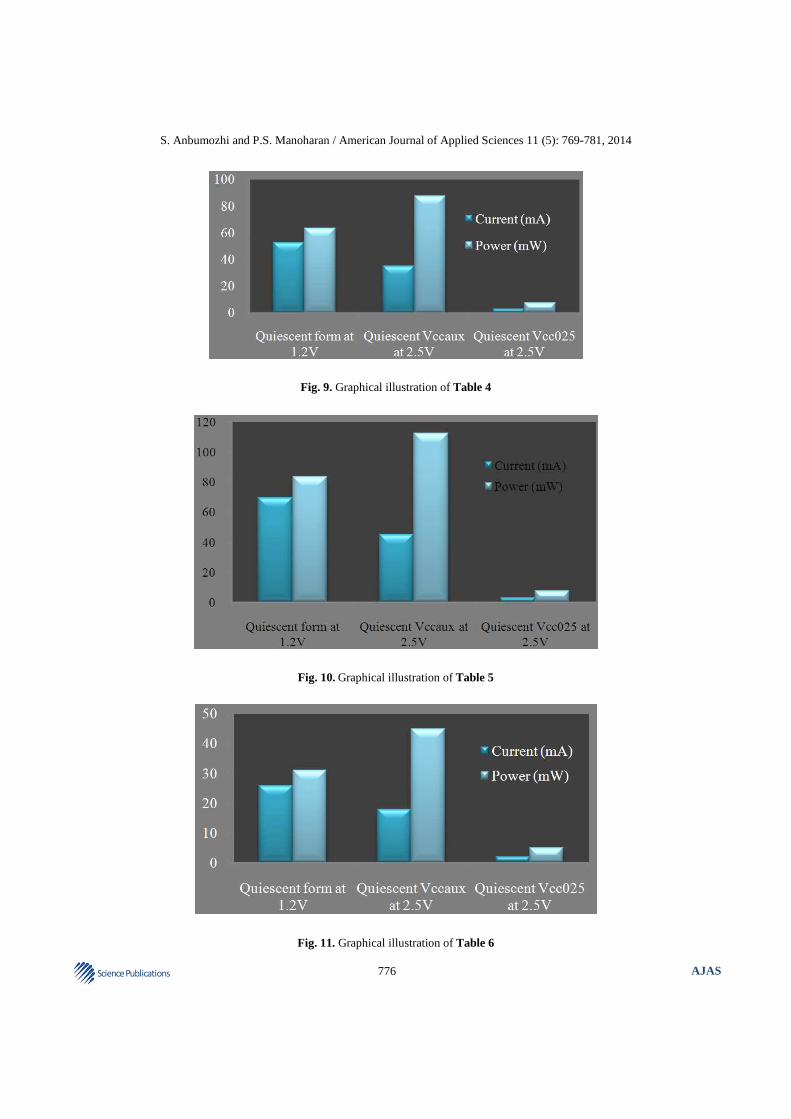
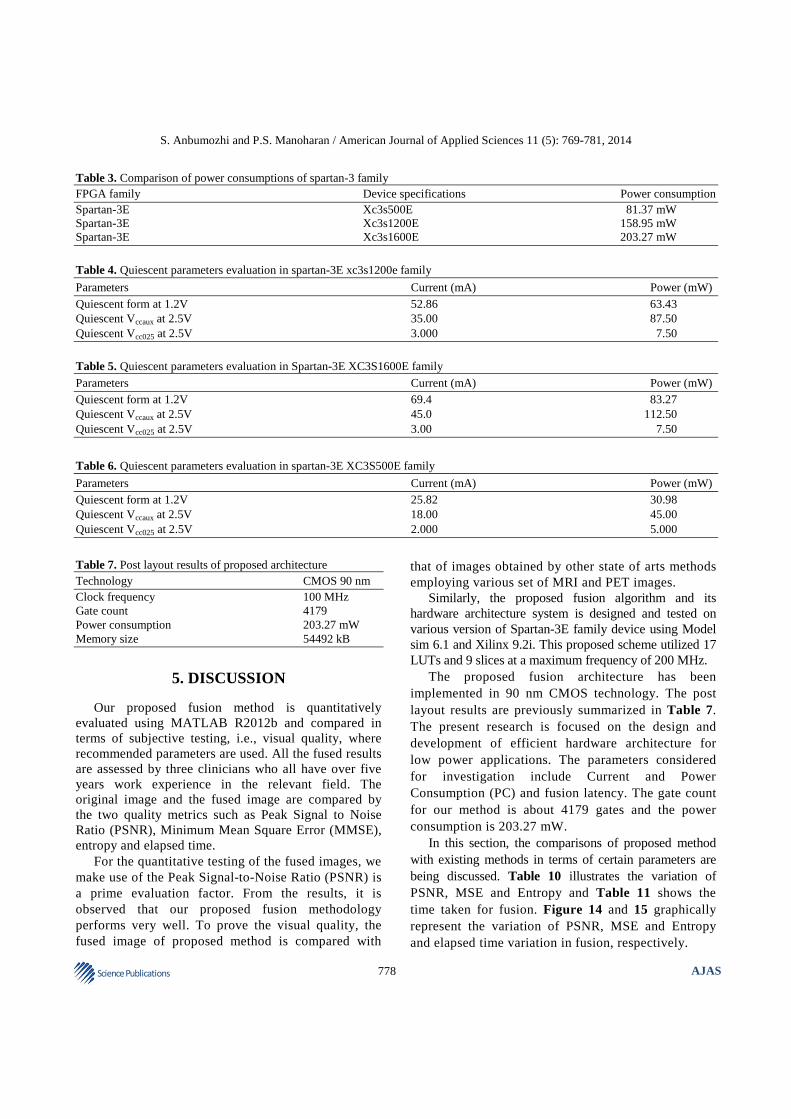
The results of proposed fusion algorithm shows that the system incorporated with its hardware architecture leads to lower power consumption in terms of slices, Look Up Tables and Flip Flops. The various devices in the Spartan-3 family are tested against their power consumption and tabulated in Table 3 to 6 and also graphically plotted in Fig. 8 to 11.
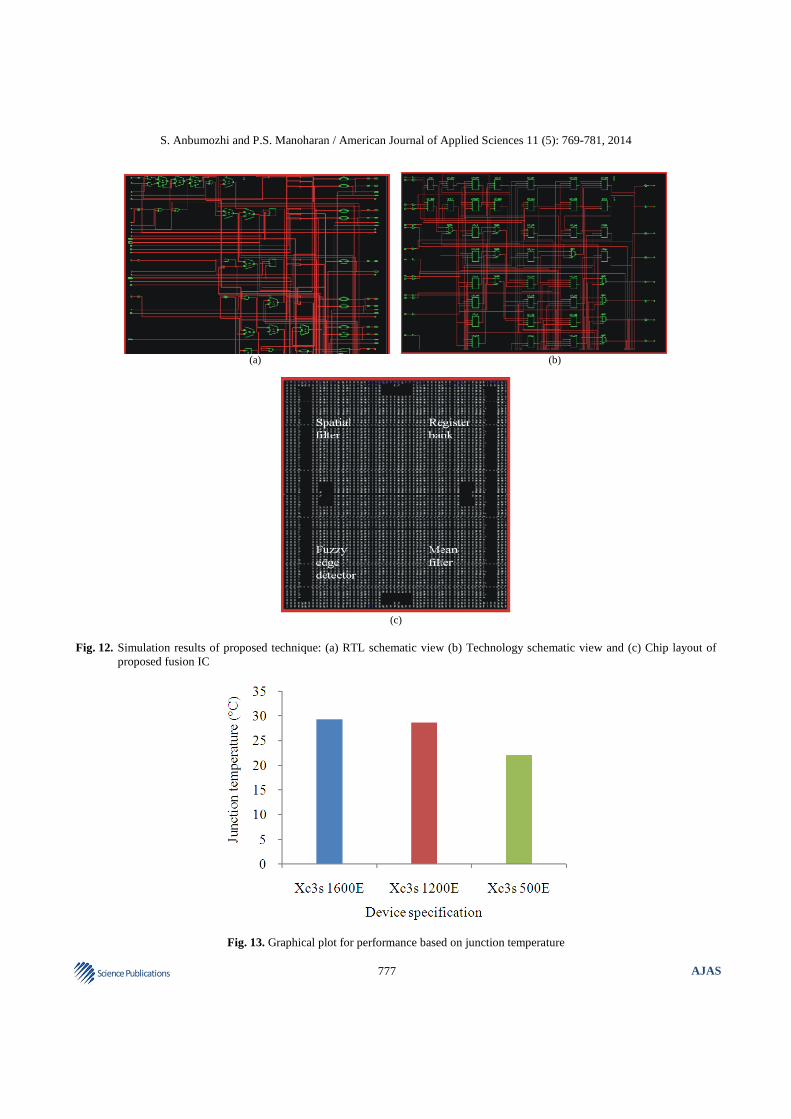
The proposed fusion architecture is implemented in
90 nm CMOS technology. The post layout results of the proposed fusion architecture are summarized in Table 7 and the chip layout is shown in Fig. 12. The gate count is about 4179 gates and the power consumption is 203.27 mW. The parameters considered for investigation include Current and Power Consumption (PC) and fusion latency. The performance of Spartan devices is analyzed based on Junction temperature and is tabulated in Table 9. The same is graphically illustrated in Fig. 13.
(a) (b) (c)
Fig. 6. Simulation results: (a) MRI brain Image (b) PET brain image and (c) fused brain image
(a) (b) (c)
Fig. 7. Simulation results: (a) MRI brain image (b) PET brain image and (c) fused brain image
Fig. 8. Graphical illustration of Table 3
S. Anbumozhi and P.S. Manoharan / American Journal of Applied Sciences 11 (5): 769-781, 2014
776 Science Publications
AJAS
Fig. 9. Graphical illustration of Table 4
Fig. 10. Graphical illustration of Table 5
Fig. 11. Graphical illustration of Table 6
S. Anbumozhi and P.S. Manoharan / American Journal of Applied Sciences 11 (5): 769-781, 2014
777 Science Publications
AJAS
(a) (b)
(c)
Fig. 12. Simulation results of proposed technique: (a) RTL schematic view (b) Technology schematic view and (c) Chip layout of
proposed fusion IC
Fig. 13. Graphical plot for performance based on junction temperature
S. Anbumozhi and P.S. Manoharan / American Journal of Applied Sciences 11 (5): 769-781, 2014
778 Science Publications
AJAS
Table 3. Comparison of power consumptions of spartan-3 family FPGA family Device specifications Power consumption Spartan-3E Xc3s500E 81.37 mW Spartan-3E Xc3s1200E 158.95 mW Spartan-3E Xc3s1600E 203.27 mW
Table 4. Quiescent parameters evaluation in spartan-3E xc3s1200e family
Parameters Current (mA) Power (mW) Quiescent form at 1.2V 52.86 63.43 Quiescent Vccaux at 2.5V 35.00 87.50 Quiescent Vcc025 at 2.5V 3.000 7.50
Table 5. Quiescent parameters evaluation in Spartan-3E XC3S1600E family
Parameters Current (mA) Power (mW) Quiescent form at 1.2V 69.4 83.27 Quiescent Vccaux at 2.5V 45.0 112.50 Quiescent Vcc025 at 2.5V 3.00 7.50
Table 6. Quiescent parameters evaluation in spartan-3E XC3S500E family
Parameters Current (mA) Power (mW) Quiescent form at 1.2V 25.82 30.98 Quiescent Vccaux at 2.5V 18.00 45.00 Quiescent Vcc025 at 2.5V 2.000 5.000
Table 7. Post layout results of proposed architecture Technology CMOS 90 nm Clock frequency 100 MHz Gate count 4179 Power consumption 203.27 mW Memory size 54492 kB
5. DISCUSSION
Our proposed fusion method is quantitatively evaluated using MATLAB R2012b and compared in terms of subjective testing, i.e., visual quality, where recommended parameters are used. All the fused results are assessed by three clinicians who all have over five years work experience in the relevant field. The original image and the fused image are compared by the two quality metrics such as Peak Signal to Noise Ratio (PSNR), Minimum Mean Square Error (MMSE), entropy and elapsed time.
For the quantitative testing of the fused images, we make use of the Peak Signal-to-Noise Ratio (PSNR) is a prime evaluation factor. From the results, it is observed that our proposed fusion methodology performs very well. To prove the visual quality, the fused image of proposed method is compared with
that of images obtained by other state of arts methods employing various set of MRI and PET images.
Similarly, the proposed fusion algorithm and its hardware architecture system is designed and tested on various version of Spartan-3E family device using Model sim 6.1 and Xilinx 9.2i. This proposed scheme utilized 17 LUTs and 9 slices at a maximum frequency of 200 MHz.
The proposed fusion architecture has been implemented in 90 nm CMOS technology. The post layout results are previously summarized in Table 7. The present research is focused on the design and development of efficient hardware architecture for low power applications. The parameters considered for investigation include Current and Power Consumption (PC) and fusion latency. The gate count for our method is about 4179 gates and the power consumption is 203.27 mW.
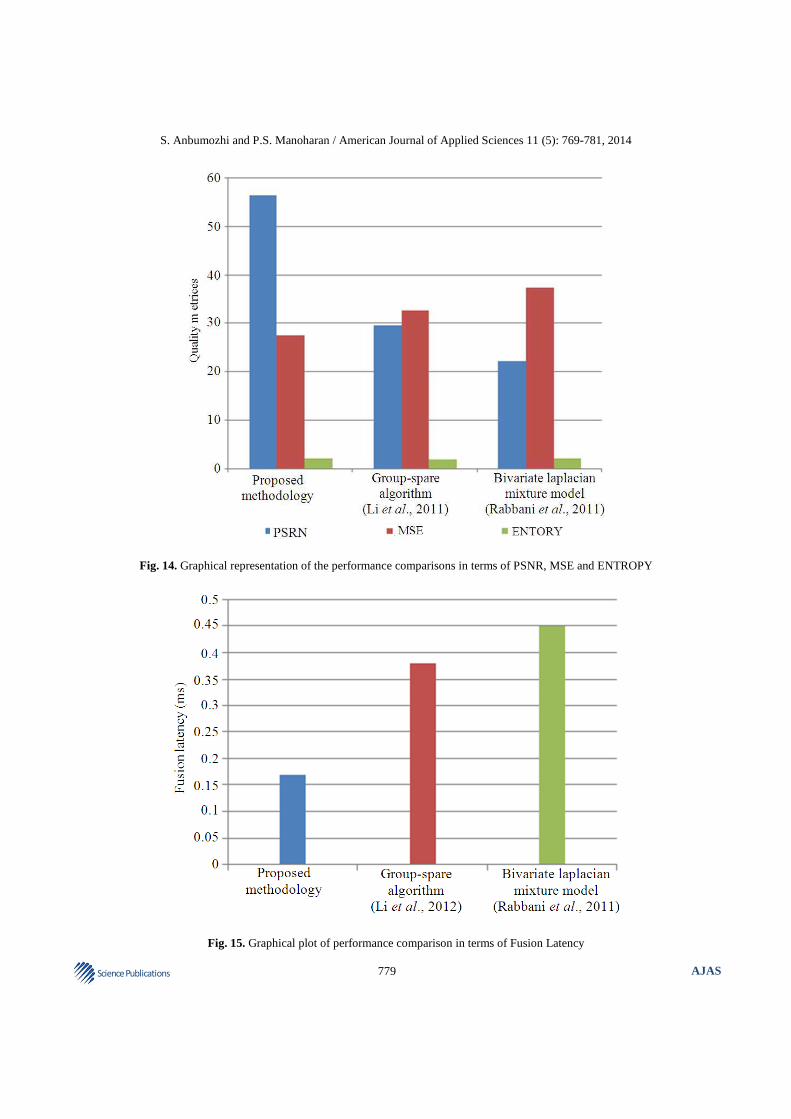
In this section, the comparisons of proposed method with existing methods in terms of certain parameters are being discussed. Table 10 illustrates the variation of PSNR, MSE and Entropy and Table 11 shows the time taken for fusion. Figure 14 and 15 graphically represent the variation of PSNR, MSE and Entropy and elapsed time variation in fusion, respectively.
S. Anbumozhi and P.S. Manoharan / American Journal of Applied Sciences 11 (5): 769-781, 2014
779 Science Publications
AJAS
Fig. 14. Graphical representation of the performance comparisons in terms of PSNR, MSE and ENTROPY
Fig. 15. Graphical plot of performance comparison in terms of Fusion Latency
S. Anbumozhi and P.S. Manoharan / American Journal of Applied Sciences 11 (5): 769-781, 2014
780 Science Publications
AJAS
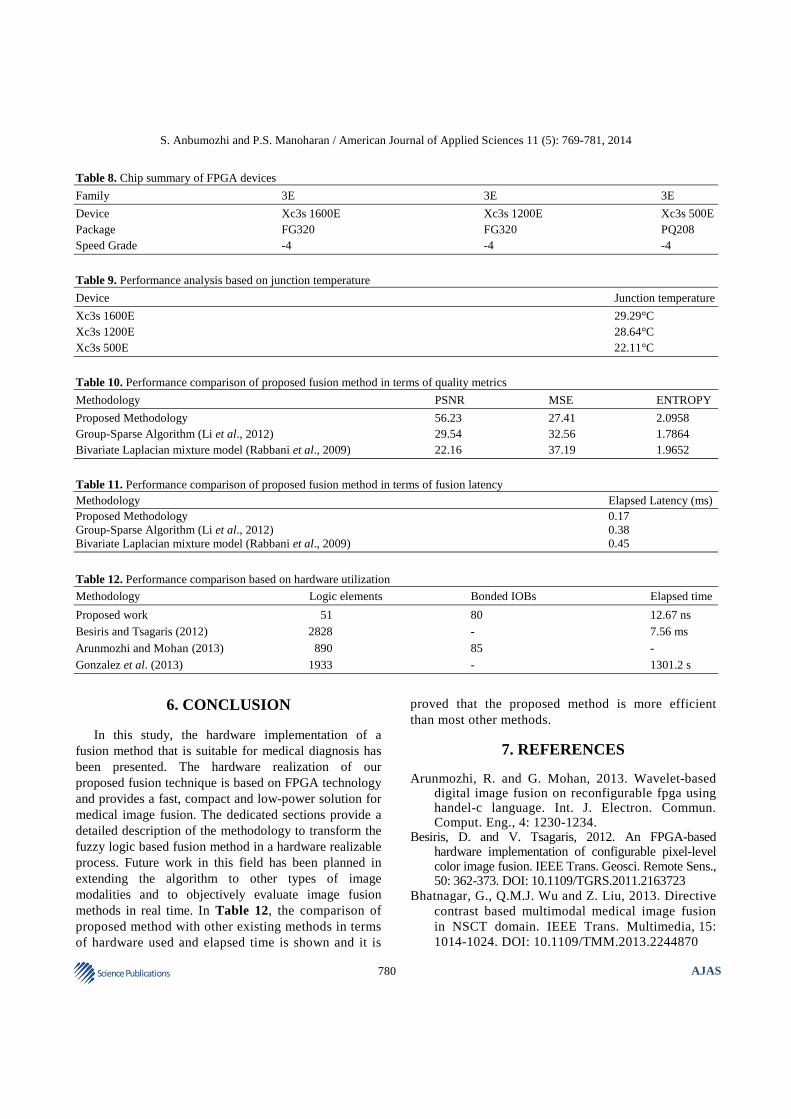
Table 8. Chip summary of FPGA devices
Family 3E 3E 3E
Device Xc3s 1600E Xc3s 1200E Xc3s 500E Package FG320 FG320 PQ208 Speed Grade -4 -4 -4
Table 9. Performance analysis based on junction temperature
Device Junction temperature
Xc3s 1600E 29.29°C Xc3s 1200E 28.64°C Xc3s 500E 22.11°C
Table 10. Performance comparison of proposed fusion method in terms of quality metrics
Methodology PSNR MSE ENTROPY
Proposed Methodology 56.23 27.41 2.0958 Group-Sparse Algorithm (Li et al., 2012) 29.54 32.56 1.7864 Bivariate Laplacian mixture model (Rabbani et al., 2009) 22.16 37.19 1.9652
Table 11. Performance comparison of proposed fusion method in terms of fusion latency Methodology Elapsed Latency (ms) Proposed Methodology 0.17 Group-Sparse Algorithm (Li et al., 2012) 0.38 Bivariate Laplacian mixture model (Rabbani et al., 2009) 0.45
Table 12. Performance comparison based on hardware utilization
Methodology Logic elements Bonded IOBs Elapsed time
Proposed work 51 80 12.67 ns Besiris and Tsagaris (2012) 2828 - 7.56 ms
Arunmozhi and Mohan (2013) 890 85 - Gonzalez et al. (2013) 1933 - 1301.2 s
6. CONCLUSION
In this study, the hardware implementation of a fusion method that is suitable for medical diagnosis has been presented. The hardware realization of our proposed fusion technique is based on FPGA technology and provides a fast, compact and low-power solution for medical image fusion. The dedicated sections provide a detailed description of the methodology to transform the fuzzy logic based fusion method in a hardware realizable process. Future work in this field has been planned in extending the algorithm to other types of image modalities and to objectively evaluate image fusion methods in real time. In Table 12, the comparison of proposed method with other existing methods in terms of hardware used and elapsed time is shown and it is
proved that the proposed method is more efficient than most other methods.
7. REFERENCES
Arunmozhi, R. and G. Mohan, 2013. Wavelet-based digital image fusion on reconfigurable fpga using handel-c language. Int. J. Electron. Commun. Comput. Eng., 4: 1230-1234.
Besiris, D. and V. Tsagaris, 2012. An FPGA-based hardware implementation of configurable pixel-level color image fusion. IEEE Trans. Geosci. Remote Sens., 50: 362-373. DOI: 10.1109/TGRS.2011.2163723
Bhatnagar, G., Q.M.J. Wu and Z. Liu, 2013. Directive contrast based multimodal medical image fusion in NSCT domain. IEEE Trans. Multimedia, 15: 1014-1024. DOI: 10.1109/TMM.2013.2244870
S. Anbumozhi and P.S. Manoharan / American Journal of Applied Sciences 11 (5): 769-781, 2014
781 Science Publications
AJAS
Chen, S.L., H.Y. Huang and C.H. Luo, 2011. A low-cost high-quality adaptive scalar for real-time multimedia applications. IEEE Trans. Circuits Syst. Video Technol., 21: 1600-1611. DOI: 10.1109/TCSVT.2011.2129790
Gonzalez, C., S. Sanchez, A. Paz, J. Resano and D. Mozos et al., 2013. Use of FPGA or GPU-based architectures for remotely sensed hyperspectral image processing. Integrat., VLSI J., 46: 89-103. DOI: 10.1016/j.vlsi.2012.04.002
Jacobson, N.P., M.R. Gupta and J.B. Cole, 2007. Linear fusion of image sets for display. IEEE Trans. Geosci. Remote Sens., 45: 3277- 3288. DOI: 10.1109/TGRS.2007.903598
Li, S., H. Yin and L. Fang, 2012. Group-sparse representation with dictionary learning for medical image denoising and Fusion. IEEE Trans. Biomed. Eng., 59: 3450-3459. DOI: 10.1109/TBME.2012.2217493
Li, W., X. Zhu and S. Wu, 2006. A novel approach to fast medical image fusion based on lifting wavelet transform. Proceedings of WCICA’06, Dalian, 2: 9881-9884. DOI: 10.1109/WCICA.2006.1713927.
Nagarajan, K., C. Krekeler, K.C. Slatton and W.D. Graham, 2010. A scalable approach to fusing spatiotemporal data to estimate streamflow via a Bayesian network. IEEE Trans. Geosci. Remote Sens., 48: 3720-3732. DOI: 10.1109/TGRS.2010.2049115
Rabbani, H., R. Nezafat and S. Gazor, 2009. Wavelet-domain medical image denoising using bivariate laplacian mixture model. IEEE Trans. Biomed. Eng., 56: 2826-2837. DOI: 10.1109/TBME.2009.2028876
Rana, A. and S. Arora, 2013. comparative analysis of medical image fusion. Int. J. Comput. Applic., 73: 10-13. DOI: 10.5120/12768-9371
Tsagaris, V., V. Anastassopoulos and G. Lampropoulos, 2005. Fusion of hyperspectral data using segmented PCT for enhanced color representation. IEEE Trans. Geosci. Remote Sens., 43: 2365-2375. DOI: 10.1109/TGRS.2005.856104
Yang, Y., D.S. Park, S. Huang and N. Rao, 2010. Medical image fusion via an effective wavelet-based approach. EURASIP J. Adv. Signal Proc., 2010: 579341-579341. DOI: 10.1155/2010/579341
Zaveri, T. and M. Zaveri, 2011. A novel region based multimodality image fusion method. J. Patt. Recognit. Res., 6: 140-153. DOI: 10.13176/11.245


![Multi-focus Image Fusion Based on Muti-schemevigir.missouri.edu/~gdesouza/Research/Conference... · decomposition method [1, 2] and wavelet image fusion method. Wavelet image fusion](https://img.pdfslide.net/doc/110x75/5f610cf2ca7f86655445691a/multi-focus-image-fusion-based-on-muti-gdesouzaresearchconference-decomposition.jpg)