Embed Size (px)
Citation preview
Nonparametric Statistics in Neuroimaging
Martin Lindquist Department of Biostatistics Johns Hopkins University
Statistical Parametric Mapping
• Statistical parametric mapping (SPM) refers to the data analytic framework commonly used in neuroimaging.
• It involves using the general linear model (GLM) to construct statistical maps and Gaussian random field theory to threshold them.
• Both are parametric models that make a number of assumptions whose validity impact the results.
Assumptions
• The GLM assumes (among other things): – The data are independent identically distributed
random variables that follow a normal distribution with constant variance.
• RFT assumes: – The statistical image is either multivariate Gaussian or
derived from multivariate Gaussian images. – It is sufficiently smooth to approximate a continuous
random field.
Violations • Identically distributed:
– Outliers can influence data in unexpected ways, even for large samples.
• Independence: – p-values too liberal; false positives; nominal degrees of freedom
is overestimate.
• Normality: – p-values are wrong, no simple rule for determining in what way.
• Equal variance: – p-values too liberal; false positives; nominal degrees of freedom
is overestimate.
Nonparametric Inference
• The goal of nonparametric inference is to use the data at hand to perform inference while making as few assumptions as possible.
• Because they only require minimal assumptions to be valid, they provide a flexible methodology for the statistical analysis of neuroimaging data.
Nonparametric Procedures
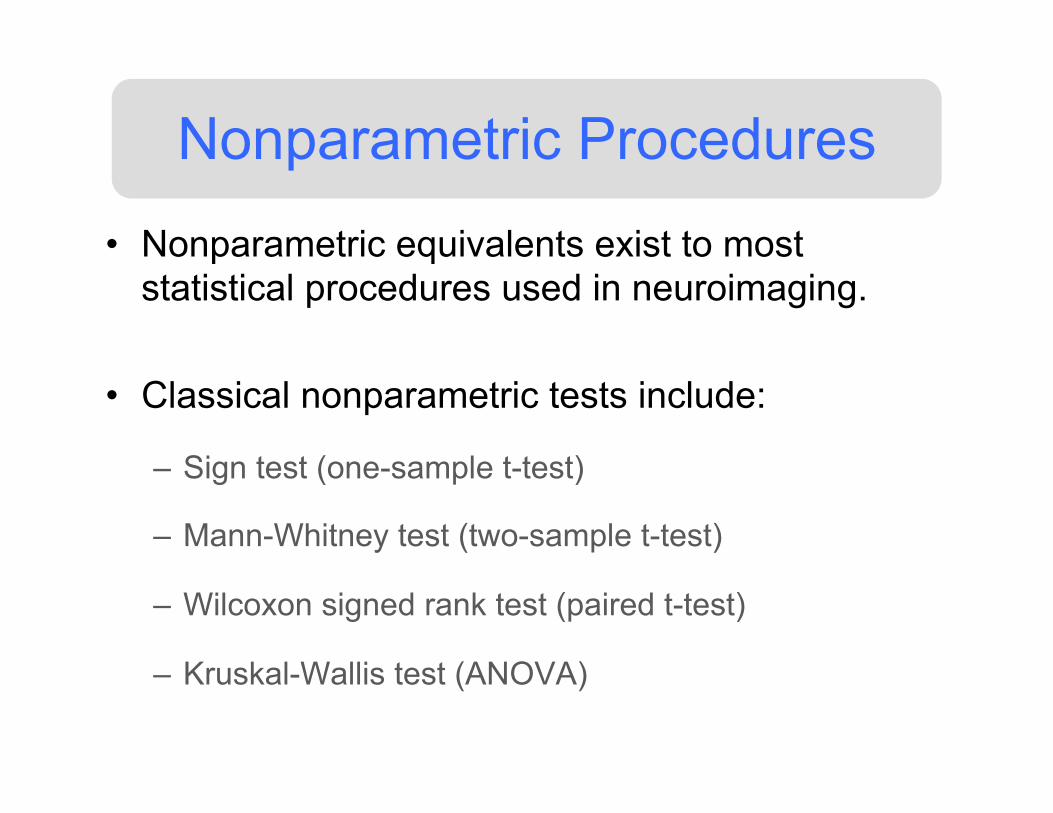
• Nonparametric equivalents exist to most statistical procedures used in neuroimaging.
• Classical nonparametric tests include:
– Sign test (one-sample t-test)
– Mann-Whitney test (two-sample t-test)
– Wilcoxon signed rank test (paired t-test)
– Kruskal-Wallis test (ANOVA)
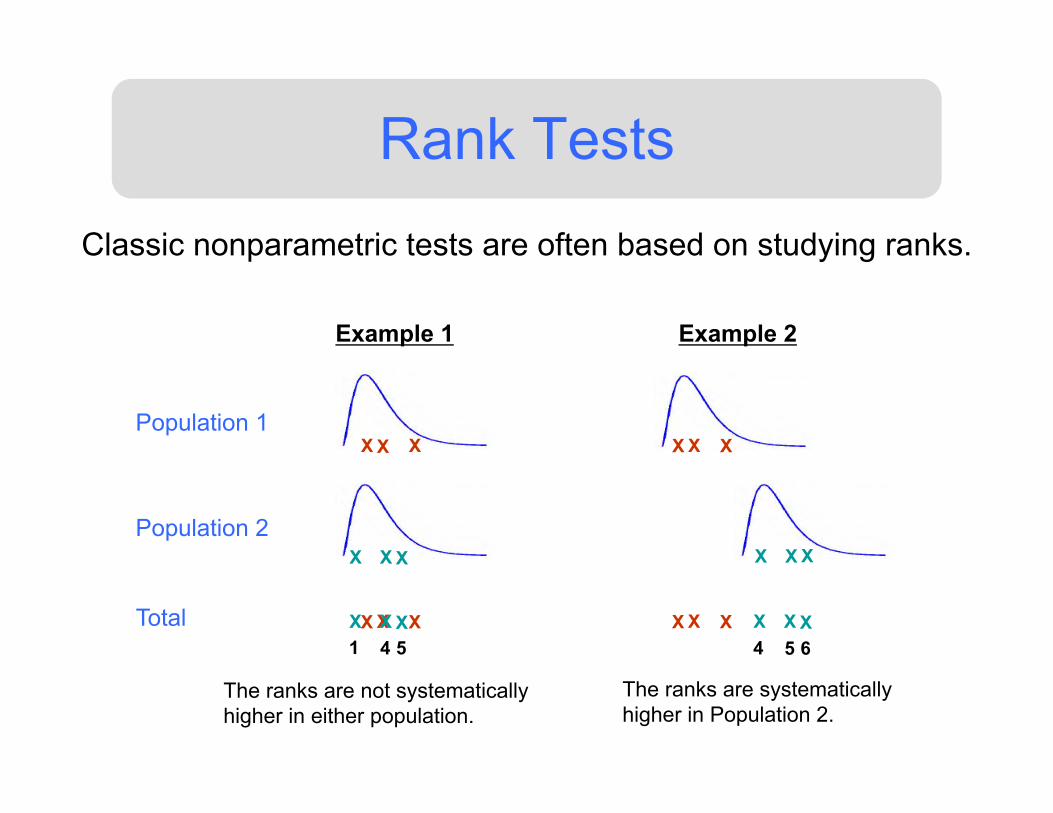
Rank Tests Classic nonparametric tests are often based on studying ranks.
Example 1
X X X
X X X
X X X X X X
X X X
X X X X X X
Population 1
Population 2
Total
Example 2
The ranks are not systematically higher in either population.
The ranks are systematically higher in Population 2.
X X X
1 4 5 4 5 6
Nonparametric Procedures
• The use of computer intensive methods to perform nonparametric inference has become increasingly popular in recent years.
• The most popular approaches include:
– the Bootstrap procedure, and
– permutation tests • Both techniques are based on randomly
resampling the available data.
Statistical Inference
• A parameter is a number that describes the population, while a statistic describes a sample.
• In statistical inference we use a known statistic to estimate an unknown population parameter. – The statistic varies from sample to sample. – The sampling distribution is a mathematical model that
provides information about this variation. – It allows us to construct confidence intervals and
hypothesis tests.
The Bootstrap
• The Bootstrap is a computer-based method of inference that allows for estimation of the sampling distribution of almost any statistic.
• It can be used to construct confidence intervals for situations where traditional methods cannot (or should not) be used.
• By repeatedly resampling with replacement from the sample we approximate repeatedly sampling data from the population.
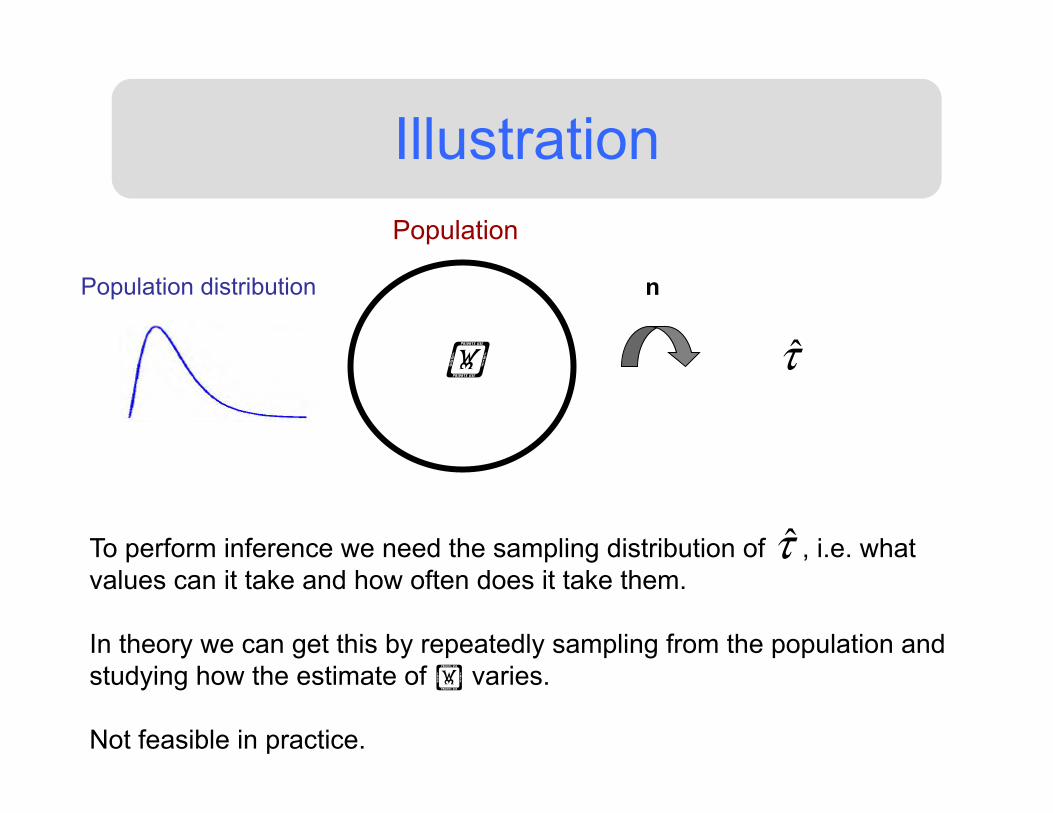
Illustration Population
n Population distribution
τ̂
To perform inference we need the sampling distribution of , i.e. what values can it take and how often does it take them. In theory we can get this by repeatedly sampling from the population and studying how the estimate of varies. Not feasible in practice.
τ̂
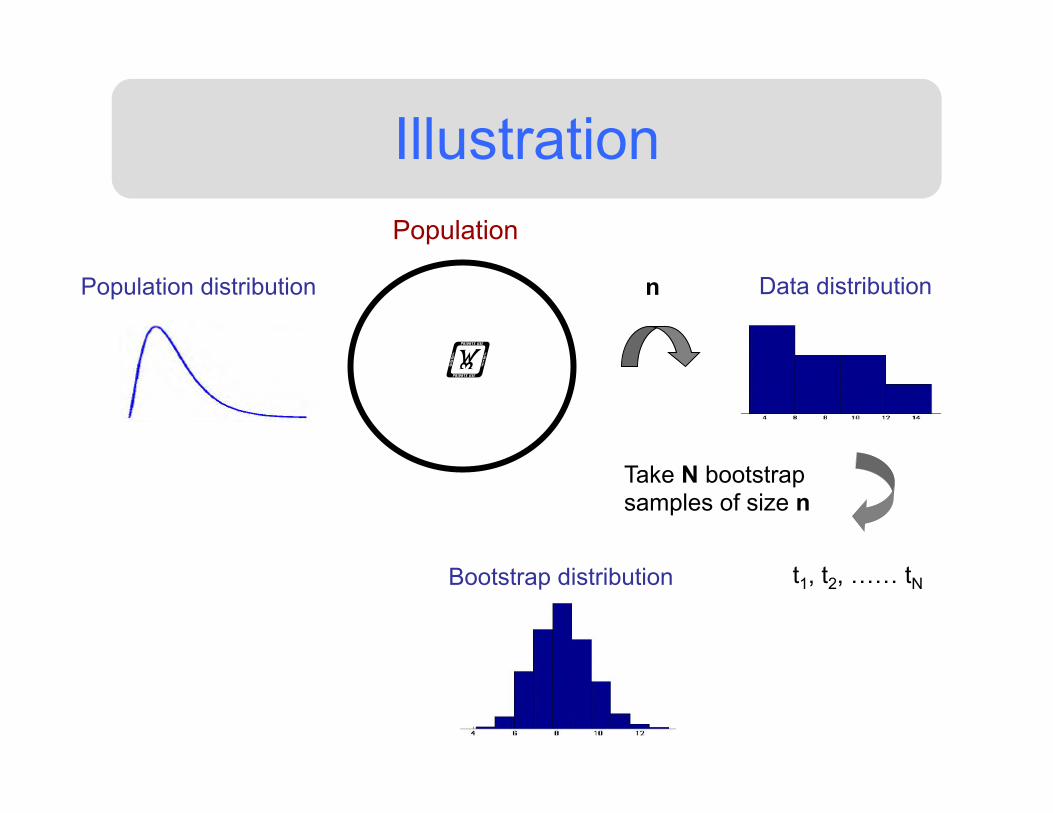
Illustration Population
n Population distribution Data distribution
Take N bootstrap samples of size n
t1, t2, …… tN Bootstrap distribution
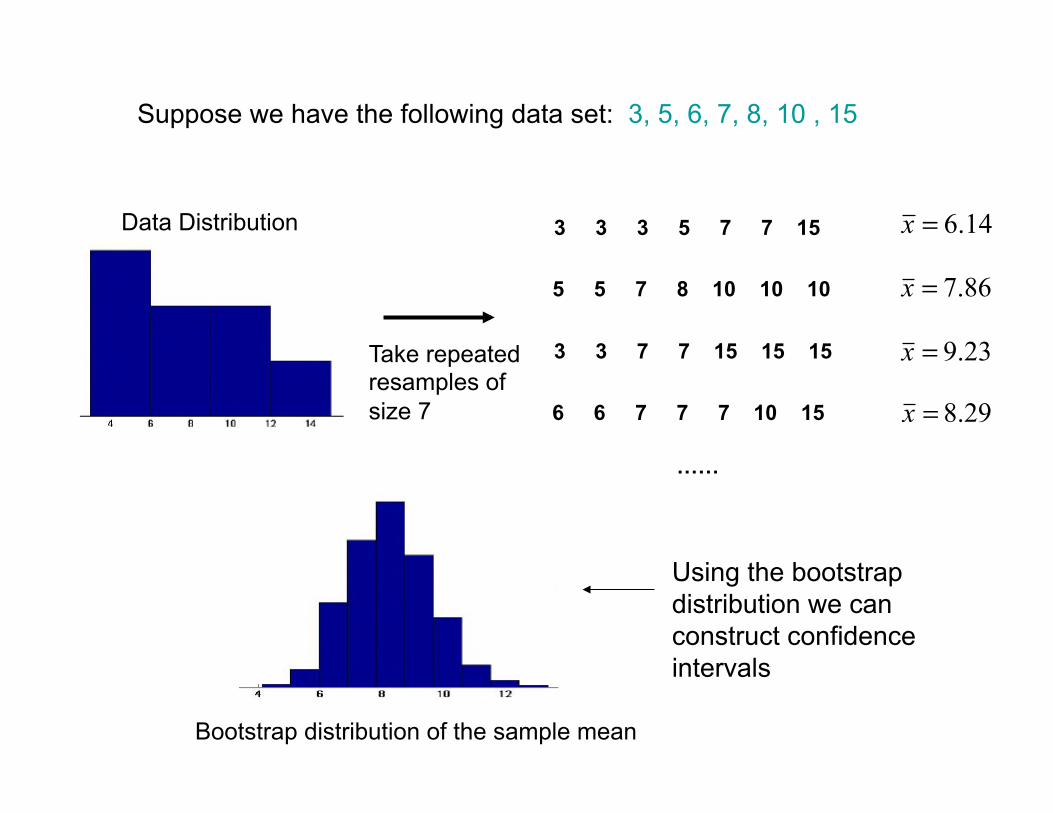
14.6=x
23.9=x
3 3 3 5 7 7 15
5 5 7 8 10 10 10
3 3 7 7 15 15 15
6 6 7 7 7 10 15
86.7=x
29.8=x
Take repeated resamples of size 7
……
Bootstrap distribution of the sample mean
Data Distribution
Suppose we have the following data set: 3, 5, 6, 7, 8, 10 , 15
Using the bootstrap distribution we can construct confidence intervals
Applications in Neuroimaging
• The bootstrap has many potential uses in neuroimaging.
• In our work we have used it to:
– Perform second-level inference when the first-level model uses a set of basis functions to model the HRF.
– Construct confidence intervals for situations when the distribution of a statistic is unknown (e.g., mediation).
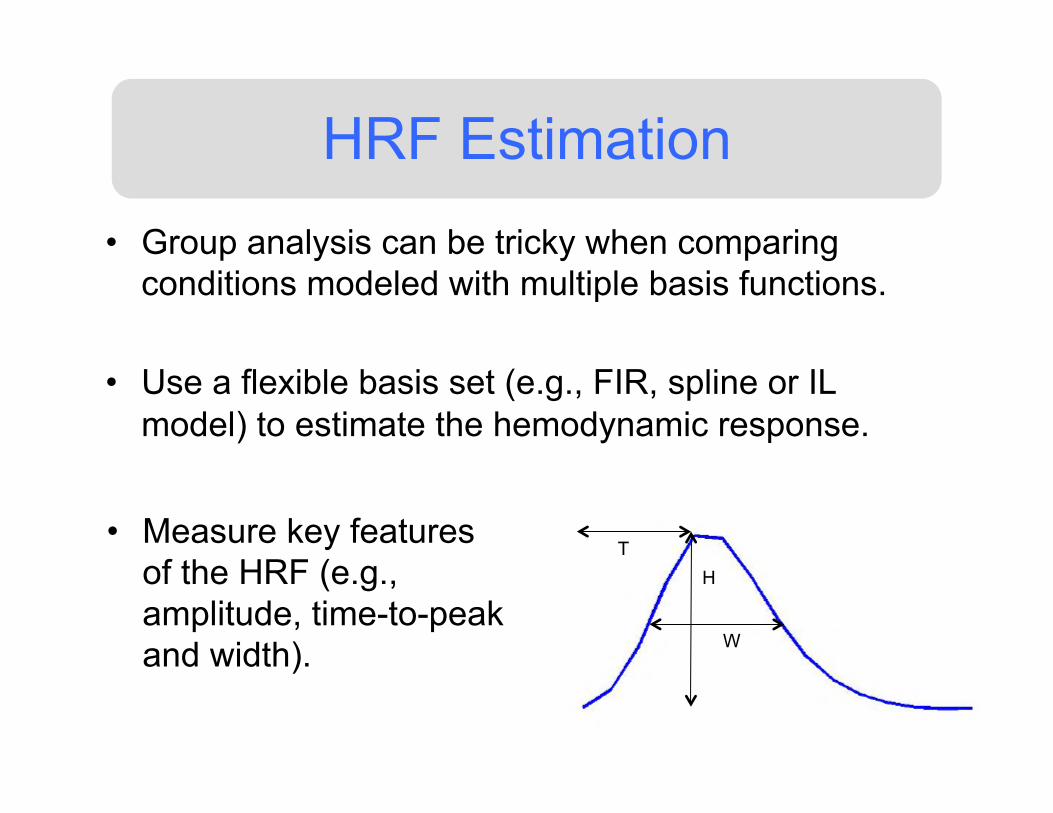
HRF Estimation • Group analysis can be tricky when comparing
conditions modeled with multiple basis functions.
• Use a flexible basis set (e.g., FIR, spline or IL model) to estimate the hemodynamic response.
T
W
H
• Measure key features of the HRF (e.g., amplitude, time-to-peak and width).
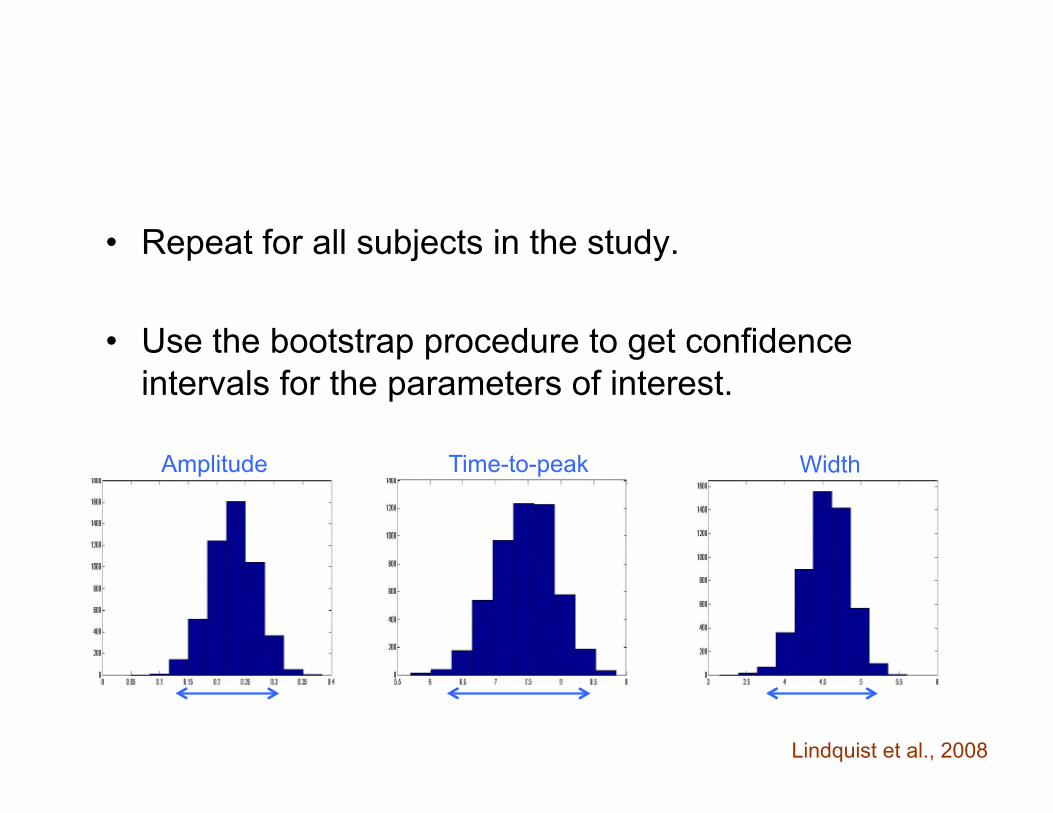
• Repeat for all subjects in the study. • Use the bootstrap procedure to get confidence
intervals for the parameters of interest.
Amplitude Time-to-peak Width
Lindquist et al., 2008
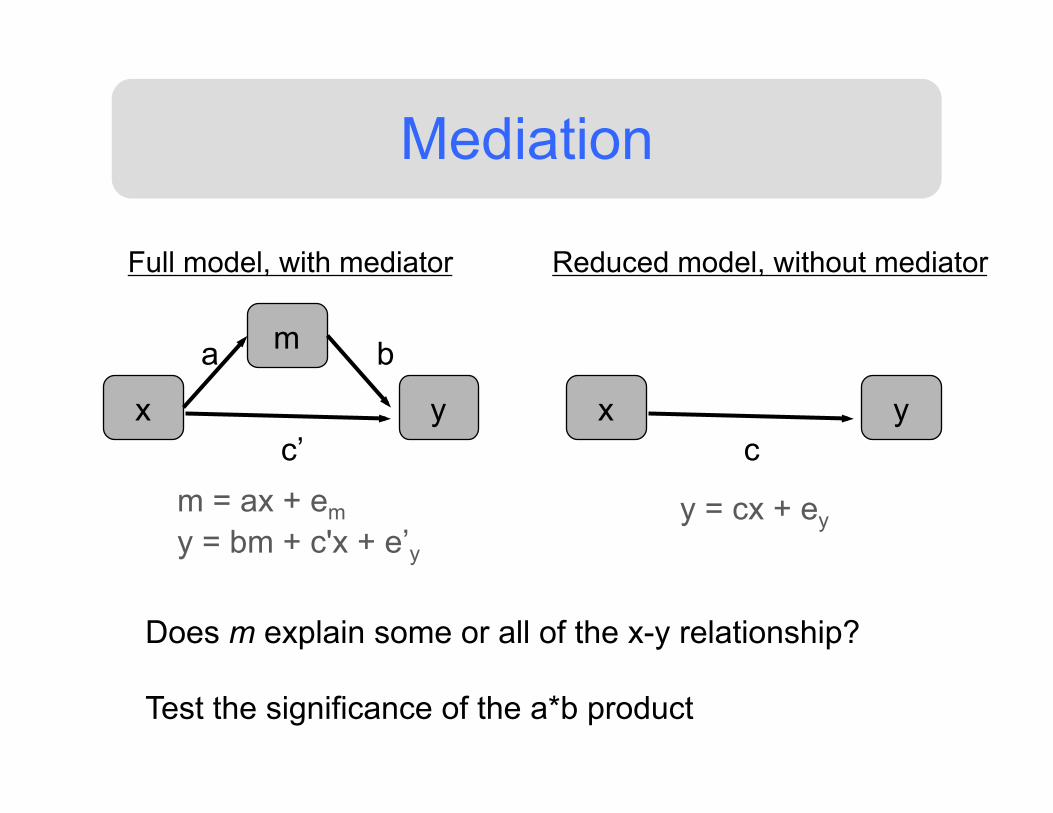
Mediation
x y
m a b
c’ x y
c
Full model, with mediator Reduced model, without mediator
m = ax + em y = bm + c'x + e’y
y = cx + ey
Does m explain some or all of the x-y relationship? Test the significance of the a*b product
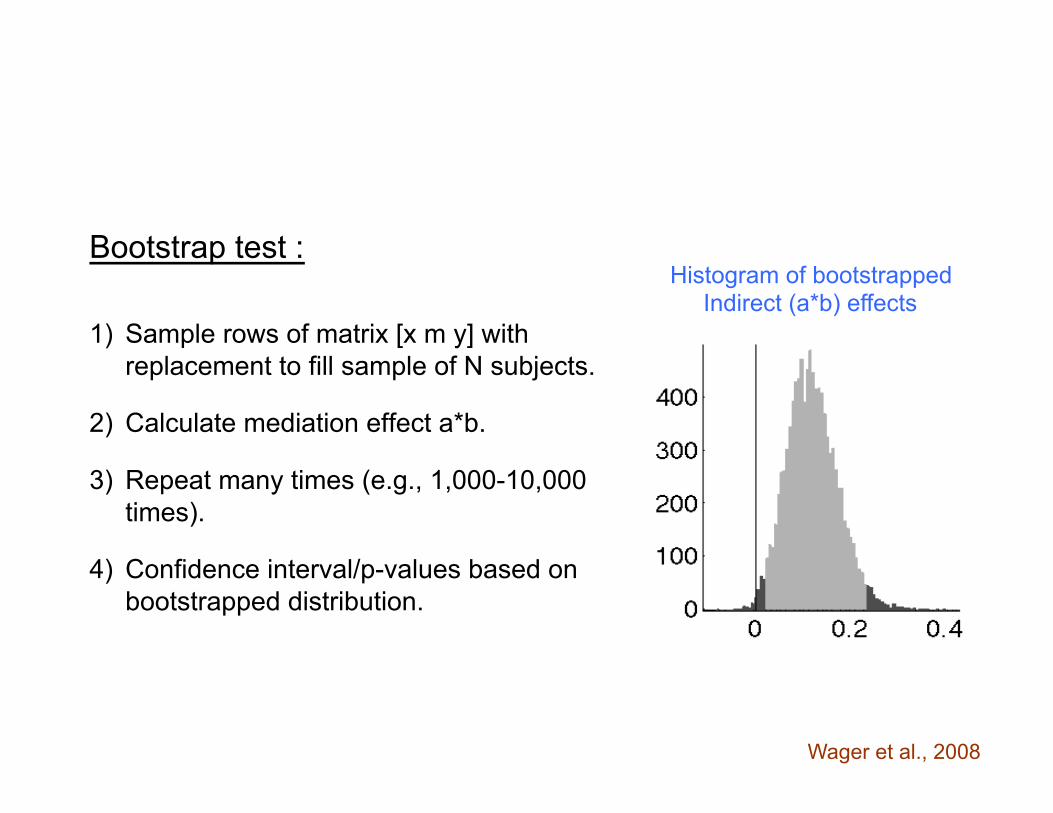
Bootstrap test : 1) Sample rows of matrix [x m y] with
replacement to fill sample of N subjects.
2) Calculate mediation effect a*b.
3) Repeat many times (e.g., 1,000-10,000 times).
4) Confidence interval/p-values based on bootstrapped distribution.
Histogram of bootstrapped Indirect (a*b) effects
Wager et al., 2008
Permutation Tests
• Permutation tests are another example of a computer-intensive statistical technique.
• They are significance tests based on resamples drawn at random from the original data.
• In contrast to the bootstrap, the resamples are drawn without replacement in a manner consistent with the null hypothesis and the study design.
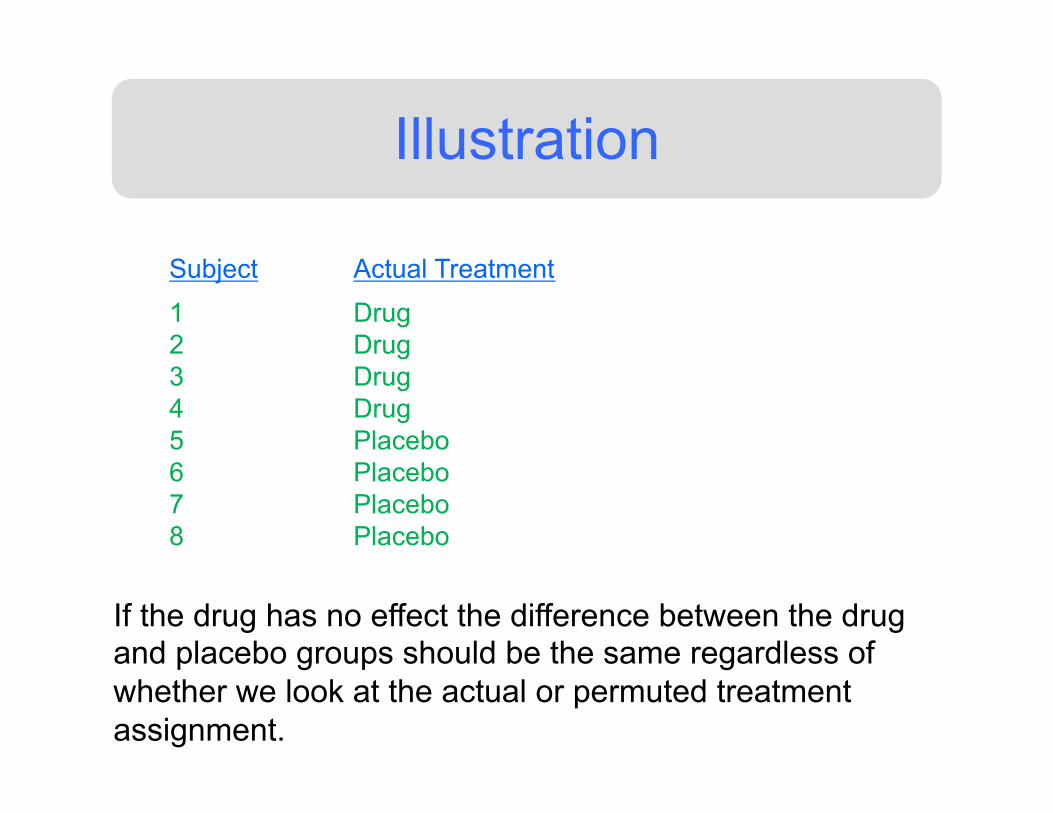
Illustration
Subject
1 2 3 4 5 6 7 8
Actual Treatment
Drug Drug Drug Drug Placebo Placebo Placebo Placebo
Permuted Treatment
Drug Placebo Placebo Drug Placebo Drug Drug Placebo
If the drug has no effect the difference between the drug and placebo groups should be the same regardless of whether we look at the actual or permuted treatment assignment.
Permutation Distribution
• The permutation distribution of the statistic of interest is formed using the values of the statistic from a large number of resamples.
• The permutation distribution estimates the sampling distribution under the condition that H0 is true.
• The permutation distribution can be used to compute p-values to test H0.
SnPM
• Statistical nonparametric mapping (Nichols & Holmes) is a nonparametric equivalent to SPM.
• It uses a permutation test, rather than random field theory, to correct for multiple comparisons.
• This allows one to avoid the assumptions needed for using random field theory.
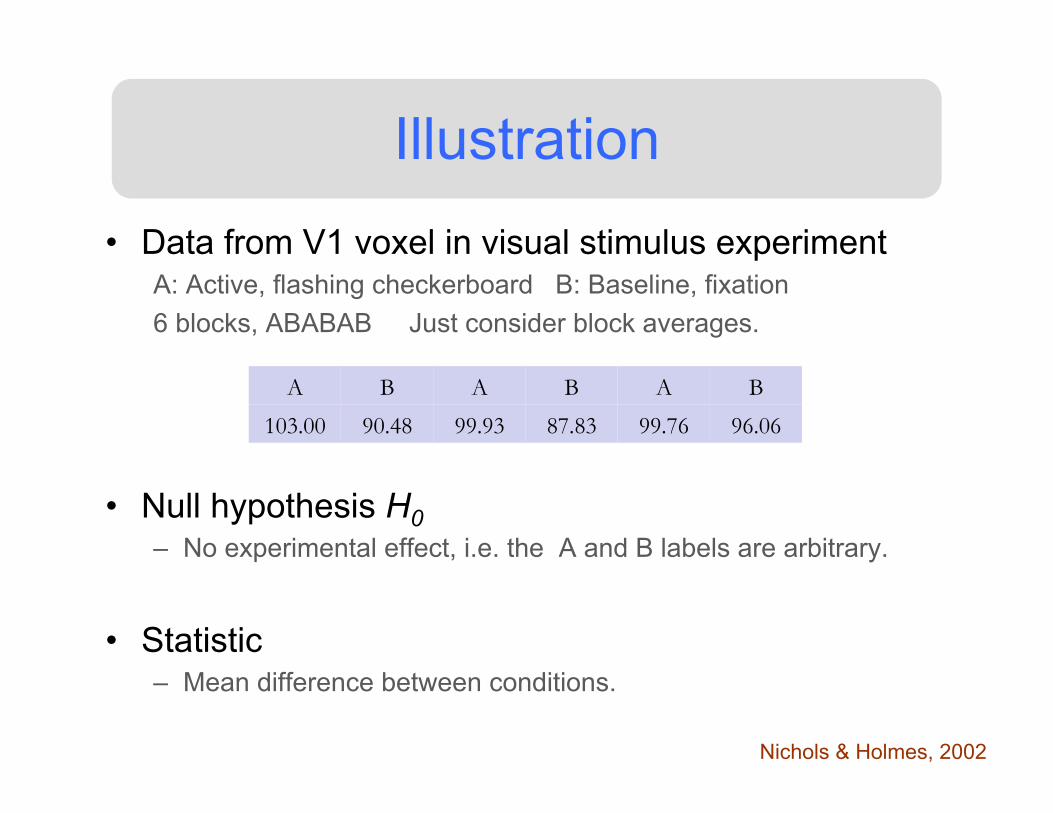
Illustration • Data from V1 voxel in visual stimulus experiment
A: Active, flashing checkerboard B: Baseline, fixation 6 blocks, ABABAB Just consider block averages.
• Null hypothesis H0
– No experimental effect, i.e. the A and B labels are arbitrary.
• Statistic – Mean difference between conditions.
A B A B A B
103.00 90.48 99.93 87.83 99.76 96.06
Nichols & Holmes, 2002
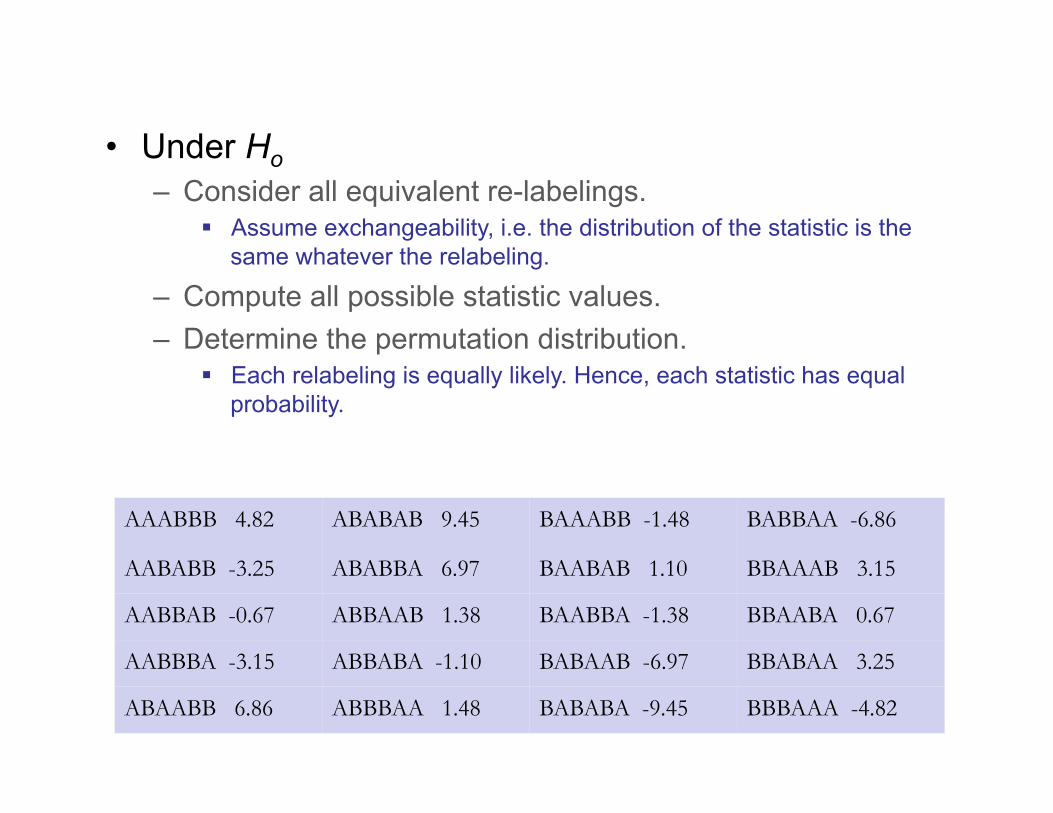
AAABBB 4.82 ABABAB 9.45 BAAABB -1.48 BABBAA -6.86
AABABB -3.25 ABABBA 6.97 BAABAB 1.10 BBAAAB 3.15
AABBAB -0.67 ABBAAB 1.38 BAABBA -1.38 BBAABA 0.67
AABBBA -3.15 ABBABA -1.10 BABAAB -6.97 BBABAA 3.25
ABAABB 6.86 ABBBAA 1.48 BABABA -9.45 BBBAAA -4.82
• Under Ho – Consider all equivalent re-labelings.
Assume exchangeability, i.e. the distribution of the statistic is the same whatever the relabeling.
– Compute all possible statistic values. – Determine the permutation distribution.
Each relabeling is equally likely. Hence, each statistic has equal probability.
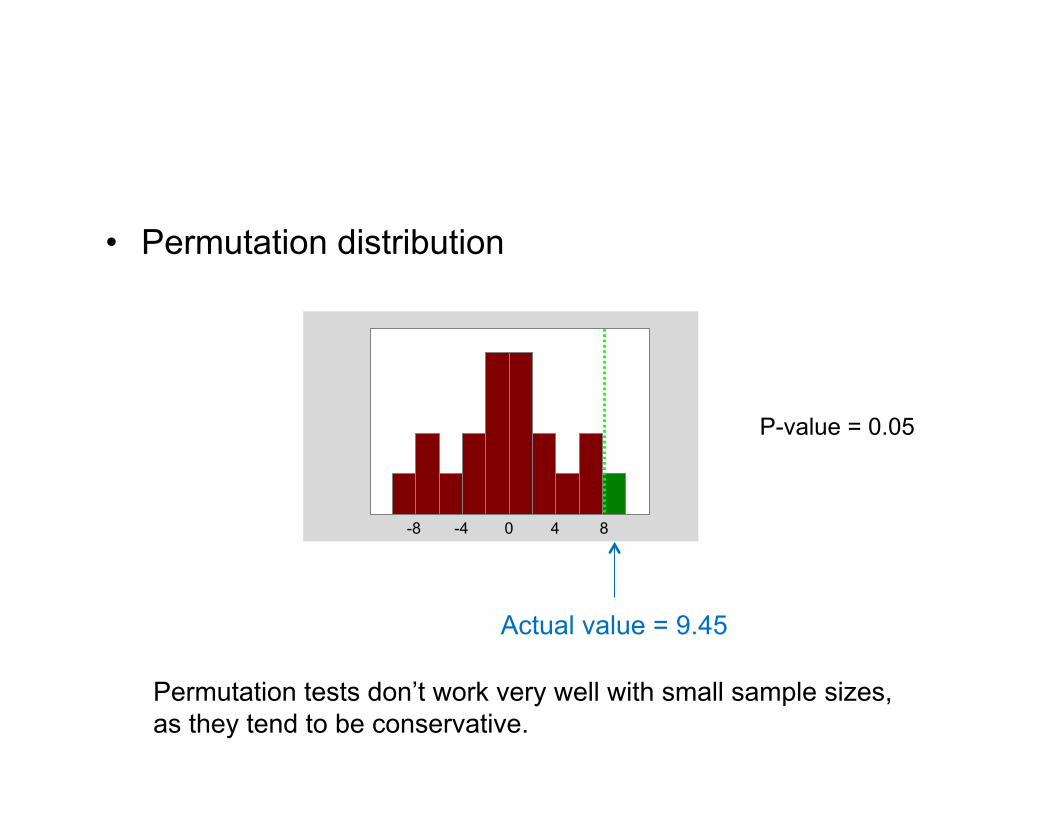
• Permutation distribution
0 4 8 -4 -8
Actual value = 9.45
Permutation tests don’t work very well with small sample sizes, as they tend to be conservative.
P-value = 0.05
Comments • Requires only the assumption of exchangeability
– Under H0, the distribution is unchanged by permutation. – This allows us to build the permutation distribution.
• Subjects are exchangeable – Under H0, each subject’s A/B labels can be flipped. – Permutation tests useful for 2nd level analysis.
• fMRI scans not exchangeable under H0 – The problem is temporal autocorrelation. – Be careful performing permutation tests on individual subjects.
Issues • Sample size
– If there are N possible relabelings, the smallest attainable p-value is 1/N which can be problematic at small N.
– If there are too many possible relabelings it may not be feasible to compute the statistic images for all of them. Randomly sample from the population of relabelings. Each relabeling should be equally likely to be chosen.
• Flexibility – The permutation approach is free to consider any statistic and is
not bound to those that have a known distributional form.
Issues • Computational Intensity
– Analysis needs to be repeated for each relabeling. – Computations can be parallelized.
• Implementation – Each experimental design type needs unique code to generate
permutations.
• Power and Validity – Nonparametric procedures are less powerful than their
parametric counterparts when the assumptions of the latter hold. If assumptions not met, nonparametric procedures more valid.
Multiple Comparisons
• Permutation tests can be used to control for multiple comparisons. – The family-wise error rate (FWER) often controlled by
considering the distribution of the max statistic.
• To study the max statistic all voxels need to be considered simultaneously.
– Arguments can be extended to image-level inference. – Permutations carried out on the image level, i.e. entire
images are relabeled.
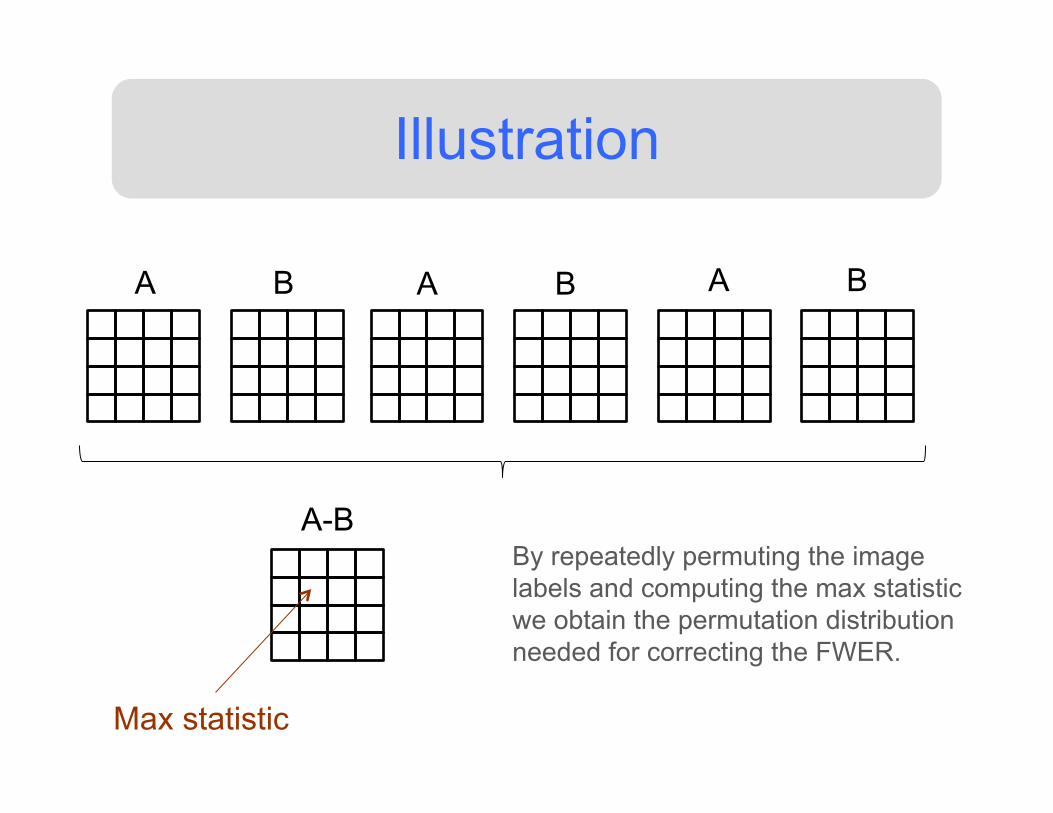
Illustration
A B A B A B
Max statistic
By repeatedly permuting the image labels and computing the max statistic we obtain the permutation distribution needed for correcting the FWER.
A-B
Controlling FWER
• A single threshold test thresholds the statistic image at a critical value and voxels exceeding the threshold are deemed active.
• Procedure:
– Re-label the images.
– Compute the statistic for each voxel.
– Compute the maximum statistic over the whole image.
– Repeat to construct the permutation distribution of the max statistic.
Controlling FWER
• A suprathreshold cluster test thresholds the statistic image at a primary threshold, and then studies the extent of activation in a second level.
• Procedure:
– Re-label the images.
– Compute the statistic for each voxel.
– Threshold at a primary threshold.
– Compute the size of the largest cluster above the threshold.
– Repeat to construct the permutation distribution.
Comments
• For the single threshold test to be equally sensitive at all voxels, the sampling distribution should be roughly equal across voxels.
• Otherwise, areas where the statistic is highly variable tend to dominate the permutation distribution for the max statistic.
• The test will still be valid, but less sensitive at voxels with lower variability.
Pseudo t-statistic
• For small sample sizes (< 20) it makes sense to pool the variance estimate at each voxel with its neighbors to get a better variance estimate.
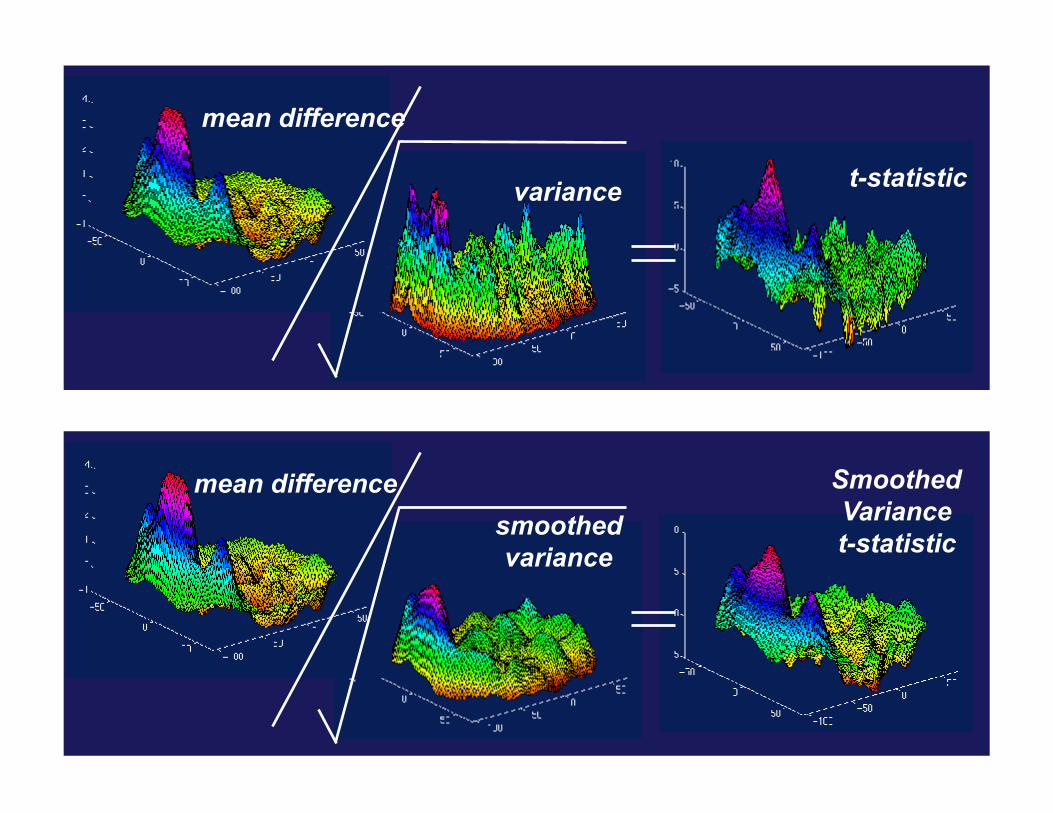
• The pseudo t-statistic images formed using the smoothed variance estimators are smoother than the standard t-statistic images.
• It is difficult to obtain a parametric distribution for this statistic, but using non-parametric methods it is straightforward.
35
t-statistic variance
mean difference
35
Smoothed Variance t-statistic
mean difference smoothed variance
d = 2
d = 1
d = 0.5
d = 2
d = 1
d = 0.5
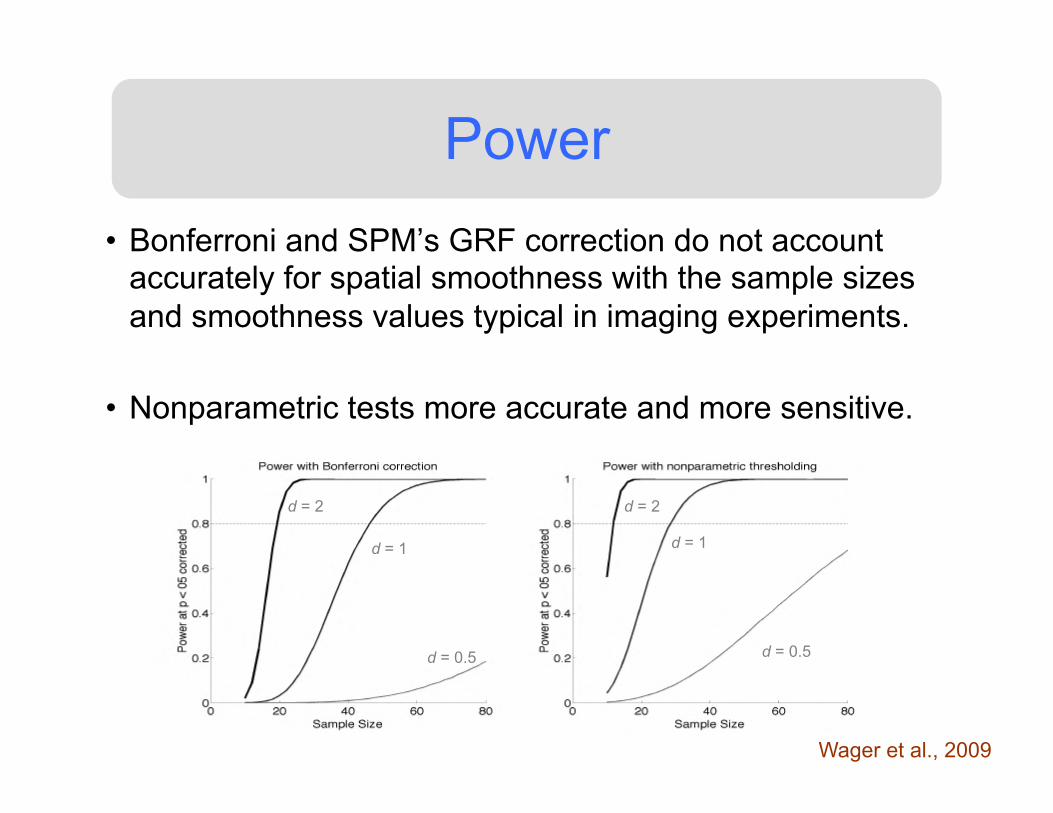
Power • Bonferroni and SPM’s GRF correction do not account
accurately for spatial smoothness with the sample sizes and smoothness values typical in imaging experiments.
• Nonparametric tests more accurate and more sensitive.
Wager et al., 2009
Summary
• Nonparametric procedures are attractive tools as they require minimal assumptions for validity.
• They provide a flexible methodology for the statistical analysis of neuroimaging data.
• In particular, computer intensive techniques (Bootstrap and permutation tests) should continue to gain in popularity.