Embed Size (px)
Citation preview
Nonprofits are not alike: The Role of Catholic
and Protestant Affiliation∗
Lapo Filistrucchi†and Jens Prufer‡
April 26, 2013
Abstract
There are no generally accepted results regarding the objectives, decisions,
and economic outcomes of nonprofit organizations, as compared to for-
profit or public firms. We posit that this inconclusiveness is due to a too
broad definition of nonprofits and that different types of nonprofits exist.
This conjecture is investigated by constructing a model in which nonprofits
differ by religious affiliation and testing the resulting hypotheses on the
observed behavior of German nonprofit hospitals. We find that Catholic
and Protestant nonprofits adopt significantly different strategies in the
market. This confirms our conjecture and the importance of religion for
economic outcomes.
JEL Classification: L31; L21; Z12; D64; I11
Keywords: Nonprofits; Governance; Owner Objectives; Religious Organizations;
Catholicism and Protestantism; Hospitals
∗Thanks to Cansu Aslan, Jan Boone, Katie Carman, Eline van der Heijden, Jurgen Maurer,
Stefan Trautmann, and Xu YiLong for helpful comments on an earlier draft of the paper
and to Alerk Amin, Fatih Cemil Ozbugday, and Pauline Affeldt for great research assistance.
Martin Salm deserves special thanks for collaboration on the data collection. We acknowledge
financial support from a grant of the Dutch Health Care Authority (NZa) to TILEC. Lapo
Filistrucchi acknowledges financial support from the Netherlands Organization for Scientific
Research (NWO).†CentER, TILEC; Tilburg University and Department of Economics and Management, Uni-
versity of Florence‡Corresponding author : CentER, TILEC; Tilburg University; P.O. Box 90153; 5000 LE
Tilburg, The Netherlands; e-mail: [email protected].
1 Introduction
“Nonprofit organizations are all around us.”
Burton Weisbrod (1988:1)
Two main factors distinguish nonprofit firms from for-profit organizations:
They have tax privileges and they operate under a nondistribution constraint.1
While tax privileges give nonprofits a financial advantage over competing for-
profits, the nondistribution constraint makes it unlawful that nonprofit managers
or other decision makers appropriate the profits generated by this advantage
(Hansmann, 1980).2 Hence, rational nonprofit decision makers will not maximize
profits but pursue another objective. It has not been settled in the theoretical
literature, however, which one. Empirical studies comparing the economic out-
comes and strategic decisions of nonprofit, for-profit, and public organizations do
not find a clear pattern of behavior distinguishing organizational forms (Sloan,
2000; Malani et al., 2003; Horwitz and Nichols, 2007).
We propose that the inconclusiveness of the empirical literature and the in-
decisiveness of the theoretical literature stem from the fact that the definition of
nonprofits, as stated above, is too broad. Organizational entities that were set
up by founders with different objectives, that use different governance mecha-
nisms, and that serve different kinds of consumers are all treated equally under
the nonprofit label. In this paper, we posit—and verify—that different types of
nonprofits exist, that we can distinguish among them by using observable criteria,
and that they produce different measurable economic outcomes. This serves as
the basis of a theory that can explain and predict nonprofit behavior.
Because the health care sector is the economically most important industry
with significant market shares of nonprofits (Hansmann, 1980, 1996; Sloan, 2000),
we test our conjecture by studying a dataset covering all German hospitals for
1Glaeser (2003:1) adds a third feature, that nonprofits do not have owners. That notion
applies Hansmann’s (1996) definition of ownership, whereby an owner is a person having both
residual control rights and residual income rights in a firm. As decision makers in nonprofits
have no income rights, due to the nondistribution constraint, they are not regarded owners. In
contrast, in the Grossman and Hart (1986) and Hart and Moore (1990) framework, to qualify
as an owner it is sufficient to hold residual control rights. Hence, nonprofits do have owners
in this framework, usually the managers or board members. We follow Grossman, Hart, and
Moore in this issue.2Note that public organizations and cooperatives are not only different from for-profits but
also from nonprofits because they are not subject to a nondistribution constraint.
1
the years 2006 and 2008 and including both input and output indicators for
various clinical areas and information on organizational form. The data allow to
distinguish between nonprofits with Catholic and with Protestant affiliation.3
To generate hypotheses about the strategic behavior of Catholic and Protes-
tant nonprofit hospitals, we first construct a model of a health care market with
nonprofit providers. Due to the absence of close managerial control via sharehold-
ers or the market for corporate control, we model nonprofit boards as the main
decision makers in those organizations. Given the nondistribution constraint,
profit maximization is no reasonable goal of governing boards. Instead, build-
ing on insights from the literature on the economic effects of Catholicism and
Protestantism, we assume objective functions with the following characteristics:4
First, both Catholic and Protestant decision makers get spiritual rewards from
altruistic behavior and, hence, maximize patient benefits (lat. caritas). Second,
Protestantism has an individualist emphasis. Therefore, we assume Protestant
decision makers to maximize the benefit of an individual patient who is up for
treatment. In contrast, Catholicism has a communal emphasis, which suggests
that Catholic decision makers focus on the group benefit of the community of all
patients. Third, a Protestant believer obtains relatively high reward from observ-
able measures of worldly success. This suggests that Protestant decision makers
will be oriented more towards productive efficiency and attracted by complex
procedures and technologies, two economic and intellectual measures of success.
Our model predicts that a Catholic provider serves relatively more patients
and makes higher total revenues but that a Protestant provider makes higher
average revenues per patient and treats relatively more complex cases in equilib-
rium. It also produces testable hypotheses on providers’ choice of diversification
vs. specialization.
We then test the hypotheses generated by our model with the data on Ger-
man hospitals. Our empirical findings suggest that Christian hospitals, which
form 63 percent of all nonprofit hospitals in Germany, indeed make different
strategic choices: Catholic hospitals serve more patients and more treatment ar-
3In contrast to many other countries, both the Protestant and the Catholic theologies are
relatively homogenous in Germany. In our dataset, all Catholic hospitals are a member of the
Caritas organization, all Protestant hospitals are a member of Diakonisches Werk.4The fact that the preferences of (elite) workers are important for nonprofits’ decisions
is shown by Glaeser (2003) and Francois (2007). Horwitz (2007:22) finds evidence for “the
influence of employee altruism” on decision making.
2
eas and produce higher total revenues. Instead, Protestant hospitals focus on
more complex cases, generate higher revenues per patient, and are active in less
treatment areas. We also find evidence that a higher share of Protestant than
Catholic hospitals has links to universities and that Protestant hospitals use more
generalist doctors and more specialized doctors per patient than Catholic hospi-
tals.
These results suggest that Catholic hospitals follow a strategy of horizontal
diversification and maximization of the number of patients treated. By contrast,
Protestant hospitals specialize horizontally and focus on vertical differentiation,
putting in more sophisticated inputs and producing more complex services.
The results are consistent with the predictions of our model, which supports
the differences between Catholic and Protestant values identified in the literature.
The findings also support our conjectures about the impact of these values on the
governance of nonprofit hospitals affiliated with churches, and the impact of non-
profit governance on their strategic choices in markets.5 This may be surprising
because religious values have been formed over hundreds of years, some hospitals
were also founded hundreds of years ago but our data are modern. Finally and
most importantly, the findings suggest that different types of nonprofits do exist
and that we can distinguish among them by using objective, verifiable criteria.6
Thereby, we can improve the prediction power of models of nonprofit behavior.
The next section elaborates on our argumentation and gives an account of
the literatures on nonprofits and on the differential economic effects of Catholi-
cism and Protestantism. Section 3 studies a simple model of a nonprofit health
care provider and derives testable hypotheses from it. Section 4 describes the
dataset on German hospitals and the results of our hypotheses testing. Section 5
discusses our main findings, limitations, and contributions. Model proofs are in
the appendix.
5Thereby, we pick up the call of Levy and Razin (2012:140), who speculate, “A possible
direction of future research may be an attempt to link theological differences with governance
structure.”6Weisbrod (1988:3) already argued: “It is also widely believed that all nonprofits are essen-
tially the same, [...] Nonprofits, however, are varied a lot.” This insight, however, has not been
picked up by researchers in the way performed in this paper.
3
2 Nonprofit governance and religion
2.1 Related literature on nonprofits
It is commonly accepted in the academic literature to assume that for-profit
firms maximize profits. Clearly, managerial opportunism and other agency prob-
lems exist but the general idea is that, at least for publicly held corporations,
a governance structure with shareholders supervising managers and the market
for corporate control mitigate deviations from profit maximization (Jensen and
Ruback, 1983).
This common ground of the literature on for-profits does not exist regard-
ing nonprofit organizations. Given the difficult market for corporate control and
the illegality of many incentive schemes for nonprofit managers, nonprofit deci-
sion makers have more discretion than managers in other organizational forms
(Glaeser, 2003).7 This underlines the importance of the manager’s objectives for
strategic decisions in nonprofits.8 The objectives of appointed managers, in turn,
depend on the organization’s governance structure because it determines the rules
for managerial selection, for instance the requirement to belong to a certain social
or religious group.
The subsequent question, what do nonprofits maximize, has been asked many
times and received many different answers. Sloan (2000), Horwitz (2007), and
Gertler and Kuan (2009) provide recent overviews of the literature.9 Malani et al.
(2003) conclude, “[t]here is no accepted theory of NFP behavior, and little of the
empirical work is connected to—let alone compares—existing theories” (181/2).
This negative statement is confirmed by Horwitz and Nichols (2007:3) writing,
“there is no generally accepted theory of the nonprofit firm”. In a meta-study on
US hospitals, Eggleston et al. (2008:1345) conclude: “Whether studies find for-
profit and government-controlled hospitals to have higher mortality rates or rates
7See Gertler and Kuan (2009) for an analysis of nonprofit takeovers. Because of the nondis-
tribution constraint, nonprofit managers cannot be incentivized by stock option plans, for in-
stance.8Horwitz’s (2007) empirical findings confirm the importance of decision makers’ objectives
for nonprofits’ strategic decisions.9Malani et al. (2003) cluster the available papers along three strands: altruism models
(e.g. Newhouse, 1970; Francois, 2003; Lakdawalla and Philipson, 2006, Castaneda et al., 2007;
Ghatak and Mueller 2011), physician cooperative models (e.g. Pauly and Redisch, 1973), and
noncontractible quality models (e.g. Hansmann, 1980; Glaeser and Shleifer, 2001; Herbst and
Prı¿ 12 fer, 2007; Vlassopoulos, 2009).
4
of adverse events than their nonprofit counterparts depends on data sources, time
period, and region covered. [...] The ‘true’ effect of ownership appears to depend
on institutional context, including differences across regions, markets, and over
time.”
We argue that the indecisiveness of the theoretical literature and the in-
conclusiveness of the empirical literature are due to the fact that the definition
of a nonprofit organization, focusing on tax privileges and the nondistribution
constraint, is too broad to yield consistent testable predictions and measurable
results. To understand the behavior of nonprofits better, we have to subdivide
the organizations operating under the nonprofit label in smaller, more homoge-
nous groups. Prufer (2011) discusses such an approach but only studies one
subgroup, so-called consumer-dominated nonprofits. However, he also does not
connect the theoretically existing organizational form with observable organiza-
tional characteristics, which makes it hard to test predictions on the behavior of
consumer-dominated nonprofits empirically.
Therefore, the challenge we are facing is to operationalize our theory of
nonprofits, which posits that several types of nonprofits exist and which regards
the objectives—and hence the identity—of the pivotal decision maker as crucial.10
To do that we first need to identify an observable characteristic of subgroups of
nonprofits, which allows us to infer the objectives of the pivotal owner in each
nonprofit subgroup (without claiming that the line of distinction we identify is
the only one possible). Based on these objectives, we then have to come up
with a model how nonprofits with different pivotal owners behave differently in
the market. Finally, we have to test the predictions generated by the model
empirically.
To tackle the first task, it is helpful to have a closer look at the time horizon
that nonprofit decision makers may have in office. If a nonprofit was founded by
an individual, it seems natural that the organization’s mission specified by the
founder gets less weight in the decision making process after the founder retired
or passed away. Instead, the objectives of other stakeholders, for instance donors,
consumers, or elite workers, are likely to become more important. The balance of
powers within such a nonprofit is likely to fluctuate over time, however, depend-
10Levy and Razin (2012:122) underline the link between the objectives of individuals and
organizations they are affiliated with by putting forward a model where it is one of two “insepa-
rable consequences” of being affiliated with a religious organization that “participation endows
the individual with some religious beliefs”.
5
ing on the wealth of the organization and the outside options of the individual
stakeholders.11 As it is hard to specify at a given point in time who is the piv-
otal decision maker in a specific nonprofit, it is even harder to hypothesize this
or that objective function governing important decisions in such an organization
independent of time.
In contrast, if a nonprofit was founded by another organization, in particular
a long-lasting one, and is under constant supervision by the parent organization,
we may expect that the parent’s mission has a persistent impact on the nonprofit’s
objective function. One example for such long-lasting parent organizations is
given by churches. Hansmann et al. (2003:48/9) write: “Like public hospitals,
religiously affiliated hospitals have an owner of sorts, [...] the church, that both
exercises control over them and stands to benefit from economies achieved in the
hospitals’ operation.”
2.2 On the economic effects of Christian religions
Empirical studies distinguishing between religious and secular nonprofit organi-
zations could identify significant differences in behavior. Hansmann et al. (2003)
find that for-profit hospitals are the most responsive to reductions in demand,
followed by public and religiously affiliated nonprofit hospitals, while secular non-
profit hospitals are the least responsive of the four ownership types.12 Gertler and
Kuan (2009:296) find that, when entire nonprofits are sold in the US hospital
industry, “religious nonprofits discount only to other religious nonprofits while
nonreligious nonprofits discount to all nonprofits.”13
11See Glaeser (2003) for a model along these lines.12If we interpret “responsiveness to reductions in demand” as market-orientation, this find-
ing is intuitive. Profit maximizers’ behavior is dictated by markets. Public firms and reli-
giously affiliated nonprofits are somewhat cushioned against market conditions by their parent
organizations—some governmental or church authority, respectively—as they serve other goals,
too; e.g. serving the community/electorate or following the religion’s mission. Yet, both public
firms and churches benefit from economies achieved in the daughter nonprofit’s operation and
hence cannot be expected to be completely mission-oriented, disregarding all profits. Finally,
secular nonprofits, including many foundations, which often lack a long-lasting organization as
founder, should be expected to maximize the objectives of the pivotal owner/individual founder
regardless of the profitability of operations.13The authors explain their finding with the significance of decision makers’ objectives, where
the discount on the price of a nonprofit that a nonprofit buyer, as compared to a for-profit buyer,
gets represents the value of the nonprofit’s mission.
6
These studies suggest that one reasonable line of distinction between subsets
of nonprofit organizations is along the religious-secular dimension. But we can go
further. In particular, given that both Hansmann et al. and Gertler and Kuan
treat religious nonprofits as a group, it is hard for them to speculate about one
objective function for the entire group. If we zoom into the spectrum of religious
nonprofits, however, this is possible.14 Among Christian denominations, Catholic
and Protestant doctrines differ in key aspects, which we expect to be reflected in
the behavior of nonprofit organizations affiliated with each congregation.15
The economic consequences of Christian doctrines have gained great atten-
tion since at least Max Weber’s “work ethic” hypothesis, that the Protestant Ref-
ormation was instrumental in facilitating industrial capitalism—and economic
prosperity with it—in Western Europe (Becker and Woessmann, 2009). Recent
literature has studied the channels through which differences between the Protes-
tant and Catholic doctrines led to the observed economic differences between
regions with this or that dominant denomination. Glaeser and Glendon (1998)
model the costs and benefits of the Calvinist belief in predestination and find that
under many conditions predestination is a more socially efficient belief system.
Van Hoorn and Maseland (2013) report that, in their sample of almost 150,000
individuals from 82 societies, they find strong and robust support for the hypoth-
esis that both individual Protestants and historically Protestant societies appear
to value work much more than Catholics and Catholic societies.
Arrunada (2009) confronts the work ethic hypothesis with an alternative
“social ethic” hypothesis, according to which Protestant values shape individuals
to be more active in mutual social control, more supportive of institutions, less
bound to close circles of family and friends, and to hold more homogeneous values.
He finds no support for the hypothesis that Catholics work less or less effectively
14Rennhoff and Owens (2012) show that churches in their dataset, which covers all Chris-
tian churches in two suburban Nashville, Tennessee counties, employ different strategies in the
market, which are affected by the decisions of other churches.15Focusing on these two denominations and neglecting other Christian congregations is rea-
sonable in the context of Germany, where our data come from. Baumann (2007) explains:
“Due to historical reasons and specific privileges for the main churches, i.e. Protestantism and
Roman Catholicism, it certainly is justified to speak of a ‘limited pluralism´ in both Germany
and Switzerland (Daiber 1995: 172). In numerical terms, in 2003 two thirds of the 82.5 million
inhabitants of Germany were members of the two main Christian churches. The second largest
group, so to say, was constituted by people with no formal religious adherence, comprising some
26 percent.”
7
than Protestants but identifies that education has a differential impact in both
denominations: “[F]or Protestants education complements religion whereas for
Catholics education substitutes for religion” (891).16 This result gives rise to the
hypothesis—which we will test with our data below—that the share of decision
makers with an affinity to education, educational institutions and to highly so-
phisticated techniques is lower in Catholic than in Protestant organizations. The
differential interaction of education and the two denominations is underlined by
Glaeser and Glendon (1998:442), who find in their study of U.S. General Social
Survey data “that there is a greater connection between education, which we
use as a proxy for worldly success, and church attendance among Protestants,
especially Presbyterians, than among Catholics.”
Going further, in their test of Weber’s work ethic hypothesis Becker and
Woessman (2009:581) show that Weber was right in his observation that Protes-
tant regions were economically more affluent than Catholic regions (across coun-
tries in 1900 and within Prussia in the second half of the nineteenth century).
However, they reject the hypothesis that the higher economic development of
Protestant regions was based purely on differential work ethics. Instead, they
postulate and test a “human capital theory,” according to which an unintended
side effect of Martin Luther’s 16th century call that everyone be able to read the
Bible, Protestants acquired literacy skills that functioned as human capital in the
economic sphere. Consequently, “a simple economic model predicts that when op-
timizing individual utility, in equilibrium Protestants will have more education
on average than Catholics because they have lower costs and higher benefits of
schooling” (541). Underlining the differential role of education in the Catholic
and Protestant congregations, their results provide empirical support for the fact
that Protestantism led to a better educated population than Catholicism.
We hold that the results presented above indicate that nonprofits founded
and managed by Protestant organizations can be expected to have a higher in-
clination towards education (and therefore to institutions of education) and to
the use of modern, more complex technologies than those managed by Catholic
16This result is related to Glaeser and Sacerdote (2008), who provide evidence and an ex-
planatory model for the empirical finding that education in the US is positively correlated with
church attendance at the individual level but negatively across denominations. This means that
the less educated Christian denominations attract more believers to church but that, within
each denomination, the more educated believers are more often at church than the less educated
ones.
8
organizations.
On the other hand, in their careful meta-study on nonprofit objectives,
Malani et al. (2003:182/3) conclude , “if forced to choose among existing theories,
we would select theories which argue that the distinctive behavior of nonprofit
firms can be explained by the altruistic motives of these firms’ principals as
most consistent with available evidence” (italics added). The role of altruism
and prosocial preferences—especially by workers—in the delivery of social ser-
vices in nonprofits has been well documented and studied in a series of recent
papers.17 Prosocial motivation of decision makers can lead to the overproduction
of services, which may be at odds with efficiency (Francois, 2007).
Lam (2006:179) summarizes research from religious studies: “Although both
Catholicism and Protestantism promote altruism and the pursuit of the com-
mon good, the value orientation of each religion might favor a different course
of action.” She contrasts “the individualist emphasis of Protestantism” and “the
communal emphasis of Catholicism” and confirms that the “Catholic-Protestant
difference in value orientation has been documented in the cross-national research
on the support of social welfare” (179). This is in line with Arrunada (2009:908):
“Catholic moral standards may increase transaction costs in impersonal trading
but also make personal trade easier, [...] With its relatively more homogeneous
standards, Protestantism seems, however, better adapted for impersonal trading
between anonymous parties.”
Summarizing the studies presented above, the following relative impact of
Catholicism and Protestantism evolves, which we will use in the theoretical model
in the subsequent section: First, both Catholicism and Protestantism value al-
truistic behavior (caritas). Hence, the objective function of health care deci-
sion makers of either congregation should increase in patient benefits. Second,
whereas Protestantism has an individualist emphasis and, thereby, a Protestant
decision maker can be expected to maximize the benefit of an individual patient,
the communal emphasis of Catholicism suggests that Catholic decision makers
focus on the group benefit of all patients. Third, a Protestant believer obtains
high reward from measures of worldly success, such as high education. This sug-
gests that Protestant decision makers will be oriented more towards productive
efficiency and attracted by complex procedures and technologies, two economic
17See Francois (2003, 2007), Besley and Ghatak (2005), Francois and Vlassopoulos (2008),
Delfgaauw et al. (2011), and Dur and Zoutenbier (2011).
9
and intellectual measures of success. These differences are the key drivers of our
theoretical model.
3 The Model and Empirical Hypotheses
3.1 A caring monopolistic provider
Patients are characterized by a severity of illness, s ∈ {1, 2}.18 There is a unit
mass of patients at each severity level. Each patient demands one unit of services.
Without treatment, a patient gets zero utility. If treated, a patient gets utility
B = B(X(s)), where X(s) is the level of services received at severity level s and:
B(0) = 0,∂B(·)∂X(s)
> 0,∂2B(·)∂2X(s)
< 0 (1)
Patients are assumed to be fully insured, such that they do not take treat-
ment costs into account when deciding about whether to seek treatment, or not.19
However, patients bear a travel cost to reach the provider. Hence, the market
may not be completely covered. Demand is an increasing function in patient
benefits:
N = N(B(X(s)));∂N(·)∂B
> 0 (2)
Because of (1), demand also increases in the level of services provided:
NX ≡∂N
∂B
dB
dX> 0 (3)
Each patient knows her own type s. The provider learns a patient’s type
during treatment.
There is one provider offering services to the patients. We assume that the
production of a higher intensity of services gets more and more expensive and
that a higher severity level increases the marginal treatment cost. To produce
service intensity X(s), the provider incurs a per patient cost C(s,X(s)), where:20
C(s, 0) = 0,∂C(·)∂X(s)
> 0,∂2C(·)∂2X(s)
≥ 0, C(1, X(s)) < C(2, X(s))∀X > 0 (4)
18The model is inspired by Ellis (1998).19This assumption reflects the situation of nearly all patients in Germany.20In an extension, Section 3.3, we introduce economies of scale.
10
We assume a fully prospective payment system, where the provider receives
a lump sum payment, R(s), from an insurer for each patient that depends upon
the patient’s diagnosis s at time of discharge but does not depend on the level of
services received:21
R(s = 1) < R(s = 2) (5)
The provider’s profit per patient of severity level s is:22
π = R(s)− C(X(s)) (6)
We study a one-stage game looking for a unique Nash equilibrium, where
the provider announces an intensity of services X(s) for each severity level and
demand and payoffs are realized.
Based on the insights from Section 2, we consider a nonprofit provider who
cares both about patient benefits and treatment costs. For ease of exposition,
we assume that the nondistribution constraint is not binding, such that the
provider can actually produce her most preferred service intensity.23 The non-
profit provider is an organization which is governed by a board, which makes de-
cisions according to some decision making rule. Henceforth, when writing about
“the provider”, we refer to the pivotal person on the board—the one determined
by the decision making rule applied—who de facto decides about the nonprofit’s
strategy. Let the provider’s indirect utility from treating one type-s patient:
v(s,X(s)) = B(X(s))− C(s,X(s)) (7)
This implies that the provider has prosocial preferences, as she cares about
the patient’s benefit, but that she also strives to maximize productive efficiency,
21Since 2004 German hospitals have operated under a fully prospective payment system
(Simon, 2008). We assume that the provider reports a patient’s diagnosis s correctly because
insurers could randomly check s after treatment and threaten a provider to revoke the license
to treat an insurer’s patients in case of revealed misreporting.22Recall that nonprofits can legally make profits—they are just prohibited to distribute these
profits to decision makers.23If the nondistribution constraint was binding, the nonprofit decision maker’s objectives were
less relevant for the decision taken. But as the purpose of this model is to construct empirical
hypotheses that differ across objective functions, we focus on the interesting case without a
binding nondistribution constraint. There R(s) is sufficiently high to allow the provider to
produce her most preferred level of services.
11
as treatment costs reduce her utility.24
A rational provider would never choose X(s) such that v(·) < 0. Hence, we
restrict our attention to situations where:
B(X(s)) ≥ C(s,X(s)) (8)
Based on the literature review, we assume that provider j ∈ {C,P} maxi-
mizes the following objective function:
MaxX(s) Vj =2∑s=1
[B(X(s))− C(s,X(s))]Nρ(B(X(s))), (9)
where ρ = 1 if the provider has a Catholic affiliation (C) and ρ = 0 if the provider
has a Protestant affiliation (P). This implies that, for Protestant nonprofits, VP =
v(s,X(s)): the provider cares about the benefit of the one patient who is up
for treatment. In contrast, a Catholic provider gets reward from maximizing the
benefits of all patients net of treatment costs, thereby focusing on the community
of patients rather than on one individual.
3.2 Analysis
If ρ = 0, it follows that NρX = 0. Thus, for a Protestant provider, the solution of
(9) is:
X∗P (s) = {X|BX(X(s)) = CX(s,X(s))} ∀s (10)
X∗P (s) corresponds to the individually efficient service intensity, which equal-
izes the patient’s marginal benefits and marginal treatment costs.
If ρ = 1, the First-Order Condition (FOC) of (9), for every s, is:
[BX(X(s))− CX(s,X(s))]N(B(X(s))) =
− [B(X(s))− C(s,X(s))]NX(B(X(s))) (11)
24In the words of Francois and Vlassopoulos (2008), the provider is characterized by “action-
oriented” or “impure” altruism because v is an increasing function of the provider’s effort, X(s).
See Besley and Ghatak (2005) for a related model of action-oriented altruism. These models
differ from “pure” or “output-oriented” altruism a la Francois (2007), where v would be an
increasing function of B even if B was exogenous to the provider.
12
For a Catholic provider, the equilibrium service intensityX∗C(s) is determined
by (11). By (8), the RHS of (11) is negative. Hence:
X∗C(s) = {X|BX(X(s)) < CX(s,X(s))} ⇒ X∗
C(s) > X∗P (s) (12)
The equilibrium service intensity of a Catholic provider is strictly higher than
the one of a Protestant provider. The reason is that the Catholic provider not only
equates marginal treatment benefits with marginal treatment costs of one patient.
Instead, she partly internalizes that a marginal increase in the service intensity not
only benefits one patient but attracts another patient at the margin. Treating the
marginal patient, too, yields the Catholic provider additional utility. Therefore,
we identify a positive demand effect of caring for one’s community. Given that the
Protestant provider’s service intensity satisfies productive efficiency, (12) implies
that the Catholic provider overproduces service intensity, thereby decreasing the
net treatment benefit per individual patient, B(X(s))− C(s,X(s)).
Combining (2) and (12) produces the following proposition.
Proposition 1 (Equilibrium Demand) Provider C attracts more patients than
provider P:
N∗C(s) > N∗
P (s)⇒2∑s=1
N∗C(s) >
2∑s=1
N∗P (s) (13)
As the provider is reimbursed by the insurer via lump-sum payments per
patient, which are increasing in the severity level, we obtain Proposition 2.
Proposition 2 (Equilibrium Revenues) Provider C generates higher revenues
than provider P:
R(s)N∗C(s) > R(s)N∗
P (s)⇒2∑s=1
R(s)N∗C(s) >
2∑s=1
R(s)N∗P (s) (14)
Intuitively, because she cares for more patients’ benefits, a Catholic provider
sets a higher service intensity than a Protestant provider. This is appreciated
by patients, which increases patient numbers of Catholic providers as compared
to Protestant providers and, due to the payment scheme implemented, lets the
Catholic provider make more revenues than the Protestant provider.
Now define the average revenue of provider j as:
CMIj ≡R(1)N∗
j (s = 1) +R(2)N∗j (s = 2)
N∗j (s = 1) +N∗
j (s = 2), (15)
13
where CMI stands for casemix index, a concept frequently used in health care
economics and corresponding to average revenues of a provider.25 As the average
revenues are determined using standardized reimbursement rates, which distin-
guish among more and less complex treatments, amongst other factors, a higher
CMI corresponds to a higher average complexity of treatments. We prove the
following proposition in the appendix.
Proposition 3 (Average Revenues) The average revenue of provider P is larger
than the average revenue of provider C:
CMIP > CMIC (16)
Although the Catholic provider generates higher revenues in total, the aver-
age revenues of a Protestant provider are higher. The reason for this result is that
the Catholic provider puts relatively more resources into treating low severity pa-
tients because there the marginal cost of production is lower than at the high
severity level but patients’ marginal treatment benefits are equal across severity
levels. This drives up total patient numbers and revenues of the Catholic provider
but reduces her average severity of treatments and, hence, her average revenues.
3.3 Model extension: diversity vs. specialization in treat-
ments
In the baseline model we assumed no fixed costs of operation; see (4). This was a
simplification when considering hospitals. Now let us assume that a variety of m
treatment areas exists, across both severity levels, which a hospital can be active
in. Offering services in each treatment area comes at a fixed cost F > 0, e.g. for
special diagnosis equipment or personnel with a specific education. F can differ
across treatment areas. Moreover, we assume that the marginal cost of treating
another patient, while keeping the service intensity X fixed, is increasing.
In this setting, the number of treatment areas n ∈ {1, ...,m} a hospital is
active in can be seen as a measure of horizontal differentiation—as opposed to
the positioning in the vertical differentiation dimension measured by X(s=2)X(s=1)
. High
25See http://en.wikipedia.org/wiki/Case_mix_index for a description of the concept of
casemix index and its importance in the hospital sector and http://www.oshpd.ca.gov/HID/
Products/PatDischargeData/CaseMixIndex/CMI/ExampleCalculation.pdf for an applica-
tion.
14
n refers to a hospital offering a great variety of treatment areas, whereas low n
refers to a relatively specialized hospital.
The adjusted cost structure implies that the average cost (AC) of treating
a patient in a certain treatment area decreases for small patient numbers and
increases for large patient numbers. The average cost curve has a local minimum,
at the Minimum Efficient Scale (MES). Generalizing across all demand and cost
functions meeting our assumptions in (1) to (4) and using Proposition 1 yields:
prob{N∗C(s) < MES} < prob{N∗
P (s) < MES} (17)
On the hospitals’ revenue side, it is conceivable that the lump sum payment
R(s), which is determined by health insurers and/or the government, is set such
that a hospital can operate with it on a long-term basis. Hence, for ease of
exposition, we assume:26
R(s) = AC(MES) (18)
Rewriting (17) in revenue and cost terms and substituting (18) gives:
prob{AC(N∗C(s)) > R(s)} < prob{AC(N∗
P (s)) > R(s)} (19)
Because providers cannot make losses, prob{AC(N∗j (s)) > R(s)} equals the prob-
ability that it is too expensive for provider j to be active in a treatment area.
This leads to the following result.
Proposition 4 (Diversity and specialization) Catholic hospitals serve any
treatment area with higher probability than Protestant hospitals.
This result captures a simple economies of scale effect. Catholic hospitals
attract more patients, which, in the light of fixed costs, drives down the average
cost of serving one patient in a given treatment area. As the revenue per patient
in a treatment area is also fixed, larger hospitals have a higher probability to
break even and sustain operations in this treatment area than smaller hospitals.
Hence, Catholic hospitals can afford to be active in more treatment areas than
Protestant hospitals.
26Proposition 4 does not depend on this assumption. It holds for any F > R(s) ≥ AC(MES).
For R(s) > F , both providers serve all treatment areas. For R(s) < AC(MES), no treatment
area is served by any provider.
15
3.4 Empirical hypotheses
The equilibrium values identified in Propositions 1 to 3 are unique. Therefore, it
is possible to use them for the construction of empirical hypotheses. We expect
to find the following correlations in our data:
H1: Catholic hospitals should treat more patients than Protestant hospitals
(Proposition 1).
H2: Catholic hospitals should have higher revenues (or total casemix) than
Protestant hospitals (Proposition 2).
H3: The average revenue or Casemix Index (CMI) should be higher in
Protestant than in Catholic hospitals (Proposition 3).
Following the discussion on the differential role of education between the
Catholic and Protestant religions in section 2, we also expect the following cor-
relation:
H4: Protestant hospitals should have more links to universities and other
academic institutions than Catholic providers.
Moreover, the higher complexity of services in Protestant hospitals, captured
by the higher CMI identified in Proposition 3, has to be produced by appropriately
educated personnel. Hence, we construct H5.
H5: We expect Protestant hospitals to employ (a) more doctors per patient
and (b) more specialized doctors per patient than Catholic hospitals.
Finally, the model extension gives rise to H6.
H6: We expect Catholic hospitals to be active in more treatment areas than
Protestant hospitals (Proposition 4).
Being equipped with theoretical results, we move on to the empirical part to
test the validity of our hypotheses.
4 Data and Empirical Results
4.1 The dataset
In order to test the hypothesis of the model we use a newly constructed dataset
covering all German hospitals. In particular, we merge data from the 2006
and 2008 reports published by the German Federal Office for Quality Assur-
ance (Bundesgeschaftsstelle fur Qualitatssicherung or BQS ) and from the 2010
16
Krankenhaus-Report (Klauber, 2010).27 The BQS currently focuses on measur-
ing quality in hospitals but also publishes hospital-level data on ownership sta-
tus, links to universities, and number of patients, doctors, specialists, nurses, and
beds. It also reports information regarding the number of diagnoses in each ICD-
10 category at the 4-digit level. The data are self-reported by the hospitals but
are subject to a “structured dialogue” with experts discussing the reported data.
The BQS makes the standardized reports in xml -format available to interested
researchers. One report is published for each hospital, 1939 reports for 2006 and
1922 reports for 2008. We extracted the relevant data using a computer program
which exploited the standardized format of the reports to recover the variables of
interest. To the best of our knowledge no other researchers have used these data
before.28
The Krankenhaus-Reports instead include data from the German Federal
Statistical Office. We matched 2008 data on casemix index from the Krankenhaus-
Report (Klauber, 2010) to the data from the 2006 and 2008 BQS reports, respec-
tively.
While the BQS data provide information on whether the hospital is non-
profit, public, or for-profit, they do not explicitly distinguish between different
types of nonprofit hospitals. We thus classified nonprofit hospitals into Protes-
tant, Catholic, and other types of hospitals by looking ourselves at the hospital
denomination and affiliation provided in the first section of each BQS report. All
Catholic hospitals are a member of the Caritas organization (www.caritas.de/),
all Protestant hospitals are a member of Diakonisches Werk (www.diakonie.
de/).
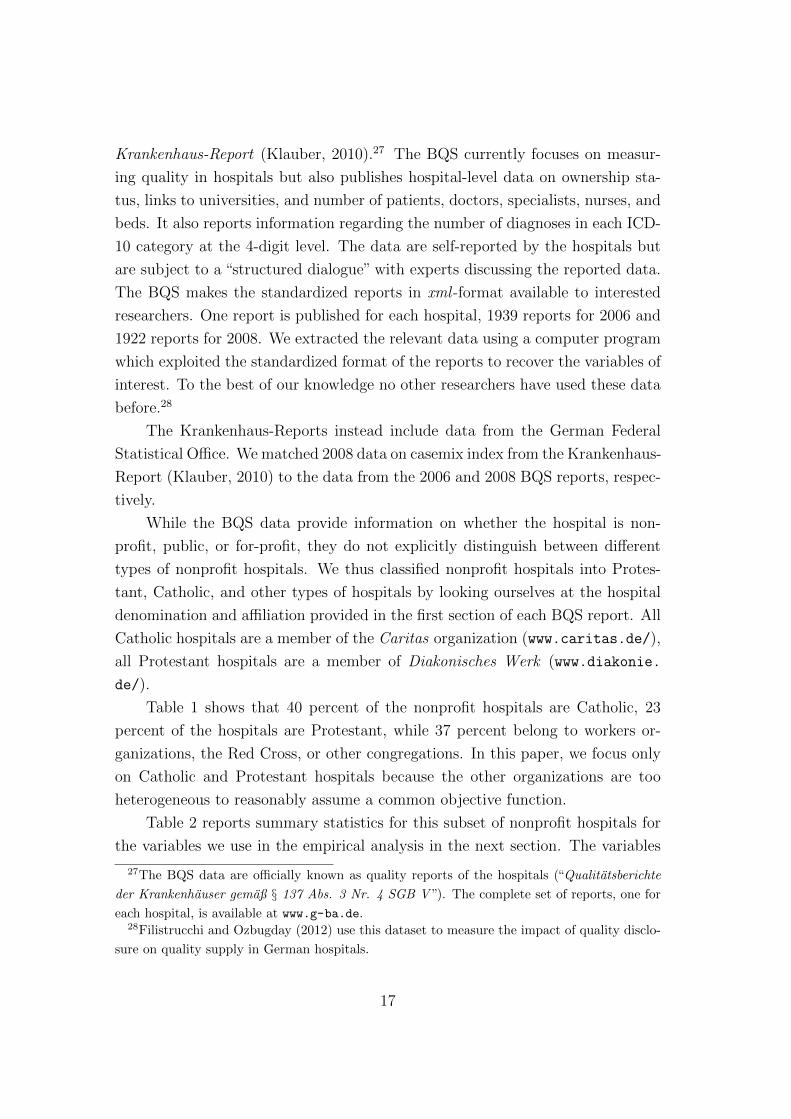
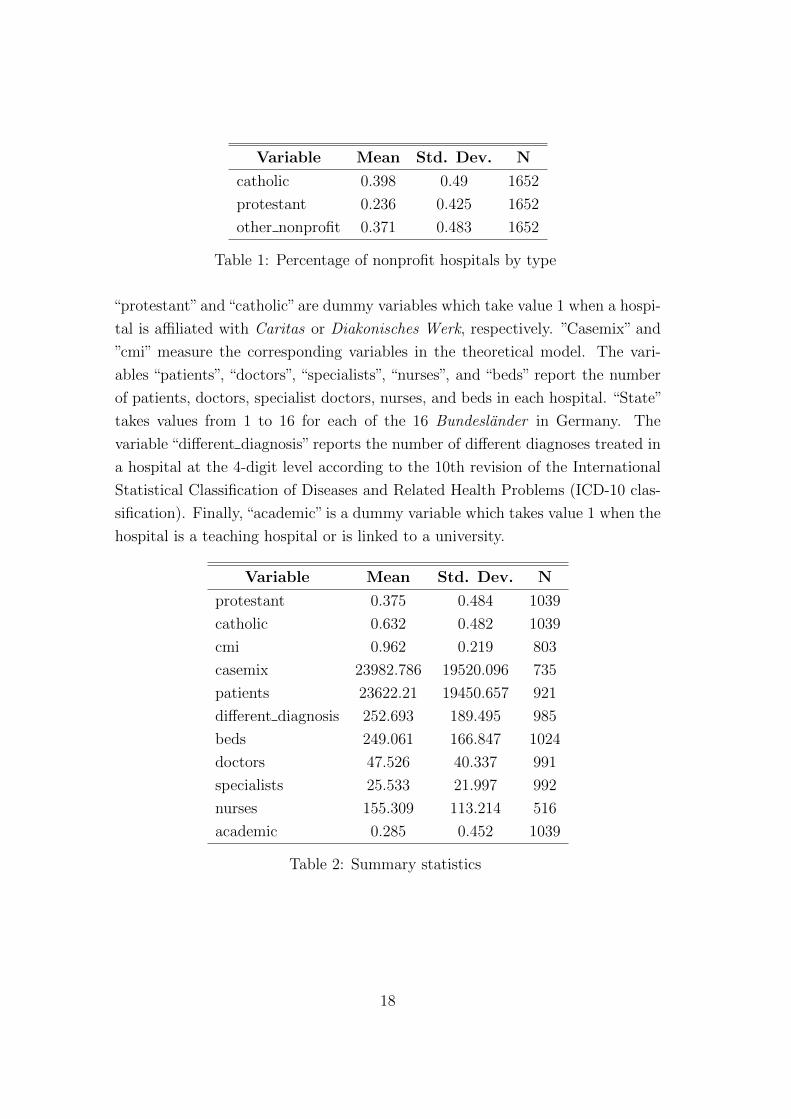
Table 1 shows that 40 percent of the nonprofit hospitals are Catholic, 23
percent of the hospitals are Protestant, while 37 percent belong to workers or-
ganizations, the Red Cross, or other congregations. In this paper, we focus only
on Catholic and Protestant hospitals because the other organizations are too
heterogeneous to reasonably assume a common objective function.
Table 2 reports summary statistics for this subset of nonprofit hospitals for
the variables we use in the empirical analysis in the next section. The variables
27The BQS data are officially known as quality reports of the hospitals (“Qualitatsberichte
der Krankenhauser gemaß § 137 Abs. 3 Nr. 4 SGB V ”). The complete set of reports, one for
each hospital, is available at www.g-ba.de.28Filistrucchi and Ozbugday (2012) use this dataset to measure the impact of quality disclo-
sure on quality supply in German hospitals.
17
Variable Mean Std. Dev. N
catholic 0.398 0.49 1652
protestant 0.236 0.425 1652
other nonprofit 0.371 0.483 1652
Table 1: Percentage of nonprofit hospitals by type
“protestant”and“catholic”are dummy variables which take value 1 when a hospi-
tal is affiliated with Caritas or Diakonisches Werk, respectively. ”Casemix” and
”cmi” measure the corresponding variables in the theoretical model. The vari-
ables “patients”, “doctors”, “specialists”, “nurses”, and “beds” report the number
of patients, doctors, specialist doctors, nurses, and beds in each hospital. “State”
takes values from 1 to 16 for each of the 16 Bundeslander in Germany. The
variable “different diagnosis” reports the number of different diagnoses treated in
a hospital at the 4-digit level according to the 10th revision of the International
Statistical Classification of Diseases and Related Health Problems (ICD-10 clas-
sification). Finally, “academic” is a dummy variable which takes value 1 when the
hospital is a teaching hospital or is linked to a university.
Variable Mean Std. Dev. N
protestant 0.375 0.484 1039
catholic 0.632 0.482 1039
cmi 0.962 0.219 803
casemix 23982.786 19520.096 735
patients 23622.21 19450.657 921
different diagnosis 252.693 189.495 985
beds 249.061 166.847 1024
doctors 47.526 40.337 991
specialists 25.533 21.997 992
nurses 155.309 113.214 516
academic 0.285 0.452 1039
Table 2: Summary statistics
18
4.2 Empirical strategy
We now test the six hypotheses stemming from the theoretical model and proceed
in order from H1 to H6. Since the hypotheses put forward by the model refer
to differences between Protestant and Catholic hospitals in the means of the
variables of interest, our empirical strategy is a simple one: we run a linear
regression of the variable of interest on a dummy variable which takes value 1 if
the hospital has a Protestant affiliation, controlling for year specific fixed effects
when data on more than one year are available and, where necessary, controlling
for additional relevant factors. We thus run a series of linear regressions of the
form:
Xit = α + λPROTESTANTi + γYEAR2008t + δZit + εit, (20)
where Xit is the variable of interest for hospital i in year t, YEAR2008 is a dummy
variable equal to 1 if the observed data is for 2008, Zit is one or more control
variables and εit is a normally distributed unobserved error term. A positive
and significant λ implies that the mean of the variable of interest is higher for
Protestant nonprofit hospitals than for Catholic nonprofit hospitals. Vice versa, a
negative and significant λ implies that the mean of the variable of interest is lower
for Protestant nonprofit hospitals than for Catholic nonprofit hospitals. Finally,
we also estimate a fixed effects specification:
Xit = α + ϕs + λPROTESTANTi + γYEAR2008t + δZit + εit, (21)
where ϕs are state (Bundesland) fixed effects. This specification allows to control
for differences across states, which might affect the difference in the variable of
interest among Catholic and Protestant nonprofit hospitals. In other words, in
the latter specification, we estimate λ from within state differences in the variable
of interest. λ hence measures the average of the within-state differences in the
variables of interest between the two types of religious hospitals.
4.3 Estimation results
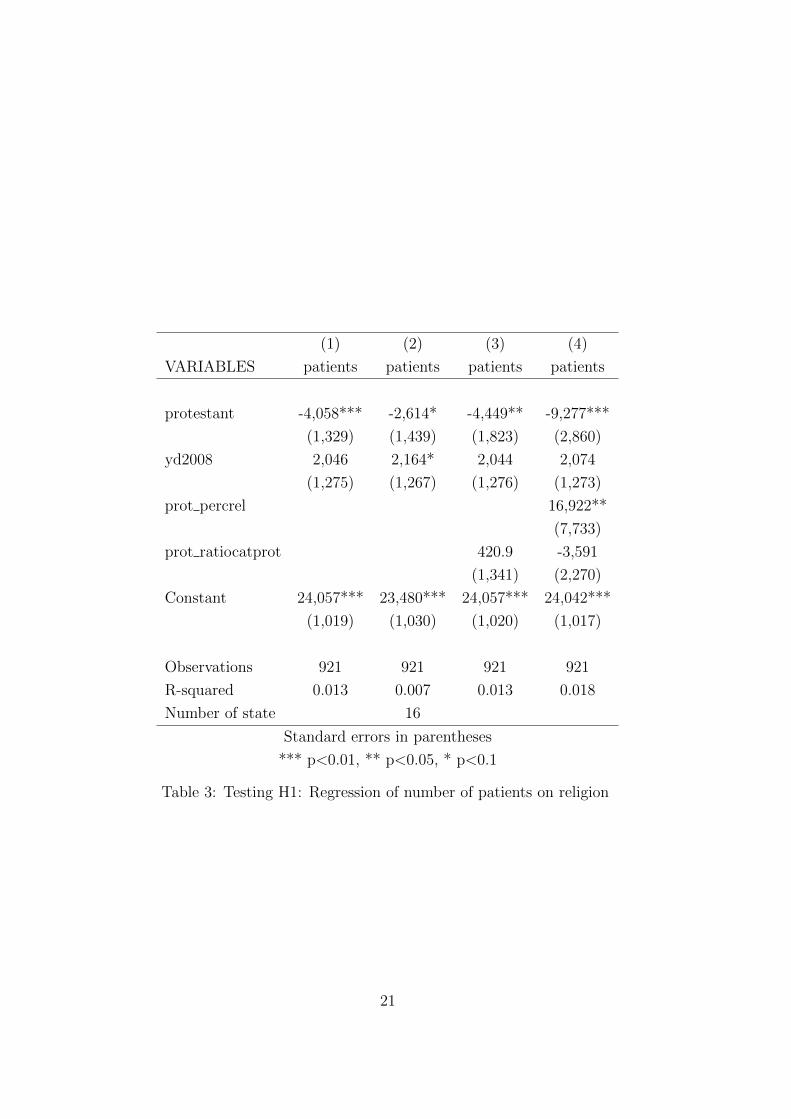
Table 3 tests H1 and shows results of regressions of patients on a hospital’s reli-
gious affiliation. The first column presents results of an Ordinary Least Squares
(OLS) estimate without controls. It shows that on average Protestant nonprofit
hospitals have a significantly lower number of patients than Catholic ones, as
19
predicted by the model. One may wonder whether the difference in the mean
number of patients is driven by differences among states rather than among hos-
pitals. Indeed, some states are mainly Protestant, others are mainly Catholic.
Then the Protestant variable in the specification of column one could pick up
differences between Catholic and Protestant states rather than between Catholic
and Protestant hospitals.
The second column reports results of a Least Squares Dummy Variable
(LSDV) estimator using state fixed effects. Here the effect of the religious af-
filiation is estimated using within state variations. Albeit lower, the mean num-
ber of patients in Protestant hospitals is still negative and significant. Another
confounding factor could be that Protestant patients go to Protestant hospitals
and Catholic patients go to Catholic hospitals. If so, the number of patients in
Protestant hospitals should be lower the higher the number of Catholics rela-
tive to Protestants. Moreover, the difference in the number of patients between
Catholic and Protestant hospitals could depend on the share of religious people
in the population. The third and fourth column show OLS estimates of the mean
number of patients, which include interaction terms of the Protestant dummy
with the percentage of religious people in a state (PROT PERCREL) and the
ratio of Catholics to Protestants (PROT RATIOCATPROT) in the state where
the hospital is located. They both confirm that Protestant hospitals have fewer
patients, as postulated in H1.
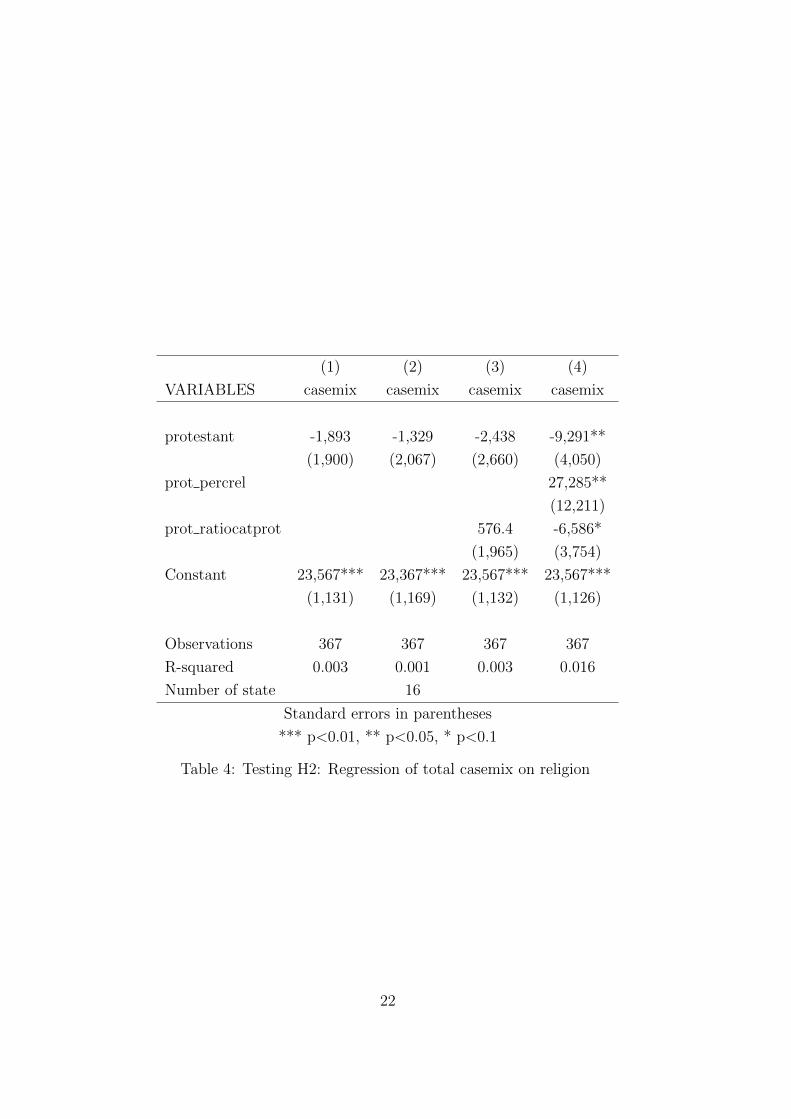
Table 4 tests H2 and shows results of regressions of casemix on a hospital’s
religious affiliation. Column one presents results of an OLS estimate without
controls: on average Protestant nonprofit hospitals have a lower total casemix
than Catholic ones, as predicted by the model, but this difference is not statis-
tically significant. This finding is confirmed when using a LSDV specification
with state dummy variables (column two). The difference is also estimated to
be insignificant when allowing the difference in the mean casemix to change de-
pending on the ratio of Catholics to Protestants in the state where the hospital
is located (column three). Notably, it is estimated to be negative and significant,
as predicted by H2, when allowing for both the percentage of religious people
and the ratio of Catholics to Protestants in the state of the hospital to affect the
difference in mean casemix between Catholic and Protestant hospitals (column
four).
These results indicate that a higher percentage of religious people in the
state (PROT PERCREL) increases the casemix of Protestant hospitals relative
20
(1) (2) (3) (4)
VARIABLES patients patients patients patients
protestant -4,058*** -2,614* -4,449** -9,277***
(1,329) (1,439) (1,823) (2,860)
yd2008 2,046 2,164* 2,044 2,074
(1,275) (1,267) (1,276) (1,273)
prot percrel 16,922**
(7,733)
prot ratiocatprot 420.9 -3,591
(1,341) (2,270)
Constant 24,057*** 23,480*** 24,057*** 24,042***
(1,019) (1,030) (1,020) (1,017)
Observations 921 921 921 921
R-squared 0.013 0.007 0.013 0.018
Number of state 16
Standard errors in parentheses
*** p<0.01, ** p<0.05, * p<0.1
Table 3: Testing H1: Regression of number of patients on religion
21
(1) (2) (3) (4)
VARIABLES casemix casemix casemix casemix
protestant -1,893 -1,329 -2,438 -9,291**
(1,900) (2,067) (2,660) (4,050)
prot percrel 27,285**
(12,211)
prot ratiocatprot 576.4 -6,586*
(1,965) (3,754)
Constant 23,567*** 23,367*** 23,567*** 23,567***
(1,131) (1,169) (1,132) (1,126)
Observations 367 367 367 367
R-squared 0.003 0.001 0.003 0.016
Number of state 16
Standard errors in parentheses
*** p<0.01, ** p<0.05, * p<0.1
Table 4: Testing H2: Regression of total casemix on religion
22
to Catholic ones while a higher ratio of Catholics relative to Protestants in the
state (PROT RATIOCATPROT) decreases it. Overall, results in Table 4 provide
weak evidence in favor of the hypothesis that Protestant hospitals have a lower
casemix than Catholic ones, as postulated by H2.
In the fourth columns of Table 3 and Table 4, results show that the difference
between Catholic and Protestant hospitals, keeping fixed the ratio of Catholic to
Protestant believers, declines the higher the number of religious people: the sign
of the interaction term PROT PERCREL is the opposite of that of the PROTES-
TANT dummy in both tables. A possible explanation is that, when religiousness
is a more conscious choice—as it may be in a state where less religious people
live—the intensity of beliefs of those who choose to reveal their religiousness may
be higher than in states where the default is to be religious. This may strengthen
the role of religious values for the decisions made by people in less religious states.
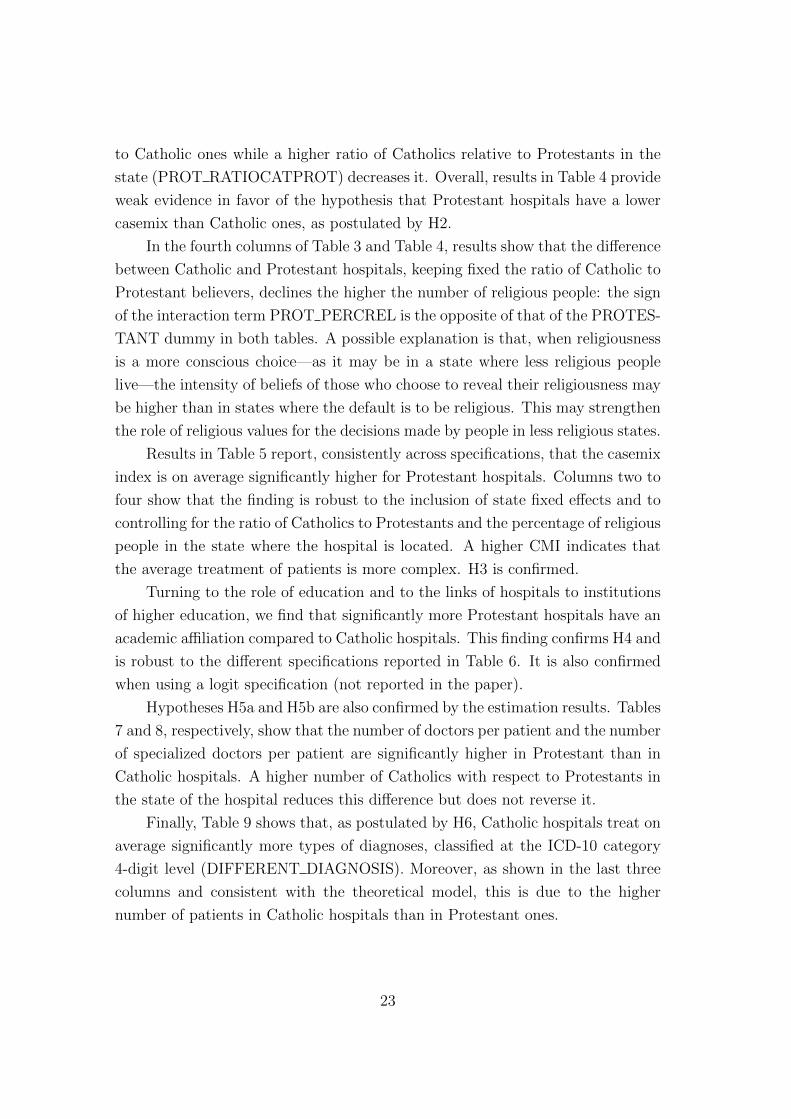
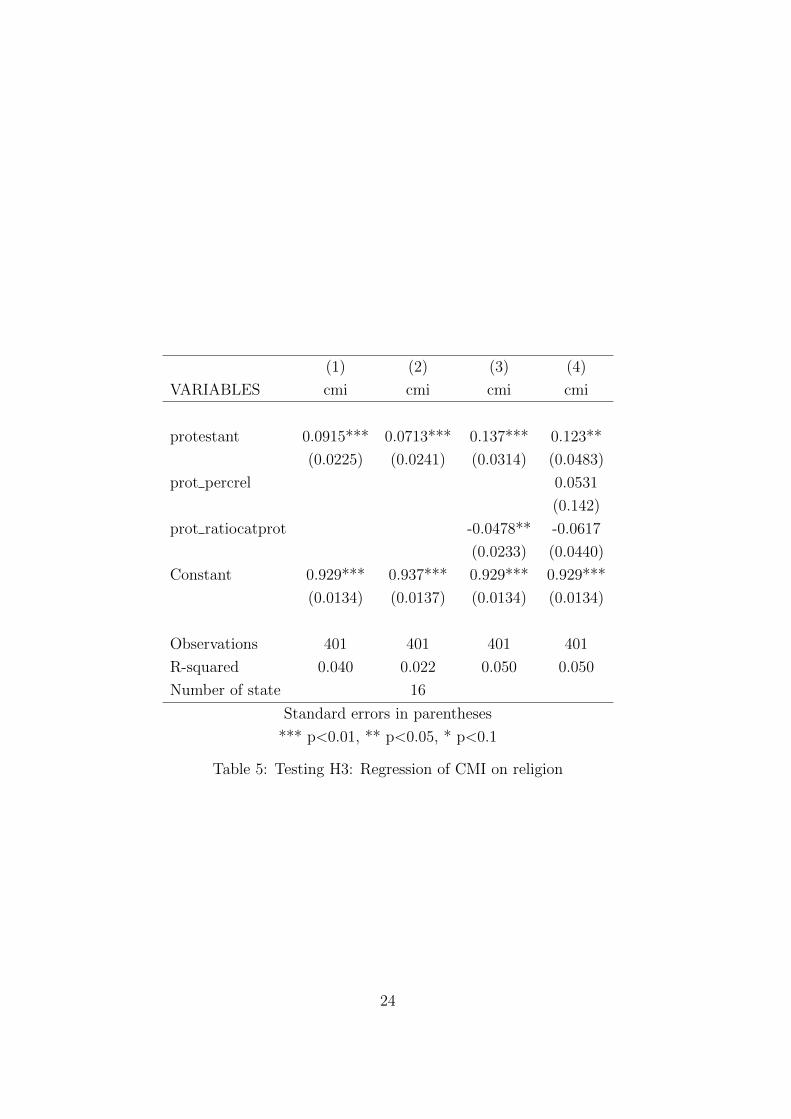
Results in Table 5 report, consistently across specifications, that the casemix
index is on average significantly higher for Protestant hospitals. Columns two to
four show that the finding is robust to the inclusion of state fixed effects and to
controlling for the ratio of Catholics to Protestants and the percentage of religious
people in the state where the hospital is located. A higher CMI indicates that
the average treatment of patients is more complex. H3 is confirmed.
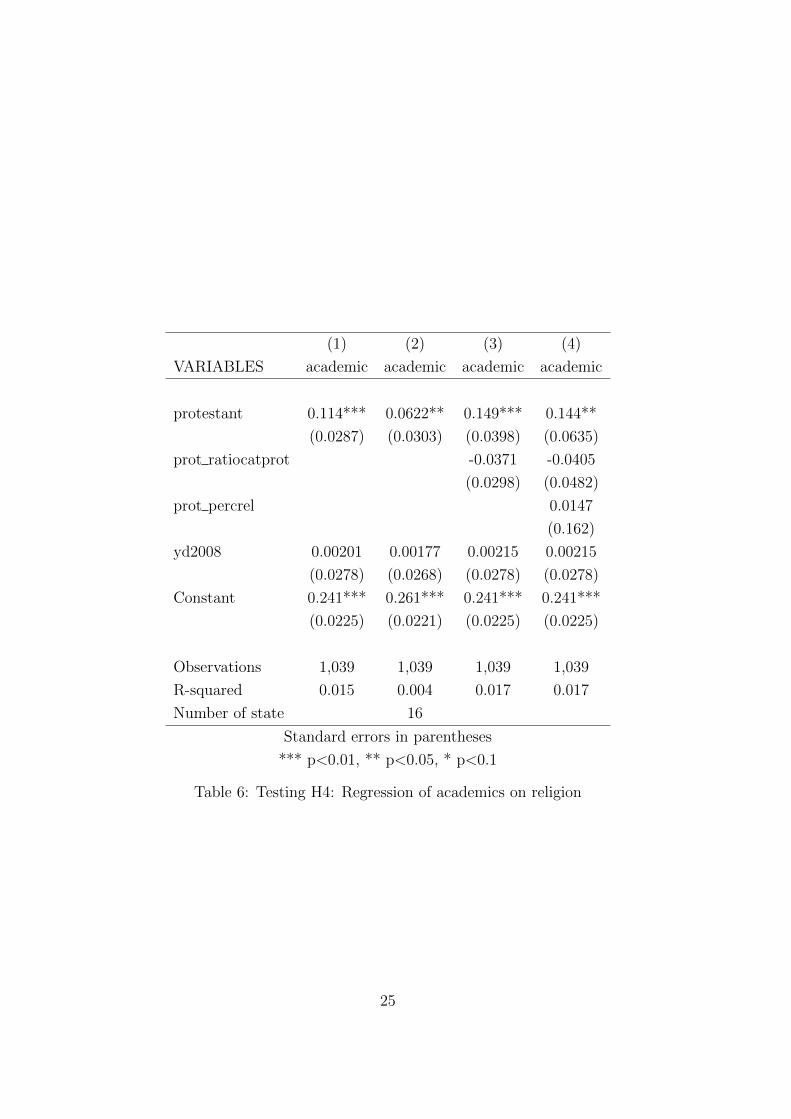
Turning to the role of education and to the links of hospitals to institutions
of higher education, we find that significantly more Protestant hospitals have an
academic affiliation compared to Catholic hospitals. This finding confirms H4 and
is robust to the different specifications reported in Table 6. It is also confirmed
when using a logit specification (not reported in the paper).
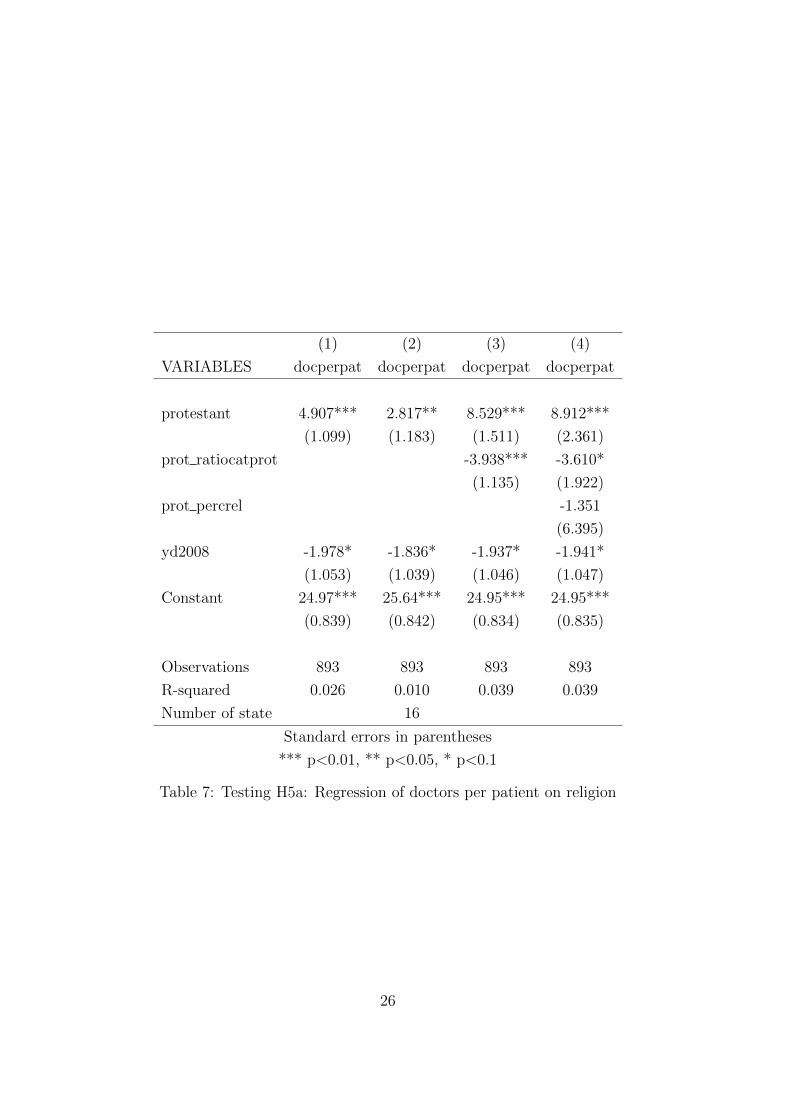
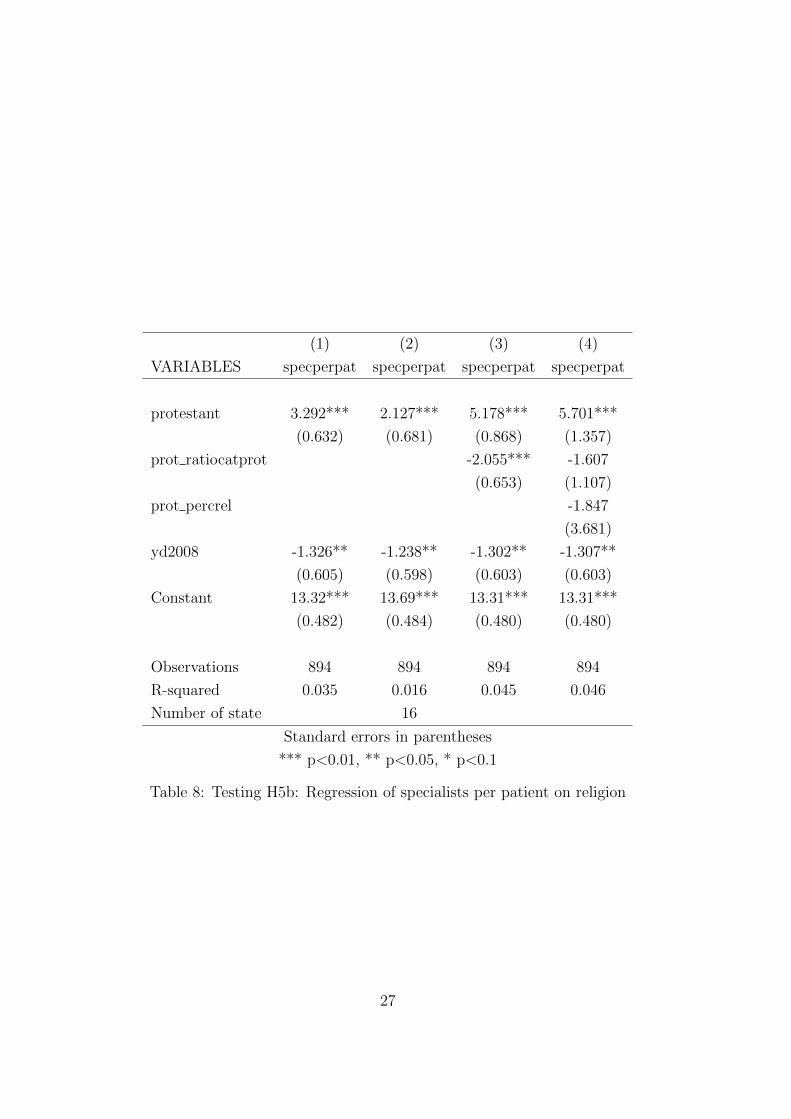
Hypotheses H5a and H5b are also confirmed by the estimation results. Tables
7 and 8, respectively, show that the number of doctors per patient and the number
of specialized doctors per patient are significantly higher in Protestant than in
Catholic hospitals. A higher number of Catholics with respect to Protestants in
the state of the hospital reduces this difference but does not reverse it.
Finally, Table 9 shows that, as postulated by H6, Catholic hospitals treat on
average significantly more types of diagnoses, classified at the ICD-10 category
4-digit level (DIFFERENT DIAGNOSIS). Moreover, as shown in the last three
columns and consistent with the theoretical model, this is due to the higher
number of patients in Catholic hospitals than in Protestant ones.
23
(1) (2) (3) (4)
VARIABLES cmi cmi cmi cmi
protestant 0.0915*** 0.0713*** 0.137*** 0.123**
(0.0225) (0.0241) (0.0314) (0.0483)
prot percrel 0.0531
(0.142)
prot ratiocatprot -0.0478** -0.0617
(0.0233) (0.0440)
Constant 0.929*** 0.937*** 0.929*** 0.929***
(0.0134) (0.0137) (0.0134) (0.0134)
Observations 401 401 401 401
R-squared 0.040 0.022 0.050 0.050
Number of state 16
Standard errors in parentheses
*** p<0.01, ** p<0.05, * p<0.1
Table 5: Testing H3: Regression of CMI on religion
24
(1) (2) (3) (4)
VARIABLES academic academic academic academic
protestant 0.114*** 0.0622** 0.149*** 0.144**
(0.0287) (0.0303) (0.0398) (0.0635)
prot ratiocatprot -0.0371 -0.0405
(0.0298) (0.0482)
prot percrel 0.0147
(0.162)
yd2008 0.00201 0.00177 0.00215 0.00215
(0.0278) (0.0268) (0.0278) (0.0278)
Constant 0.241*** 0.261*** 0.241*** 0.241***
(0.0225) (0.0221) (0.0225) (0.0225)
Observations 1,039 1,039 1,039 1,039
R-squared 0.015 0.004 0.017 0.017
Number of state 16
Standard errors in parentheses
*** p<0.01, ** p<0.05, * p<0.1
Table 6: Testing H4: Regression of academics on religion
25
(1) (2) (3) (4)
VARIABLES docperpat docperpat docperpat docperpat
protestant 4.907*** 2.817** 8.529*** 8.912***
(1.099) (1.183) (1.511) (2.361)
prot ratiocatprot -3.938*** -3.610*
(1.135) (1.922)
prot percrel -1.351
(6.395)
yd2008 -1.978* -1.836* -1.937* -1.941*
(1.053) (1.039) (1.046) (1.047)
Constant 24.97*** 25.64*** 24.95*** 24.95***
(0.839) (0.842) (0.834) (0.835)
Observations 893 893 893 893
R-squared 0.026 0.010 0.039 0.039
Number of state 16
Standard errors in parentheses
*** p<0.01, ** p<0.05, * p<0.1
Table 7: Testing H5a: Regression of doctors per patient on religion
26
(1) (2) (3) (4)
VARIABLES specperpat specperpat specperpat specperpat
protestant 3.292*** 2.127*** 5.178*** 5.701***
(0.632) (0.681) (0.868) (1.357)
prot ratiocatprot -2.055*** -1.607
(0.653) (1.107)
prot percrel -1.847
(3.681)
yd2008 -1.326** -1.238** -1.302** -1.307**
(0.605) (0.598) (0.603) (0.603)
Constant 13.32*** 13.69*** 13.31*** 13.31***
(0.482) (0.484) (0.480) (0.480)
Observations 894 894 894 894
R-squared 0.035 0.016 0.045 0.046
Number of state 16
Standard errors in parentheses
*** p<0.01, ** p<0.05, * p<0.1
Table 8: Testing H5b: Regression of specialists per patient on religion
27

(1)
(2)
(3)
(4)
VA
RIA
BL
ES
diff
eren
tdia
gnos
isdiff
eren
tdia
gnos
isdiff
eren
tdia
gnos
isdiff
eren
tdia
gnos
is
pro
test
ant
-30.
64**
-31.
90**
6.29
8-4
.364
(12.
55)
(13.
48)
(8.0
74)
(8.6
54)
yd20
0812
.00
11.9
8-6
.675
-6.3
38
(12.
05)
(11.
90)
(7.6
73)
(7.6
12)
pat
ients
0.00
761*
**0.
0075
7***
(0.0
0019
8)(0
.000
199)
Con
stan
t25
7.7*
**25
8.1*
**86
.80*
**91
.14*
**
(9.6
44)
(9.7
11)
(7.7
95)
(7.7
95)
Obse
rvat
ions
985
985
883
883
R-s
quar
ed0.
007
0.00
70.
628
0.62
8
Num
ber
ofst
ate
1616
Sta
ndar
der
rors
inpar
enth
eses
***
p<
0.01
,**
p<
0.05
,*
p<
0.1
Table 9: Testing H6: Regression of number of different diagnoses on religion
28
5 Conclusion
To tackle the difficulties of the empirical and theoretical literatures on nonprofit
organizations in predicting nonprofits’ behavior in the market, we have posited
that the generally accepted definition of nonprofits is too broad. Instead we have
conjectured that several types of nonprofits exist, which depend on nonprofits’
governance structures, which are distinguishable according to observable organi-
zational characteristics, and which employ different strategies, thereby producing
different economic outcomes.
When looking at the organizational characteristics of nonprofit hospitals in
Germany, we found that at least three subgroups exist: those in Catholic own-
ership, those in Protestant ownership, and those affiliated to a bundle of hetero-
geneous owners. Due to the relatively high degree of homogeneity of Catholic
theology and Protestant theology, respectively, in Germany as compared to other
countries, it was possible to apply a key insight from the literature on the com-
parative economic effects of these two denominations: both Catholicism and
Protestantism value prosocial behavior. However, while Protestantism has an
individualist emphasis, Catholicism has a communal emphasis.
We used this distinction as the only differentiating assumption between
Catholic and Protestant providers in a simple model of a health care market.
This model generated predictions about the differences in patient numbers, total
revenues, average revenues, links to academic institutions, use of highly skilled
labor, and diversity of treatment areas.
Testing the hypotheses on a dataset covering all German hospitals for the
years 2006 and 2008, we found that the empirical patterns confirm the market
behavior of Catholic and Protestant nonprofit hospitals predicted by the model.
These results highlight several contributions of our paper. First, Catholic
hospitals in Germany follow a strategy of horizontal diversification and maxi-
mization of the number of patients treated. By contrast, Protestant hospitals
specialize in fewer treatment areas horizontally and focus more on vertical differ-
entiation by producing more complex services on average, which they generate
with more specialized labor (doctors and specialized doctors per patient). They
also have more links to universities and other institutions of higher education.
Second, these findings suggest that religious values that have been shaped
over hundreds of years influence the objectives of decision makers affiliated with
the respective congregations today in significant ways. This insight calls for more
29
research on the long-lasting effects of religious and other values on the objectives
of economic subjects and how these values can be shaped by organizations.
Most importantly, our findings suggest that different types of nonprofits exist
and that we can distinguish among them by using observable criteria. The caveat
applicable here is that the dependence of these results on the institutional context
mentioned by Eggleston et al. (2008), which we report on in Section 2, cannot be
fully refuted. Our study has used data from today’s Germany, and it is the task of
future research to verify whether similar results differentiating among nonprofit
types can be found in other contexts, too.
Nevertheless, the inputs and outputs of all methodologies used in this pa-
per fit well together: the literature review on the economic effects of Catholic
and Protestant values in Section 2 generated assumptions used in our theoretical
model in Section 3, which generated hypotheses on nonprofits’ market behav-
ior that were confirmed by the econometric estimations in Section 4. Closing
the circle, the empirical results reinforce the differences between Catholic and
Protestant values identified in the literature (Section 2).
Therefore, we argue that it is insufficient to treat nonprofits as one unified
group of organizations, which are only contrasted with for-profit and public or-
ganizations. Instead, nonprofits should be subdivided in smaller groups, where
the heterogeneity within the groups is limited, and we therefore have more reason
to assume homogeneous objective functions when studying their behavior. This
serves as a basis for a theory of nonprofit organizations that can explain and
predict nonprofit behavior better than previous theories.
Our results imply for future studies of the market behavior of nonprofit
organizations that they should distinguish between different nonprofit types, de-
pending on observable organizational characteristics found in the market at study.
For policy makers, law makers, and antitrust authorities, it implies that rules and
regulations should take the heterogeneity of governance and ownership structures
of nonprofits into account.
30
References
Arrunada, B. 2009. “Protestants and Catholics: Similar Work Ethic, Different
Social Ethic,” Economic Journal, 120, 890-918.
Baumann, M. 2007. ”Researching Religious Diversity in Western Europe: The
Study of Diaspora Communities, Religious Conflict, and Public Domain in
Germany and Switzerland”, in: K.S. Nathan (ed.), Religious Pluralism in
Democratic Societies: Challenges and Prospects for Southeast Asia, Europe
and the United States in the New Millennium, Singapore, Kuala Lumpur:
K. Adenauer Stiftung, Malaysian Ass. for American Studies, 139-157.
Becker, S.O. and L. Woessmann. 2009. “Was Weber Wrong? A Human Capital
Theory of Protestant Economic History,” Quarterly Journal of Economics,
531-596.
Besley, T. and M. Ghatak. 2005. “Competition and Incentives with Motivated
Agents,” American Economic Review, 95(3), 616-636.
Castaneda, M.A., Garen, J. and J. Thornton. 2007. “Competition, Contractibil-
ity, and the Market for Donors to Nonprofits,” Journal of Law, Economics,
& Organization, 24(1), 215-246.
Delfgaauw, J., Dur, R., Propper, C. and S. Smith. 2011. “Management Prac-
tices: Are Not For Profits Different?,” Tinbergen Institute Discussion Paper
TI 2011-094/1.
Dur, R. and R. Zoutenbier. 2011. “Working for a Good Cause,” Tinbergen
Institute Discussion Paper TI 2011-168/1.
Eggleston, K., Shen, Y.-C, Lau, J., Schmid, C.H., and J. Chan. 2008. “Hospital
Ownership and Quality of Care: What Explains the Different Results in
the Literature?,” Health Economics, 17, 1345-62.
Ellis, R.P. 1998. “Creaming, skimping and dumping: provider competition on
the intensive and extensive margins,”Journal of Health Economics, 17, 537-
555.
Filistrucchi, L. and F.C. Ozbugday. 2012. “Mandatory Quality Disclosure and
Quality Supply: Evidence from German Hospitals.” TILEC Discussion Pa-
per 2012-031, Tilburg University.
31
Francois, P. 2003. “Not-For-Profit Provision of Public Services,” The Economic
Journal, 113, C53-C61.
Francois, P. 2007. “Making a difference,” RAND Journal of Economics, 38(3),
714-732.
Francois, P. and M. Vlassopolous. 2008. “Prosocial Motivation and Delivery of
Social Services,” CESifo Economic Studies, 54 (1), 22-54.
Gertler, P. and J. Kuan. 2009. “Does It Matter Who Your Buyer Is? The Role
of Nonprofit Mission in the Market for Corporate Control of Hospitals,”
Journal of Law and Economics, 52, 295-306.
Ghatak, M. and H. Mueller. 2011. “Thanks for nothing? Not-for-profits and
motivated agents,” Journal of Public Economics, 95, 94-05.
Glaeser, E.L. 2003. “Introduction,” in: E.L. Glaeser (ed.), The Governance of
Not-for-Profit Organizations, University of Chicago Press.
Glaeser, E.L. and S. Glendon. 1998. “Incentives, Predestination and Free Will,”
Economic Inquiry, 36, 429-443.
Glaeser, E.L. and A. Shleifer. 2001. “Not-For-Profits Entrepreneurs,” Journal
of Public Economics, 81, 99-115.
Glaeser, E.L. and B.I. Sacerdote. 2008. “Education and Religion,” Journal of
Human Capital, 2, 188-215.
Grossman, S.J. and O. Hart. 1986. “The costs and benefits of ownership: A
theory of vertical and lateral integration,” Journal of Political Economy,
94, 235-259.
Hansmann, H. 1980. “The Role of Nonprofit Enterprise,” The Yale Law Journal,
89(5), 835-901.
Hansmann, H. 1996. The Ownership of Enterprise, Belknap/Harvard University
Press, Cambridge, MA.
Hansmann, H., Kessler, D. and M. McClellan. 2003. “Ownership Form and
Trapped Capital in the Hospital Industry,” in: E.L. Glaeser (ed.), The Gov-
ernance of Not-for-Profit Organizations, University of Chicago Press.
32

Hart, O. and J. Moore. 1990. “Property rights and the nature of the firm,”
Journal of Political Economy, 98, 1119-1158.
Herbst, P. and J. Prufer. 2007. “Firms, Nonprofits, and Cooperatives: A Theory
of Organizational Choice,” CentER Discussion Paper, No. 2007-07; Tilburg
University.
Horwitz, J. 2007. “Does Nonprofit Ownership Matter?,” Yale Journal on Regu-
lation, 24(1), 139-204.
Horwitz, J. and A. Nichols. 2007. “What Do Nonprofits Maximize? Nonprofit
Hospital Service Provision And Market Ownership Mix,” NBER Working
Paper, 13246.
Jensen, M.C. and R.S. Ruback. 1983. “The Market for Corporate Control,”
Journal of Financial Economics, 11: 5-50.
Klauber, J. 2009. Krankenhaus-Report 2010. Schattauer Verlag: Stuttgart.
Lakdawalla, D. and T. Philipson. 2006. “The Nonprofit Sector and Industry
Performance,” Journal of Public Economics, 90, 1681-1698.
Lam, Pui-Yan. 2006. “Religion and Civic Culture: A Cross-National Study
of Voluntary Association Membership,” Journal for the Scientific Study of
Religion, 45(2), 177-193.
Levy, G. and R. Razin. 2012. “Religious Beliefs, Religious Participation, and
Cooperation,” American Economic Journal: Microeconomics, 4(3): 121-
151.
Malani, A., Philipson, T. and G. David. 2003. “Theories of Firm Behavior
in the Nonprofit Sector: A Synthesis and Empirical Evaluation,” in: E.L.
Glaeser (ed.), The Governance of Not-for-Profit Organizations, University
of Chicago Press.
Newhouse, J.P. 1970. “Toward a Theory of Nonprofit Institutions: an Economic
Model of a Hospital,” American Economic Review, 60, 64-74.
Pauly, M.V. and M. Redisch. 1973. “The Not-For-Profit Hospital as a Physi-
cians’ Cooperative,” American Economic Review, 63(1), 87-99.
33
Prufer, J. 2011. “Competition and Mergers among Nonprofits,” Journal of Com-
petition Law & Economics, 7(1), 69-92.
Rennhoff, A.D. and M.F. Owens. 2012. “Competition and the Strategic Choices
of Churches,”American Economic Journal: Microeconomics, 4(3): 152-170.
Sloan, F.A. 2000. ”Not-for-profit ownership and hospital behavior,” in: A.J.
Culyer & J.P. Newhouse (ed.), Handbook of Health Economics : 1141-1174.
Simon, M. 2008. Das Gesundheitssystem in Deutschland. Eine Einfuhrung in
Struktur und Funktionsweise. 2nd ed. Verlag Huber: Bern.
van Hoorn, A. and R. Maseland. 2013. “Does a Protestant work ethic exist?
Evidence from the well-being effect of unemployment,”Journal of Economic
Behavior and Organization, http://dx.doi.org/10.1016/j.jebo.2013.
03.038.
Vlassopoulos, M. 2009. “Quality, Reputation and the Choice of Organizational
Form,” Journal of Economic Behavior and Organization, 71, 515-527.
Weisbrod, B.A. 1988. The Nonprofit Economy. Harvard University Press: Cam-
bridge, MA.
34

A Appendix
A.1 Proof of Proposition 3
First, we have to establish how the equilibrium service intensity, X∗(s), and the
difference in service intensities between providers, X∗C(s)−X∗
P (s), change across
severity levels.
According to (4), C(X(s = 1)) < C(X(s = 2))∀X > 0 but, according to (1),
B(X(s = 1)) = B(X(s = 2)). Applying these relations to (11), c.p. the RHS
is less negative for s = 2 than for s = 1. Additionally, because C(X(s = 1)) <
C(X(s = 2)), the LHS is more negative for s = 2 than for s = 1. Hence, when
moving from s = 1 to s = 2, any provider reduces X∗(s):
X∗(s = 1) > X∗(s = 2) (A.1)
Define ∆X∗(s) ≡ X∗C(s)−X∗
P (s). It follows from (12) that ∆X∗(s) > 0.
What is the impact of changing severity s on ∆X∗(s)? A Protestant provider,
after a change from s = 1 to s = 2, reduces X(s) by the amount dictated by
the different slopes of the cost functions, CX(s = 1, X(s = 1)) and CX(s =
2, X(s = 2)), according to (10). A Catholic Provider does the same, according
to (11), but additionally reduces X(s) because the demand effect of caring for
one’s community, captured by N(B(X(s)))NX(B(X(s)))
, is less pronounced for the smaller set
of (s = 2)-patients than for the (s = 1)-patients the provider will treat, due to
C(X(s = 1)) < C(X(s = 2)):
X∗C(s = 1)−X∗
C(s = 2) > X∗P (s = 1)−X∗
P (s = 2) (A.2)
⇔ ∆X∗(s = 1) > ∆X∗(s = 2) (A.3)
Now we have to show how this affects average revenues. (A.3) implies:
X∗C(s = 1)
X∗C(s = 2)
>X∗P (s = 1)
X∗P (s = 2)
(A.4)
Because of (1) and (2), (A.4) translates into:
N∗C(s = 1)
N∗C(s = 2)
>N∗P (s = 1)
N∗P (s = 2)
(A.5)
Substituting (15) in (16) and rearranging gives:
R(1)
(N∗P (s = 1)
N∗P (s = 1) +N∗
P (s = 2)− N∗
C(s = 1)
N∗C(s = 1) +N∗
C(s = 2)
)> R(2)
(N∗C(s = 2)
N∗C(s = 1) +N∗
C(s = 2)− N∗
P (s = 2)
N∗P (s = 1) +N∗
P (s = 2)
)(A.6)
35

Multiplying both sides by (N∗C(s = 1) +N∗
C(s = 2))(N∗P (s = 1) +N∗
P (s = 2)) and
canceling yields:
R(1) (N∗P (s = 1)N∗
C(s = 2)−N∗C(s = 1)N∗
P (s = 2))
> R(2) (N∗P (s = 1)N∗
C(s = 2)−N∗C(s = 1)N∗
P (s = 2)) (A.7)
After rearranging and using that R(1) < R(2), by definition, we obtain
N∗C(s = 1)
N∗C(s = 2)
>N∗P (s = 1)
N∗P (s = 2)
, (A.8)
which is identical to (A.5). Q.E.D.
36