Embed Size (px)
Citation preview
NONRUBBER FOOTWEAR QUARTERLY -_STATISTICAL REPORT
Report to the Senate Corrmlttee on Finance On Investigation No. 332-_~ ~ 1, ~nder Section 3~2 of the Tariff Act of 1930
USITC PUBLICATION 1591
·ocTOBER 1984
United States International Trade Co1m1ission I_ Washington, D.C. 20436
UNITED STATES INTERNATIONAL TRADE COMMISSION
COMMISSIONERS
Paula Stem, Chairwoman
Susan W. Llebeler, Vice Chairman
Alfred E. Eckes
Seeley G. Lodwick
David B. Rohr
Kenneth R. Mason, Secretary to the Commission
This report was prepared principally by J. Gail Burns
Textiles, Leather Products, and Apparel Division
Office of Industries Norris A. Lynch, Director
Address all communications to
Office of the Secretary
United States International Trade Commission
Washington, D.C. 2Q436
C 0 N T E N T S
Sununary highlights of economic conditions in the nonrubber footwear industry in the second calendar quarter of 1984------------------------- 1 ,
Statistical tables
1. Nonrubber footwear: Quantity of U.S. production, imports for consumption, and apparent consumption, by months,
. January 1982-June 1984------------------------------------------- 3 2. Nonrubber footwear: Value of U.S. producers' shipments, imports
for consumption, and apparent consumption, by months, January 1982-June 1984--------------------------------------------------- 4
3. Nonrubber footwear: Average number of employees, total and production workers, by months, January 1982-June 1984------------ 5
4. Nonrubber footwear: U.S. production, imports for consumption, exports of domestic merchandise, apparent consumption, average number of employees, total and produ.ct ion workers, and · unemployment rate, 1970-83--------------------------------------- 6
5. Unemployment rate for the leather and leather products industry (SIC 31), Producer Price Index .for footwear (BLS code 043), and Consumer Price Index for footwear of leather and non-leather, by months, January 1982-June 1984----------------------- 7
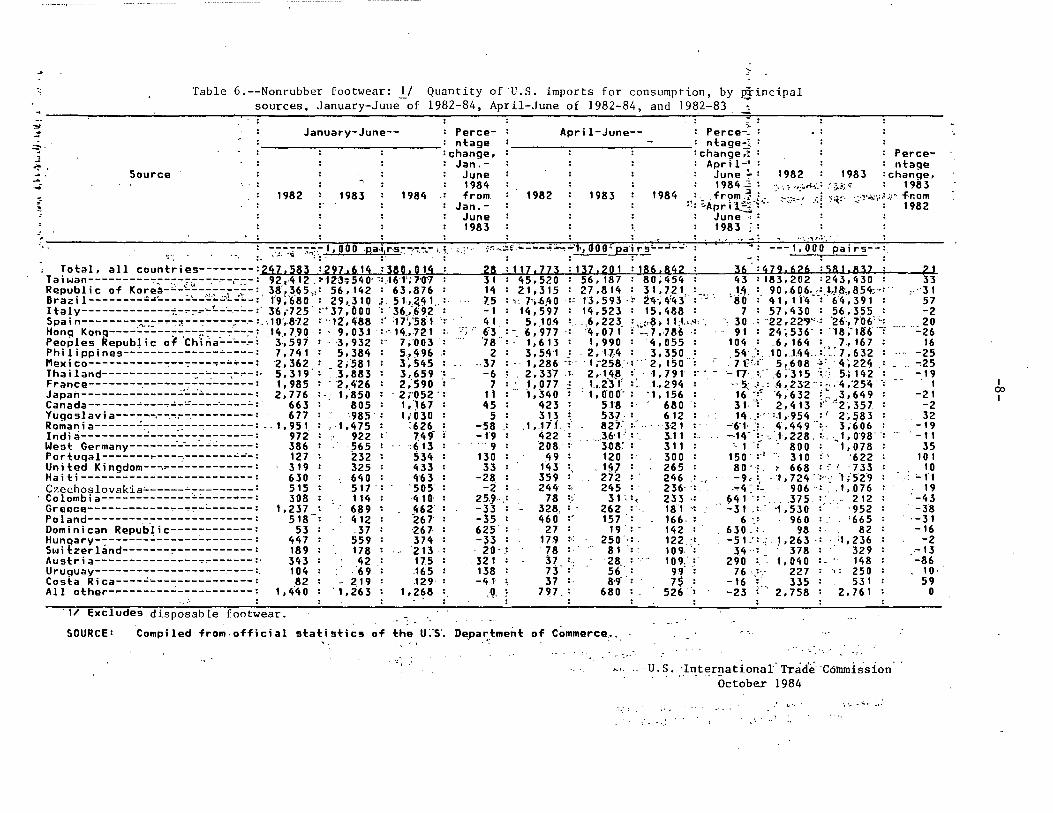
6. Nonrubber footwear: Quantity of U.S. imports for consumption, by principal sources, January-June of 1982-84, April-June of 1982-84, and 1982-83--------------------------------------------- 8
7. Nonrubber footwear: Value of U.S. imports for consumption, by principal sources, January-June of 1982-84, April-June of 1982-84, and 1982-83-------------~-----------~-~----------------- 9
8. Nonrubber footwear: Average unit value of U.S. imports for consumption, by principal sources, January~June of 1982-84, April-June of 1982-84, and'1982-83-------------------------~----- 10
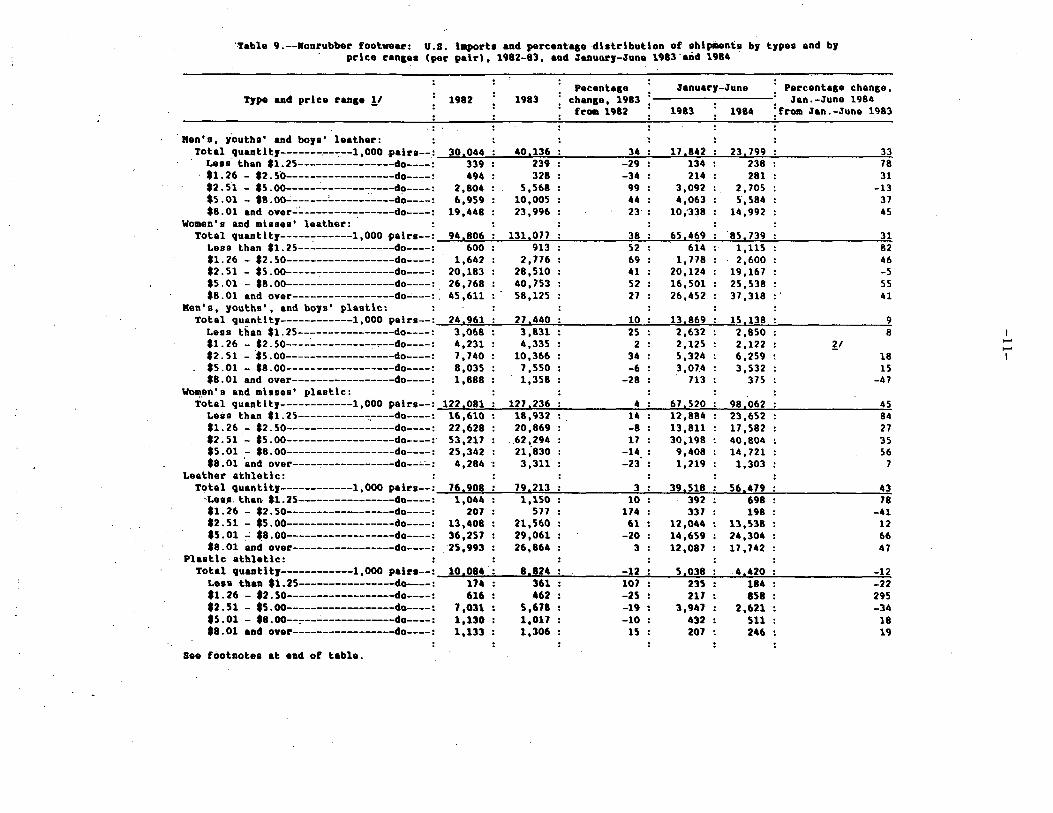
9. Nonrubber footwear: U.S. imports and percentage distribution of shipments, by types and by price ranges (per pair), 1982-83, and January-June 1983 and 1984--------------------------------~-- 11
10. Certain rubber footwear: Quantity of U.S. imports for consumption, by principal sources, January-June of 1982-84, April-June of 1982-84, and 1982-83-----------~------------------- 13
11. Certain rubber footwear: Value of U.S. imports for consumption, by principal sources, January-June of 1982-84, April-June 1982-84, and 1982-83--------~------------------------------------ 14
12. Certain rubber footwear: Average unit value of U.S. imports for con.sumption, by principal sources, January-June of 1982-84, April-June of 1982-84, and 1982-83---------------------- 15
13. Nonrubber footwear: Quantity of U.S. exports of domestic merchandise, by principal markets, January-June of 1982-84, Aprii-June of 1982-84, and 1982-83---------~-----------~--~~--------:~------ 16
Charts----------~---------~--------------------·--------------------------- 17

-1-
Summary Highlights of Economic Conditions in the Nonrubber Footwear Industry in the Second Calendar Quarter of 1984 11
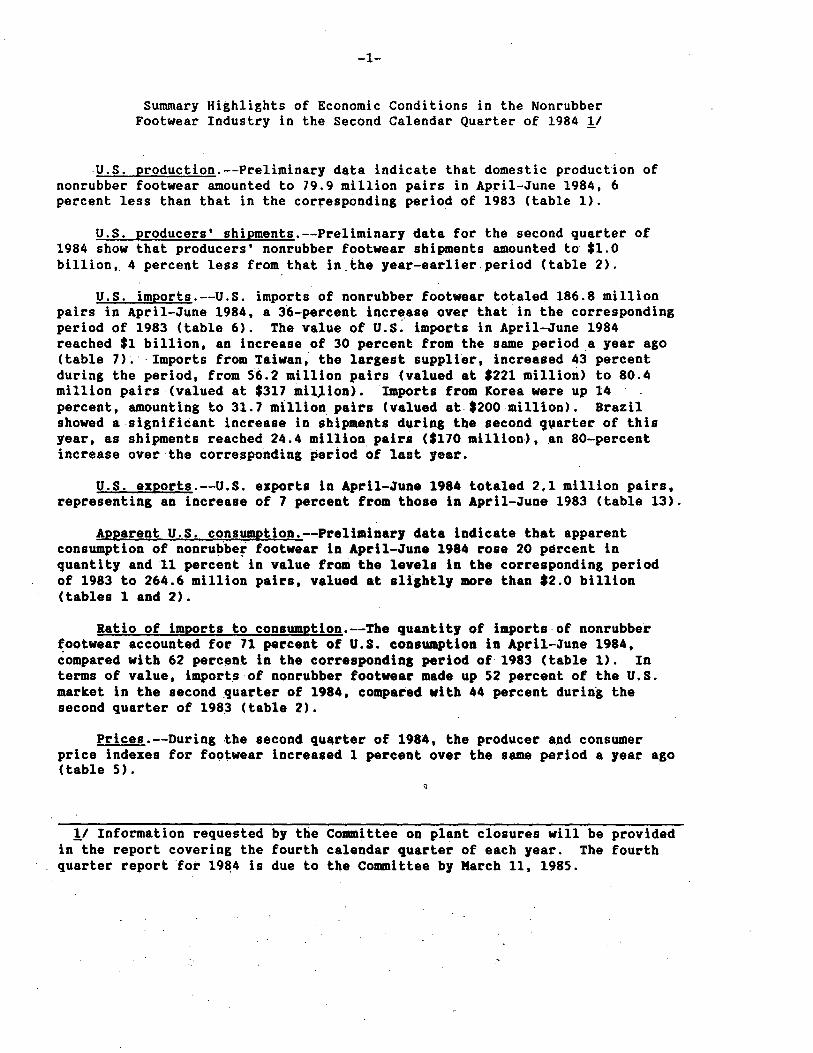
U.S. production.--Preliminary data indicate that domestic production of nonrubber footwear amounted to 79.9 million pairs in April-June 1984, 6 percent less than that in the corresponding period of 1983 (table 1).
U.S. producers' shipments.--Preliminary data for the second quarter of 1984 show that producers' nonrubber footwear shipments amounted to $1.0 billion, 4 percent less from that in. the year-earlier. period (table 2 L
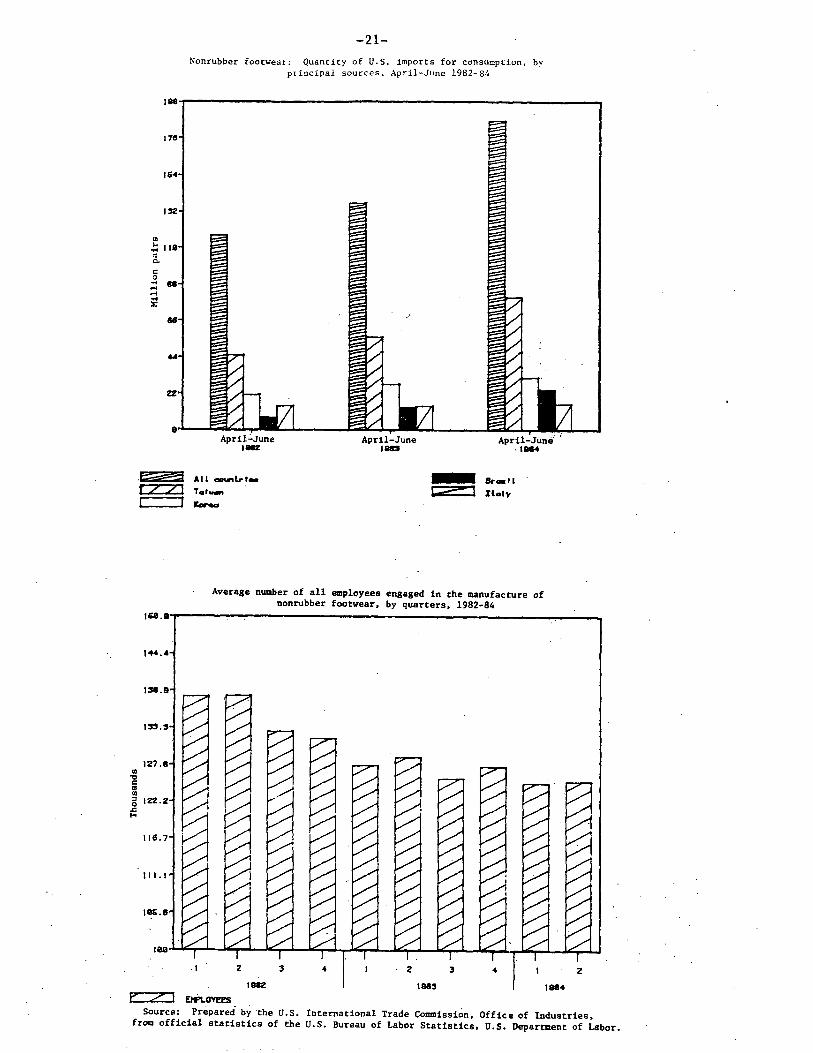
U.S. imports.--u.s. imports of nonrubber footwear totaled 186.8 million pairs in April-June 1984, a 36-percent increase over that in the corresponding period of 1983 (table 6). The value of U.S~ imports in April-June 1984 reached $1 billion, an increase of 30 percent from.the same period a year ago C table 7) • · · Imports from Taiwan; the largest supplier, increased 43 percent during the period, from 56.2 million pairs (valued at $221 million) to 80.4 million pairs (valued at $317 mil}ion). Imports from Korea were up 14 percent, amounting to 31.7 million. pairs (valued at.$200 million). Brazil showed a significant increase in shipments during the second 9~arter of this year, as shipments reached 24. 4 million pairs ($170 million-), .an 80-percent increase over the corresponding period of lo.st year.
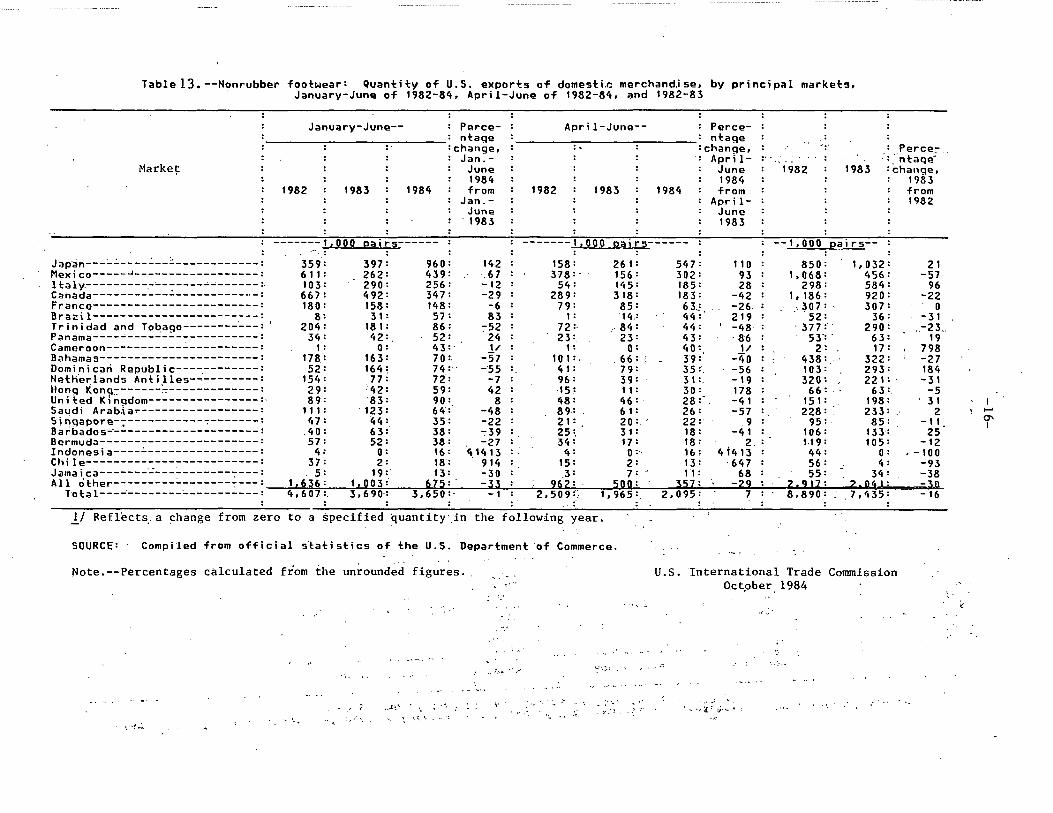
U.S. exports.~-u.s. exports in April-June 1984 totaled 2,1 million pairs, representing an increase of 7 percent from those in April-June 1983 (table 13).
Apparent U.S. consumption.--Preliminary data indicate that apparent consumption of nonrubbe~ footwear in April-June 1984 rose 20 percent in quantity and 11 percent in value from the levels in the corresponding period of 1983 to 264.6 million pairs, valued at slightly more than $2.0 billion (tables 1 and 2).
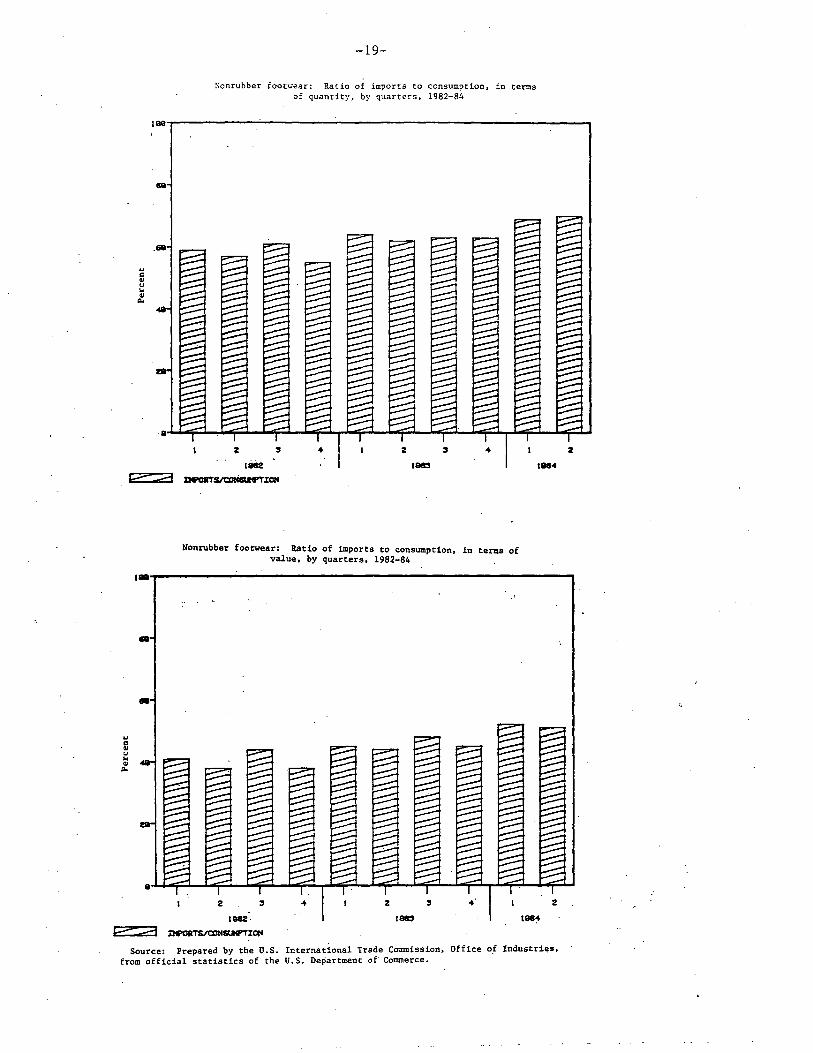
Ratio of imports to consumption.--The quantity of imports.of nonrubber ~ootwear accounted for 71 percent of U.S. consumption in April~June 1984, compared with 62 percent in the corresponding period of 1983 (table 1). In terms of value, imports of nonrubber footwear made up 52 percent of the U.S. market in the second ,quarter of 1984, compared with 44 percent during the second quarter of 198.3 (table 2).
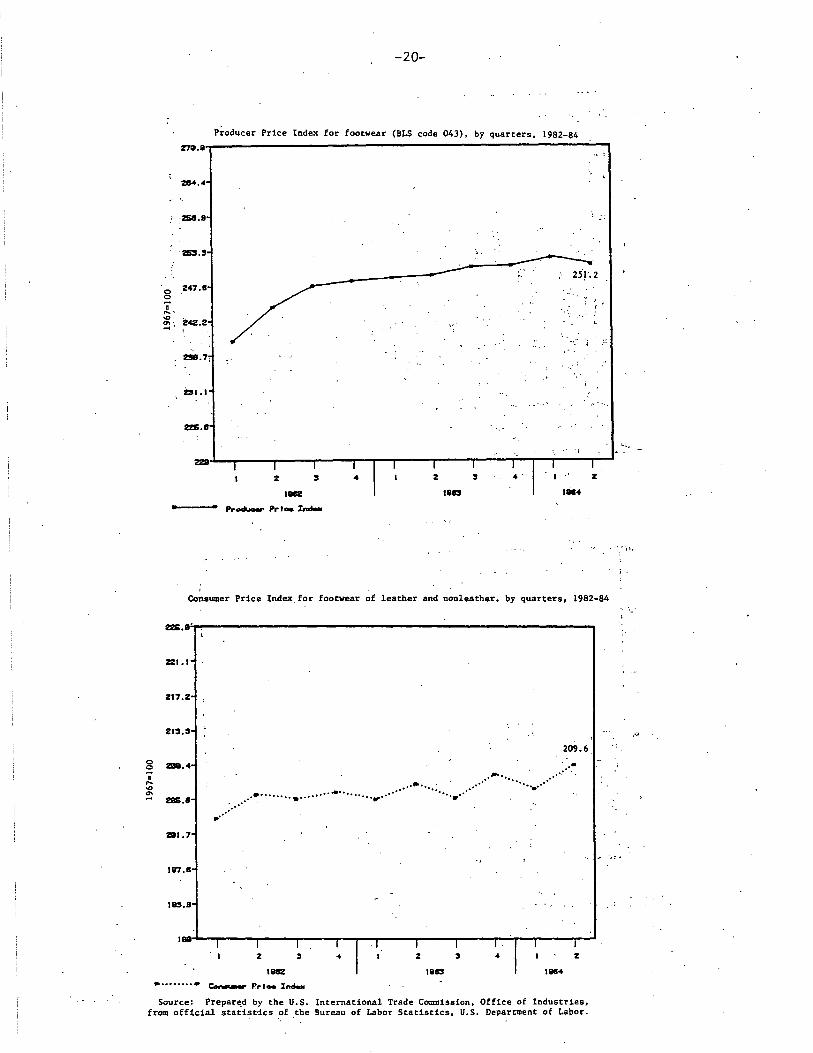
Prices.--During -the second que,rter of 1984, the producer and consumer price indexes for footwear increased 1 percent over the same period a year ago (table 5).
!I Information requested by the Committee on plant closures will be provided in the report covering the fourth calendar quarter of each year. The fourth quarter report for 19~4 is due to the Committee by Karch 11, 1985.
_.2-
. '· ., . . : .~:; · .. . ' -~ .
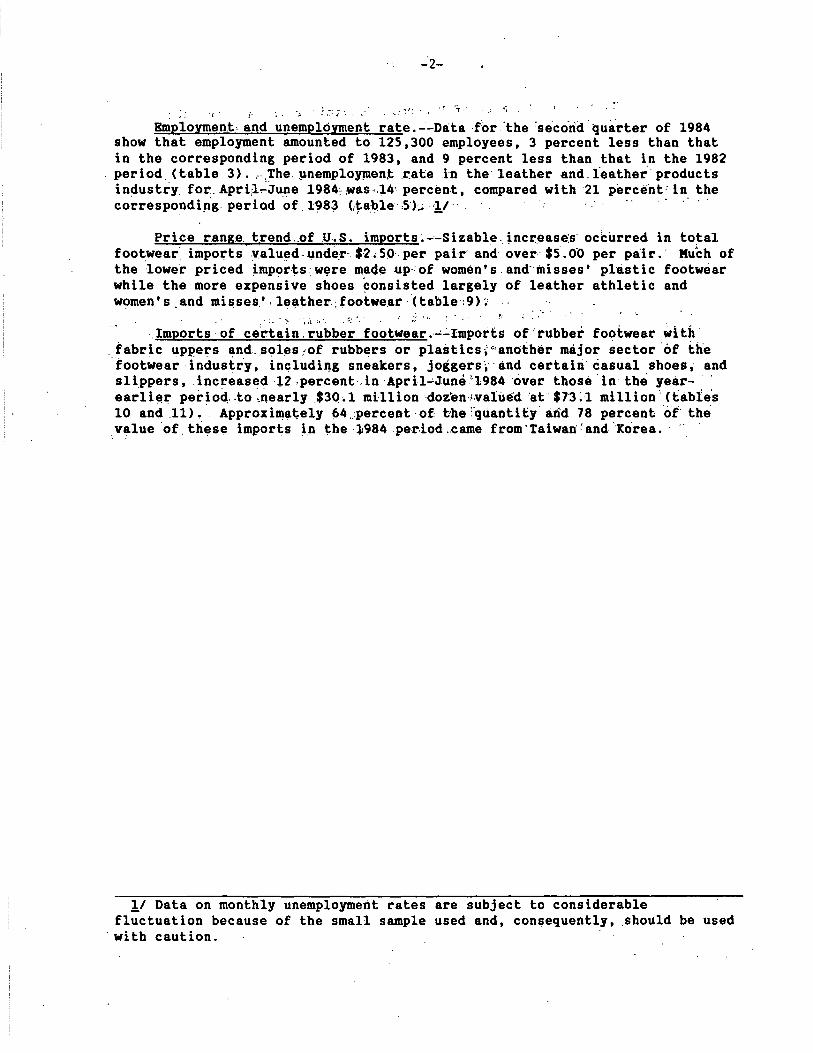
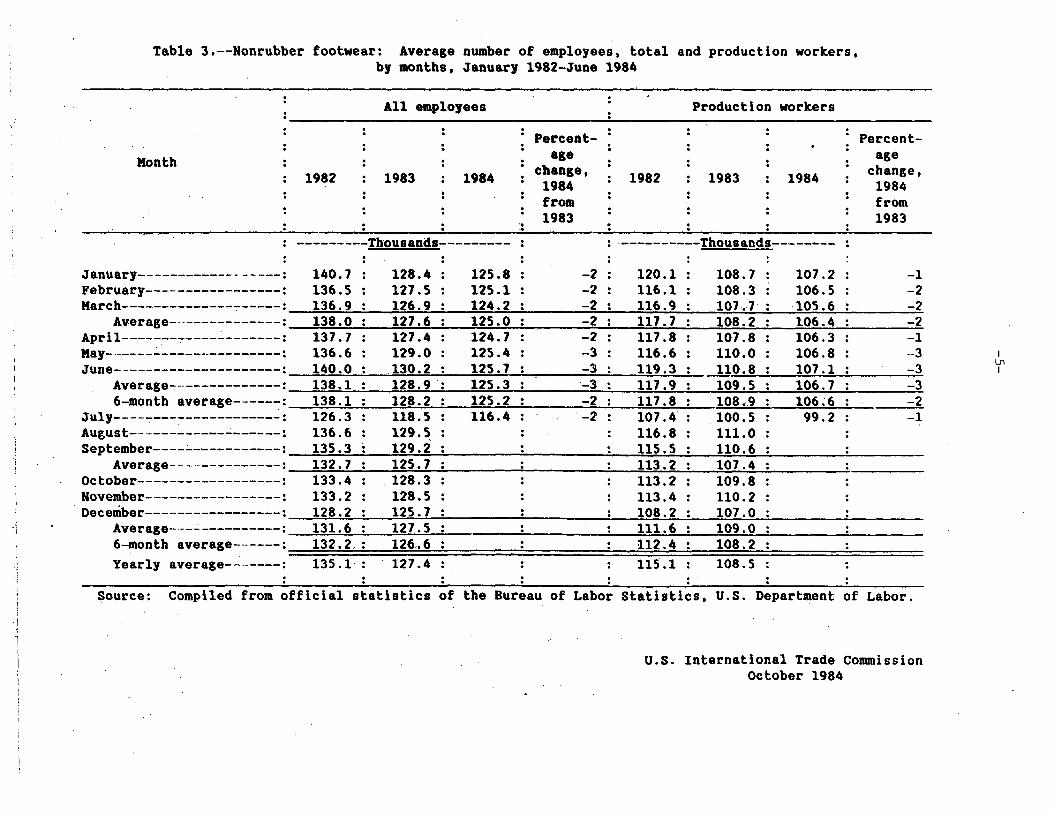
Employment·. and unemployment rate. --Da:ta -for 'the :seco.rid ·quarter of 1984 show that employment amounted to 125,300 employees, 3 percent less than that in the corresponding period of 1983, and 9 percent less than that in the 1982 period. (table 3). ,._The µ.nemp_loYJllen~ .f'.ate i·n the· leather and. leather" products in~ustry_ for.Apri;l;June 1984;~as-.;J.4' percent, compared ~ith ·21 percEfnt .. in the correspondi,ig period of 198~ (,~a:ble .. SL ·!/ · · . ., · · · ·
Price r.ange. trend .. of u .. s. imports~ --Sizable. ~ncl"..*lase:s occurred in total footwear imports .valu~d ... unde:r·. $2. SO per pak· and over-· $s·. o·o per pal r. · Muhh of the ·lower priced ~mports. w~re made up.: of women's and"tnisses' plastic footwear while the more expensive shoes consisted largely of leather athletic and women's . and mi~ses.', le.,.ther-: footwe.ar · (table :9) •
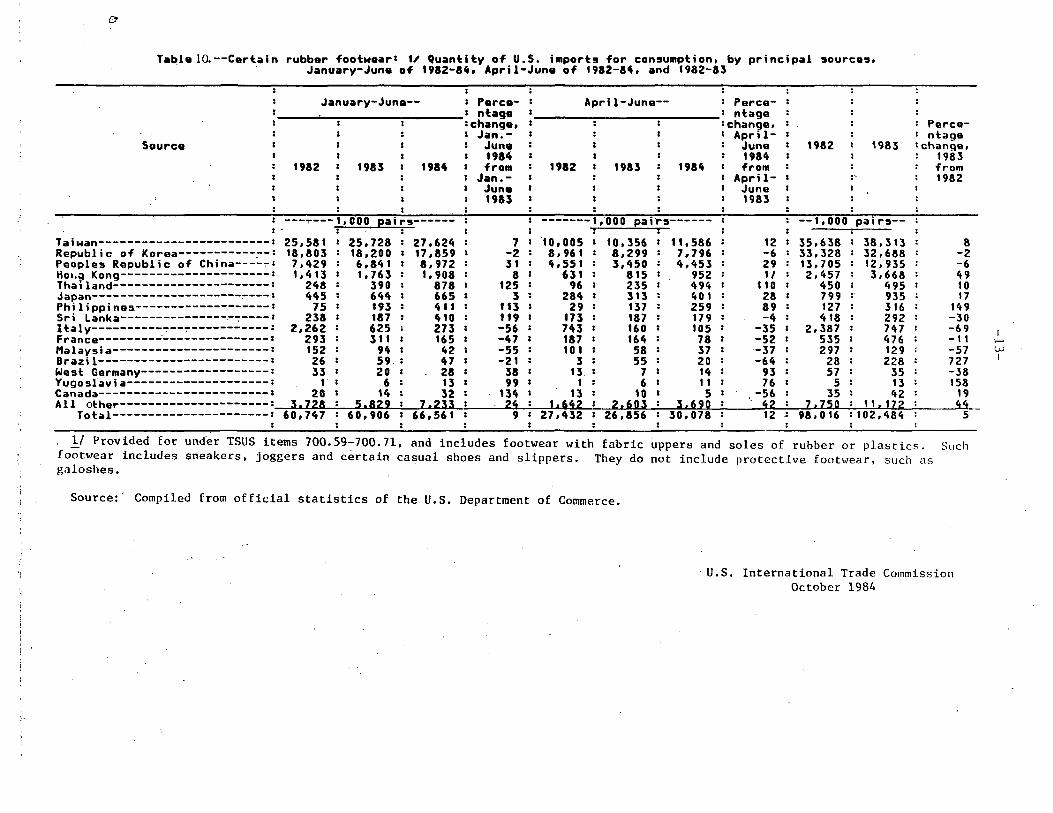
-.Imports: of ce~~in .·~~-bb~~. foot~e~~-.-'.:.Import: of ·rubber footwear with ._fabric uppers ~nd _sol~s :of rubb~r-s or plastics~ "'another major sector ·of ti1e footwear industr·y, in"ludiqg sneakers, joggers;,, and certain· casual shoes, and slippers, . increased ·t2 .percent· in April_;.June ~1984 over those in the yearea~lier pei-iod, .. to ~i.early $30.1 million ·doz'enwalU~d ·at $73>1 million' Ctabie's 10 and .11). · Approximat;ely 64,percent ·of t·he :·quantity· arid 78 percent 'of- the .value ·of.these imports i.n the·li984 per.i.od .. came from·taiwan·:and"Korea.
!I Data on monthly unemployment r-ates are subject to considerable fluctuation because of the small sample used and, consequently, should be used
·with caution.
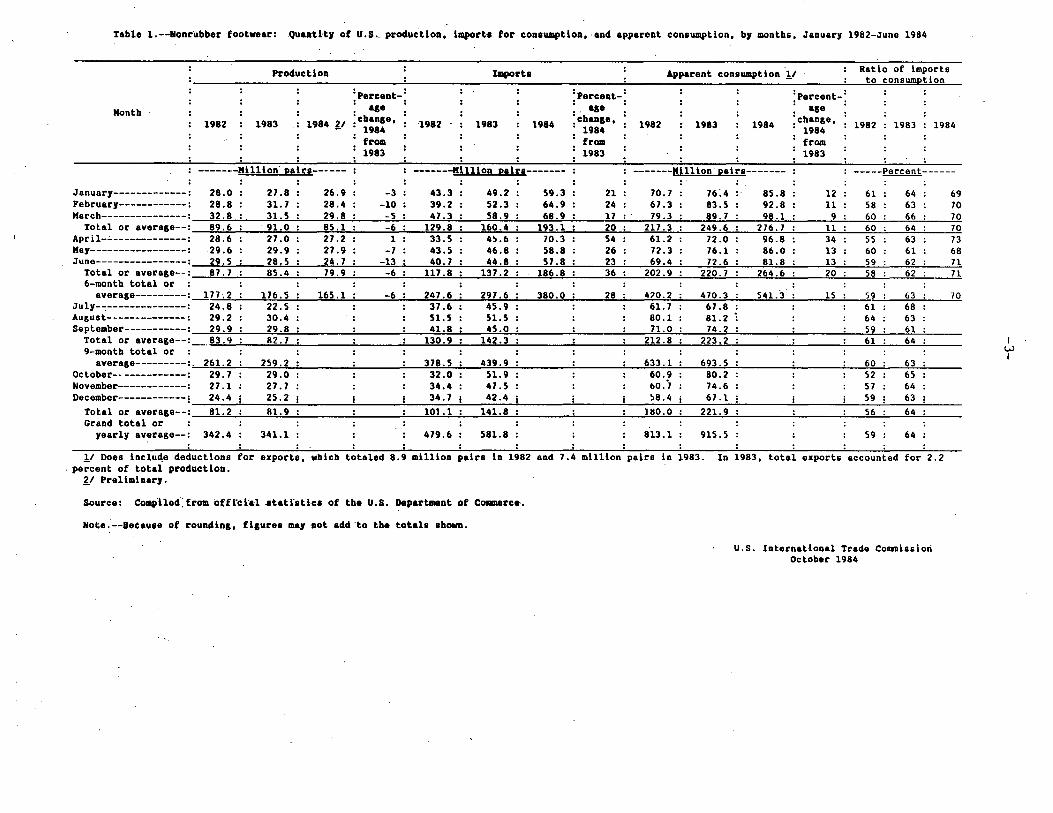
Table 1.--llonrilbber footwear: .Quantity of U.S .. production, lmport• for cona1111111tlon, ·and apparent cons1111111tlon, by months, January 1982-June 1984
Production
Month 1982 1983 • 1984 ll
:Percent-: : age • 'change, : 198"
from 1983
-------Mlllion'pair1------
January-------------: 28.0 : 27.8 : 26.9 : -3 : February------------: 28.8 : 31. 7 : 28.4 : -10 : March---------------: 32.8 : 31. 5 : 29.8 : -5 :
Total or average--: 89.6 : . 91.0 : 85.l : -6 : April-~-------------: 28.6 : 27.0 : 27.2 : 1 : May-----------------: 29.6 : 29.9 : 27.9 : -7 : June----------------: 29.5 : 28.5 : 24. 7 : -13 :
Total or average--: 87.7 : 85.4 : 79.9 : -6 : 6-month total or : : : : :
average---------: 17L2 : 176.5 : 165.l : -6 : July-~--------------: 24.8 : 22.5 : : : August--~-----------: 29.2 : 30.4 : .. : September-----------: 29.9 : 29.8 : : :
Total or average--: __ 83. 9 : 82.7 : : ·• 9-month total or : : : : :
average---------:. 261. 2 : 259.2 : : : October-------------: 29.7 : 29.0 : : : November------------: 27.l : 27.7 : : : December------------1 24.4 I 25.2 I i I
Total or average--: 81.2 : 81.9 : : : Grand total or : : : : :
yearly average--: 342.4 : 341.1 : : : : : : : :
Importa
1982 . 1983 1984
:Percent-: : age • 'change, : 1984
from 1983
-------llllllon palr1-------
43.3 : 49.2 : 59.3 : 21 : 39.2 : 52.3 : 64.9 : 24 : 47.3 : 58.9 : 68.9 : 17 : .
129.8 : 160.4 : 193.l : 20 : 33.5 : 0.6 : 70.3 : 54 : 43.5 : 46.8 : 58.8 : 26 : 40. 7 : 44.8 : 57.8 : 23 :
117.8 : 137.2 : 186.8 : 36 : : : : :
247.6 : 297.6 : 380.0 : 28 : 37.6 : 45.9 : : : 51. 5 : 51.5 : : : 41.8 : 45.0 : : :
130.9 : 142.3 : : : : : : :
378.5 : 439.9 : : : 32.0 : 51.9 : : : 34.4 : 47.5 : : : 34. 7 i 42.4 I i :
101.1 : 141.8 : : : : : : :
479.6 : 581.8 : : : : : :
Apparent con1wnptlon !I
1982 1983 1984
:Percent-: : age • :change, • 1984
from 1983
-------Mllllon palrs-------
70. 7 : 76:4 :· 85.8 : 12 : 67.3 : 83.5 : 92.8 : 11 : 79.3 : 89.7 : 98.l : 9 :
217 .3 : 249.6 : 276.7 : 11 : 61.2 : 72.0 : 96.8 : 34 : 72.3 : 76.l : 86.0 : 13 : 69.4 : 72.6 : 81.8 : 13 :
202.9 : 220.7 : 264.6 : 20 : : : :
4:70.2 : 470.3 : 541. 03. : 15 : 61. 7 : 67.8 : : : 80.1 : 81.2 : : : 71.0 : 74.2 : : :
212.8 : 223.2 : : : : : : :
633.l : 693.5 : : : 60.9 : 80.2 : : : 110.'1 : 74.6 : : : !18 .4 ! 67.1 ! !
1110.0 : 221. 9 : : : : : : :
813.l : 915.5 : : :
Ratlo of imports to consumption
1982 1983 1984
-----Percent------
61 : 64 : 69 58 : 63 : 70 60 : 66 : 70 60 : 64 : 70 55 : 63 : 73 60 : 61 : 68 59 : 62 : 71 58 : 62 : 71
59 : 63 : 70 61 : 68 64 : 63 59 : 61 61 : 64 :
60 : 63 52 : 65 57 : 64 59 ! 63 56 : 64
: 59 : 64
!I Does inclu~e deductions for ezports, which totaled 8.9 mllllon pairs ln 1982 and 7.4 million palrs in 1983. In 1983, total exports accounted for 2.2 . percent of total production.
ll Preliminary.
Source: Co1111>Ued·: f.rom offl'clal •tati'st.lca of the u.s. Department of c-rce·.
Note."--aecauee of rounding, flgurH ma1 aot add ·to the totall 1howa.
U.S. International Trade Commi1slori October 1984
I w I
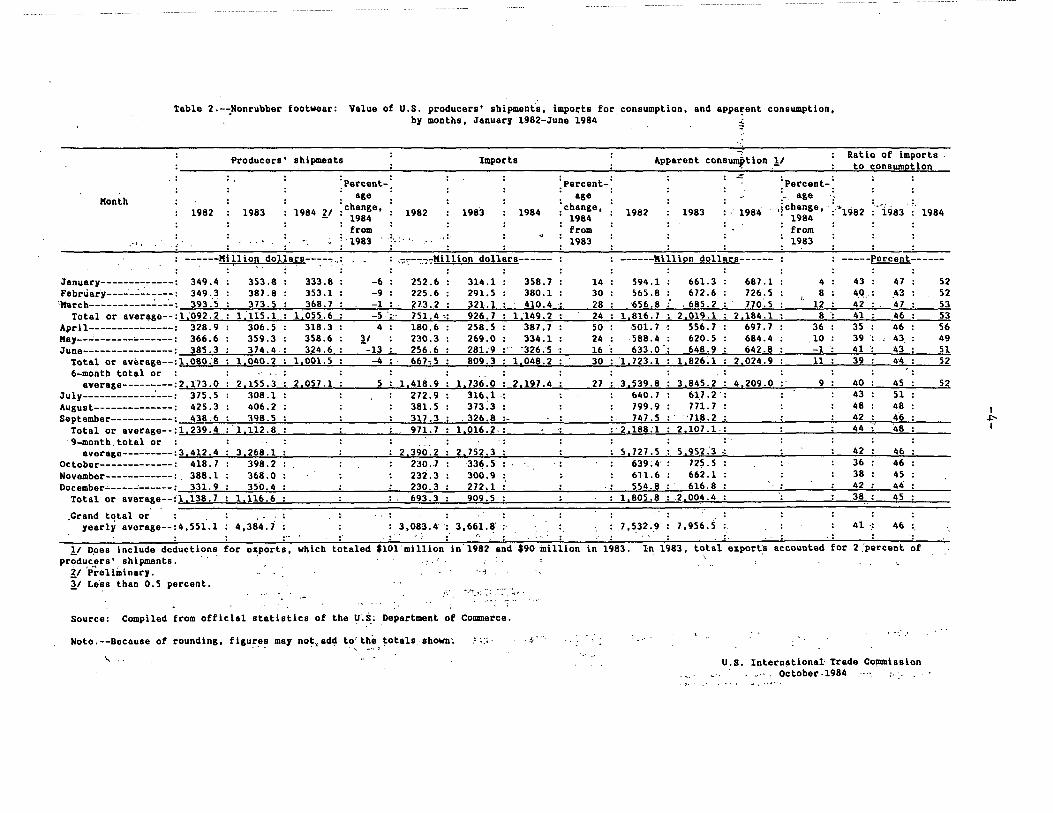
Table 2.-~Nonrubber footwear: Value of U.S. producers' shipments, imports for consumption, and apparent consumption, by months, January 1982-June 1984 · ~
---:
~roducers' shipments Imports Apparent consW11ftlon 11
· · · · '.Percent-'. '. '. '.Percent-'. ~
:Percent-:
Month : : : ; age ; ; ; ; age ·
Ratio of imports to consumption
change, . change, 1982 : 1983 : 1984 £1 : 1984 : 1982 : 1983 : 1984 : 1984 : 1982 1983 1984 .
:. age i ._,.. . .. ,;change, · :·'1982 : i983 . 1984 1984
: from : : : : from .. : : .. " : : '1983 .•. '. : 0
: 1983 . . .. :
from 1983
------Killion dollars--:-~-: ·;c.,.--:::;:.Ki 11 ion dollars------ ------Killion dollars------ -----Percent------
January-------------: 349.4 : 353.8 : 333.8 : -6 : 252.6 : 314.l : 358.7 : 14 : 594.l : 661.3 : 687.l February----·-..:..: _____ : 349.3 : 387 .8 : 353.l : -9 : 225.6 : 291.5 : 380.l : 30 : 565.8 : 672.6 : 726.5
'Mllrch-----------.:. ... c.·-: 393 .'5 : 3 73. 5 : 368. 7 : -1 : 27.3. 2 : 321. l : 410. 4 ·: 28 : ·656. 8 :° . 685. 2 : 770 ~ 5 Total or average--:l,'092.2 : l,'115.l : l,055.6 :. -5 ·:~ 751.4 ·0: 926.7 : 1,149.2 : 24 : 1,816. 7 : 2,019.1 : 2.184.l
April---------------: 328.9: 306.5: 318.3: 4: 180.6: 258.5: 387.7: 50: ·501.7 ·: 556.7: 697.7 Kay---'-------'-------: 366.6 : 359.3 : 358.6 : 11 : 230.3 : 269.0 : 334.1 : 24 : ·588.4 : 620.5 : 684.4 June--~-------------: 385.3 : 374.4 : 324.6 : -13 : 256.6 : 281.'9 :· .. "326."5 : 16 : 633.0 : 648.9 : 642.8
Total or average--:1,080;8: 1,040.2 : 1,001.5: -4: · 667,5: 809.3: 1.048.2: 30: 'l.723.l :.1.826 .. 1: 2.024.9 6-month total or : : .. ·. : : : : . . : : : : :
4 8
12 _1! 36
.10 -1 11
43 : 40 : 42 .. 41 35 39 41 39
47 .43 47 46 46 43 43 44
average---------:2.173.0 : 2.155.3 : 2,057.l : 5 : 1,41~.9 : 1.7~6.0 : 2,197.4 : 27 : 3,539.8 : 3,845.2 : 4,209.0 :· 9 : 40 : 45 July-------------'---: 375.5: 308.l: : : 272.9: 316.1.: · : : 640.7: 611.2·: : : 43: 51 August--------------: 425.3: 406.2: : : 381.5: 373~3: : : 799.9: 771.7: : : 48: 48 September-----------: 438.6 : 398.5 : : : 317.3 : . 326.8 :- : : 747.5 : "718.2 : : : 42·: 4.6
Total or average--:l.239.4 :·l.112.8: : : 971.7: 1.016.2.: : :·2,188:1: 2.101.1.: : : 44: 48: 9-month. total or : : : : : .. . : ·: : : : :" : : :
average---------:3.412.4 : 3,268.l: : : 2,390.2: 2,752.3: : : 5,727.5: 5,952,·3 .: : : 42: 46 October-------------: 418. 7 : 398.2 : : : 230 .. 7 : ·336.5 : ·: : 639.4·: 725 .. 5 : : : 36 : 46 November------------: . 388. l : 368 .o : : : 232 .3 : 300. 9 : : : 611. 6 : 662 .1 : : : 38 : 45 December~----~·------: 331.9 : 350.4 : : : 230.3 : 272,1 :' : : 554.8 : 616.8 : : : 42 : 44
Total or average--:1,138.7 : 1.116.6: : : . 693.3: 909.5 : : : 1.805.8: .2,004.4: ·: : 38: 45 :
,Grand t~tal or . . yearly average--:4,551.l : 4,384.7 : : 3,083.4 ~ 3,661.~ ~ : ,7,532~9 : 7,956.~ : 41 ·.: 46 :.
11 Opes include deductions producers' shipments.
for ex.ports, which totaled $10l'million in'l9'82 and $90 .. iDilllon in 1983. In 1983, total export'.s accounted for 2 .'percent of .• ...
£1 'p~eliminary. . • ·J
~/ Le's s than 0. 5 percent. ... ...., ~· ,•i'.
Source: Compiled from official statistics of the U~S; Department of Co11111erce. ...
Note.--Because of rounding, figures may not,adl:l to' the ~otals.shown~ . . . . ......... :
.::.::;.- ·,"J
·, U.S. International Trade Commission ...... October -1984 :··· ; . ._
52 52 53 53 56 49 51 52
52
I ~ I
·.l
table 3.--Nonrubber footwear: Average number of employees, total and production workers, by months, January 1982-June 1984
Month
January------------------: February-----------------: Karch--------------~-----:
Average- .. ------------: April-------~----~-------: May-·-----~----------------: June---------------------:
Average--·------------: 6-month average-----~:
July--------~------------: August-·- -----------------: September----~-------~---:
Average-- - ·-----------: October------------------: November-,---------------...,.-: December-----------------:
Average-- __ ...; __________ :
6-month average-------: Yearly average-------: . .
All employees
1982 1983 1984
't
'" ---------Thousands--------- :
: : . . 140.7 : 128.4 : 125.8 : 136.5 : 127.5 : 125.l : 136.9 : 126.9 : 124.2 : 138.0 : 127.6 : 125.0 : 137.7 : 127.4 : 124.7 : 136.6 : 129.0 : 125.4 : 140.0 : 130.2 : 125.7 : 138.1 : 128.9 : 125.3 : 138.1 : 128.2 : 125.2 : 126.3 : 118.5 : 116.4 : 136.6 : 129.5 : . . 135.3 : 129.2 : . . 132.7 : 125.7 : : 133.4 : 128.3 : . . 133.2 : 128.5 : : 128.2 : 125.7 : . . 131.6 : 127.5 : . . 132.2 : 126"6 : : 135.1 : 127.4 : : . : . . .
Percentage
change, 1984 from 1983
1982
Production workers
1983 1984
: ----------Thousands--------: . : .
-2 : 120.1 : 108.7 : 107.2 : -2 : 116.l : 108.3 : 106.5 : -2 : 116.9 : 107.7 : 105.6 : -2 : 117.7 : 108.2 : 106.4 : -2 : 117.8 : 107.8 : 106.3 : -3 : 116.6 : 110.0 : 106.8 : -3 : 119.3 : 110.8 : 107.1 : -3 : 117. 9 : 109.5 : 106.7 : -2 : 117.8 : 108,9 : 106~6 : -2 : 107.4 : 100.5 : 99.2 :
: 116.8 : 111.0 : 115.5 : 110.6 : 113.2 : 107 .4 . 113.2 : 109.8 . : 113.4 : 110.2 . 108.2 : 107.0 . : 111.6 : 109.0 : 112.4 : 108.2 : 115.1 : 108.5 : . .
Percentage
change, 1984 from 1983
-1 -2 -2 -2 -1 --3 -3 -3 -2 -1
Source: Compiled from official statistics of the Bureau of Labor Statistics, U.S. Department of Labor.
u.s. International Trade Commission October 1984
I \JI I
Table 4.--Nonrubber footwear: U.S. production, imports for consumption, exports of domestic merchandise, apparent consumption, average number of employeas, total and production workers, and unemployment rate, 1970-83. ·
Average number of
Year Production Imports Bxpor'ts Apparent consumption
Ratio of imports to : em2loxees · : Unemployment
con1umption : All : Production : rate !/ : 2ersons : workers :
-------------------Million 2aira------------------ Percent : --------Thousands~--~---- : ·~
1970--------------------------------~--------:
1971----------------~---------~--------------: 1972-----------------------------------------: 1973----------~------------------------~-----: ~974---------------------~-------------------:
1975-----------------------------------------: 1976-----------------------------:----------~: 1977-----~--------~--------------------------:
1978-----------------------------------------: 1979-----------~-----------------------------:
1980~----------------------------------------:
1981----------.-------------------------------:' 1982-----------------------------------------: 1983-------~----~------------~---------------:
562.3 535.8 526.7 490.0 453.0 413.1 422.5 418.4 418.9 398 .. 9 386.3 372.0 . ' 342 .4 ·: 341.1
24l.7 268.6 296.7 307.5 266.4 286.'4 370.0 368.1 373.S 404.6 365: 7 .. 375.6 479.6 581.8
2.2 2.1 2.3 3.6 4.0 4.6 6.0 5.4 6.9 9.3
13.0 .. 11.2 8.9 7.4 :
:·· 801.8 802.3 821.l 793.9. : 715.4 694.9 786.5 781.1 .. 785.5 794.2 739.0 736.4': 813.1 915.5 :
: 30 : 33 : 36 : 39 : 37 : 41 : 47 : 47 : 48 : 51 : 49 : 51 : 59 : 64 :
: : 213.6 : 185.5 : 6.9 200.6 : 173.6 : 8.0 193.3 : 168.3 : 7.2 182.9 : 158.5 : 6.1 172.4 : 148.9 : 7.5 157.7 : 136.4 :· 12.9 164.2 : 143.7 : 10.5 1.56.9 : 136.5 : 11.0 158.4 : 138.l : 8.8
148 ··"' : 128.0 : 8.0 143 :6 : 122.9 : 7.7 146.4 : ·12s.9 : 12:s 135.l : 115.l : 16.8 127. 4 : 108.5 : 17.8
!/For the leather and leather products industry (SIC 31). Appi:'oximately two""thlrda of the worker1.ln the leather li.nd._leather products industry are nonrubber . footwear workers, for whom separate data are not available. · · · · · ·
Source: Compiled from official statistics of the U.S. Department of Commerce and the Bureau Of Labor .. Statiatics.
u .. s. International Trade Commission October 1984
I
°' I
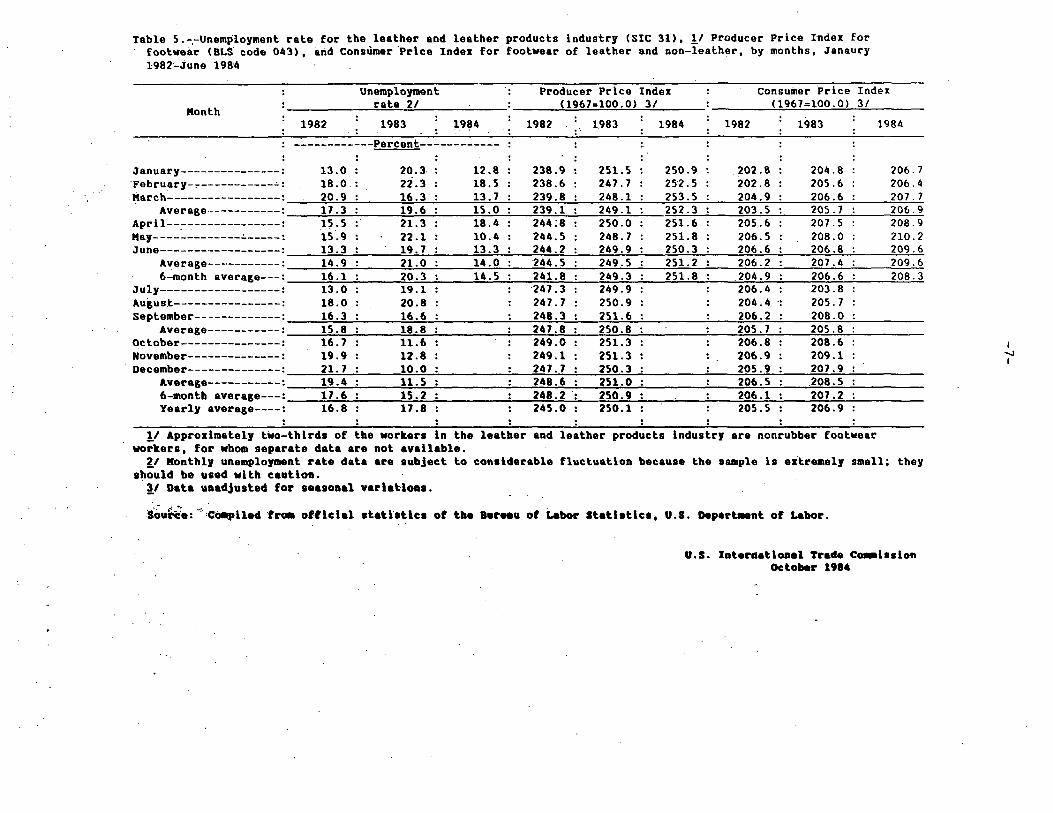
Table 5.~~unemployment rate for the leather and leather products industry (SIC 31), !I Producer Price Index for footwear (BLs· code 043), arid Conslimer.Prlce Index for footwear of leather and non-leather, by months, Janaury 1982~june 1984
unemployment : Producer Price Index : consu~er ~rice Index
Kon th rate 21 : (1967=100.0) 3/ : (1967=100.0) 3/
1982 : 1983 : 1984 : 1982 : 1983 : 1984 : 1982 : 1983
: .. :
-~----------Percent------------: : : :
January---------------: 13.0 : 20.3- : 12.8 : 238.9 : 251. 5 : 250.9 : .202.8 : 204.8 : 'February-r-----------~: 18.0.: 22.3 : 18.5 : 238.6 : 247.7 : 252.5 : 202.8 : 205.6 : .Karch-----------------: 20.9 : 16.3 : 13. 7 : 239.8 : 248.1 : 253.5 : 204.9 : 206.6 :
Average-----------: 17.3 : 19.6 : 15.0 : 239.1 : 249.1 : 252.3 : 203.5 : 205.7 : Apr~l--~--------------: 1$.5 : 21.3 : 18.4 : 244;8 : 250.0 : 251.6 : 205.6 : 207.5 : Kay-------------~-----: 15 .. 9 : 22.1 : 10.4 : 20. 5 : 248.7 : 251.8 : 206.5 : 208.0 : June------------------: 13.3 : 19.7 : 13.3 : 244.2 : 249.9 : 250.3 : 206.6 : 206.8 :
Average-----------: 14.9 : 21.0 : 14.0 : 244.5 : 249.5 : 251. 2 : 206.2 : 207.4 : 6-month average---: 16.1 : 20.3 : 14.5 : 241. 8 : 249.3 : 251. 8 : 204.9 : 206.6 :
July------------------: 13.0 : 19.1 : : 247.3 : 249.9 : : 206.4 : 203.8 Augus.t----------------: 18.0 : 20.8 : : 247. 7 : 250.9 : : 204 .4 ·: 205.7 September-------------: 16.3 : 16.6 : : 248.3 : 251.6 : : 206.2 : 208.0
Average-----------: 15.8 : 18.8 : : 247.8 : 250.8 : : 205.7 : 205.8 October---------------: 16.7 : 11.6 : : 249.0 : 251.3 : : 206.8 : 208.6 : November--------------: 19.9 : 12.8 : : 249.l : 251. 3 : : 206.9 : 209.1 : December--------------: 21. 7 : 10.0 : : 247. 7 : 250.3 : : 205.9 : 207.9
Average-----------: 19.4 : 11.5 : : 248.6 : 251.0 : : 206.5 : .208. 5 6-month average---: 17 .6 : 15.2 : : 248.2 : 250.9 : : 206.l : 207.2 Yearly average----: 16.8 : 17.8 : : 245.0 : 250.l : : 205.5 : 206.9
!I Approximately tvo-thlrds of the workers ln the leather and leather products industry are nonrubber footwear worker.a, for whom separate data are not available.
1984
206.7 206.4 207.7 206.9 208.9 210.2 209.6 209.6 208.3
!I Monthly unemploJ1119nt rate data are subject to considerable fluctuation because the sample ls eitremelr small; they should be used with caution.
·· ~/ Data unadjusted for Hasonal varlaUona .
. · .. - .... ..,, ., ... sourc'e: · 'COmplled froa offlclal 1tathtlu of tbe Bur .. u of Labor 1tathtle1, U.S. Depart.ent of Labor.
U.S. Interaatlonal Trade C01111l11lon October 1914
I '-I I
:s
.. ~-
'
Table 6.--Nonrubber footwear: 1/ Quantity of U.S. imports for consumption, by p'!incipal sources, January-June-of 1982-84, April-June of 1982-84, and 1982-83 J:
January-June-- Percentage
change,
April-June-- Perce..'.~ ntage-1 .
change it : Perce-~- Source
Jan.June 1984 from.
Apr i 1-"' : ntage June ~ : 1982 1983 change, ..
1982 1983 l! '
1984 Jan.
June 1983
1982 1984~: ~ ... : ... , .... :. ~-;;.~:-~ 1983
. .... frQm .. .i~ .t,.. .:-·-:::'!'·\ • ·~'('!'· ·:·'·..;..,;~; ~:,··· -f·nom ~'. <·Aprii::s-~·- , .. · ·'· ' 1982
June ., :
1983 1984
1983 . II ; : : ; : : : ·t : ... •T _: .. .. .... ,!.::.
: --------1 000 .pa-i r-s--,.--- ·; - .... e,-,,_":; --'"---"·•-:.:.·1· 000" pa·; rs'---'--'··: 1 ~: --- f 000 pairs--: 1;·: :. ,_'.:.. •\i .~,..,;::. I _: :'· ..• , ~. ... ":._ n ·• ! : I - : : - : -'--.-.-'---
Total, all countries--------=247,583 =297,614 =380,014 : 28 :117,773 :13z,201 :186.842 : 36 :479.626 :581...Jl..l.2._; Taiwan----------:-::--::-.-;:-.;--.-.--.-::-: 92,-412 .. ~·12'3>;540<: .. 16··1';7'117 : 31 : 45,520 : 56, 187 : 80;454 : 43 : 183,202 =243,430 : Republic of Korea-..:-\..''-----:----: 31L365-_.: 56,142: 63,876: 14: 21,315: 27,814: 31,721: . Vt.: 90,606.,:_t .. 18',854;,: Brazil--------.: .. t.._-__ .:...__,;:::...::·-:...::.-:· r2;·6·ao··= 22,310 ;. 51.,241 :. 15 :" h.640 .:: 13,593.:- 2~-;4'43' :~·; · 'ao =· 41,1i·4··=·6·4,321 : Haly--------------::-~:-~·'.'"!..-·--:..-:· 36·;·725 :"':Sz;·ooo ·: ·36,'6"92-: ..:1 : 14,5<9z : 14,523 : 15,488 : z : 57,430 : 56,355 : Spain---------::.::::--.--:;---:----.:--.-: .. ·.1o-,.s·z2 : .--12·, 4'88 :' :1 z'/5'3:1 ·-=- 4 I. : 5 ,_10.4 : .. -,6 I 223. : ,;;c8, 1 I :l .• _..i· ·, 30 . : --22 ,22'9'' .. : '26'·, 7'06>--: Hong Kong----:..---:--:--::·-;::--.:--:-·--.-_: .14~7_90 : 9,03J ·:-·14_,.721 :. , _ _ 6·3 :- 6,977 -: "4,071 : ....,7,-78~ -: - 91 : 24;536-: --1s;·1a6---: Peoples Republic of Chiria--·----: 3-,597 : .. ·3,932 :- 1;·003 ·: ... 78 : · 1,613 : 1,990 : ·4,055 : 104 : .. 6, 164 : 7., 167 Philippines--.:..----------------: 7,741 : 5,384 : 5,496 .: 2 : 3,541 : . 2,17,4 : 3,350 : .54·.:-:: 10 •. .1.44 .. ::'..:z,632 Mexico------------:---:----..,-' ... •·--: ·2,362 : 2;'581 : 3~S45 : --37 : -- 1,286-:--·1;258.-: ... 2, 150 .. : :· . 7F-:" 5,608 ~: 4·;224 Thailand---------:.. ___ '7.-"":---;-,--1. 5,319: 3,883: 3,659 ·: -6: 2,337 .:. 2,-1_4.!l_ :, 1,791· :·· - -f7·.}:-.6;·315 :_:; 5.Jl42 France--------.-------:----------: 1, 985 : · 2, 4'26 : 2 ,·590 : 7 : 1, 077 : 1,,.23 1· : .. 1., 2 94 : -- 5: .. : . : .4, 232 - : . .,·4 ,·25·4 ·:· Japan--------------.:.·~--.:..-------:-= 2,776 =·. 1,·a50 : · 2;·052·: 11 : 1,340: · 1,000": ·1, 156 : 16.f ·4,'632 :~~3,649 Canada-------·---..,..:.-·-----·-----: 663 : 805 : 1,167 : 45 : 423: 5.1'8 : 680 : 31·: 2,413 :' · 2·,351. Yugoslavia------,--.~:--.---------: · 677 : ·935·: li030 : 5 : 313 :. 53-7.·: 612 : 14 y·i.1,.954 :' 2~583. Romani a------.::-----_-:---:-------: ... 1, 951 : ." 1, 4 7 5 : : 626 : -58 .: .1 ,.1 i.i. :· 827-'. :.' - .. ·3·2 1 : · -·6-1· _-; - 4-, 44 9 ··=:· 3 ;6 06 In di a---------..!----.. -_--.--:-:-----: 972 : 922 : · Z.49- : -1'9 : 422 : .. _ ... 3.6·1 .- : _ 3-11 :.. -.14·. :; -.. '.h 228. :.-. ·~ 1, 0·2s- ·: ---West Germany------------''------: 386 : ~65 : ·:613 : · · ··· 9 : 208. ·: 3~8'. : 311 : ·- I : · 800 : 1, 078 : Poduqal-------,..---:--------'---: 127 : 232 : 534 : 130 : .49 : 120 :.- 300 : 150· :·1 .. _ 310 ::· '622 United Kingdom---,,-------------: 319 : 325 : 433 : 33 : 143· :, . 1~7 : . 265 : so·-~- ~ 668 :.-~' ·73_3 Haiti-------------------------: 630 : ' 640 : 463 : -28 : 359: 272 : . 246 .: -9.: -1,724-~·-· li529 Czechoslovakia:...-----"----------= 515: · 517·: ·505: -2: 244 :. 2.45 :· 236--=-· .. ..,.4~:·_ · 906 :~.1,.076 Colombia-------------::..:.. _______ : 308: 114: ·410: 25.?: 78 :c· 31-.:, 233 .: 641 ·:·_ ... 375 :·· ... 212 Greece------------,_-..,.,..-:..------: 1,237 : 689 : 4'62': -33 : - 328 : - 262 : 1s·1 ·: -31 .:.· -1,530 : ·952 Poland--------.-.---------------: 518"': 412 : -267' : -35 : 460 :' 157 ·: 166-: 6 ::· · 960 : .. '665 Dominican Republic------------: 53 : .. 37 : ·267· : 625.: 27 : 19 ·: · 142 : · 630.:. 98 :. . 82 Hungary--;-------.:.. ______ :.. _______ : 447 : 559 : 374 : -33 : 17.9 :-: 250':: 122.::_ -51::.;. J,263 -: · :1,236 Switzerland-------:------------: 189: 178: ·213.: · 20·.: ·73 :. 81 :· 109.·: 34 .. : · 378: 329 Austria---------------..,.,..------:· 343 : 42 : 17.5 : 321 : 37 :.. 28. : .... 109.· :· 290 :_ · 1,040 :, 148 Uruguay-------------------.----:_ 104 : .:6 9 : .165 : 138 : 7 3 · : · 56 · : 99· : 76 ·. :-- 227 : .,, 25 0 Costa Rica----..:---------------: 82 : - 219 : .129·: -41· : 37 : 8·9· ·: ZS : -16 ':· 335 : 531 All other---------..:-----------: 1,4·40: ·1,263: 1~268: :Q. ! 79.7.: 680: 526: -23 :·- 2,758: 2,761
·t/ Excludes disposable footwear.
SOURCE: Compiled from. official stai:i si:i cs of the U :s·. De,pa.~:tment of Commerce .• _
. .:_1
u. s. ·Inter!lational· Trad'e· ·coinm:i.ssion October 1984
..... i • ... ~. :. .·
·· ..
·-it , .. ·31
57 -2 20
··:..26 16
-25 -:25 -19 - 1
-21 -2 32
-19 . -11
35 10 1
10 '-1'1
19 --43 -3'8
·-31 -16 -2
-13 -86
10· 59
0
I 00 I
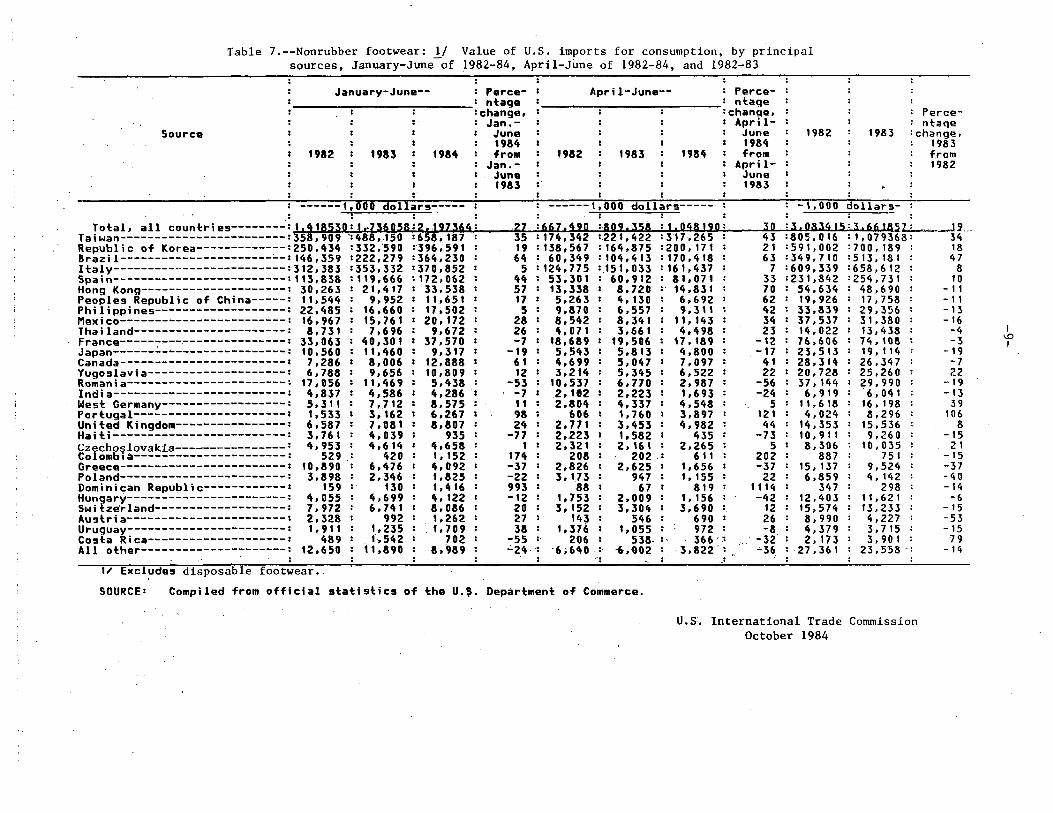
Table 7.--Nonrubber footwear: 1./ Value of U.S. imports for consumption, by principal sources, January-June of 1982-84, April-June of 1982-84, and 1982-83
January-June-- Perce- April-June-- : Perce-ntage : ntaqe
change, :chanqe, Jan.- : April-
Perce-ntaqe
Source : I June : June 1982 1983 change, : 1984 I 1984 1983
'982 1983 : 1984 from 1982 1983 1984 : from from Jan.- : April- 1982
June : June 1983 : 1983
------1, 000-CJOllars----- ------1, 000-dOilars----- -1,000 dollars-. . Total, all countries--------: 1. 418530: .1,.Z36058: 2. 197:564: 27 : 667, 490 : 809. 358 : 1. 048190: 30 : 3. 0834 I 5: :L 66 t.!l52.i...-__.l_j __
Taiwan------------------------:358,909 ·:488, .. 150 :658,187: 35 :174,342 :.221,422 :317,265: 43 :805·,016 :l,079368: 34 Republic of Korea-------------:250,434 :332,·590 :·396,591: 19 :138,567 :164,875 :200,111: 21 :591,002 :100,189: 18 Brazil----------------------'--: 146,359 :222,279 :364,230 : 64 : 60,349 : 104,413 : 170,418 : 63 :349,710 :513, 181 : 47 Haly---------··---------------:312,383 :353,332 :370,852: 5 :124,775 :,151,033 :161,437 : 7 :609,339 :658,612 : 8 Spain-------------------------:113,838 :119,666 :172,062 : 44 : 53,301 : 60,912 : 81,071 : 33 :231,842 :254,731 : 10 Hong Kong---------------------: 30,263 : 21,417 : 33,538 : 57 : 13,338 : 8,720 :· 14,831 : 70 : 54,634 : 48,690 : -11 Peoples Republic of China-----: 11,544 : 9,952: 11,651 : 17: 5,263: 4,130 : 6,692 : 62 : 19,926 : 17,758 : -11 Philippines-------------------: 22,485: 16,660: 17,502: 5: 9,870 : 6,557 : 9,311 : 42: 33,839 : 29,356 : -13 Mexico------------------------: 16,967 : 15,761 : 20,172 : 28 : 8,542 : 8,341 : 11,143 : 34 : 37,537 : 31,380 : -16 Thailand----------------------: 8,731 : 7,696 : 9,672 : 26 : 4,071 : 3,661 : 4,498 : 23 : 14,022 : 13,438 : -4 France------------------------: 33,063: 40,301: 37,570: -7: 18,689: 19,506: 17,189: -12: 76,606: 74,108: -3 Japan------~------------------: 10,560 : 11,460 : 9,317 : -19 : 5,543 : 5,813 : 4,800 : -17 : 23,513 : 19, 114 : -19 Canada------------------------: 7,286: 8,006: 12,888: 61: 4,699: 5,047: 7,097: , 41: 28,314: 26,347: -7 Yugoslavia--------------------: 6,788 : 9,656 : 10,809 : 12 : 3,214 : 5,345 : 6,522 : 22 : 20,728 : 25,260 : 22 Romania-----------------------: 17,056: 11,469: 5,438: -53: 10,537: 6,770: 2,987: -56: 37,144: 29,990: -19 India-------------------------: 4,837 : 4,586 : 4,286 : -7: 2,102: 2,223: 1,693: -24 : 6,919: ·6,041 : -13 West Germany------------------: 5,311: 7,}12: 8,575: 11: 2,804: 4,337: 4,548: 5: 11,618: 16,198: 39 Portugal----------------------: 1,533: 3,162: 6,267 : 98: 606 : 1,760 : 3,897 : 121 : 4,024 : 8,296 : 106 United Kingdom----------------: 6,587 : 7,081 : 8,807 : 24 : 2,771 : 3,453 : 4,982 : 44 : 14,353 : 15,536 : 8 Haiti-------------------------: 3,761: 4,039: 935: -77: 2,223: 1,582: 435: -73: 10,911: 9,260: -15 Czechoslovakia---------------- 1 4,953: 4,614: 4,658: 1 : 2,321 : 2,161 : .2,265: 5: 8,306 : 10,035 : 21 Colombia---------------------'-: 529: 420: 1,152: 174: 208: 202: 611: 202: 887: 751: -15 Greece------------------------: 10,890 : 6,476 : 4,092 : -37 : 2,826 : 2,625 : 1,656 : -37 : 15, 137 : 9,524 : -37 Poland------------------------: 3,898 : 2,346 : 1,825 : -22 : 3, 173 : 947 : 1, 155 : 22 : 6,859 : 4, 142 : -40 Dominican Republic------------: 159: 130 : 1,416 : 993: 88 : 67 : 819: 1114 : 347 : 298 : -14 Hungary-----------------------: 4,055: 4,699: 4,122: -12: 1,753: 2,009: 1,156: -42: 12,403: 11,621: -6 Switze'rland-------------------: 7,972: 6,741 1 8,086 : 20 : 3,152: 3,304 : 3,690 : 12 : 15,574 : 1.3,233 : -15 Austria-----------------------: 2, 328 : 992 : 1, 262 : 27 : 143 : 546 : 6 90 : 26 : 8, 990 : 4, 227 : -5 3 Uruguay-----------------------: 1,9'1 : 1,235: 1,709: 38 : 1,376 : 1,055 : 972 : -8 : 4,379 : J,715 : -15 Costa Rica--------------------: 489 : _ 1,542 : 702 : -55 : 206 : 538- :.. 366 ·.:: · -3t : 2, 173 : 3, 901 : 79 All other---------------------: 12,650: 11,890: 8,989: .;.24.·: ·6•640.: -fr,002: .. 3,a22·: •36 :-27,361: 23,s·ss·: -14
: : : : : ··: .... :· J . : : :
1/ Excludes disposaoie roo~wear.
SOURCE: Compiled from official statistics of the U.S. Department of Commerce.
U.s:. International Trade Commission October 1984
I \D I
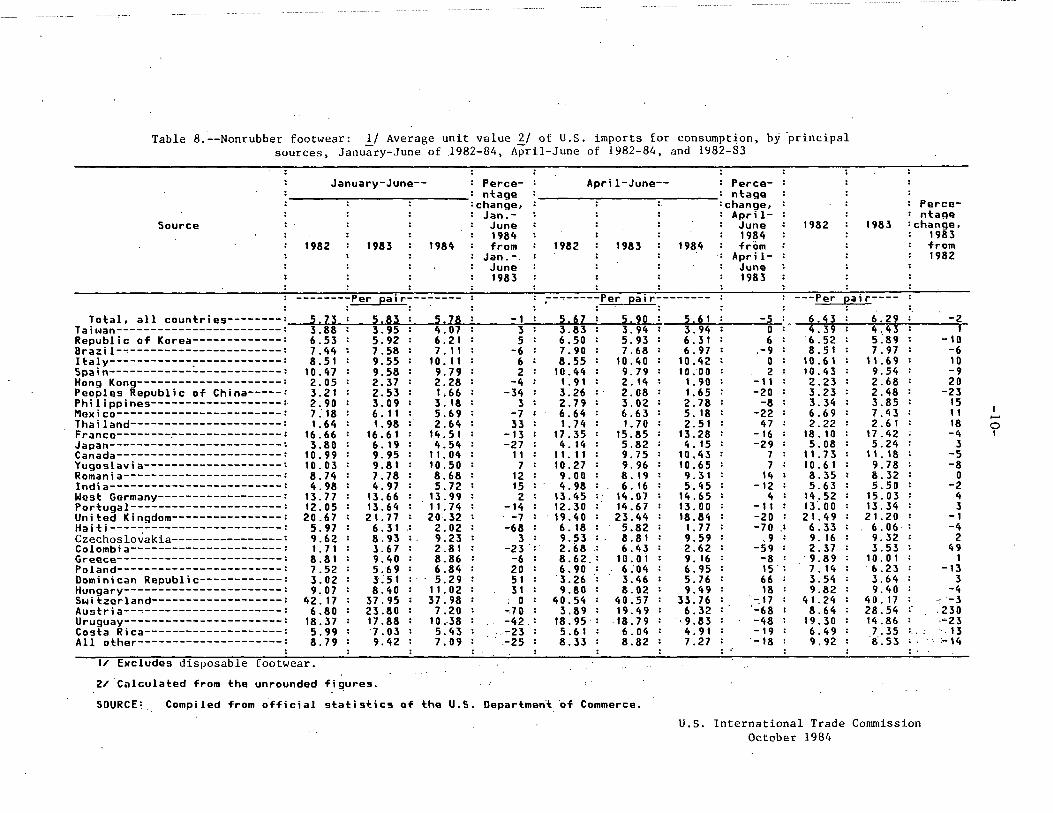
Table 8.--Nonrubber footwear: 1/ Average unit value 2/ of U.S. imports for consumpt~on, by ·principal sources, Janu'iry-June of 1982-84, April-June of 1982-84, and 1982-83
Source
January-June-- Perce-ntage
change, Jan.
June 1984
1982 : 1983 : 1984 : from Jan.-. June 1983
April-June-- Perce-ntage
:. change, AprilJune 1984
1982 : 1983 : 1984 : from ·: Apri 1-
June 1983
1982
Percentage
1983 =change, 1983 from 1982
--------Per pair-------- ~-~-----Per pair-------- ---Per ~air----
Total. all countries--------: 5.73 : 5.83 : 5.78 : -1 : 5.67 5.90 : 5.61 ., Taiwan------------------------: 3.88 : 3.95 : 4.07 : 3 : 3.83 3.94 : 3.94
-" 6.43 : 6.29 u 4.39 : 4.43
Republic of Korea-------------: 6.53 : 5.92 : 6.21 : 5 : 6.50 5.93 : 6.31 6 '6. 52 : s:89 Brazil-~----------------------: 7.44: 7.58: 7.11 : -6 : 7.90 7.68 : 6.97 .-9 8. 51 : 7.97 Italy------------:-------------: 8.51: 9.55: 10.11: 6: 8.55 10.40: 10.42 0 10. 61 : 11. 69 Spain-------------------------: 10.47: 9.58: 9.79: 2: 10.44 9.79: 10:00 Hong Kong---------------------: 2.05 : 2.37 : 2.28 : -4 : 1.91 2.14 : 1.90 Peoples Republic of China-----: 3.21 : 2.53 : 1.66 : -34 : 3.26 2.08 : 1.65 Philippines-------------------: 2.90 : 3.09 : 3.18: 3: 2.79 3.02: 2.78 Mexico------------------------: 7.18: 6.11: 5.69: -7: 6.64 6.63: 5.18
2 10.43 : 9.54 -11 2.23 : 2.68 -20 3.23 : 2.48
-8 3.34 : 3.85 -22 6.69 : 7. 4 3
Thai 1 and----------------------: 1. 64 : 1. 98 : 2. 64 : 33 : 1. 74 1. 7 0 : 2. 5 1 47 2.22 : 2. 6 1 France--------.----------------: 16.66: 16.61: 14.51: -13: 17.35 15.85: 13.28 -16 18. 10 : 17 .42 Japan-------------------------: 3.80 : 6.19: 4.54 : -27 : 4.14 5.82 : 4.15 Canada------------------------: 10.99: 9.95: 11.04: 11: 11.11 9.75: 10.43
-29 5.08 : 5.24 7 11. 73 : 11. 18
Yugoslavia--------------------: 10.03 : 9.81 : 10.50 : 7 : 10.27 9.96 : 10.65 Romania-----------------------: 8.74 : 7.78 : 8.68 : 12 : 9.00 8.19 : 9.31
7 10. 61 : 9.78 14 8.35 : 8.32
India-------------------------: 4. 98 : 4. 97 : 5. 72 : 15 : 4. 98 6. 16 : 5. 45 -12 5.63 : 5.50 West Germany------------------: 13.77 : 13.66 : 13.99 : 2 : 13.45 14.07 : 14.65 Portugal----------------------: 12.05 : 13.64 : · 11.74 : -14 : 12.30 14.67 : 13.00 United Kingdom----------------: 20.67 : 21.77 : 20.32 : -7 : 19.40 23.44 : 18.84 Haiti----~--------------------: 5.97 : 6.31 ~ 2.02: -68 : 6.18 5.82 : 1.77 Czechoslovakia----------------= 9.62 : 8.93 :. 9.23 : 3 : 9.53 8.81 : 9.59 Colombia----------------------: 1.71: 3.67: 2.81: -23·:· 2.68 6.43: 2.62 Greece------------------------: 8.81 : 9.40 : 8.86 : -6 : 8.62. 10.0i : 9. 16
4 14.52 : 15.03 -11 13. 00 : 13.34 -20 21. 49 : 21. 20 -70 6.33 : 6.06
•, 9 9. 16 : 9.32 -59 2. 37 : 3.53
-8 . 9 .89 : 10. 0 I Poland------------------------: 7.52 : 5.t9 : 6.84 : 20 : 6.90 · 6:04 : 6.95 1s: 7. 14 : 6.23 Dominican Republlc------------: 3.02 : 3:51 : 5.29 : 51 : 3.26 · 3.46 : 5.76 66 3.54 : 3.64 Hungary-----------------------: 9. 07 : 8. 40 : 11. 02 : 31 : 9. 80 8. 02 : 9. 49 Switzerland-------------------: 42.17 : 37.95 : 37.98 : . 0 : 40.54 40.57 : 33.76
18 9.82 : 9.40 -.17 41. 24 : 40. 17
Austria--~--------------------: 6.80 : 23.80 : 7.20 : ~10 : 3.89 19.49 : 6.32 '-68 8.64 : 28.54 Uruguay~----------------------: 18.37: 17.88: 10.-38: -42.: 18.95· -18.79: '9.83 Costa Rica--------------------: 5.99 : 7.03 : 5.43 : ~23 : 5.61 6.04 : 4.91
-48 19.30 : 14.86 -19 6.49 : 7.35
All other---------------------: 8. 7 9 : 9. 42 : 7. 0 9 : .-25 : 8. 33 8. 82 : 7. 27 -18 9.92 : ·a·. 53
t/ Excludes disposable footwear.
2/ ·calculated from the unrounded fi~ures.
SOURCE:. Compiled from official statistic9 of the U.S. Department. of Commerce.
U.S. International Trade Commission October 1984
-2 I
-10 -6 10 -9 20
-23 15 11 18 -4
3 -5 -8
0 -2
4 3
-1 -4
2 49
1 -13
3 -4 -3
.230 ·-23 ·. 13 .~ 14
-0 I
'Table 9.--Nonrubber footwear: U.S. l11pOrt.I and percentage dhtrlbutlon of sblpilenh bJ trpea and by prlce rangH (per palr), 1982-83, and Januarr-June 1983.and 1984
TJpe and prlce range !I
. : ·Men's, youths' and boJ•' leather:
1982 1983 Pecentage
cbango, 1983 froa 1982
Januar1-June Percentage change, Jan.-June 1984
1983 1984 from Jan.-June 1983
: Total quantltJ-------.---:--1,000 palr1--: 30,044 : 40,136 : 34 : 17,842 : 23,799 -'l~
· Leu than *1. 25----------------do----·: 339 : 239 : -29 : 134 : 238 -18 •i. 26 - *2. 5·0------------------do----: 494 : 328 : -34 : 214 : 281 $2.51 - $5.00------------------do----: $5.01 - $8.oo-------~-----~----do----: $8.01 and over-~---------------do----:
Women'• and m.hae1' leather: ·
2,804 6,959
19,448
5,568 10,005 23,996
99 44 23
3,092 4,063
10;338
2,705 5,584
14,992
31 -13
37 45
Total quantlty------:-------1,000 pairs--: 94,806 : 131,077 : 38 : 65,469 : '85,739 _ "! Less than $1.25-------------"'.'--do----: 600 : 913 : 52 : 614 : 1,115
· $1.26 - $2.50------------------do----: 1,642 : 2,776 : 69 : 1,778 : 2,600 $2.51 - $5.00------------------do----: 20,183 : 28,510 : 41 : 20,124 : 19,167 $5.01 - $8.00------------------do----: 26,768 : 40,753 : 52 : 16,501 : 25,538 $8.01 and over-----------------do~---:. 45,611 : 58,125 : 27 : 26,452 : 37,318
Men's, youths• , and boys' plastic: : : : : : Total quantlty------------1,000 palr1--: 24,961 : 27,440 : 10 : 13,869 : 15,138
Lea• than $1.25----------------do----: 3,068 : 3,831 : 25 : 2,632 : 2,850 $1.26 - $2.50----·--------------do----: 4,231 : 4,335 : 2 : 2,125 : 2,122 $2.51 - ·$5.00------------------do----: 7,740 : 10,366 : 34 : 5,324 : 6,259 $5. 01 - $8. 00------------------do----: 8, 035 : 1, 550 : -6 : 3, 07.4 : 3, 532 $8.01 and over-----------------do----: 1,888 : 1,358 : -28 : · 713 : 375
Woll).en'a and mlaaes' plastic: Total quantlty------------1,000 palr1--: 122,081 : 127,236 : 4 : 67,520 : 98,062
Lelis than $1.25-----------"'.'.----do----: 16,610 : 18,932 $1.26 - $2.50------------------do----: 22,628 : 20,869 $2. 51 - $5. 00------------------do----:· 53, 217 : .62 ,294 $5.01 - $8.00------------------do----: 25,342 : 21;830 $8.01 'and over-----,------------do--'-·-: 4,284 ·: 3,311
Leather athletic:
14 -8 : 17 :
-14 : -23° :
12,884 13,811 30,198
9,408 1,219
23,652 17,582 40,804 14, 721
1,303
82 46 -5 55 41
~ 8
~/ 18 15
-47
"~ 84 27 35 56
7
Total quantlty------------1,000 palr1--: 76.908 : 79,213 : 3 : 39,518 : 56,479 . ~ "~ 'Le1.1. than, $1.25---------------do----: 1,044 : 1,150 : 10 : 392 : 698 78 •1.26 - •2.50------------------do----: 207 : 577 : 174 : 337 : 198 -41 •2.51 - •5.00------------------do----: 13,408 : 21,560 : 61 : 12,044 : 13,538 12 •5.0l ~ $8.00------------------do----: 36,257 : 29,061 : -20 : 14,659 : 24,304 66 •8.01 and over-----------------do----: . 25,993 : 26,864 : 3 : 12,087 : 17,742 47
Pla1tlc athletic: : : : : : Total quantltJ------------1,000 palr1--: 10.084 : 8,824 : -12 : 5,038 : .4,420 --ll
Leu than •1.25----------------do----: 174 : 361 : 107 : 235 : 184 -22 tl.26 - t2.50------------------do----: 616 : 462 : -25 : 217 : 858 295 t2.51 - t5.00------------------do----: 7,031 : 5,671 : -19 : 3,947 : 2,621 -34 t5.0l - t8.oo--~---------------do----: 1,130 : 1,011 : -10 : 432 : 511 18 t8.0l and over-----------------do----: 1,133 : 1,306 : 15 : 207 : 246 19
see footnote• at end of table.
,.... ,.... I
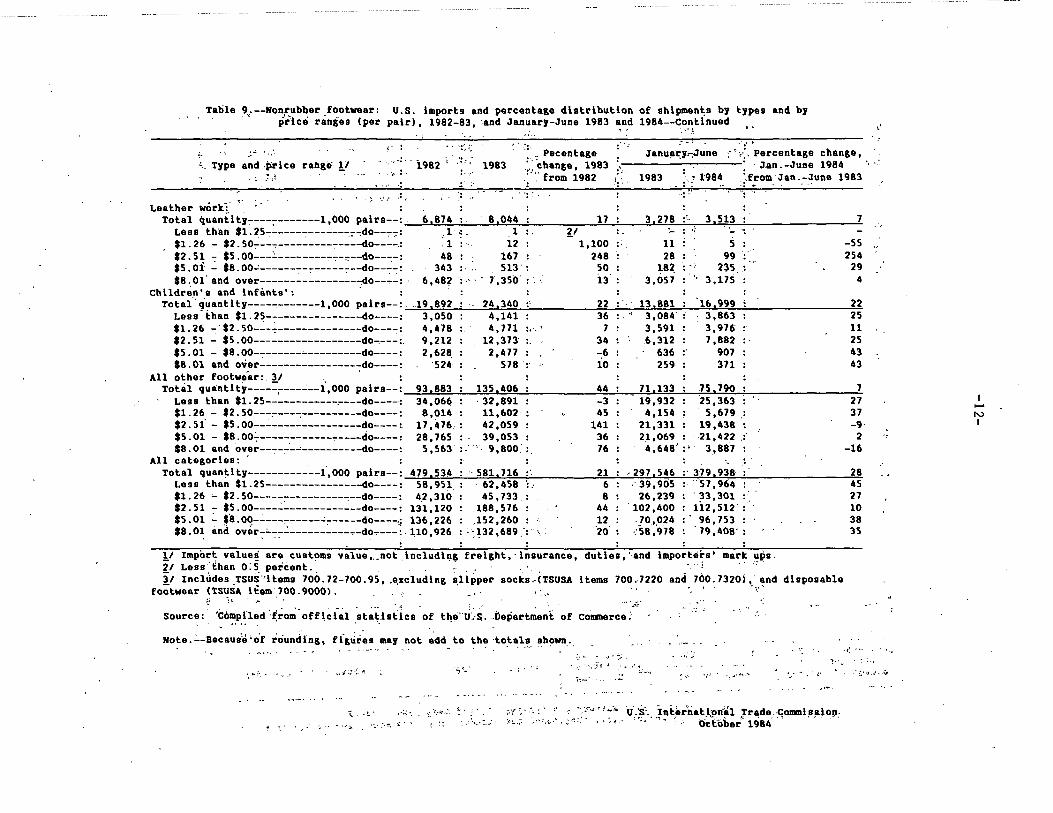
Table 9,.--Nonr_ubber _footwear: U.S. imports and percentage distribution of shipment,s bJ types and bJ price ranges (per pair), 1982-83, ·and January-June 1983 and 1984--Continued
·'.\
~ .• : ::·::;
,•
.~~
'·· Type and .price range· !I ' . ~,I
.. ·""'.'. i982 '• ,•":
' ' ::. ,. Pecentage : . ' Janua:~~:.iune ·· ··/_'Percentage change, 1983 .'..':·change, 1983 '.. . · ·. . . '. · Jan. -June 1984 ""
.;--:from 1982 :;: 1983 ;.! 1984 ;;.f~rom·Jan.-June 1983 .....
Leather work:' ,. ~ ·: .. ,•
.... •'.
Total quantitJ----;c-------1,000 pairs-:-: 6 874 ;. 8 044 : 17 : 3 278 :t. 3 513 Less than $1. 25----------------,do--..,...,: 1 .: . 1 : - 21 : . ·- : .; · ·-$1. 26 - $2. 50...:_.:...,. ____ .:_ ____ -:-_ _:.:__do--:.:..: 1 ~ . i2 : - l, 100 :: 11 : 5 $2. 51 - · $5 .00---::.--------.,-..,.--::---do----: 48 : 167 : 248 : 28 : 99 $5.0l .:_ $8.00..:-----------------do--_:-: 343 :... 513': 50: 182 ':·· 235 .. $8. 01 · and over------.:__.:_ _____ .:__..,do---_:: · 6, 482 : .· - 7, 35(>' : : l3 · . . 3,057 : ·. 3,175
Children's and infants': : : : Total·q'uantity------------1,000 pairs--: .. 19,892: 24,340 :' 22: 13,881: 16,999
Less-ihan $1.25----------------do----: $1.26 -'$2.50-.:.--,--------------do----: $2.51 - $5.00------------------do~---~ $5.01 - $8.00-.,.----------------do----: $8.01 and over-----------------do----:
3,050 4,478 9,212 2,628_
'524
.. 4,141 : 36 : 4,771 :.-.. 7 :
12 ,373 :. 34 : 2,477 : -6 :
578 ':· 10 :
~ 3,084' :· 3,863 3,591 : 3,976 .6,312 : 7,882
636 :· 907 259 : 371
All other footwe'ar: 3/ . ' : Total qua:ntlty---:..=-:-----...:--1,ooo pairs--: 93,883 : 135,406 : 44 : 71,133 : .75,790
Lesa than $1.25-----------------do----: 34,06~ : · 32,891 : -3 : · 19,932 : 25,363 $1.26 - $2.50---~----,----------do----: 8,014 : 11,602 : , 45 : 4,154 : 5,679 $2.5f - $5.00----------------~-do----:. 17,476. :. 42,059 : 141 : 21,331 : 19,438 $5.01 - S8.oo.:..------------.,-----do----: 28,765 : . 39,053 : 36 : 21,069 : --21,42_2. $8.01 and over---:--:--~----------do----: 5,563 :.· ' 9,800 :. 76 : 4,648' :' 3,887
All categories: ' : : : : : · .. Total quan~lty---------_:--1,000 pairs--: 479,534 : ... 581,716 : 21 : · 297,546 :· 379,938
Less than $1. 25----------------do----: 58, 951 : · · 62, 458 ':_. - - - -II : ·':S':l,':IU5 :· "57,964 $1. 26 "' $2. 50-----:-----------,--do----: 4.2, 310 : 45, 733 $2.51 - $5.00----.:.-------------do----: 131,120 : .188,576 $5. 01 ~ $'8 .00-.:.----.,-----..:------do----.· 136 226 . 152 260 $8.01 and over:-'--:-:-~------:_ ___ ..,_do----~- no'.926 ; :~~32:689 ': ., • . . . . . .
8 : 26,239 : '33,301 44 : '102,400 : ll2,512': 12 : .J0_,,0_24 : " 96. 753 : ·20': -:58,978 : 79,408·:
1/ Import values--are customs value ,,_not including freight,· insur-ance, duties,' and importers' mark ups. 21 Less"than o:s percent.· · - "' : ·
7 . " -
-55 254
29 4
22 25 11 25 43 43
_]_ 27 37 -9·
2 -16
28 45 27 10 38 35
i1 Incliides TSUS'"items 700. 72-700.95, .e,:a:cluding ~lipper socks;(TSUSA items 700.7220 and 700.7320),· and disposable footwear ~TS~SA i fem· 700. 9000) . .. ..
!~· .. : ~ . ·~ • . • 1. • . • .~ . : . : .. ~ . • ~· '
Source: ·compiled -~rom official sta~htics of t}\e_--u·.s· .. [)apartment of co11111erce:
~ ·.: ~
I• ... ' •
Note . .:..-eecaus'e'of rounding, flg~iies may not add to the ·totals shown.
, .. ~ .. . i.:; ,. (~ ...
... ;. ~· ;;' :.~ ·:: .~ .. ..,.!'. ... · ; . •',·;:'i., ..... . .;.~.
>· ·,·: .. ......... -·!.'·J . .'· v I-:~~.
·'·":. ·:.·:·-':'-, i:- ···~. ~ .... · · ;·t "· :. : " ,. ' <_, . ._,_.,~~• u.'s". Iiltertiation'&l Trade. co11111iss.io11-
:,c .. 0 _,..,._,,",;-;:·."· .... ; •• ,.,, ...... ' o~lober"1c)84"' .... ....... • t. •. .~~" -: ... _..;r .. :. ...
t--' N I
I·
0
Ta~lalO.--Certain rubber footwear: t/ Quantitv of U.S. imports for consumption, bv principal sources, Januarv-Juna of 1982-84, April-June of 1982-84, and 1982-83
Januarv-Juna-- 1 Paree- : April-June-- : Pare a-: nhga I : ntage :change, : : : =change, : I Jan.- : : : : Apri 1- :
Source I : I : June : : : : June : 1982 1983 I I I t984 I I I : t984 :
1982 I t9a3 : 1984 : from : 1982 : t983 : t984 I from : I Jan.- I : : I April- I
Jun a I I : I June 1983 I : : I 1983
: ----.,----1, no pai ~s------ ------- 1,'000 pairs------. . --1,000 pairs--
Perce-ntaga
change, 1983 from 1982
Taiwan------------------------1 25,581 : 25,728 : 27,624 : ·7 : 10,005 : 10,356 : 11,586 12 : 35.638 : 38,313 : 8 Republic of Korea-----------.--: 18,803 : 18,200 1 17,859: -2 : 8,961 : 8,299: 7,796 -6 : 33,328 : 32,688 : -2 Peoples Republic of Chin;a----,.: 7,429 : 6,841 : 8,972 : 31 : 4,551 : 3,450 : 4,453 29 : 13,705 : 12,935 : -6 Ho1.g Kong---------------------: 1,413: 1,763: 1,908: 8: 631: 815: 952 1/: 2,457: 3,668: 49 Thai land----------------------1 248 : 390 : 878 : t25 1 96 : 235 : 494 110 : 450 : 495 1 10 Japan---------------------:----1 445: 644: 665: 3: 284: 313: 401 28 1 799: 935: 17 Philippina5-------------------: 75 : 193 : 411 : fl3 : 29 : 137 : 259 89 : 127 : 316 : 149 Sri Lank;a-----------------:-----: 238 : 187 : 410 : 119 : 173 : 187 : 179 -4 : 418 : 292 : -30 It;aly-----------:---~-----------: Z,262 : 625 • 273 : -56 : 743 : 160 : 105 -35 : 2,387 : 747 : -69 France--------~---------------: 293 1 311 1 165 : -47 1 187 : 164 : 78 -52 : 535 : 476 : -11 Malaysia----------------------: 152 : 94 : 42 : -55 : 101 : 58 : 37 -37 : 297 : 129 : -57 Br;azil------------------------: 26 : 59 : 47 : -21 : 3 : 55 : 20 -64 : 28 : 228 : 727 West Germany------------------: 33 : 20 1 28 : 38 1 13. : 7 1 14 93 : 57 : 35 : -38 Yugo5hvia--------------------: 1· : 6 : 13 1 99 1 1 : 6 : 11 76 : 5 : 13 : 158 Canada------------------------: 20 : 14 : 32 : 134 : 13 : 10 1 5 -56 : 35 : 42 : 19 All other---------------------: 3.728 : 5.829 : 7.233 : 24 : 1.642 : 2.603 : 3,690 ·. 42 : 7.750 : 11, 172 : __ti__
Total----------------------1 60,747 : 60,906 1 66,561 : 9 1 27,432 : 26,856 1 30,078 12 ~ 98,016 :102,484 : 5
1/ Provided for under TSUS items 700.59-700.71, and includes footwear with fabric uppers and soles of rubber or plastics. Such fo-;_;-twear includes sneakers, joggers and certain casual shoes and slippers. They do not include protective footwear, such as galoshes.
Source:' Compiled from official statistics of the U.S. Department of Commerce.
·U.S. International Trade Commission October 1984
I ._. w I
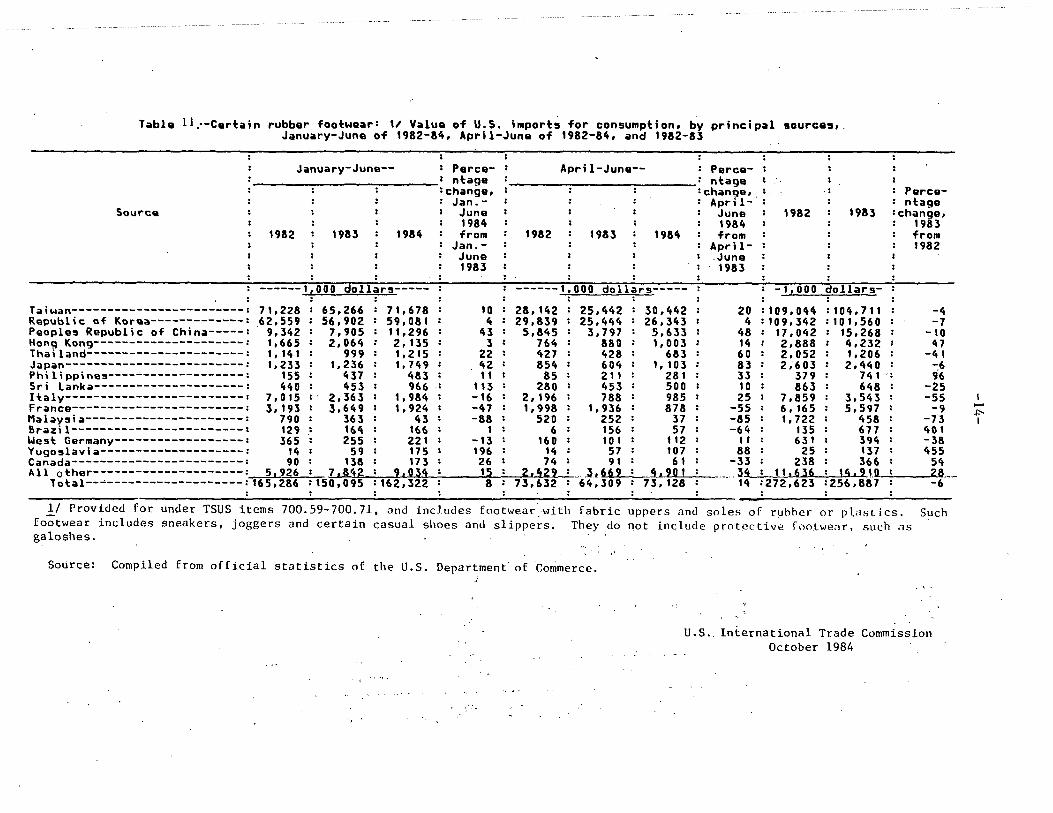
Table 11.--Certain rubber footwear: 1/ Value of U.S. imports for consumption, by principal sources,. January-June of 1982-84, April-June of 1982-84, and 1982-83
January-June-- : Perce- : April-Juna-- : Perce-: ntage : : ntage =change, : : : :change,. Paree-: Jan.- : : : : April- ntage
Source : I June : : : I June 1982 1983 change, : 1984 : : : : 1984 1983
1982 1983 1984 : from : 1982 : 1983 : 1984 : from from Jan.- : : : : April- 1982 June : I : : .June 1983 : : : : 1983
------t~ooildorlars-~-~.::-:~- : .::..:.::..:=1, ooo-dollars=.::-::-: : -1, 000-Cloflars-: : : : : : : : :
Taiwan------------------------: 71,228 : 65, 26·6 : 71,678 : 10 : 28, 142 : 25,442 : 30,442 : 20 :109,044 :104,711 : -4 Republic of Korea-------------: .62,559 : 56,902 : 59,081 : 4 : 29,839 : 25,444 : 26,343 : 4 : 109. 342 :101,560 : -7 Peoples Republic of China-----: 9,342 : 7,905 : 11, 296 : 43 : 5,845 : 3,797 : 5,633 : 48 : 17,042 : 15,268 : -10 Hong Kong---------------------: 1,665 : 2,064 : 2. 135 : 3 : 764 : 880 : 1,003 : 14 : 2,888 : 4,232 : 47 Thailand----------------------: 1, 14 I : 999 : 1,215 : 22 : 427 : 428 : 683 : 60 : 2,052 : I, 206 : -41 Japan-------------------------: 1,233 : 1, 236 : 1, 749 : 42 : 854 : 604 : I, I 03 : 83 : 2 ,-6 0 3 : 2,440 : -.6 Philippines-------------------: 155 : 437 : 483 : 11 : 85 : 211 : 281 : 33 : 379 : 74 1 ·: 96 Sri Lanka---------------------: 440 : 453 : 966 : 113 : 280 : 453 : 500 : 10 : 863 : 648 : -25 Italy---~---------------------: 7,015 : . 2,363 : 1,984 : -16 : 2, 196 : 788 : 985 : 25 : 7,859 : 3,543 : -SS France------------------------: 3,193 : 3,649 : 1,924 : -47 : 1,998 : 1, 936 : 878 : -55 : 6. 165 : 5,597 : -9 Malaysia----------------------: 790 : 363 : 43 : -88 : 520 : 252 : 37 : -85 : 1, 722 : 458 : -n Srazil------------------------: 129 : 164 : 166 : 1 : 6 : 156 : 57 : -64 : 135 : 677 : 401 West Germany------------------: 365 : 255 : 221 : -13 : 160 : 10 I : 112 : ti : 631 : 394 : -38 Yugoslavia---------~----------: 14 : 59 : 175 : 196 : 14 : 57 : 107 : 88 : 25 : 137 : 455 Canada------------------------: 90 : 138 : 173 : 26 : 74 : 9' : 6' : -33 : 238 : 366 : 54 All other---------------------: 51926 : 7 d~~i : 21113~ : ':l : z.~Z! : .. J.669 : ~-· 2111 : ·-·. 34 : 11 .636 : 14.~tQ : ZlL_
lotal----------------------:165,286 :150,095 :162,322 : 8 : 73,632 : 64,309 : 73, 128 : 14 :212.623 1256,887 : -6
1/ Provided for under TSUS items 700.59-700.71, and includes footwear:with fabric uppers and soles of rubber or p\astics. Such fo-;-twear includes sneakers, joggers and certain casual shoes and slippers. They do not include protective footwe;ir, such as galoshes.
" Source: Compiled from official statistics of the U.S. Department· of Commerce.
U.S. International Trade Commission October 1984
,.....
"" I
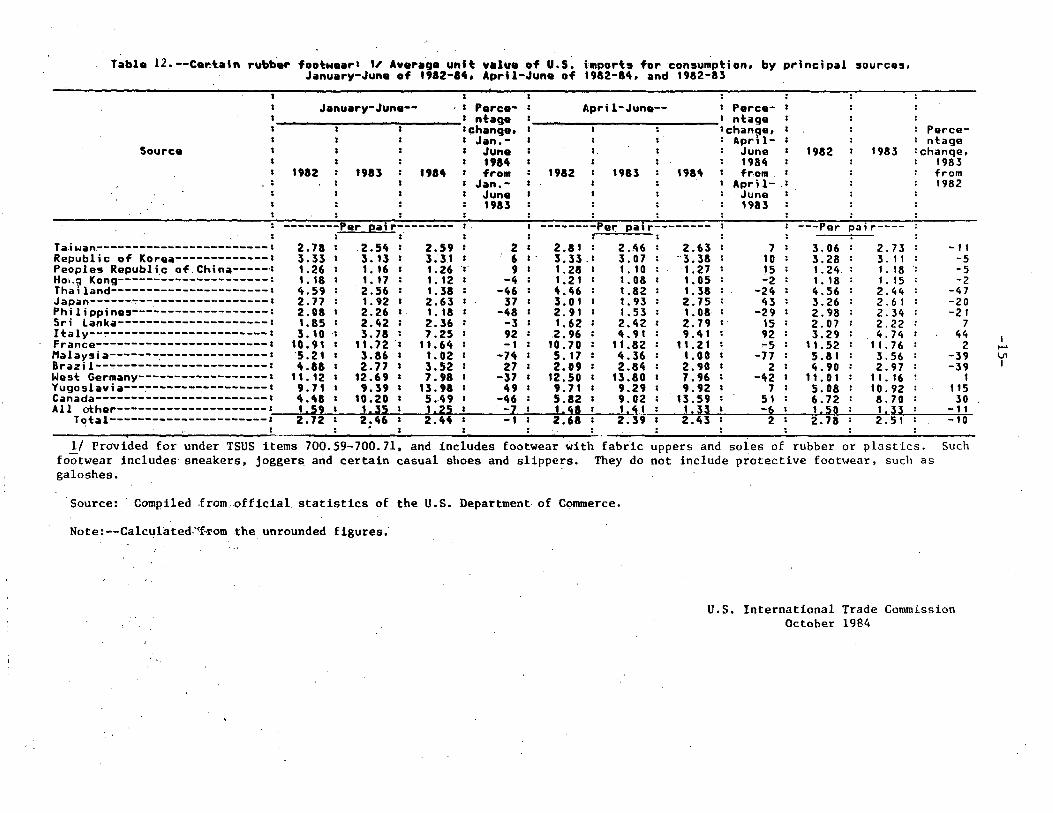
Table 12. --Cer.t.ain rubbar footwaar1 '' Average unit v•lue of U.S. h1ports for consumption, by principal sources. January-June of '912-&4, April-June of 1982-&4, and 1982-83
I
January-June-- 1 Paree- 1 April-June-- : Perca-----------,.-----1 ntaga 1 1 ntage : 1 change, 1 1 : : change, 1 Jan.- 1 : 1· : April-
Source Juna 1 1. : : June 1914 I I I I 1984
1982 : 1983 : 19&4 1 from : 1982 1 1983 : 1984 : from Jan.- : : : : April-.:
June 1 1 : :. June 1983 I I I : 1983
--------Par pair-------- 1 --------Per pair--------1. : I
Taiwan~-----------------------: Republic of Koraa-------------1 Peoples Republlc of China-----1 Ho~.g Kong---------------------: Thailand----------------------1 Japan------T------------------: Philippinas~------------------1 Sri Lanka---------------------1 Italy--~----------------------: Franca------------------------1 Malays i a-------.---------------1 Brazil------------------------: Wast Germany------------------1 Yugoslavia--------------------1 Canada------------------------1
2.78 I
3.33 I
1. 26 : 1. 18 I
4.59 I
2.17 : 2.oa 1
1.85 I
3. 10 : 10.91 I
5.21 I
4.H I
11. 12 I
9.7' I
4.48 I
2.54 : 2.59 I
3. 13 I 3."31 I 1. 16 : 1.26 T 1. 17 : 1. 12 I
2.56 : 1.38 : 1.92 I 2.63 I 2.26 I· '. 18 : 2.42 : 2.36 : 3.78 I 7.25 I
11. 72 : 11.64 : 3.86 I '. 02 : 2, 77 I 3.52 :
'2.69 I 7.98 I 9.39 I 13.98 I
10. 20 I 5.49 I All ot:har---------------------1 . •c< •• ,,c • ••c t C.G t t 'I:.. 't I ~C I
Total----------------------1 - - - -- --IC.IZ I Z.'lt» i Z.'l'l I
2 I 6 I .
9 -4
-46 37
-48 -3 92 -1
-74 27
-37 49
-46 -z -1
2.81 : 2.46 : 2.63 : 1 : 3.33 .. 1 3.07 : ""3.38 : 10 : 1.28 : . 1. 10 : 1. 27 : 15 : 1. 21 I 1.08 : 1.05 : .:.2 : 4.46 : 1.82 : 1.38 : -24 : 3.01 : 1.93 : 2.75 : 43 : 2.91 : 1. 53 : 1.08 : -29 : 1.62 : 2.42 : 2.79 I 15 : 2.96 : 4.91 : 9 .41 : 92 :
10.70 : It .82 : 11.21 : -5 : s. 17 : 4.36 I 1. 00 : -77 : 2.09 : 2.84 : 2.90 : 2 :
12.50 I 13.80 I 7.96 : -'t2 : 9. 71 I 9.29 : 9.92 I 1 : 5.82 I 9.02 : 13.59 : 51 : 11 §1 I 1.~.!- : 1, ;n : -~ : 2.68 I 2;39 I 2.43 I 2 :
1982 1983
Parcen t age
:chanqe, 1983 from 1982
---Par pair----
3.06 ;
3.28 : 1. 24. ; 1. 18 : 4.56 : 3.26 : 2.98 : 2.07 : 3.29 :
11. 52 : 5.8 I ;
4.90 : 11. 0' : 5.08 : 6.72 ; 1, ~o : 2.78 :
2. 73 3. 11 I. 18 .. I. 15 2.44 2. 61 2.34 2.22
. 4. 74 11. 76 3.56 2.97
11. 16 10.92 8.70 1,3~ 2. 51
- I I -5 -5 -2
-47 -20 -2 I
7 44
2 -39 -39
1 115 30
-11 -10
1/ Provided for under TSUS items 700.59-700. 71, and includes footwear with fabric uppers and soles of rubber or plastics. Such footwear includes· sneakers, joggers. and certain casual shoes and slippers. They do not include protective footwear, such as galoshes.
Source: Compiled .from .. official statistics of the U.S. Department. of Commerce.
Note:--Calculated."f~rom the unrounded figures.·
U.S. International Trade Commission October 1984
I ...... vi I
Tablel3.--Nonrubber footwear: Quantity of U.S. exports of domesti~ merchandJse, by principal markets, January-June of 1982-84, April-June of 1982-84, and 1982-83
January-June--
Marke\:
Percentage
change,
April-June--
:.
Percentage
:change, : April
June 1982
: Perce:: : "nt:age'
1982 : 1983 : 1984
Jan.June 1984 from 1982 : 1983 : 1984
1984 from
1983 =change, 1983 from 1982 Jan.
June . 1983
AprilJune 1983
-------1i000 pairs------ -------1,000 pairs------ --1,000 P<!irs--: ···.:
Jap~n---~~----~--~------------: 359': 397: 960: 142 : 158= 261: Mexico-----~------------------: 6 11: 262: 439: . 6 7. : 378=. 156:
~=~!~;::::::::::::::::::::::::~ 103: 290: 256: -12 : 54: 145: 667: 492= 347: -29 : 289= 3 18:
France------------------------: 180: 158: 148: -6 : 79: 35: Brazil------------------------: s: 31: 57: 83 : 1: ·14,: Trinidad and To~ago--------~--: 204: 18 I: 86: "'.'52 : 72 :. . 84: Panama------------------------: 34: 42:. 52: 24 : 23=. 23: Cameroon-----------~----:------: 1 : 0: 43:. 11' : 1: o: Bahamas-----------------------: 178.= 163: 70 :. -57 : 10 I:. . 66: ; Dominican Republic------------: 52= 164: 74 :·. -55 : 41: 79: Neth.er lands Ant: i l les-...,·--------: 154: 77: 72: -7 : 96: 39 :_ Hong Kong~------~-------------: 29: 42: 59: 42 : .15: 11: United Kingdom----------------:- 89: '83: 90: 8 : 43: 46: Saudi Arabia·-----------------: 1 I 1 : . 123: 64': -48 : 39: 61: Sinqapore-:------------".'-------: 47: ·44 =. 35: -22 .. 21:. 20 :. Ba~bados~-!-------------------: .40: 63: 38: ".'39 : 25=. 31: Bermuda-----------------------: 57: 52: 33: -27 : 34: 17: Indonesia----~----------------: 4: 0: 16 :· 41413 . . 4: 0 , .. Chile-------------------------: 37: 2: 18': 914 : 15: 2: Jamaica------~~-----------7---: . 5: 19:· 13: -30 : .3: 7: All ot:her---------~-------7---: 1i636 : 1i203: 6Z2= -;n : 26Z= :ZD!P
Total------------~----------: 4, 607 :. 3, 690·: 3,650 :· -1 : 2, 50 9 :; 1, 965:
.Y Reflects_. a change from zero to a specified ~uantity',in the following year. . ·.··
SOURCE: Compiled from official slatistics of the U.S. Department ~f Commerce.
Note.--Percentages calculated fr'om the unrounded. figures.
.• :,,i:. ·, .. '-'.'.:,:
.. s~·.. . . •"
'"'... •::, . :.·.'!
.. ~ ··~ ....
547: 110 850: 1,032 302: 93 1,068: 456 185: 28 298: 584 183: -42 1, 186: 920 63.i -26. .' ~07: . 307 44: 219 52: 36 44: -48· . 377: 290 43: . 86 53·:. 63 40: 1/ 2: . 17 39: -40 438: 322 35 :. -56 103: 293 31 :. -19 320: 221 30: 178 66= 63 28 :'. -41 151: 198 26: -57 228= 233 22: 9 95: 85 18: -41 106: 133 18: 2. 1·19: 105 16: 4t413 44: 0 13: ·647 56: 4 n: 68 55: 34
3:zz: -z2 Z13Jz: z.0~1 2,095: 7 8,890: . 7,435
U.S. International Trade Commission Oct,ober 1984
. ·: ·.:· ...
. ,. ~: ... :.. . , a: ~ :..~. ... \
_.
21 -57
96 -22
0 -31
.. -23 .. 19
798 -27 184 -31 -5
. 31 2
- ti 25
-12 . -100
-93 -38 -~ -16
\· ~·
1 ,_. 0\ I
, ... ••• 77.1
•• 7,
~-·· ., " .. ., "" "·'
"·' zz.1
\
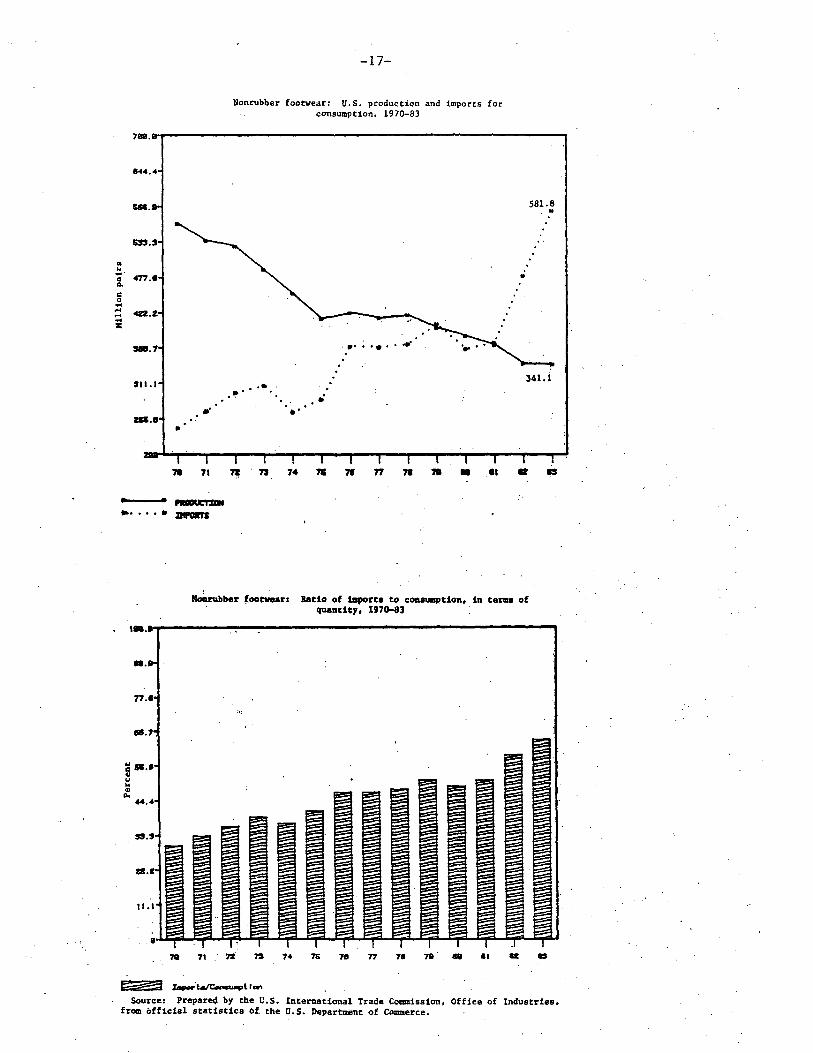
-17-
Nonrubber footwear: U.S. production and imports for consllll!ption, 1970-83
llloarubber ,.ootvear: Ratio of 1111poru to CODllUlllJltion, in tenis of quantity, 1970-83
:•;
E??a~~"'°"' Source: Prepare4 by the U.S. International Trade C0111111ission, Office of Industries,
from official statistics Of the U.S. Department of Commerce.
UM
I~
!I) .. .... .. Q.
c 0 .... 112
..... ..... .... :ic
"
··-·-·
1.229
1.1!1'48
" .. "' ..... ..... ~ .,, c 0 -....
..... ..... .... :>::
-
-·-·~
-18-
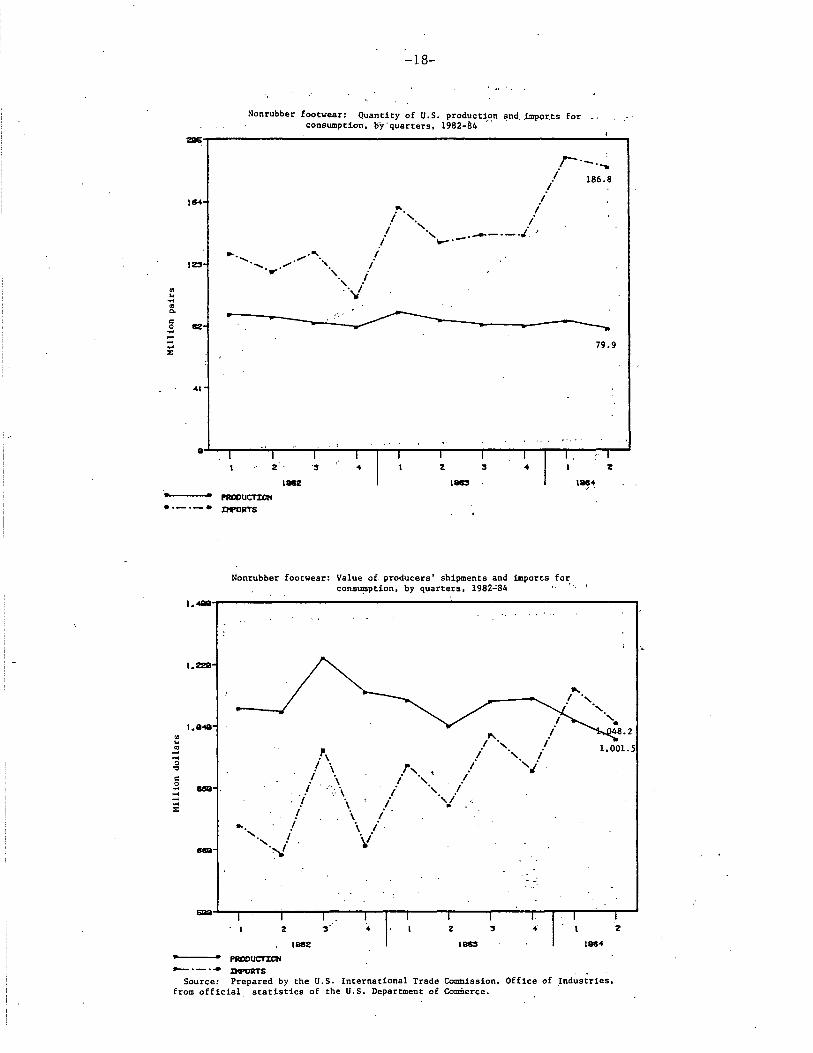
Nonrubber footwear: Quantity of U.S. production '!nd .. imper.ts for _. consumption, lfy ·quarters, 1982-84 ., ·
r-·-.~ i
i i
... i i .. ,. . . '· /,.
I ' .-·-·-·.I. / ---......... ..... I ....- ·, .
..._ . .,.. . ...- ·, I
' / '\/
1ae2 lae::I
Nonrubber footwear: Value of producers' shipments and imports for consumption, by quarters, 1982~84 ·
.... '
"' I .
.1\ i '· I \ ,., • i
/ \ ; ., / . I .-.. \ i ·' .... ,/ I \ I '•
/ \ / I \ I
' ! \i -~
1882 ·~
186.8
79.9
1884
Source: Prepared by the U.S. International Trade Commission, Office of .Industries, from official statistics of the U.S. Department of Commerce.
... _
.. •
-19-
Nonrubber footuear: Ratio of imports to consumption, in terms of quantity, by quarters, 1982-84
Nonrubber footwear: Ratio of imports to consumption, in terms of value, by quarters, 1982-84
Source: Prepared by the U.S. International Trade Commission, Office of Industries, from official statistics of the U.S. Department of Commerce.
-20-
Producer Price Index for footwear (BLS code 043), by quarters, 1982-84
2114.4
.zsa.a
·zs:s.s ..
.. 2s1·.2
0 Z47.I 0 ; ,...., .. "' °'. 242.Z •' .....
.'.>
298.7,
Zsl.1 .. ·.,•
:zzs.e
·;
229
z ' ... z ' 4 z
1882 1183 IM+ Pr..._ Pr•- :cn.-
Consumer Price Index.for footwear of leather and nonleather, by quarters, 1982-84
ZZI .I
%17.Z
z1:s.:s
0 Zlilll.4 0
ii ..... "' °' - Zlil&.e
ZBl.7
187.11
lllS.S
•........•
................................ ,,. .. ,. .. ··
z , 1882
C...-- Pr r- Indoooo
4
. ................ ·· .•.
z , 11113
.209.6
.. ·· ..... ·--······ ...•... ······
4 z 11194
Source: Prepar~d by the U.S. International Trade Commission, Office of Industries, from official statist·ics of the Bureau of Labor Statistics, U.S. Department of Labor.
:.:.
~: ..
"' .,, c Cll
"' " 0 .c e..
"' ... .... "' "" c 0 .... ... ... .... x
1118
1715
164
1'2
118
a
68
-21-Nonrubber footwear: Quantity of U.S. imports for consumption, by
principal so_urces, April-June 1982-84
a .... ~.-...a.;;_.~ .. ._.._~~~----...... .,.. April.:.June
18112
E ffl All ......,trrf Z Z l Tar_, I I ir.r-
April-June April-June 11185 ., ...
Average number of all employees engaged in the manufacture of nonrubber footwear, by quarters, 1982-84
1.a.a
144 • .il
138.9
13'.,
127.8
122.2
116. 7
I 11.1
f' z I EIA.OYm;
Source: Prepared by ·che U.S. International Trade Commission, Office of Industries, from official statistics of the U.S. Bureau of Labor Statistics, U.S. Department of Labor.