Embed Size (px)
Citation preview
The Journal of Neuroscience, September 1993, 13(g): 4072-4081
Nonuniform Expression of Habituation in the Activity of Distinct Classes of Neurons in the Ap/ysk Abdominal Ganglion
Chun Xiao Falk,’ Jian-young Wu,’ Lawrence B. Cohen,’ and Akaysha C. Tang1~2~a
‘Department of Cellular and Molecular Physiology, Yale University School of Medicine, New Haven, Connecticut 08510, ‘Department of Psychology, Harvard University, Cambridge, Massachusetts 02138, and the Marine Biological Laboratory, Woods Hole, MA 02543
Global observations of neuronal response in the nplysia ab- dominal ganglion were made during habituation of the gill withdrawal reflex using voltage-sensitive dye recording. This technique makes it possible to measure the spike activity of 3040% of the 1000 neurons present in the ganglion. Our experiments address the issue of how habituation is ex- pressed in the activity of the population of neurons respond- ing to siphon stimulation. Several classes of neurons exhib- ited characteristically distinct responses to the stimuli and to habituation training. One class of neurons (group I) re- sponded to the onset and offset of the sensory stimulus although they are probably not primary sensory neurons. They habituate only partially when the behavioral reflex has already habituated completely. Two other classes (groups II and Ill) both have sustained responses to the touch, but habituate differently. Members of group Ill habituate com- pletely while those in group II habituate only partially. An- other class of neurons are inhibited by the stimulus (group IV). They become less inhibited after habituation. The re- sponse of both group I and group I’! are new classes of response that have not been previously reported.
[Key words: habituation, gill withdrawal reflex, voltage- sensitive dye, optical recording, Aplysia, neuron clustering]
The neuronal basis of the Aplysia gill withdrawal reflex and its modification by habituation, a simple form of learning, have been studied extensively (Castellucci et al., 1970; Kupfermann et al., 1970; Pinsker et al., 1970; Byrne, 1982; Goldberg and Lukowiak, 1984; Bailey and Chen, 1988). The cellular correlates of behavioral habituation were attributed largely to the “homo- synaptic depression of the excitatory efficacy of the monosyn- aptic sensory-to-motor connection” in the abdominal ganglion (Dudai, 1989). Most studies have focused on the events at the site of plasticity that this model suggested. However, recent electrophysiological experiments suggest that the minimal neu-
Received Jan. 4, 1993; revised Apr. 5, 1993; accepted Apr. 6, 1993. We thank Ray Falk and Paul Katz for helpful discussions of data analysis and
thank Barbara Ehrlich, Bill Ross, and Terry Walters for comments on the manu- script. We are grateful to David Senseman for the loan of the 464 element pho- todiode array and the Silicon Graphics workstation. Vie Pantani and Henrik Abildgaard of the Physiology electronics shop designed and constructed the am- plifiers and analog-to-digital converter used to record the output of the diode array. This work was supported in part by Grant NS08437 from NINDS, and an IBM and a William James Fellowship.
Correspondence should be addressed to Chun Falk, Department of Physiology, Yale University School of Medicine, 333 Cedar Street, New Haven, CT 065 10.
“Present address: 2 I59 NW Irving, Portland, Oregon. Copyright 0 1993 Society for Neuroscience 0270-6474/93/134072-10$05.00/O
ronal circuit for the reflex is more complex (Lukowiak, 1978; Hawkins et al., 198 1; Frost et al., 1988; Trudeau and Castellucci, 1992). Indeed, optical measurements show that 200-300 neu- rons in the ganglion are activated by the sensory stimulus that initiates the gill withdrawal reflex (Zecevic et al., 1989; Na- kashima et al., 1992). Because of this complexity, it is important to obtain a more global view of neuron activity during the process of habituation.
The LE siphon sensory neurons (Byrne et al., 1978a,b), pre- viously thought to provide the sensory input for the gill with- drawal reflex, were recently reported to be activated after the motor neurons (Cohen et al., 199 1). Thus, these neurons are probably not the major touch sensory neurons for the gill with- drawal reflex. Optical measurements may provide useful infor- mation about other sources of sensory input. This study ad- dresses the question of how habituation is expressed in the response patterns of individual neurons in this population and how the change in these responses contributes to the behavioral change.
Preliminary reports have been published (Falk et al., 199 1, 1992).
Materials and Methods Preparation and procedures. Aplysia californica weighing S-20 gm were obtained from Marinus (Long Beach, CA). At this stage, abdominal ganglia have about 900 neurons (Coggeshall, 1967; Cash and Carew, 1989). Experiments were carried out on the isolated siphon preparation (Fig. 1) developed by Kupfermann et al. (197 1). The isolated siphon preparation was placed in a Lucite chamber with compartments for siphon, gill, and abdominal ganglion isolated by Vaseline seals. Except where specifically mentioned, the ganglion was bathed either in natural seawater or in an artificial seawater (460 mM NaCl, 10 mM KCl, 11 mM CaCl?, 55 mM MgQ, and 10 mM Tris-HCl, pH 7.6). The nondesheathed ganglion was stained with 0.1-O. 15 mg/ml of the voltage-sensitive dye RH 155 (Grinvald et al., 1982) (available as NK304 1, Nippon Kankoh Shikiso Kenkyusho Co. Ltd., Okayama, Japan). The staining procedure, which consisted of four alternations of 2.5 min in dye and 2.5 min of wash, was designed to avoid pharmacological effects of the dye (Na- kashima et al., 1992). The staining was done before the ganglia were pinned out in the Sylgard chamber; staining after pinning out seemed to result in less complete optical recordings. Mechanical stimulation (2 gm/600 msec) was delivered to the siphon skin via a computer-con- trolled motor moving a 0.6 mm glass rod with a rounded tip. The siphon was pinned down and bathed in a low-calcium, high-magnesium saline (228 mM NaCl, 10 mM KCl, 1 mM CaCl,, 220 mM MgCl,, and 10 mM Tris-HCl, pH 7.6) to block synaptic transmission. This solution was used to block siphon movement in order to obtain a consistent stim- ulation site. Preliminary experiments indicated that this solution in the siphon chamber had no detectable effect either on the response of neu- rons in the ganglion to the mechanical stimulation or on the resulting gill withdrawal. The temperature was usually kept at 16 +- 1°C.
The gill movements were recorded on videotape. The time course of the change in gill area was obtained from the videotape by electronically
The Journal of Neuroscience, September 1993, 13(g) 4073
PHOTODIODE ARRAY
PLIFIERS ‘OMPUTER DISPLAY
LIGHT FILTER SOURCE
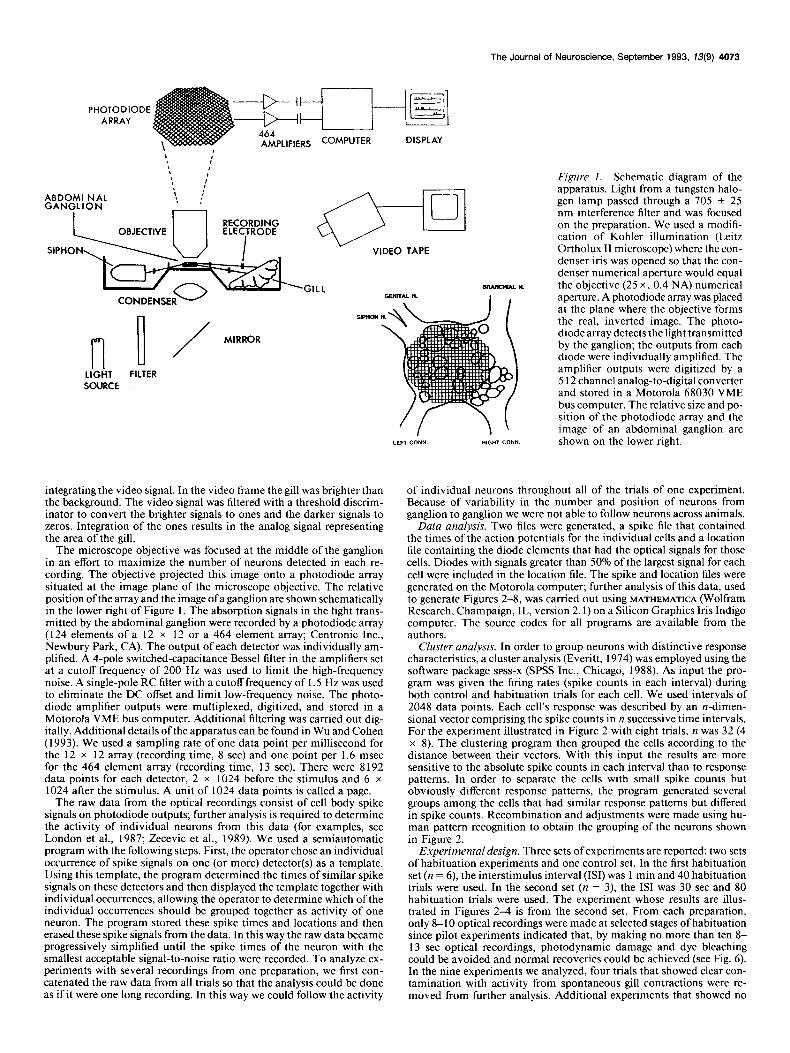
Figure 1. Schematic diagram of the apparatus. Light from a tungsten halo- gen lamp passed through a 705 * 25 nm interference filter and was focused on the preparation. We used a modifi- cation of Kohler illumination (Leitz Ortholux II microscope) where the con- denser iris was opened so that the con- denser numerical aperture would equal the objective (25 X, 0.4 NA) numerical aperture. A photodiode array was placed at the plane where the objective forms the real, inverted image. The photo- diode array detects the light transmitted by the ganglion; the outputs from each diode were individually amplified. The amplifier outputs were digitized by a 5 I2 channel analog-to-digital converter and stored in a Motorola 68030 VME bus computer. The relative size and po- sition of the photodiode array and the image of an abdominal ganglion are shown on the lower right.
integrating the video signal. In the video frame the gill was brighter than the background. The video signal was filtered with a threshold discrim- inator to convert the brighter signals to ones and the darker signals to zeros. Integration of the ones results in the analog signal representing the area of the gill.
The microscope objective was focused at the middle of the ganglion in an effort to maximize the number of neurons detected in each re- cording. The objective projected this image onto a photodiode array situated at the image plane of the microscope objective. The relative position of the array and the image of a ganglion are shown schematically in the lower right of Figure 1. The absorption signals in the light trans- mitted by the abdominal ganglion were recorded by a photodiode array (124 elements of a 12 x 12 or a 464 element array; Centronic In&, Newburv Park. CA). The output of each detector was individuallv am- plified. A 4-pole switched-capacitance Bessel filter in the amplifiers set at a cutoff frequency of 200 Hz was used to limit the high-frequency noise. A single-pole RC filter with a cutoff frequency of 1.5 Hz was used to eliminate the DC offset and limit low-frequency noise. The photo- diode amplifier outputs were multiplexed, digitized, and stored in a Motorola VME bus computer. Additional filtering was carried out dig- itally. Additional details ofthe apparatus can be found in Wu and Cohen (1993). We used a sampling rate of one data point per millisecond for the 12 x 12 array (recording time, 8 set) and one point per 1.6 msec for the 464 element array (recording time, 13 set). There were 8192 data points for each detector, 2 x 1024 before the stimulus and 6 x 1024 after the stimulus. A unit of 1024 data points is called a page.
The raw data from the optical recordings consist of cell body spike signals on photodiode outputs; further analysis is required to determine the activity of individual neurons from this data (for examples, see London et al., 1987; Zecevic et al., 1989). We used a semiautomatic program with the following steps. First, the operator chose an individual occurrence of spike signals on one (or more) detector(s) as a template. Using this template, the program determined the times of similar spike signals on these detectors and then displayed the template together with individual occurrences, allowing the operator to determine which of the individual occurrences should be grouped together as activity of one neuron. The program stored these spike times and locations and then erased these spike signals from the data. In this way the raw data became progressively simplified until the spike times of the neuron with the smallest acceptable signal-to-noise ratio were recorded. To analyze ex- periments with several recordings from one preparation, we first con- catenated the raw data from all trials so that the analysis could be done as if it were one long recording. In this way we could follow the activity
of individual neurons throughout all of the trials of one experiment. Because of variability in the number and position of neurons from ganglion to ganglion we were not able to follow neurons across animals.
Data analysis. Two files were generated, a spike file that contained the times of the action potentials for the individual cells and a location file containing the diode elements that had the optical signals for those cells. Diodes with signals greater than 50% of the largest signal for each cell were included in the location file. The spike and location files were generated on the Motorola computer; further analysis of this data, used to generate Figures 2-8, was carried out using MATHEMATICA (Wolfram Research, Champaign, IL, version 2.1) on a Silicon Graphics Iris Indigo computer. The source codes for all programs are available from the authors.
Cluster analysis. In order to group neurons with distinctive response characteristics, a cluster analysis (Ever&, 1974) was employed using the software package sass-x (SPSS Inc., Chicago, 1988). As input the pro- gram was given the firing rates (spike counts in each interval) during both control and habituation trials for each cell. We used intervals of 2048 data points. Each cell’s response was described by an n-dimen- sional vector comprising the spike counts in n successive time intervals. For the experiment illustrated in Figure 2 with eight trials, n was 32 (4 x 8). The clustering program then grouped the cells according to the distance between their vectors. With this input the results are more sensitive to the absolute spike counts in each interval than to response patterns. In order to separate the cells with small spike counts but obviously different response patterns, the program generated several groups among the cells that had similar response patterns but differed in spike counts. Recombination and adjustments were made using hu- man pattern recognition to obtain the grouping of the neurons shown in Figure 2.
Experimentaldesign. Three sets of experiments are reported: two sets of habituation experiments and one control set. In the first habituation set (n = 6), the interstimulus interval (ISI) was 1 min and 40 habituation trials were used. In the second set (n = 3), the IS1 was 30 set and 80 habituation trials were used. The experiment whose results are illus- trated in Figures 2-4 is from the second set. From each preparation, only 8-l 0 optical recordings were made at selected stages of habituation since pilot experiments indicated that, by making no more than ten 8- 13 set optical recordings, photodynamic damage and dye bleaching could be avoided and normal recoveries could be achieved (see Fig. 6). In the nine experiments we analyzed, four trials that showed clear con- tamination with activity from spontaneous gill contractions were re- moved from further analysis. Additional experiments that showed no
A Control 1st 5th 20th 40th 60th 80th Recovery
I I I I I
J
13 SEC
The Journal of Neuroscience, September 1993, 73(9) 4075
B Control 5th 20th 40th 60th 60th ReooveIy
I
II
Ill
IV
V
VI
Stim. L--L-- L L
19.2 Spikes
8Sec
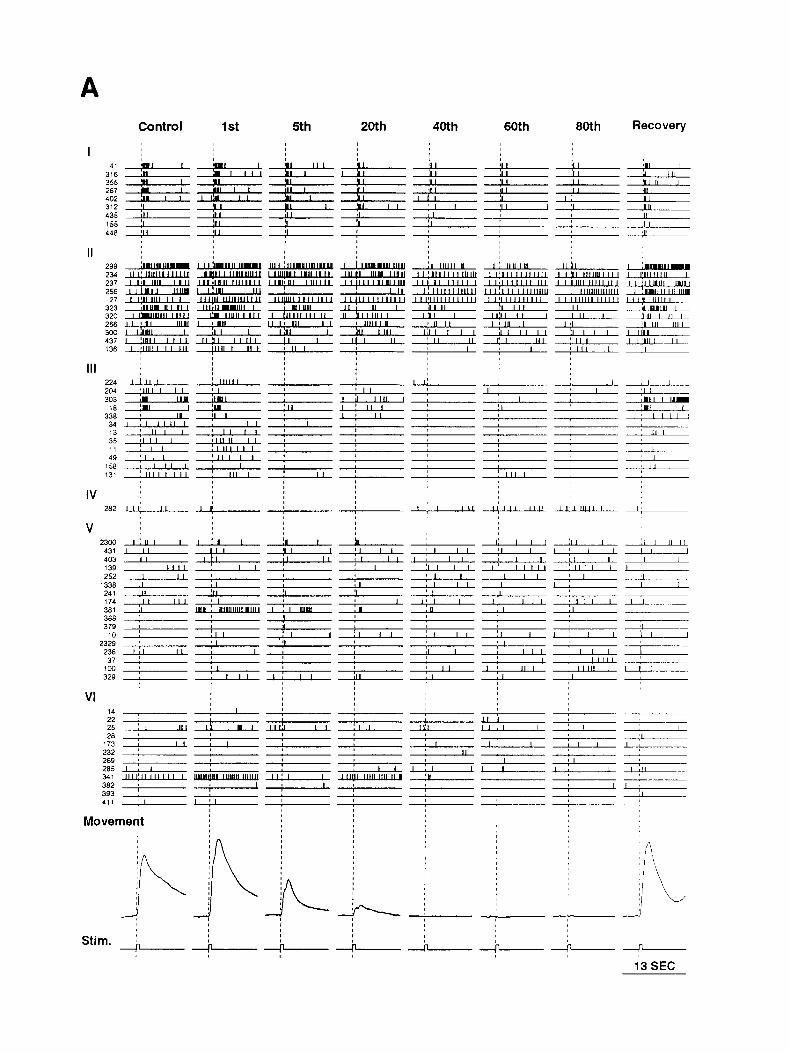
Figure 2. A, Raster diagrams of the action potential activity detected in an Aplysia abdominal ganglion in response to eight presentations of a light touch before, during, and after a habituating procedure. Each line represents one neuron and each vertical tick mark represents an action potential in that neuron. Each vertical pane/ is a 13 set optical recording. Recordings were made during the 1 st, 5th, 20th, 40th, 60th, and 80th habituation trials, during a control trial 15 min before the first habituation stimulus, and during a recovery trial 40 min after the last habituation trial. The cells are arranged into six groups indicated by the roman numerals on the left. The smaN numbers on the left are identification numbers derived from the cell locations on the photodiode array. The gill contractions (bottom) were obtained by measuring the gill area from videotape recordings. The bottom trace shows the current steps that drove the mechanical toucher. The dashed lines indicate the beginning of these current steps. B, Histograms of spike density. Each histogram represents spike counts per 8 12 msec summed over all the neurons of the corresponding groups in A. These histograms are not normalized for the number of neurons in each group.
4076 Falk et al. * Nonuniform Expression of Habituation
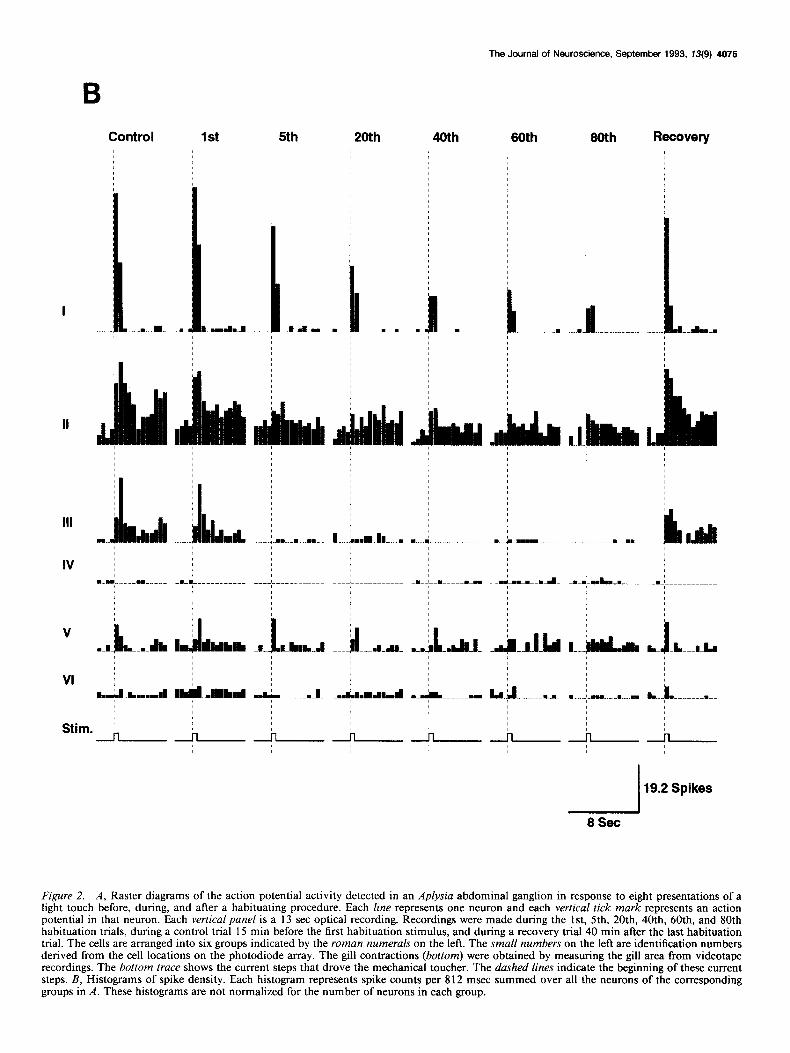
r Group I Neurons
2
w,-Cl ,*Kota, -- Response Pattern
Figure 3. Visualization of the clustering of three groups of neurons from the experiment illustrated in Figure 2 in a two-dimensional plot. Each neuron is plotted as its group number. Although the neurons are not ideally clustered, cells in the three groups are separated. For the x-axis, pooling across all trials, the spike count in the third page (C,, the first 1024 data points after the stimulus) is adjusted for the prestim- ulus spike count (C,,,), the spike count in the first two pages (2048 data points before the stimulus), and normalized by the total spike count (C,,,,,). This measure is sensitive to the response pattern: excited or inhibited, brief or sustained. For the y-axis, R,,IR,- is sensitive to the degree of habituation; R,, is the response of each cell in the habituated trials, and R,. is the response of the same cell in the control and recovery trials. R,, and Rc were calculated as C,,., - C,,,, the spike count in the 2048 data points after the stimulus minus the spike count in the 2048 data points before the stimulus.
behavioral recovery from habituation or obvious bleaching in the optical recording were discarded. There were five experiments in the control set using an IS1 of 15 min-an interval that did not lead to dramatic habituation of the gill withdrawal response. The control experiments were used to test for systematic effects ofthe optical recording procedure in the absence of habituation training.
Results Distinct classes of neurons We first extracted the action potential activity of individual neurons from the signals on the photodiode outputs. Then, with the guidance of cluster analysis, the neurons were divided into six groups based on the temporal pattern of their response across the control and habituation trials. The results for one experiment are displayed as a raster diagram (Fig. 2A) with the groups indicated by the roman numerals on the left. Each vertical panel is a 13 set optical recording. Each horizontal line represents one neuron and each vertical tick mark represents an action potential in that neuron. The magnitude ofgill contraction measured from videotape recordings is shown at the bottom. The effect of ha- bituation on the behavior is clear. The gill contraction is sub- stantially decreased in the fifth habituation trial and has dis- appeared by the 40th trial.
The corresponding spike density histograms of the six groups of neurons for each trial are shown in Figure 2B. These histo-
Stimulation Force / &
1 SEC
Figure 4. Raster diagram of the spike activities of the first four cells in group I from Figure 2. The onset and offset responses of these neurons are most clearly seen after habituation. The lst, 5th, 20th, 60th, and 80th habituation trials are shown. The bottom truce is the stimulus force recorded with a force transducer in series with the mechanical toucher. The dashed vertical lines represent the onset and offset of the current pulse driving the toucher motor controller.
grams emphasize the dramatic differences in response patterns of the six groups. The neurons in group I gave a brief response (mainly at the onset and offset of the stimuli). This response partially habituated and then was maintained at a relatively constant level. Group II consists of cells with a sustained re- sponse to the stimulus. Like group I neurons, the habituation was only partial. The neurons in group III had a similar sus- tained pattern in control trials, but ceased to respond early in the habituation process. Group IV contains the few detected cells (one to three per preparation) whose activity was inhibited by the stimulus. These cells were apparently less inhibited after habituation (see also Fig. 5). Group V includes neurons that were relatively weakly activated by the stimuli and did not fit into one of the first four groups. Cells that did not respond to the stimuli are in group VI.
A quantitative display of the results of clustering can be vi- sualized using a two-dimensional plot (Fig. 3). Since the group- ing was based on the stimulus-response relationship and the effects of habituation, we chose axes representing these features. For the x-axis we chose a parameter that measures the response in the first 1024 data points immediately after the stimulus, adjusted for the prestimulus spike rate and normalized relative to the total amount of spike activity. This parameter is sensitive to the response patterns of the cells. The parameter used for the y-axis measured the degree of habituation. Each neuron from groups I-III of Figure 2 is plotted as a point in Figure 3. Although the neurons are not ideally clustered, cells in the three groups are separated, thereby providing an independent support for the grouping of Figure 2. If group IV-VI neurons were plotted in this figure, group IV neurons would be on the negative side of the x-axis, many in group V and VI would be in the area between
The Journal of Neuroscience, September 1993, f3(9) 4077
Control Habituated Control
42 +
--+--- A182
+
A175
III A173 66 -y---- I 11:
1 II -I-t----
A172
78 J ’ 1: 35 I
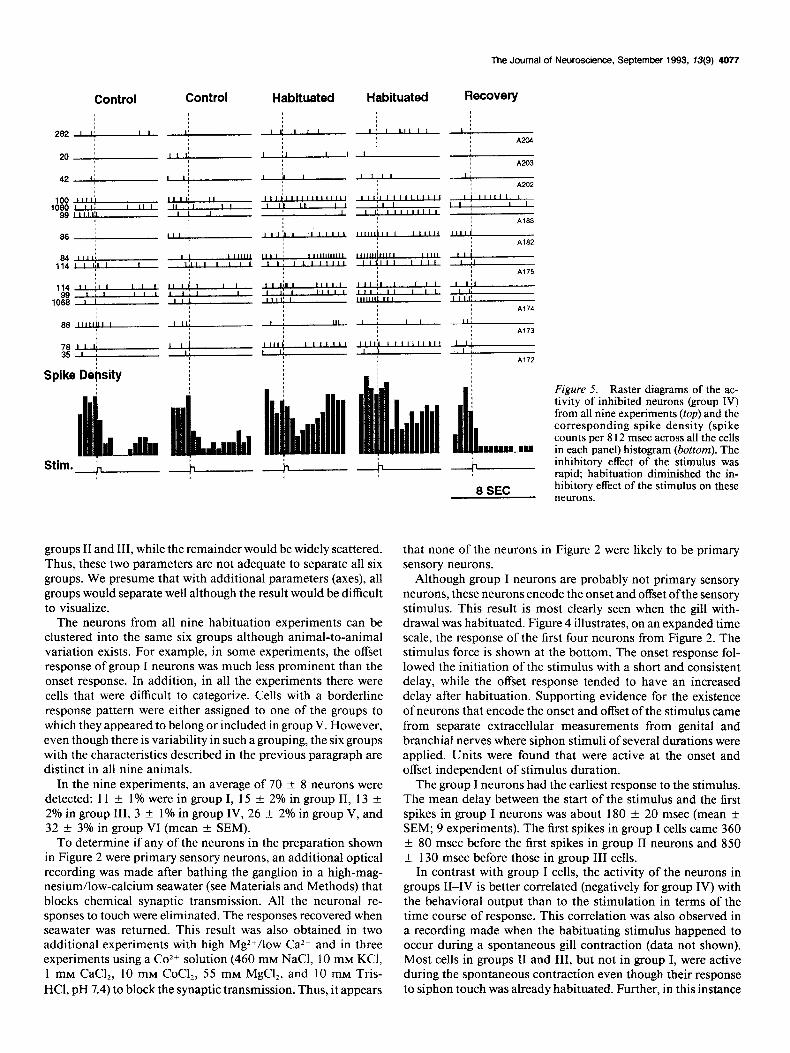
Spike Debsity Figure 5. Raster diagrams of the ac- tivity of inhibited neurons (group IV) from all nine experiments (top) and the corresponding spike density (spike counts per 8 12 msec across all the cells in each panel) histogram (bottom). The inhibitory effect of the stimulus was rapid; habituation diminished the in- hibitory effect of the stimulus on these neurons.
lllll d--dllu IIlL &ulb Stim . L --I----
8 SEC
groups II and III, while the remainder would be widely scattered. Thus, these two parameters are not adequate to separate all six groups. We presume that with additional parameters (axes), all groups would separate well although the result would be difficult to visualize.
The neurons from all nine habituation experiments can be clustered into the same six groups although animal-to-animal variation exists. For example, in some experiments, the offset response of group I neurons was much less prominent than the onset response. In addition, in all the experiments there were cells that were difficult to categorize. Cells with a borderline response pattern were either assigned to one of the groups to which they appeared to belong or included in group V. However, even though there is variability in such a grouping, the six groups with the characteristics described in the previous paragraph are distinct in all nine animals.
In the nine experiments, an average of 70 + 8 neurons were detected: 11 f 1% were in group I, 15 + 2% in group II, 13 f 2% in group III, 3 ? 1% in group IV, 26 f 2% in group V, and 32 -t 3% in group VI (mean + SEM).
To determine if any of the neurons in the preparation shown in Figure 2 were primary sensory neurons, an additional optical recording was made after bathing the ganglion in a high-mag- nesium/low-calcium seawater (see Materials and Methods) that blocks chemical synaptic transmission. All the neuronal re- sponses to touch were eliminated. The responses recovered when seawater was returned. This result was also obtained in two additional experiments with high Mg2+/low Ca2+ and in three experiments using a CoZ+ solution (460 mM NaCl, 10 mM KCl, 1 mM CaCl,, 10 mM CoCl,, 55 mM MgCl,, and 10 mM Tris- HCl, pH 7.4) to block the synaptic transmission. Thus, it appears
that none of the neurons in Figure 2 were likely to be primary sensory neurons.
Although group I neurons are probably not primary sensory neurons, these neurons encode the onset and offset ofthe sensory stimulus. This result is most clearly seen when the gill with- drawal was habituated. Figure 4 illustrates, on an expanded time scale, the response of the first four neurons from Figure 2. The stimulus force is shown at the bottom. The onset response fol- lowed the initiation of the stimulus with a short and consistent delay, while the offset response tended to have an increased delay after habituation. Supporting evidence for the existence of neurons that encode the onset and offset of the stimulus came from separate extracellular measurements from genital and branchial nerves where siphon stimuli of several durations were applied. Units were found that were active at the onset and offset independent of stimulus duration.
The group I neurons had the earliest response to the stimulus. The mean delay between the start of the stimulus and the first spikes in group I neurons was about 180 f 20 msec (mean + SEM; 9 experiments). The first spikes in group I cells came 360 + 80 msec before the first spikes in group II neurons and 850 -t 130 msec before those in group III cells.
In contrast with group I cells, the activity of the neurons in groups II-IV is better correlated (negatively for group IV) with the behavioral output than to the stimulation in terms of the time course of response. This correlation was also observed in a recording made when the habituating stimulus happened to occur during a spontaneous gill contraction (data not shown). Most cells in groups II and III, but not in group I, were active during the spontaneous contraction even though their response to siphon touch was already habituated. Further, in this instance
4078 Falk et al. l Nonuniform Expression of Habituation
% z 1.0
i?
2 0.8
wp N 0.8 i
iii K 0.4
P
0.2
0
t Habituation Experiments Gill Contraotlons (Habituation)
l Control Experiments
CONTROL TRIAL NUMBER 5 10
. C 1st 20th 40th 60th 80th Rl R2
HABITUATION TRIAL NUMBER
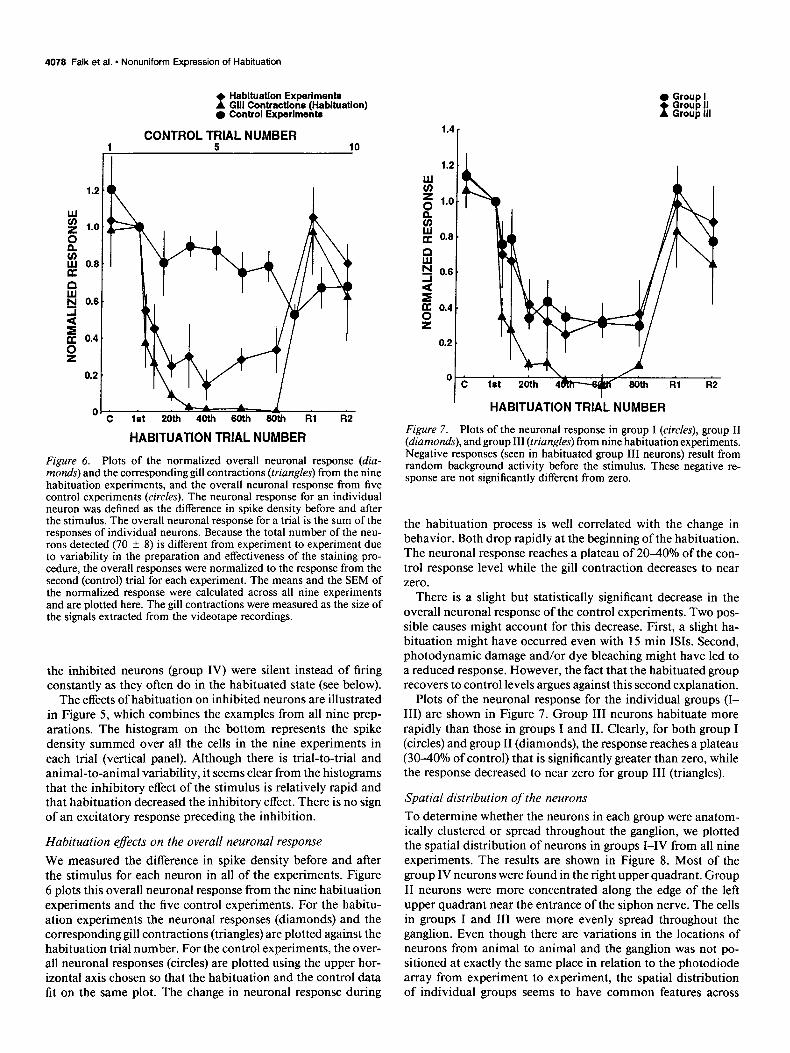
Figure 6. Plots of the normalized overall neuronal response (diu- mends) and the corresponding gill contractions (triangles) from the nine habituation experiments, and the overall neuronal response from five control experiments (circles). The neuronal response for an individual neuron was defined as the difference in spike density before and after the stimulus. The overall neuronal response for a trial is the sum of the responses of individual neurons. Because the total number of the neu- rons detected (70 f 8) is different from experiment to experiment due to variability in the preparation and effectiveness of the staining pro- cedure, the overall responses were normalized to the response from the second (control) trial for each experiment. The means and the SEM of the normalized response were calculated across all nine experiments and are plotted here. The gill contractions were measured as the size of the signals extracted from the videotape recordings.
the inhibited neurons (group IV) were silent instead of firing constantly as they often do in the habituated state (see below).
The effects of habituation on inhibited neurons are illustrated in Figure 5, which combines the examples from all nine prep- arations. The histogram on the bottom represents the spike density summed over all the cells in the nine experiments in each trial (vertical panel). Although there is trial-to-trial and animal-to-animal variability, it seems clear from the histograms that the inhibitory effect of the stimulus is relatively rapid and that habituation decreased the inhibitory effect. There is no sign of an excitatory response preceding the inhibition.
Habituation effects on the overall neuronal response We measured the difference in spike density before and after the stimulus for each neuron in all of the experiments. Figure 6 plots this overall neuronal response from the nine habituation experiments and the five control experiments. For the habitu- ation experiments the neuronal responses (diamonds) and the corresponding gill contractions (triangles) are plotted against the habituation trial number. For the control experiments, the over- all neuronal responses (circles) are plotted using the upper hor- izontal axis chosen so that the habituation and the control data fit on the same plot. The change in neuronal response during
0 Group I t 8:::; !I,
1.2
ti g 1.0.
k $ 0.8.
3 !i
i
0.6 .
E
2
0.4.
0.2 ’
OC \. /
1st 20th 4 80th RI R2
HABITUATION TRIAL NUMBER
Figure 7. Plots of the neuronal response in group I (circles), group II (diamonds), and group III (triangles) from nine habituation experiments. Negative responses (seen in habituated group III neurons) result from random background activity before the stimulus. These negative re- sponse are not significantly different from zero.
the habituation process is well correlated with the change in behavior. Both drop rapidly at the beginning of the habituation. The neuronal response reaches a plateau of 2040% of the con- trol response level while the gill contraction decreases to near zero.
There is a slight but statistically significant decrease in the overall neuronal response of the control experiments. Two pos- sible causes might account for this decrease. First, a slight ha- bituation might have occurred even with 15 min ISIS. Second, photodynamic damage and/or dye bleaching might have led to a reduced response. However, the fact that the habituated group recovers to control levels argues against this second explanation.
Plots of the neuronal response for the individual groups (I- III) are shown in Figure 7. Group III neurons habituate more rapidly than those in groups I and II. Clearly, for both group I (circles) and group II (diamonds), the response reaches a plateau (30-40% of control) that is significantly greater than zero, while the response decreased to near zero for group III (triangles).
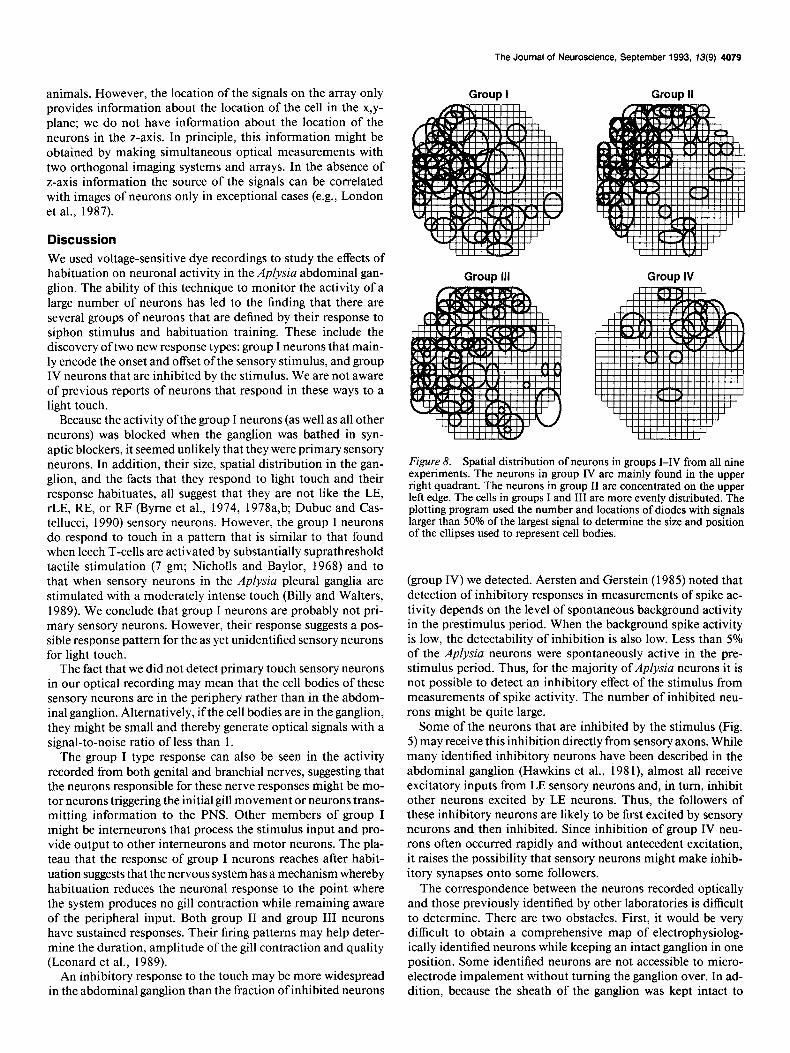
Spatial distribution of the neurons To determine whether the neurons in each group were anatom- ically clustered or spread throughout the ganglion, we plotted the spatial distribution of neurons in groups I-IV from all nine experiments. The results are shown in Figure 8. Most of the group IV neurons were found in the right upper quadrant. Group II neurons were more concentrated along the edge of the left upper quadrant near the entrance of the siphon nerve. The cells in groups I and III were more evenly spread throughout the ganglion. Even though there are variations in the locations of neurons from animal to animal and the ganglion was not po- sitioned at exactly the same place in relation to the photodiode array from experiment to experiment, the spatial distribution of individual groups seems to have common features across
The Journal of Neuroscience, September 1993, 13(9) 4079
animals. However, the location of the signals on the array only provides information about the location of the cell in the x,y- plane; we do not have information about the location of the neurons in the z-axis. In principle, this information might be obtained by making simultaneous optical measurements with two orthogonal imaging systems and arrays. In the absence of z-axis information the source of the signals can be correlated with images of neurons only in exceptional cases (e.g., London et al., 1987).
Discussion We used voltage-sensitive dye recordings to study the effects of habituation on neuronal activity in the Aplysia abdominal gan- glion. The ability of this technique to monitor the activity of a large number of neurons has led to the finding that there are several groups of neurons that are defined by their response to siphon stimulus and habituation training. These include the discovery of two new response types: group I neurons that main- ly encode the onset and offset of the sensory stimulus, and group IV neurons that are inhibited by the stimulus. We are not aware of previous reports of neurons that respond in these ways to a light touch.
Because the activity of the group I neurons (as well as all other neurons) was blocked when the ganglion was bathed in syn- aptic blockers, it seemed unlikely that they were primary sensory neurons. In addition, their size, spatial distribution in the gan- glion, and the facts that they respond to light touch and their response habituates, all suggest that they are not like the LE, rLE, RE, or RF (Byrne et al., 1974, 1978a,b; Dubuc and Cas- tellucci, 1990) sensory neurons. However, the group I neurons do respond to touch in a pattern that is similar to that found when leech T-cells are activated by substantially suprathreshold tactile stimulation (7 gm; Nicholls and Baylor, 1968) and to that when sensory neurons in the Apfysia pleural ganglia are stimulated with a moderately intense touch (Billy and Walters, 1989). We conclude that group I neurons are probably not pri- mary sensory neurons. However, their response suggests a pos- sible response pattern for the as yet unidentified sensory neurons for light touch.
The fact that we did not detect primary touch sensory neurons in our optical recording may mean that the cell bodies of these sensory neurons are in the periphery rather than in the abdom- inal ganglion. Alternatively, if the cell bodies are in the ganglion, they might be small and thereby generate optical signals with a signal-to-noise ratio of less than 1.
The group I type response can also be seen in the activity recorded from both genital and branchial nerves, suggesting that the neurons responsible for these nerve responses might be mo- tor neurons triggering the initial gill movement or neurons trans- mitting information to the PNS. Other members of group I might be interneurons that process the stimulus input and pro- vide output to other interneurons and motor neurons. The pla- teau that the response of group I neurons reaches after habit- uation suggests that the nervous system has a mechanism whereby habituation reduces the neuronal response to the point where the system produces no gill contraction while remaining aware of the peripheral input. Both group II and group III neurons have sustained responses. Their firing patterns may help deter- mine the duration, amplitude of the gill contraction and quality (Leonard et al., 1989).
An inhibitory response to the touch may be more widespread in the abdominal ganglion than the fraction of inhibited neurons
Group I Group II
Group Ill Group IV
Figure 8. Spatial distribution of neurons in groups I-IV from all nine experiments. The neurons in group IV are mainly found in the upper right quadrant. The neurons in group II are concentrated on the upper left edge. The cells in groups I and III are more evenly distributed. The plotting program used the number and locations of diodes with signals larger than 50% of the largest signal to determine the size and position of the ellipses used to represent cell bodies.
(group IV) we detected. Aersten and Gerstein (1985) noted that detection of inhibitory responses in measurements of spike ac- tivity depends on the level of spontaneous background activity in the prestimulus period. When the background spike activity is low, the detectability of inhibition is also low. Less than 5% of the Aplysia neurons were spontaneously active in the pre- stimulus period. Thus, for the majority of Apfysia neurons it is not possible to detect an inhibitory effect of the stimulus from measurements of spike activity. The number of inhibited neu- rons might be quite large.
Some of the neurons that are inhibited by the stimulus (Fig. 5) may receive this inhibition directly from sensory axons. While many identified inhibitory neurons have been described in the abdominal ganglion (Hawkins et al., 198 l), almost all receive excitatory inputs from LE sensory neurons and, in turn, inhibit other neurons excited by LE neurons. Thus, the followers of these inhibitory neurons are likely to be first excited by sensory neurons and then inhibited. Since inhibition of group IV neu- rons often occurred rapidly and without antecedent excitation, it raises the possibility that sensory neurons might make inhib- itory synapses onto some followers.
The correspondence between the neurons recorded optically and those previously identified by other laboratories is difficult to determine. There are two obstacles. First, it would be very difficult to obtain a comprehensive map of electrophysiolog- ically identified neurons while keeping an intact ganglion in one position. Some identified neurons are not accessible to micro- electrode impalement without turning the ganglion over. In ad- dition, because the sheath of the ganglion was kept intact to
4080 Falk et al. * Nonuniform Expression of Habituation
avoid damage to neurons, it was impossible to impale identified cells other than those in the outermost layer. Second, except for a small number of very large neurons, it is not easy to attribute neurons detected in optical recordings to neurons in a photo- graph of the ganglion. The photograph only has clear images of the neurons on the top surface of the ganglion while the optical recordings detect neurons throughout the thickness of the gan- glion (Salzberg et al., 1977). While the optical recordings provide information about neuron positions in the x,y-plane (object plane of the microscope), there is no information about neuron po- sition in the z-axis (dorsal-ventral axis in these experiments) from individual trials. This information might be obtained from repeated optical recordings at several focal positions, but trial- to-trial variability (Wu et al., 1989; Wu, Tsau, Cohen, Tang, Falk, and Hopp, unpublished observations) would complicate the interpretation. Although simultaneous optical and micro- electrode recordings have been made from intact leech (Salzberg et al., 1973) and barnacle (Salzberg et al., 1977) ganglia, and also from trypsin- treated Aplysia ganglia (Wu, Tsau, Cohen, Tang, Falk, and Hopp, unpublished observations), an extensive comparison of previously identified neurons and those recorded optically would not be easily achieved.
Nevertheless, our results indicate that the response to habit- uation in the neurons of the Aplysia abdominal. ganglion is far from simple. Both group I and group II neurons maintain a relatively constant response, while the response level of group III neurons decreases to near zero after habituation. Although a decrease in response is found in all three groups, there are differences in the rate of decrease and the plateau of their final response level. It is possible that the diverse expression of ha- bituation can be explained by a simple decrement in synaptic efficacy of the sensory neurons and/or differences in channel type and density among the postsynaptic neurons. The diverse expression of habituation, however, also raises the possibility that several synaptic mechanisms are involved.
While our results show that the activity of many neurons is affected by habituation, they provide no information about which neurons are causally related to the gill withdrawal or its plas- ticity. On one hand, it is possible that there is a dedicated circuit in the abdominal ganglion that is specific for the gill withdrawal reflex. A number of gill motor neurons and interneurons that synapse on them have been identified (Hawkins et al., 198 1; Frost et al., 1988), but the sensory neurons responsible for the response to a light touch have not been identified and there may be additional interneurons as well. On the other hand, it is possible that the gill withdrawal reflex and its habituation are controlled coordinately along with other behaviors by a dis- tributed network (Kien et al., 1992). Many neurons are activated by a light touch that elicits the gill withdrawal reflex (Zecevic et al., 1989; Nakashima et al., 1992). Furthermore, a study of the relationship of the evoked gill withdrawal reflex and the spontaneous gill contraction revealed that there was more than 70% overlap in the neuronal populations for the two behaviors (Wu et al., 1991). These results support the notion that a dis- tributed network might generate the gill withdrawal reflex. In that case, a large fraction ofthe optically recorded neurons would be participants in the reflex and its habituation.
References Aersten ADMH, Gerstein CL (1985) Evaluation of neuronal connec-
tivity: sensitivity of cross-correlation. Brain Res 340:341-354. Bailey CH, Chen M (1988) Morphological basis of short-term habit-
uation in Aplysia. J Neurosci 812452-2459.
Billy AJ, Walters ET (1989) Long-term expansion and sensitization of mechanosensory receptive fields in Aplysia support an activity- dependent model of whole-cell sensory plasticity. J Neurosci 9: 1254- 1262.
Byrne JH (1982) Analysis of synaptic depression contributing to ha- bituation of gill-withdrawal reflex in Aplysia californica. J Neuro- physiol48:43 l-438.
Byrne J, Castellucci V, Kandel ER (1974) Receptive fields and re- sponse properties of mechanoreceptor neurons innervating siphon skin and mantle shelf in Aplysia. J Neurophysiol 37: 1041-1064.
Byrne JH, Castellucci VF, Carew TJ, Kandel ER (1978a) Stimulus- response relations and stability of mechanoreceptor and motor neu- rons mediating defensive gill-withdrawal reflex in Aplysia. J Neuro- physio14 1:402-4 17.
Byrne JH, Castellucci VF, Kandel ER (1978b) Contribution of indi- vidual mechanoreceptor sensory neurons to defensive gill-withdrawal reflex in Aplysia. J Neurophysio14 1:4 1843 1.
Cash D, Carew TJ (1989) A quantitative analysis of the development of the central nervous system in juvenile Aplysia californica. J Neu- robiol 20:25-47.
Castellucci V, Pinsker H, Kupfermann I, Kandel ER (1970) Neuronal mechanisms of habituation and dishabituation of the gill-withdrawal reflex in Aplysia. Science 167: 1745-1748.
Coggeshall RE (1967) A light and electron microscope study of the abdominal ganglion of Aplysia calijbrnica. J Neurophysiol 30: 1263- 1287.
Cohen TE, Henzi V, Kandel ER, Hawkins RD (1991) Further be- havioral and cellular studies of dishabituation and sensitization in Aplysia. Sot Neurosci Abstr 17: 1302.
Dubuc B, Castellucci VF (1990) Receptive fields and properties of a new cluster of mechanoreceptor neurons innervating the mantle re- gion and the branchial cavity of the marine mollusk Aplysia Cal&w- nica. Sot Neurosci Abstr 16~399.
Dudai Y (1989) The neurobiology of memory, pp 49-76. New York: Oxford UP.
Everitt B (1974) Cluster analysis. London: Cox and Wyman. Falk CX, Wu JY, Cohen LB (199 1) Effects of habituation on neuronal
activity in the Aplysia abdominal ganglion during the gill-withdrawal reflex. Sot Neurosci Abstr 17:548.
Falk CX, Wu J-Y, Cohen LB, Tang AC, Tsau Y (1992) A study of neuronal response in Aplysia abdominal ganglion during habituation of the gill withdrawal reflex. Sot Neurosci Abstr 18:94 1.
Frost WI?, Clark GA, Kandel ER (1988) Parallel processing of short- term memory for sensitization in Apljsia. J Neuiobiol 19:297-334.
Goldberg JI. Lukowiak K (1984) Transfer of habituation in Advsia: contributibn of heterosynaptic’pathways in habituation of tge’gill- withdrawal reflex. J Neurobiol 15:3954 11.
Grinvald A, Manker AA, Segal M (1982) Visualization of the spread of electrical activitv in rat hiDDOCamDa1 slices bv voltage sensitive optical probes. J Physiol (Land) 333:i69-291. _ -
Hawkins RD. Castellucci VF. Kandel ER (198 1) Interneurons in- volved in mediation and modulation of thd gill-hithdrawal reflex in Aplysia. I. Identification and characterization. J Neurophysiol 45: 304-3 14.
Kien J, McCrohan CR, Winlow W, eds (1992) Neurobiology of motor programme selection. Oxford: Pergamon.
Kupfermann I, Castellucci V, Pinsker H, Kandel ER (1970) Neuronal correlates of habituation and dishabituation of the gill-withdrawal reflex in Aplysia. Science 167: 1743-l 745.
Kupfermann I, Pinsker H, Castellucci V, Kandel ER (1971) Central and peripheral control of gill movements in Aplysia. Science 174: 1252-1256.
Leonard JL, Edstrom J, Lukowiak K (1989) Reexamination of the gill withdrawal reflex of Aplysia californica Cooper (Gastropoda; O&- thobranchia). Behav Neurosci 103:585-604.
London JA, &cevic D, Cohen LB (1987) Simultaneous optical re- cording of activity from many neurons during feeding in Navanax. J Neurosci 7:649-66 1.
Lukowiak K (1978) L9 modulation of gill withdrawal reflex habitu- ation in Aulvsia. J Neurobiol 10:255-27 1.
Nakashima M, Yamada S, Shiono S, Maeda M, Satoh F (1992) 448-detector optical recording system: development and application to Aplysia gill-withdrawal reflex. IEEE Trans Biomed Eng 39:26-36.
Nicholls JG, Baylor DA (1968) Specific modalities and receptive fields of sensory neurons in the CNS of the leech. J Neurophysio13 1:740- 756.

The Journal of Neuroscience. September 1993, U(9) 4081
Pinsker H, Kupfermann I, Castellucci V, Kandel ER (1970) Habitu- ation and dishabituation of the gill-withdrawal reflex in Aplysiu. Sci- ence 167:1740-1742.
Salzberg BM, Davila HV, Cohen LB (1973) Optical recording of im- pulses in individual neurons of an invertebrate central nervous sys- tem. Nature 246508-509.
Salzbcrg BM, Grinvald A, Cohen LB, Davila HV, Ross WN (1977) Optical recording of neuronal activity in an invertebrate central ner- vous system: simultaneous monitoring of several neurons. J Neuro- physiol 40: I28 l-l 29 1.
Trudeau LE, Castellucci VF (1992) Contribution ofpolysynaptic path- ways in the mediation and plasticity of Aplysia gill and siphon with- drnwal reflex: evidence for differential modulation. J Neurosci 12: 3838-3848.
WU JY, Cohen LB (1993) Fast multisite optical measurement ofmem- brane potential. In: Fluorescent probes for biological function ofliving cells-a practical guide (Mason WT, ed), in press. London: Academic.
Wu JY, Falk CX, Hopp H-P, Cohen LB (I 989) Trial-to-trial variability in the neuronal response to siphon touch in the Aplysiu abdominal ganglion. Sot Ncurosci Abstr 15: 1264.
Wu JY, Cohen LB, Falk CX (199 I) Comparison of neuronal activity in the Aplysiu abdominal ganglion during respiratory pumping and the gill-withdrawal reflex. Sot Neurosci Abstr 17:549.
Zecevic D, Wu J-Y, Cohen LB, London JA, Hopp H-P, Falk CX (1989) Hundreds of neurons in the Aplysia abdominal ganglion are active during the gill-withdrawal reflex. J Neurosci 9:368 l-3689.