Embed Size (px)
Citation preview

1
Norfolk & Suffolk NHS Foundation Trust
Strategic Plan 2014-19

2
Name Leigh Howlett
Job Title Commercial Director
e-mail address
Tel. no. for contact
01603 421150
Date 30th June 2014
Name
(Chair)
Gary E Page Signature
Name
(Chief Executive)
Michael Scott Signature
Name
(Finance Director and
Deputy Chief Executive)
Andrew Hopkins Signature
In signing below, the Trust is confirming that:• The Strategic Plan is an accurate reflection of the current shared vision and strategy of the Trust Board
having had regard to the views of the Council of Governors;• The Strategic Plan has been subject to at least the same level of Trust Board scrutiny as any of the
Trust’s other internal business and strategy plans;• The Strategic Plan is consistent with the Trust’s internal operational plans and provides a comprehensive
overview of all key factors relevant to the delivery of these plans; • All plans discussed and any numbers quoted in the Strategic Plan directly relate to the Trust’s financial
template submission; and• The ‘declaration of sustainability’ is true to the best of its knowledge.
Strategic Plan for y/e 31 March 2015 to 2019This document completed by (and Monitor queries to be directed to):
Approved on behalf of the Board of Directors by:
Approved on behalf of the Board of Directors by:
Approved on behalf of the Board of Directors by:

3
Contents
Page number
Executive Summary 4
Declaration on Sustainability 5
Market Analysis and Context 6
Sustainability and Strategic Options 24
Strategic plans 26
Financial plans 44
Appendices
Appendix 1 Engagement outcomes
Appendix 2 Vision, Values, 2014/15 Objectives

4
Executive Summary
The Norfolk and Suffolk NHS Foundation Trust (NSFT) Strategic Plan 2014/19 sets out the strategic framework the next 5 years from which further operational plans will be developed. The contents of this document, which build on existing schemes and the current two year operational plan, have been widely shared and influenced by seven engagement events for service users, carers, staff, partners, commissioners and the public. It was approved at the June 2014 public Board meeting.
It is widely recognised that the NHS is facing an unprecedented set of challenges. The national financial recession has led to a year on year real terms funding reduction of 4 - 5% since 2010/11. For NSFT this means a budget of £204.3m in 2014/15 is predicted to reduce to £193.6m by 2018/19 with a resultant need for cost improvements of £44.1m anticipated to maintain financial sustainability.
Public expectations of NHS services are rising; however this is set against a background of less funding, increasing demand, competition with the NHS market alongside a national integration agenda. This is placing significant financial and commercial pressure on NHS Trusts to deliver safe, effective services whilst maintaining and securing funding levels.
Locally, NSFT is predicting an average yearly growth of 4.4% in referral rates for mental health services (a proxy for overall demand), with changes in local demographics a key driver as above UK average increases in population for ages 60 plus are expected for both Norfolk and Suffolk.
The current government policy and direction is placing heightened importance on integration across local health and social care communities. At the same time, but in a competitive context, NHS providers are moving towards greater independence than ever before. Therefore integration relies on commissioners commissioning and contracting in such a way that integration rather than competition and competitive behaviour is rewarded. The role of the Health and Wellbeing Board to support integrated governance forums covering local health and social care provision will be essential to align priorities and drive synergies across the local economy.
The Parity of Esteem agenda is seeking to increase the equity of mental health compared to physical health in terms of funding and public understanding. Locally, mental health receives circa 10% of Clinical Commissioning Group budgets as compared to circa 45% for secondary care.
This strategic plan sets out analysed demographics and demand data, workforce and estates information, and local commissioning intentions. These have been used to determine a series of strategic options open to the Trust. The preferred option focuses on the Trust delivering sustainable mental health services within Norfolk and Suffolk whilst driving greater integration and collaboration across the wider health and social care economy.

5
Declaration of Sustainability
Sustainability and Strategic
OptionsMarket Analysis and ContextDeclaration of Sustainability Strategic Plans Financial Overview
The board declares that, on the basis of the plans as set out in this document, the Trust will be financially, operationally and clinically sustainable according to current regulatory standards in one, three and five years’ time.
Confirmed

6
• National and local
demographics
• National and local
trends for mental
health
• Local Health
Economy
Assessment
• Define and Review
Vision
• Impact assessment
of options
• Assess Business
Model
• Based on the Value
discipline approach
• Competitor analysis
• Define the
operating model:
• Based on
Performance
Management,
Organisation,
Capabilities,
Information,
Technology,
Culture and Values
Analysis on:
• Workforce
• Location
• Beds
• Assessment of
Service Lines• Identify potential
Efficiency &
Productivity
Improvements
• Develop 5 Year
Forecasts
MARKET ANALYSIS
STRATEGIC OPTIONS
TARGET OPERATING MODEL
CAPABILITY AND CAPACITY
FINANCIAL POSITION
ApproachThe Trust adopted the following approach in developing the 5 year strategic plan.
1. Develop 5 Year Strategic Plan for NSFT ensuring Sustainability
2. Determine NSFT’s Future Business and Operating Model
1. Develop 5 Year Strategic Plan for NSFT ensuring Sustainability
2. Determine NSFT’s Future Business and Operating Model
Sustainability and Strategic
OptionsMarket Analysis and ContextDeclaration of Sustainability Strategic Plans Financial Overview

7
National Policy and Context
The NHS is facing an unprecedented set of challenges. The widespread financial recession has led to a year on year real terms funding reduction of 4 - 5% since 2010/11. Some of the latest projections from the Nuffield Trust and NHS England suggest that the funding gap will grow to £30 billion a year by 2021. Nationally and locally, measured action will need to be taken to maintain a sustainable financial position. In addition, the most recent NHS re-structures and increased emphasis on competition has led to extra pressure on NHSTrusts with the potential loss of business.
The Parity of Esteem agenda is increasing and, locally, mental health receives circa 10% of CCG budgets as compared to circa 45% for secondary care, against a background of predicted average growth of 4.4% in referral rates and local population increases in ages 65 plus of in both Norfolk and Suffolk.
The current government policy and direction is placing heightened importance on integration across local health and social care communities. At the same time, but in a competitive context , NHS providers are moving towards greater independence than ever before. Therefore integration relies on commissioners commissioning and contracting in such a way that integration rather than competition and competitive behaviours is rewarded. Indeed commissioners are increasingly looking to contract with providers that can demonstrate partnership working and integrated services covering whole patient pathways rather than just isolated aspects of thepathways.
Commissioners are also being encouraged to expand the number of providers in the NHS market place to create a more competitive health economy. This is in keeping with the shift from NHS-provided, to NHS-funded, care. However, it places financial and commercial pressure on NHS Trusts and presents challenges in maintaining funding levels.
Within the NSFT health economy there are 7 CCGs each of which has different mental health priorities and commissioning approachesfor issues such as dementia. However this will provide significant challenge for the Trust and health and social care economy in delivering efficiencies either in service provision or financial savings.
Additionally, demand for services, a national push on patient choice, and, public expectations of NHS services are rising. There is a significant risk that the rise in public/service user demands could diverge from the commissioning or funding intentions of Clinical Commissioning Groups (CCGs).
The Trust has conducted engagement events across the two counties it serves, inviting service users, carers, commissioners, key stakeholders, the public and staff. These have been well received and have influenced the development of this plan. The outcomes are noted in Appendix 1.
The national moves towards mental health payment systems has slowed with clustering having been implemented for some time but limited progress having been made on other aspects . This means that the majority of Trusts, including NSFT, have not moved from block contracts. This adds significantly to the financial pressure on mental health NHS providers at a time when demand for our services is increasing.
Sustainability and Strategic
OptionsMarket Analysis and ContextDeclaration of Sustainability Strategic Plans Financial Overview

8
Nationally society is ageing. Compared to 2010, by 2030 there will be 51 per cent more people aged 65 and over, and a doubling of the numbers of people aged 85 and over in England.
By 2030, one in five people in England will be over 65 (House of Lords 2013). For Norfolk and Suffolk this population will grow from 372,000 (2014) to 411,000 by 2019.
One of the more common mental disorders is Dementia; currently one in six people over 80 has a form of dementia and this is one in 14 for people over 65, costing the UK over £17 billion per year. The total number of people with dementia in the UK is forecast to increase to 940,110 by 2021 and 1,735,087 by 2051, an increase of 154%.
The accompanying graph shows the this increasing trend focusing on people aged 65 and above.
A high proportion of people with dementia need some care, ranging from support with activities of daily living, to full personal care and round-the-clock supervision.
This is a cohort of the population which both Norfolk and Suffolk will see an above UK average increase over the lifetime of this strategy.
In addition, evidence points to prevalence rates of common mental health disorders rising over time. The 2007 adult psychiatric morbidity survey found that the proportion of the English population aged between 16 and 64 meeting the criteria for one common mental disorder increased from 15.5 per cent in 1993 to 17.6 per cent in 2007.
Source: Alzheimer’s Society – UK Dementia Report
Projected increases in the number of people with dementia in the
UK, by age group (2005– 2051)
~30% IncreaseFrom year 2014 to
2024
National mental health trends
Market Analysis and ContextDeclaration of Sustainability Strategic PlansSustainability and Strategic
OptionsFinancial Overview
Source © The Mental Health Network

9
Depression is predicted to be the second leading cause of global disability burden by 2020, currently affecting between 8-12% of the UK population in any year.
The Health & Social Care Information Centre states that amongst statutory NHS providers, the 2012/13 data shows an 8.7 per cent increase in the number of inpatients being detained under the Mental Health Act during the year. This suggests a continuing trend for psychiatric beds to be increasingly occupied by people subject to some form of legal restriction.
In 2004, the Office for National Statistics estimated that one in ten children and young people between the ages of five and 16 had a clinically diagnosed mental health disorder.
Unmet need is already high. The London School of Economics and Political Science recently estimated that just a quarter of people with mental health problems currently receive any treatment
Source © The Mental Health Network
There were nearly 1.6 million (1,590,332) people in contact with specialist mental health services in 2012/13 . With over 21.7 million outpatient and community contacts across England. (NSFT had over 736,000 contacts in 2013/14).
Market Analysis and ContextDeclaration of Sustainability Strategic PlansSustainability and Strategic
OptionsFinancial Overview
National mental health trends

10Source: © The King’s Fund 2012
According to one projection model, the number of people aged 65 and over in England with care needs, such as difficulty in washing and dressing, will grow from approximately 2.5 million in 2010 to 4.1 million in 2030, an increase of 61 per cent (Wittenberg et al 2011).
Between 2010 and 2030, it is estimated that the number of younger adults with learning disabilities (aged 18–64) will rise by 32.2 per cent from around 220,000 to around 290,000, and the number of younger adults with physical or sensory impairment by 7.5 per cent from almost 2,900,000 to 3,100,000 (Snell et al 2011).
Patient and public expectations are rising. Increasingly, patients and service users expect health and social care services to be like other service industries and are willing to do more for themselves and interact with services via technology. They expect to be offered choice and variety and to experience services that are convenient, personalised and provided in modern buildings and healing environments.
Market Analysis and ContextDeclaration of Sustainability Strategic PlansSustainability and Strategic
OptionsFinancial Overview
National mental health trends
People with long-term conditions account for around 64 per cent of outpatient appointments and 70 per cent of hospital bed days (Department of Health 2012). Around 70 per cent of total health and care expenditure in England is attributed to people with long-term conditions (Department of Health 2012).
People diagnosed with a number of long-term conditions are the most intensive users of health and social care services because their needs are usually more complex than those of people with single diseases. Most people aged 65 and over have multi-morbidity, indicating its implications for the population as a whole (Barnett et al 2012). Multi-morbidity increases with deprivation. The likelihood of having a mental health problem increases as the number of physical morbidities a person has also increases.

11
13%7%
3%1%
6%-2%
Overview of UK demographic trendsThe UK population aged between “60-74” and “75 and over”, have the most growth over the nextdecade. This signifies UK’s ageing society, due to the 1960’s baby boom and increasing longevity.The data below is based on the ONS - 2012 population projections.
0
2,000
4,000
6,000
8,000
10,000
12,000
14,000
16,000
2012 2013 2014 2015 2016 2017 2018 2019 2020 2021 2022 2023 2024 2025 2026 2027 2028 2029 2030
Popula
tion (
000's
)
0-14
15-29
30-44
45-59
60-74
75 & over
7%
13%
36%
13%
75 & over60-7445-5930-4415-29
0-14
Projected UK population growth rates (2014-19)
-5% 0% 5% 10% 15%
• Largest growth seen in people aged 75 and over, with a future 5 year growth of
13% and a 10 year growth of 36%.
• The only age group that is projected to show a declining growth is the 15-29 age
group.
• In overall terms, the UK population is expected to increase by 2.2million people
from 2014 to 2019, an increase in growth of 3.4%, following a lower growth rate
increase of 3.1% from 2019-24.
UK population projection1
Source: 1. ONS – 2012 based Population Projections
Risk to Sustainability and
Strategic OptionsMarket Analysis and Context
Declaration and
SustainabilityStrategic Plans
Supporting Financial
Information

12
0
10
20
30
40
50
60-74 75+ 60-74 75+Po
pu
lati
on
% i
ncre
ase
co
mp
are
d t
o 2
014
Age (Years)
2019
2024
Overview of local demographic trendsThe population of most age groups across Norfolk and Suffolk is increasing, apart from those aged 15-29 and 45-59. The largest population growth is for those aged 75 and over. The data below is based on the ONS - 2012 population projections.
Source: 1. ONS – 2012 based Population Projections
Norfolk population projection1 Suffolk population projection1
Norfolk and Suffolk UK
Population % increase comparisonbetween Norfolk & Suffolk and UK*
*population increase compared to a 2014 baseline comparison
The projected population growth from 2014 to 2019 for those aged
75+ in Norfolk and Suffolk is 14%, compared to a 13% growth for
UK. Therefore the population growth is approximately the same
for Norfolk and Suffolk as in the UK. However, by 2024, the
population increase (compared to 2014) in Norfolk and Suffolk for
people aged 75 plus is far greater at 41% compared to 36% in the
UK.
5%8%
14%
41%
7%13% 13%
36%
Market Analysis and ContextDeclaration of Sustainability Strategic PlansSustainability and Strategic
OptionsFinancial Overview
0 50 100 150 200
0-14
15-29
30-44
45-59
60-74
75+
Population (000's)
Ag
e (
Years
)
2024
2019
2014
0 50 100 150 200
0-14
15-29
30-44
45-59
60-74
75+
Population (000's)
Ag
e (
Years
)
2024
2019
2014

13
UK versus Norfolk bulge trendingNorfolk has a larger population percentage aged 58 and above compared to England. The key bulge occurs at 67 years old, where in Norfolk this equates to 1.7% of the total population compared to 1.3% of the total population in England.
From the 2014 population projection
diagrams, Norfolk has a higher population
percentage of those aged 58 and above
compared to England as a whole (seen from
the overlay outline). A decade later (in 2024)
this changes where the age range increases
to where those aged 55 years and above
have a higher population percentage in
Norfolk compared to England. This illustrates,
over the next 10 years, Norfolk will have a
higher population of older people compared to
nationally.
The key bulges (highlighted in red) signify that
those aged 67 years old, form the largest
proportion of Norfolk’s old age community –
forming 1.7% of Norfolk's total population,
compared to 1.3% to that nationally
(England).
This trend is the same as the Suffolk bulge
diagrams.
Source: 1. ONS – 2012 Population Projections
20
24
20
14
Market Analysis and ContextDeclaration of Sustainability Strategic PlansSustainability and Strategic
OptionsFinancial Overview
England1 Norfolk1Overlay

14
UK versus Suffolk bulge trendingSuffolk has a larger population percentage aged 55 and above compared to England. The key bulge occurs at 67 years old, where in Suffolk this equates to 1.7% of the total population against 1.3% of the total population in England.
Source: 1. ONS – 2012 Population Projections
20
24
20
14
Market Analysis and ContextDeclaration of Sustainability Strategic PlansSustainability and Strategic
OptionsFinancial Overview
England1 Suffolk1Overlay
From the 2014 population projection
diagrams, Suffolk has a higher population
percentage of those aged 55 and above
compared to England as a whole (seen from
the overlay outline). A decade later (in 2024),
this still remains the same with those aged 55
years and above having a higher population
percentage in Suffolk compared to England.
This in contrast to Norfolk is different where
Norfolk’s age range increases (from 58 and
above in 2014 to 55 and above in 2024).
The key bulges (highlighted in red) signify that
those aged 67 years old, form the largest
proportion of Suffolk’s old age community –
forming 1.7% of Suffolk's total population,
compared to 1.3% to that nationally
(England).
This trend is the same as the Norfolk bulge
diagrams.

15
UK versus Norfolk/Suffolk comparisonOver the next decade the percentage of the population in Norfolk and Suffolk in the age ranges 60-74 and over 75 will continue to be significantly higher than the UK average.
Projected population % in 20141
Projected population % in 20191
Projected population % in 20241
0
5
10
15
20
25
0-14 15-29 30-44 45-59 60-74 75 &over
% o
f p
op
ula
tio
n
Age (Years)
UK
Norfolk
Suffolk
0
5
10
15
20
25
0-14 15-29 30-44 45-59 60-74 75 &over
% o
f p
op
ula
tio
n
Age (Years)
UK
Norfolk
Suffolk
0
5
10
15
20
25
0-14 15-29 30-44 45-59 60-74 75 &over
% o
f p
op
ula
tio
n
Age (Years)
UK
Norfolk
Suffolk
By 2024 the percentage of the population 75 and over in Norfolk and
Suffolk will be almost 50% higher than the UK average. This is likely to
have a significant impact on the funding required for dementia care.
For those aged 45-59, both the UK and Norfolk and Suffolk have
very similar population %, from 2014 through to 2024.
For the 0-14, 15-29 and 30-44 age groups, the UK has a greater
population % compared to Norfolk and Suffolk, from 2014 through to
2024.
Source: 1. ONS – 2012 based Population Projections
Market Analysis and ContextDeclaration of Sustainability Strategic PlansSustainability and Strategic
OptionsFinancial Overview

16
Ethnicity by Service Line
0%
1%
2%
3%
4%
5%
6%
7%
Asian or AsianBritish
Black or BlackBritish
Mixed Other EthnicGroup
Ethnic Group
The White ethnic group form the majority of service users for Norfolk and Suffolk – on average across service lines over 78% of service users are from a White ethnic group (with a slight decrease year on year)
Service line breakdown by all ethnic groups for 2013-14
Detailed service line breakdown by minority ethnic group for 2011-12
The white ethnic group makes up the majority of service users for Norfolk and Suffolk. However, this has been decreasing since
2011-12. Comparing the minority ethnic groups for 2013-14, there is no significant service being utilised by a particular minority
ethnic group, apart from “Other” (6% of the ‘Other’ Ethnic group). Some of this is a result of a 14% non recording of ethnicity.
0%
10%
20%
30%
40%
50%
60%
70%
80%
90%
100%
Asian or AsianBritish
Black or BlackBritish
Mixed Other EthnicGroup
White NA
Perc
en
tag
e o
f th
e r
efe
rrals
Ethnic Group
Access and Assessment
Adult Acute Services
Adult Community
Children, Family and Youth
Neurodevelopmental
NULL
Older People Acute Service
Other
Wellbeing Service
Enhanced Community
0%
1%
2%
3%
4%
5%
6%
7%
Asian or AsianBritish
Black or BlackBritish
Mixed Other EthnicGroup
Ethnic Group
Detailed service line breakdown by minority ethnic group for 2013-14
Market Analysis and ContextDeclaration of Sustainability Strategic PlansSustainability and Strategic
OptionsFinancial Overview

17
Deprivation levels
Risk to sustainability and
strategic optionsMarket Analysis and ContextDeclaration of Sustainability Supporting Financial DataStrategic Plans
Norfolk has a number of large pockets of deprivation, whereas Suffolk has relatively few. Deprivation levels in the East of England as a whole rose by about 17% between 2007 & 2010
Source: The English Indices of Deprivation 2010*Source :Better Or Worse: A Longitudinal Study Of The Mental Health Of Adults In Great Britain, National Statistics, 2003
Norfolk
Suffolk Deprivation in this analysis covers a broad range of issues and refers to unmet needs caused by a lack of resources of all kinds, not just financial.
About half of people with common mental health problems are no longer affected after 18 months, but areas where deprivation is high, poorer people, the long-term sick and unemployed people are more likely to be still affected than the general population*.
The study states that 88 per cent of the areas that were the most deprived in 2010 were also amongst the most deprived in 2007, suggesting that deprivation levels do not rapidly change.
The pattern of deprivation in Norfolk and Suffolk shows, despite the largely rural nature of the counties, the most deprived areas are the urban centres, particularly around Great Yarmouth, Norwich, Ipswich and Lowestoft.

18
0
10,000
20,000
30,000
40,000
50,000
60,000
70,000
80,000
ADULTMENTALILLNESS
CHILD andADOLESCENTPSYCHIATRY
EATINGDISORDERS
FORENSICPSYCHIATRY
LEARNINGDISABILITIES
OLD AGEPSYCHIATRY
TADS IAPT
Po
pu
lati
on
Services
2011-2012
2012-2013
2013-2014
Number of new referrals to NSFT each year
Years
2011-2012 2012-2013 2013-2014
Serv
ices
ADULT MENTAL ILLNESS 38,014 43,306 70,200
CHILD and ADOLESCENT PSYCHIATRY 7,761 9,223 5,340
EATING DISORDERS 24 50 17
FORENSIC PSYCHIATRY 526 355 502
LEARNING DISABILITIES 612 641 1,413
OLD AGE PSYCHIATRY 12,887 12,997 16,361
SUBSTANCE MISUSE SERVICES (TADS)* 1,813 2,175 5,728
IAPT 27,391 27,515 28,524
NULL 36 75 1,629
Totals 89,064 96,337 129,714
Service Users 59,164 67,371
Source : NSFT Informatics
NSFT Referral AnalysisThe specialisms which produce the most referrals are Adult Mental Illness, IAPT, Old Age Psychiatry and Child and Adolescent Psychiatry. The introduction of community teams and the new Access and Assessment Service in 2013 has improved access to services and caused higher then normal referral peaks across all areas.
Market Analysis and ContextDeclaration of Sustainability Strategic PlansSustainability and Strategic
OptionsFinancial Overview

19
Overall projected referrals
The average growth rate for referrals year on year is approximately 4.4%.
Market Analysis and ContextDeclaration of Sustainability Strategic PlansSustainability and Strategic
OptionsFinancial Overview
0
2000
4000
6000
8000
10000
12000
14000
20
11
04
20
11
06
20
11
08
20
11
10
20
11
12
20
12
02
20
12
04
20
12
06
20
12
08
20
12
10
20
12
12
20
13
02
20
13
04
20
13
06
20
13
08
20
13
10
20
13
12
20
14
02
20
14
04
20
14
06
20
14
08
20
14
10
20
14
12
20
15
02
20
15
04
20
15
06
20
15
08
20
15
10
20
15
12
20
16
02
20
16
04
20
16
06
20
16
08
20
16
10
20
16
12
20
17
02
20
17
04
20
17
06
20
17
08
20
17
10
20
17
12
20
18
02
20
18
04
20
18
06
20
18
08
20
18
10
20
18
12
20
19
02
Nu
mb
er
of
Ne
w R
efe
rra
ls p
er
mo
nth
Total referrals to date
Total future projected referrals
The Trust is planning on an average growth rate per year of 4.4% as shown by the above trajectory for the service specialisms of Adult Mental Illness, Child and Adolescent Psychiatry, Learning Disabilities, Old Age Psychiatry, Substance Misuse Services and Improving Access to Psychological Therapies (IAPT). Eating Disorders and Forensic Psychiatry service lines have been excluded from the analysis, as current referrals data provided an inconclusive view of future demand.
The Trust will need to plan to ensure this increasing demand can be met given there will be a corresponding reduction in available funding, locally and nationally.
10,02510,496
10,96711,438
11,909
9,474
20
Workforce analysis
Skills shortages across NSFT mirror national skills shortages but are exacerbated in some areas with additional geographical challenges, in particular for nursing staff at Band 5.
The Trust will continue to invest in its staff, to build staff engagement and improve staff satisfaction and has developed a 5 year Workforce and Organisation Development strategy. The core objectives of which are to:
• Create a flexible, engaged and skilled workforce in line with organisation and service needs
• Ensure employment policies, processes and practices support the Trust vision, values and behaviors, the NHS Constitution, and professional codes of conduct.
• Operate as part of the wider health and social care workforce system, contributing to the system workforce priorities.
Norfolk & Suffolk has an ageing population and an ageing workforce. It is a predominantly rural area and recruitment issues exist with many staff groups. Therefore great emphasis is being placed on “grow your own” strategies and retention and development of existing staff. These include the creation of a self-sustaining apprenticeship scheme, the development of increasing numbers of AssistantPractitioners, Peer Support Workers, return to work schemes and conversion courses enabling Assistant Practitioners to becomequalified Nurses. Over time these initiatives will contribute to a shift in the way services are operated, with specialist staff using their skills at the most appropriate time in a service users journey. In addition this will lead to a reduction in the relative cost of service provision based on an increase in the proportion of unqualified staff in the workforce.
NSFT Workforce Demand Trends*
In 2014 the Number of WTEs has already decreased by 5%, as compared to 2013
By 2016 an approximate reduction of 14% from 2013 levels in the number of Total
WTEs is planned
The current target vacancy rate of 10% is planned to be reduced to 5% by 2019
The Trust has developed a 5 year Workforce and Organisation Development strategy.
Source: Based on Trusts 5-Year Workforce Plan submission to Health Education East of England
Market Analysis and ContextDeclaration of Sustainability Strategic PlansSustainability and Strategic
OptionsFinancial Overview
Table showing change in percentage make up and type of workforce

21
Current Estate (2014)
Total Number of Buildings 134
Net Book Value £130.79m
Total Value After Depreciation £126.15m
Total Run & Maintain Costs £10.68m
Planned Sales
Freed Up Capital £9.74m
Resulting Operational
Savings£0.44m
Sales under
consideration
Freed Up Capital £3.96m
Resulting Operational
Savings£0.88m
There are plans for disposal of various properties across the NSFT estate as part of the 5 Year Plan.
Future Consolidation of the NSFT Estate
The Trust has a significant estate portfolio and has disposal plans for various properties as part of the 5 Year Plan. All estate to be disposed of is either not fit for purpose or will no longer be required. Realised sales of the properties under consideration in the next 2 years would yield results as shown in the table below:
Further potential sales under consideration in years 3-5 (or sooner if possible) would result in the following savings:
A key part to the future estates strategy will be working with other public sector providers to ensure all property owned by the public purse is used to maximum efficiency.
Market Analysis and ContextDeclaration of Sustainability Strategic PlansSustainability and Strategic
OptionsFinancial Overview
NSFT location analysis

22
Bed analysis
Source: NSFT Informatics 2013/14
NSFT’s bed utilisation rates are very closely aligned to those of other trusts, according to the Benchmarking Network’s 2013 report. This can be seen from the graph shown below displaying participating Trust’s bed utilisation levels.
Market Analysis and ContextDeclaration and
SustainabilityStrategic Plans
Risk to Sustainability and
Strategic OptionsSupporting Financial
Information
The chart indicates where the Trust in-patient services operate from.
Adult Acute Bed Occupancy Rate Benchmark
Locally there is regular pressure on bed availability, in particular in central Norfolk for adults with a regular need for the Trust to send service users out of area.
This is under continuous monitoring and the Trust is working with commissioners to ensure this is managed and bed numbers are funded appropriately.

23
NSFT Mental Health Outcomes
Market Analysis and ContextDeclaration of Sustainability Strategic PlansSustainability and Strategic
OptionsFinancial Overview
The introduction of Trust wide use of Health of the Nation Outcome Scores (HoNOS) as a robust, model for measuring mental health outcomes is a key objective for 2014/15.
There has been a lot of debate about how to measure the success of mental health services locally and nationally. A number of outcome measures have been developed but none is supported by a majority of clinicians. The result has been poor outcome data for mental health services. The feedback from our engagement events was very clear that we must measure outcomes. This is supported by the Board and is one of the key objectives for the coming year.
The Trust has been part of national work, first under Department of Health, now under NHS England and Monitor, developing a payment system for mental health to replace the block contract. The current preferred approach is based on an assessment of service users’ needs called “clustering”. The service user is assigned to a needs based cluster. The intention is there will be associated care packages and an agreed outcome measure, potentially Health of the Nation Outcome Scores, known as HoNOS, and a variant HoNOS 4 factor. This work is still in progress at a national level.
The clustering assessment is based on HoNOS, one of the most broadly used outcome measures for mental health and covers a number of questions about the service users’ wellbeing social functioning. HoNOS 4 factor is a variant on HoNOS which in the scores for each HoNOS question are aggregated to one of four groupings or factors:
Factor 1: Personal Well-Being
Factor 2: Emotional Well-Being
Factor 3: Social Well-Being
Factor 4: Severe Disturbance
It is our view that we need outcome data and as we already collect this information as part of clustering it is a good place to start.
The collection and completion of this data will be supported by, and support, the Trusts’ research and development strategy.

24
Strategic intentions
Sustainability and Strategic
OptionsMarket Analysis and ContextDeclaration of Sustainability Strategic Plans
The following strategic intentions have been consulted on via engagement events held across the Trust. An analysis of feedback and attendees is available at Appendix 1. They represent the high level intentions that underpin any future strategic options. The Trust’s current vision, aims and objectives for 2014/15 are in Appendix 2.
Remaining sustainable
• We will work to remain a viable organisation from a financial and performance perspective.
Integration
• We will work with commissioners, service users, carers and other providers (including the independent & charity sector) to:
• Identify opportunities and develop integrated patient centred services
• put mental health at the heart of services delivered in our area.
Recovery and outcomes
• We will further implement the Improving Recovery through Organisational Change principles, putting this at the heart of what we do, changing the way we operate and deliver services, including:
• Recovery & life beyond illness
• Co-production
• Self-directed care
• We will build a reputation for delivering good outcomes for service users that can be evidenced
Being part of the community
• We will look for, and exploit, opportunities to work on prevention and anti-stigma by:
• using our resources wisely
• where possible, building prevention and anti-stigma work into the way we deliver our services
• working with commissioners, service users, carers, schools, GPs, other providers and other willing partners (such as the local business community)
Financial Overview

25
Strategic intentions continued…
Sustainability and Strategic
OptionsMarket Analysis and ContextDeclaration of Sustainability Strategic Plans
The Trust will offer choice to service users in terms of:
• Teams (as long as an appropriate service is offered)
• Appointment time and location
• Involving service users, as appropriate, in development of effective care plans which give them ownership of their care.
Service delivery routes
• We will endeavour to deliver our services via the most appropriate route (within funding constraints):
• for each service user
• for the service type
• We will consider appropriate technology to deliver services, such as the Big White Wall use in Wellbeing services.
We will explore ways to use technology appropriately to:
• Engage with service users and carers in a convenient and timely way
• Make best use of clinicians time (e.g. reduce travel) and freeing up clinical time for those with the most complex and severeneeds.
Building on success
• We will build on successful delivery and look for opportunities to extend successful services such as Youth Service and the Dementia Intensive Support Teams.
Learning and improving:
• We will review and evaluate service implementations, learning lessons and improving
• We will review good practice and research studies conducted by others to ensure we learn from other experience.
Building confidence
• We will work to build and maintain the confidence of staff, service users and commissioners in the Trust and its services.
Financial OverviewSustainability and Strategic
OptionsMarket Analysis and ContextDeclaration of Sustainability Strategic Plans

26
NSFT Operating Model
Regulators - Monitor / Care Quality Commission / HealthwatchRegulators - Monitor / Care Quality Commission / Healthwatch
FRONT LINE SERVICES
ACCESS & ASSESSMENT CENTRE
SERVICE DEVELOPMENT
SUPPORT Strategy Finance HR
Info
rma
tics
IT
Se
rvic
e U
sers
Se
rvic
e U
sers
Se
rvic
e U
sers
Se
rvic
e U
sers
Na
tio
na
l /
Loca
l C
om
mis
sio
ne
rs
-N
HS
En
gla
nd
, C
CG
s
Na
tio
na
l /
Loca
l C
om
mis
sio
ne
rs
-N
HS
En
gla
nd
, C
CG
s
Locality - Norfolk & Suffolk
Re
ferr
ers
Re
ferr
ers
-P
rim
ary
Ca
re
Service UsersService UsersService UsersService UsersLocal Service Users – PatientsLocal Service Users – Patients
x7
x7x7
Referrals
Reporting
New Services
Budgeting / Reporting
Commissioning
De
pa
rtm
en
t o
f H
ea
lth
/ N
ICE
De
pa
rtm
en
t o
f H
ea
lth
/ N
ICE
Service Provider - NSFT
National Governance - England
Financial OverviewSustainability and Strategic
OptionsMarket Analysis and ContextDeclaration of Sustainability Strategic Plans
The following diagram represents an integrated operating model which will be developed over the coming year to include operational decision making frameworks, ensuring corporate responsibility and accountability and facilitate the shift from block contracts to payment by outcomes.

Strategic ThemesMonitor states: Commissioners and providers will need to work together across all three of these areas to improve efficiency to meet the affordability challenge.
Input Cost Reduction
Efficiency Gains
Business Process Redesign
Service Provision TransformationChanging what we deliver
Changing how we deliver
Doing more
Costing less
SystemEfficiencies
Risk to Sustainability and
Strategic OptionsMarket Analysis and Context
Declaration and
SustainabilityStrategic Plans
Supporting Financial
Information
Provider Efficiencies
2014/15 2015/16 2016/17 2017/18 2018/19
Efficiency Savings£14.7m
(7%)
£9.3m
(4.7%)
£6.5m
(2.8%)
£6.2m
(3.2%)
£5.9m
(3.6%)

Strategic options, intentions and conclusions
Market Analysis and ContextDeclaration of Sustainability Strategic PlansSustainability and Strategic
OptionsFinancial Overview
Option Intentions Conclusion
Option 0: No change to delivery of current Mental Health services with Norfolk and Suffolk region
Does not meet any strategic intention This is not a viable option as the known national funding/expenditure gap is predicted as £44.1m by the financial year 2018/19. In addition services would not meet the increasing expectations of commissioners, service users and carers.
Option 1: Delivery of current Mental Health services with Norfolk and Suffolk region based on integration and collaboration across the local health and social care economy
Meets the following:• Integration & Being part of the
community • Choice, Recovery and outcomesThe following also support option 1:• Use of technology • Learning and improving• Building on success & confidence• Remaining sustainable
This option is bases on current geography enabling the Trust to focus on existing customers and retain existing business. Any expansion into other areas traditionally associated with mental health, would then be achieved from a position of strength.
The Trust, as part of its 5 year strategic plan must consider options open to it for future viability and service delivery. The table below summarises the main options, how it meets any strategic intentions identifies earlier and concludes as to if this is a viable option. Each of these option has then been analysed for the Strengths, Weaknesses, Opportunities and Threats (SWOT).

Strategic options, intentions and conclusions cont’d…
Market Analysis and ContextDeclaration of Sustainability Strategic PlansSustainability and Strategic
OptionsFinancial Overview
Option Intentions Conclusion
Option 2: Delivery of current Mental Health and associated care services with Norfolk and Suffolk region extended by a partnership, or acquisition, with, another service provider within the local health and social care economy
Meets the following:• Integration & Being part of the community • Choice, Recovery and outcomesThe following also support option 2:• Use of technology • Learning and improving• Building on success & confidence• Remaining sustainable
This option is bases on current geography which mean the Trust could focus on existing customers while considering expansion into other areas to maximise the opportunities for integration.The Trust would need to stabilise current service provision ahead of any further integration plans.
Option 3: Delivery of current Mental Health and associated care services with Norfolk and Suffolk region extended by the partnership or acquisition of another Service Provider outside the existing local health and social care economy
Meets the following:• Integration & Being part of the community• Choice, Recovery and outcomes• Being part of the community The following support option 3:• Use of technology • Learning and improving• Building on success & confidence• Remaining sustainable
This option may provide financial sustainability but could divide the Trust’s attention across a greater geographical area and number of CCGs with localised requirements.
Option 4:Delivery of some or all of the NSFT Mental Health services into adjacent region
Meets the following:• Choice, Recovery and outcomes• Being part of the community The following also support option 4:• Use of technology • Learning and improving• Building on success & confidence• Remaining sustainable
This option may provide financial sustainability but it would not easily deliver integrated services and could dilute the Trust’s attention across a greater geographical area and number of CCGs with localised requirements.

Strategic options, intentions and conclusions cont’d
Market Analysis and ContextDeclaration of Sustainability Strategic PlansSustainability and Strategic
OptionsFinancial Overview
Option Intentions Conclusion
Option 5: Being part of integrated (whole system) services such as crisis & urgent care teams and integrated neighbourhood teams
Meets the following:• Integration & Being part of the community • Choice, Recovery and outcomesThe following support option 5:• Use of technology • Learning and improving• Building on success & confidence• Remaining sustainable
This option is something that will be considered in future and is here for completeness. Earlier options and more clarity on how the whole system must come together to meet the demand and financial challenge is essential to this being a viable and sustainable option.
For this reason a SWOT analysis has not been undertaken given this would require wider stakeholder agreement and discussion.
Given the analysis of:
o Demand and demographic trends
o Trust capability and capacity
o Trust infrastructure
o Commissioning trends and expectations
o Feedback from engagement events
The preferred option for the strategic 5 year plan, with the proviso that stability in current service provision is achieved, is option 2. This could provide financial and service stability with integration of mental and physical health service models across health and social care economy.
It should be noted that the financial modelling is based on option 1 as this is a precursor to option 2, as the financial modelling for option 2 will depend on the organisation/s that the Trust works with and the contractual arrangements (e.g. partnership, shared back office, merger etc.).

Strategic plan engagement events
Sustainability and Strategic
OptionsMarket Analysis and ContextDeclaration of Sustainability Strategic Plans
The Trust held 7 engagement events across both counties, 277 registered for the events, with 212 people attending and 12 submitting email comments. The following 66 different organisations were represented at the events along with service users, carers and members of the public.
Financial OverviewSustainability and Strategic
OptionsMarket Analysis and ContextDeclaration of Sustainability Strategic Plans
Location No of attendees
Kings Lynn 23
Great Yarmouth 27
Ipswich 48
Norwich 29
Bury St Edmunds 33
Stowmarket 12
Norwich, UEA 40
Totals 212
Total registered 277
Allied Healthcare Ipswich Borough CouncilRichard Bacon MP - Office
Manager
Babergh & Mid Suffolk District Council James Paget HospitalRichard bacon MP - Private
Office
Beat Julian Support RichmondFellowship
Broadland meridian Keys Hill Park SIFRE
Care UK Keys Hill Park SNAP
Crossroads Care East Anglia Mid Suffolk & Babergh District Council South Norfolk CCG
CSC Mind Strong Roots
East Coast Community Healthcare (CIC) MTCIC Sue Lambert Trust
East of England Ambulance NHS Trust Na Suffolk CCGs
Equal Lives NHS England Suffolk County Council
Family ActionNHS Great Yarmouth and Waveney Clinical
Commissioning GroupSuffolk Family Carers
FeedbackNIHR Eastern LRN Neurodegeneration
(formerly Dendron)Suffolk Libraries
Forest Heath District Council and
St Edmundsbury Borough Council
Norfolk Community Health and Care
NHS TrustSuffolk Mind
Gt Yarmouth & Waveney Mind Norfolk Coroner Suffolk User Forum
GY&W Mind Norfolk County Council The Regard Partnership
Healthwatch Suffolk Norfolk DAAT Together for Mental Wellbeing
High Oaks Community Care & Support Norfolk+Suffolk consultatin with carers Unison
Homegroup - Stonham Norwich CCGVoiceAbility Community
Development Team
Huntington's Disease Association Norwich MIND Voluntary Norfolk
Independence Matters OCD Action West Norfolk CCG
Integrated MH & LD Commissioning Team Regard West Suffolk CCG
Ipswich & East Suffolk Samaritans Rethink Mental Illness

Engagement events – key themes
Sustainability and Strategic
OptionsMarket Analysis and ContextDeclaration of Sustainability Strategic Plans
Below is a summary of the key messages from attendees at the events. There is a good alignment with the Trust’s strategic intentions.
The Trust should:
• Measure outcome data and benchmark
• Keep promises
• Stability in the organisation
Communication:
• Be realistic – manage expectations. Need service to meet needs or be clear if can’t meet needs
• Proactive and reactive. Send out positive messages on great services
• Increase transparency including about challenges
Location of treatment/Accommodation:
• Cost of treatment in home/community not always cheaper
• Use other NHS premises such as GP surgeries.
Care pathways:
• Changes in one pathway impacts on another and could increase costs – rise in early intervention threshold and acute service
• Joining up services is better for patients, need whole system integrated approach – money needs to be pooled –political action needed
• The Trust should work more closely with external partners such as third sector/ charities/ communities/ schools including on anti-stigma, prevention and early intervention
• Embed Improving Recovery through Organisational Change to inject passion
TSS:
• Where are with the last strategic plan?
• Have we learnt lessons
Financial OverviewSustainability and Strategic
OptionsMarket Analysis and ContextDeclaration of Sustainability Strategic Plans

Engagement events – key themes continued...
Sustainability and Strategic
OptionsMarket Analysis and ContextDeclaration of Sustainability Strategic Plans
Vision and strap line:
• Vision needs to be more aspirational
• Strap line may be too ambitious
• Quality should be included
Service users and carers:
• Not many service users (SUs) at events, in future ask care co-ordinators to tell SUs re events
• Empower service users to look after themselves in community
• Build strategy on understanding of service user and carer needs
• Service users need to be at the centre
Staff:
• Staff need to be involved in the centre
• Need to look at long term recruitment and retention. Be attractive as an employer
• Move away from Agenda for Change
Parity of Esteem:
• Need more parity of funding and treatment – need to talk to commissioners about it
Strategic intentions:
• Too many and some Business As Usual activities
• Be realistic about what can deliver
• Strategy isn’t innovative and visionary – go bigger
• Income generate using FT status
Financial OverviewSustainability and Strategic
OptionsMarket Analysis and ContextDeclaration of Sustainability Strategic Plans

34
NSFT overall SWOT analysis
Strengths
•NSFT is the key provider of mental health
services in the Norfolk & Suffolk region
• NSFT deliver safe, effective Mental Health
(MH) services aligned to local needs
•Delivering successful services, in particular
Youth Service and the Dementia Intensive
Support
•NSFT has delivered efficient savings to date to
maintain financial vaibility and sustainability
e.g. service strategy
Opportunities
•To maintain sustainability the Trust need to
develop strategic alliance and partners with
Commissioners and other Service Provides to
deliver efficiency savings (to include potential
integration of services)
•Successful implementation of Lorenzo (a
common IT platform) to provide a single view
of the Service User
•Use of technology to deliver services more
efficiently, such as the Big White Wall use in
Wellbeing services
Threats
•Further CCG budget cuts leading to a
reduction in Trust income.
•Demographic changes with increasing elderly
population
•Increasing demand for mental health services,
•Ongoing unmet demand with only 26% of
adults with mental illness receiving care
leading to increased referrals
•Increasing competition from other service
providers to ‘cherry pick‘ key services
•Potential skill and staff shortage e.g Band 5
Weaknesses
•Complex funding landscape with 7 CCGs
whislt Social Care and Community Care have
different funding bodies
•Limited scope within the existing block
contracts to take into consideration increasing
demand for MH service
•Data quality is variable due to numerous IT
systems (Clinical and Adminstrtive) with
manual data entry
• Limited Acute MH Bed capacity
S W
TO
Sustainability and Strategic
OptionsMarket Analysis and ContextDeclaration of Sustainability Strategic Plans Financial Overview
The Trust has considered options for its future sustainability, the SWOT analysis below is based on the Trust overall. On the following pages each of the potential options has an associated SWOT analysis.

35
Option 0 SWOT Analysis
Strengths
• NSFT is the key provider of mental health
services in the Norfolk & Suffolk region
• No disruption to the NSFT service
(unchanged business and operating model)
• The Mental Health Services are aligned to
the current requirements of the individual
CCGs
Opportunities
•Successful implementation of Lorenzo (a
common IT platform) to provide a single
view of the Service User and reduce manual
processess
•Change the service model for Mental
Health Services including egibility criteria,
reducing clinical interventions, to reduce
cost base
Threats
•Further CCG budget cuts leading to a
reduction in Trust income.
•Demographic changes with increasing
elderly population
•Increasing demand for mental health
services
•Significant efficency savings are yet to be
identified to maintain financial sustainability
•Potential skill and staff shortage e.g Band 5
Weaknesses
•Complex funding landscape with 7 CCGs
with differing Mental Health Care priorities
•Limited integration with Social Care and
Community Care
•Two separate service models aligned to
Norfolk and Suffolk
•Fragmented clincial and adminstrative
systems supported by manual processes
with variable data quality
• Bed and associated staff profile does not
fully meet service user demand
S W
TO
Risk to Sustainability and
Strategic OptionsMarket Analysis and Context
Declaration and
SustainabilityStrategic Plans
Supporting Financial
Information
No change to delivery of current Mental Health services with Norfolk and Suffolk region

36
Option 1 SWOT Analysis
Strengths
•NSFT is the key provider of mental health
services in the Norfolk & Suffolk region
•Funding better targeted to appropriate
Mental Health services aligned to
Commissioners priorities
•NSFT deliver safe, effective Mental Health
(MH) services aligned to local needs
•NSFT has delivered efficient savings to date
to maintain financial vaibility and
sustainability e.g. service strategy
Opportunities
•Standardisation of services, reporting and
governance through implmentation of
Lorenzo (to provide common IT Platform)
•To develop strategic alliances and
partnerships with Commissioners, Service
Providers and the Third Sector to deliver
greater efficiency savings (through integration
of services)
•Change the service model for MH Services
including egibility criteria to reduce clinical
intervention and manage demand
Threats
•Further CCG budget cuts leading to a
significant reduction in Trust income.
• CCG and other Sevice Providers have
conflicting priorities and do not actively
partcipate with NSFT
• Competitors disrupt local health and social
care economy collaboration
•Demographic changes with increasing elderly
population increasing demand for mental
health services
•Potential skill and staff shortage e.g Band 5
Weaknesses
•Complex funding landscape with 7 CCGs
Fragmented clincial and adminstrative
systems supported by manual processes with
variable data quality
•No track record for collaboration and
integration of health service within the LHE
•Bed and associated staff profile does not fully
meet service user demand
S W
TO
Sustainability and Strategic
OptionsMarket Analysis and ContextDeclaration of Sustainability Strategic Plans Financial Overview
Delivery of current Mental Health services with Norfolk and Suffolk region based on integration and collaboration across the local health and social care economy

37
Option 2 SWOT Analysis
Strengths
•Funding better targeted to appropriate Care
Services aligned to Commissioners (CCGs
and Local Authority) priorities
•Additional funding streams and a wider
service portfolio provides greater financial
independence for Trust
•Greater capacity and capabilities to
leverage and deliver synergies across local
health economy
•Opportunity to learn from good practice
Opportunities
•Opportunity to radically change the service
model for mental health and social care
services in the community
•Opportunity for earlier interventions (in the
community) supported by a self
management service model
•Greater use of self management supporting
by an existing Community Care
infrastructure and use of technology
•Rationalise the estate and back office
functions across the integrated organisation
Threats
• CCG do not agree with the strategy and do
not support the integration with another
Service Provider
•Any targeted Service Provider is not
financially viable (only apparent post
integration)
• Any targeted Service Provider is subject to
a better competitive bid
Weaknesses
•NSFT has limited success in the integration
of services to date (overlaying a further
service will drive complexity)
•Limited examples with the integrated care
model still operating as pioneer schemes
across England
•Insufficient data to undertake rigorous due-
diligence of the targeted Service Provider
•Potential to distract from the core mentall
health service
S W
TO
Sustainability and Strategic
OptionsMarket Analysis and ContextDeclaration of Sustainability Strategic Plans Financial Overview
Delivery of current Mental Health and associated care services with Norfolk and Suffolk region extended by a partnership, or acquisition, with, another service provider within the local health and social care economy.

38
Option 3 SWOT Analysis
Strengths
•Potential for additional income and a wider
Commissioner base
• Access to a wider resource pool (and
ability to redeploy resources into areas with
skill shortages)
• Greater brand recognition across the local
health and social care economy
• Greater capacity and capabilities to
leverage (and deliver synergies across local
health and social care economy)
Opportunities
•Further Back Office consolidation across
the integrated organisation
•Identify and implement good practice
across both organisations
Threats
• NHS England and CCG do not agree with
the strategy and do not support the move
into adjacent markets
•The targeted Service Provider is not
financially viable (only apparent post
integration)
•Not understanding requirements in
sufficient detail to deliver a sustainable
service
Weaknesses
•NSFT has limited success in the integration
of services to date (overlaying a further
service will drive complexity)
•Limited examples with the integrated care
model across England, still operating as
pioneer schemes
•Insufficient data to undertake rigorous
due-diligence of the targeted Service
Provider and region
S W
TO
Sustainability and Strategic
OptionsMarket Analysis and ContextDeclaration of Sustainability Strategic Plans Financial Overview
In addition to Option 1
Delivery of current Mental Health and associated care services with Norfolk and Suffolk region extended by the partnership oracquisition of another Service Provider outside the existing local health and social care economy

39
Option 4 SWOT Analysis
Strengths
•Potential for additional income and a wider
Commissioner base
• Access to a wider resource pool (and
ability to redeploy resources into areas with
skill shortages)
• Greater brand recognition across the local
health and social care economy
• Greater capacity and capabilities to
leverage (and deliver synergies across local
health and social care economy)
Opportunities
•Further Back Office consolidation across
the integrated organisation
•Identify and implement good practice
across both organisations
Threats
• Depending on location, may go against the
direction previously set by Monitor
•NHS England and CCG do not agree with
the strategy and do not support the move
into adjacent markets
•The targeted Service Provider is not
financially viable (only apparent post
integration)
•Not understanding requirements in
sufficient detail to deliver a sustainable
service
Weaknesses
•Requires a successful track record in the
delivery of Option3 as a pre-requisite
•Potential to distract from the core MH
service
•Very limited examples of this integrated
care model across England
•Insufficient data to undertake rigorous due-
diligence of the targeted Service Provider
and region
S W
TO
Sustainability and Strategic
OptionsMarket Analysis and ContextDeclaration of Sustainability Strategic Plans Financial Overview
In addition to Option 1&2
Delivery of some or all of the NSFT Mental Health services into adjacent region

40
Competitor SWOT Analysis – Other NHS Trusts
Strengths
• Understanding of service requirements and
costs to deliver
• Access to a wider resource pool (and ability
to redeploy resources into areas with skill
shortages)
• Potentially greater brand recognition across
the local health and social care economy
•Supports government agenda for
competition
Opportunities
•Back office consolidation with existing out
of area operation generates cost savings
•Identification and implementation of best
practice generates cost savings
•Success provides platform for growth
leading to virtuous circle of contract wins
Threats
• Government agenda moves away from
competition towards more local health and
social care economy integration
•The contract is financially unsustainable
• Poor understanding of contract
requirements and health economy needs to
poor performance and reputational impact
• Competitive tendering in immature
market leads to “race to the bottom” on
costs – government intervention required
Weaknesses
• No established relationships with local
health and social care economy
• Complicates local health and social care
integration and collaboration agenda
• Limited examples where this has been
succesful
• Insufficient data to undertake rigorous
due-diligence of the targeted service means
potential financial risk
• Potentially high set up costs not recoverd
during life of contract
S W
TO
Risk to Sustainability and
Strategic OptionsMarket Analysis and Context
Declaration and
SustainabilityStrategic Plans
Supporting Financial
Information
The Trust operates in an environment whereby any of its services could be tendered, the SWOT analysis below is based on any other NHS provider trying to enter the local market.
41
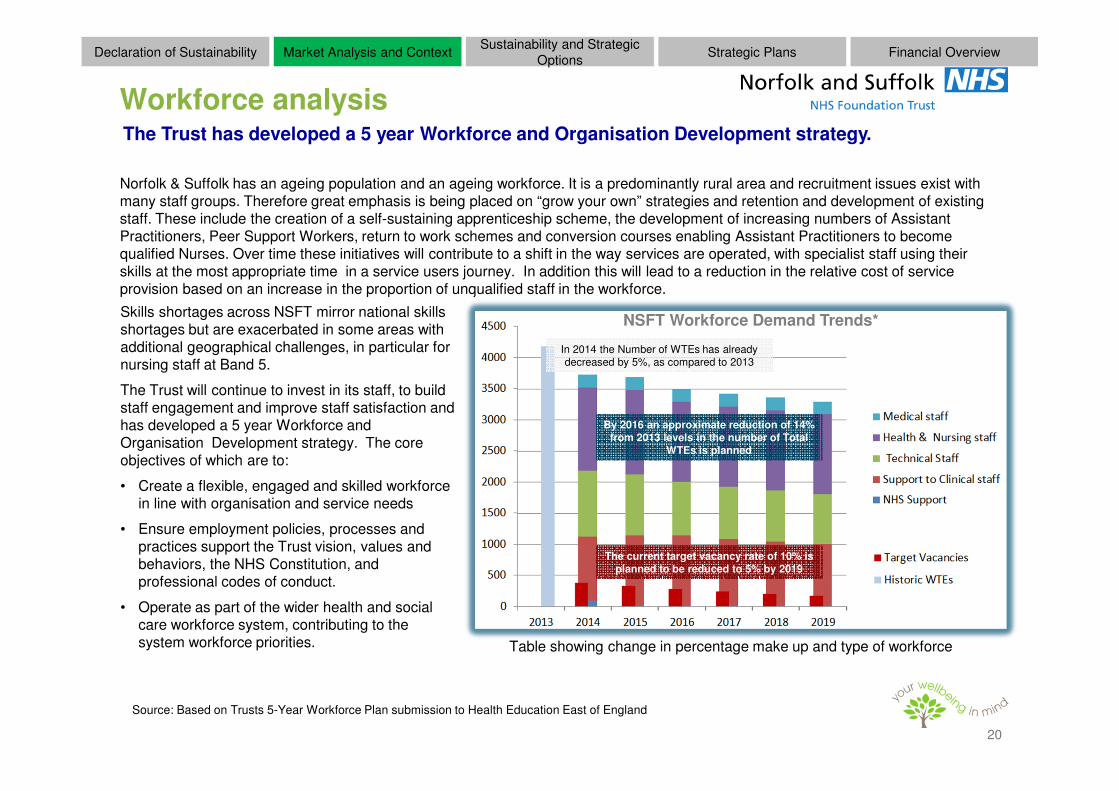
Competitor SWOT Analysis – Private sector
Risk to Sustainability and
Strategic OptionsMarket Analysis and Context
Declaration and
SustainabilityStrategic Plans
Supporting Financial
Information
Strengths
• Potential to “cherry pick” and under price
contracts to gain experience (although not
sustainable as a long term strategy)
• Access to leading edge commercial
management and back office support
• Supports government agenda for
competition
S W
TOOpportunities
• Back office consolidation with existing
commercial contracts generates cost savings
• Identification and implementation of
commercial best practice generates cost
savings
• Success provides platform for growth
leading to virtuous circle of contract wins
Threats
• Government agenda moves away from
competition towards more local integration
• The contract is financially unsustainable
• Poor understanding of contract
requirements and local needs leads to poor
performance and reputational impact
• Shareholder interests not met -
insufficient profit
• Competitive tendering in immature
market leads to “race to the bottom” on
costs – government intervention required
Weaknesses
• No established relationships with local CCGs
• Complicates local collaboration and
integration agenda
• Limited examples where this has been
succesful
• Insufficient data to undertake rigorous due-
diligence of the targeted service means
potential financial risk
• Potentially high set up costs not recoverd
The Trust operates in an environment whereby any of its services could be tendered, the SWOT analysis below is based on any private sector provider trying to enter the local market.

42
Str
ate
gic
In
itia
tive
s
Strategic plan initiatives
FY 14 - 15 FY 15 - 16 FY 16 - 17
Triangle of Care implementationTriangle of Care implementation
Workforce Enablement via strategy and temporary staffing programmeWorkforce Enablement via strategy and temporary staffing programme
Standard Operating ModelStandard Operating Model
Integrated Service ModelIntegrated Service Model
Lorenzo deploymentLorenzo deployment
Source: NSFT Finance
Evaluation of Service ModelsEvaluation of Service Models
ImROC enablementImROC enablement
Sustainability and Strategic
OptionsMarket Analysis and ContextDeclaration of Sustainability Strategic Plans Financial Overview
FY 17 - 18 FY 18 - 19
Estates rationalisation Estates rationalisation
Procurement improvementsProcurement improvements
Technology strategyTechnology strategy
Communication strategyCommunication strategy
Commercial strategyCommercial strategy
Information strategyInformation strategy
System wide service integrationSystem wide service integration
The following is a framework for further development of more detailed operational plans. It gives an indication of the current strategic initiatives aimed at improving quality, service user and experience and efficiency. They will be developed as plans are progressed.
Define and embed use of patient outcome measures Define and embed use of patient outcome measures
Mental health concordat implementationMental health concordat implementation

The following aligns the strategic intentions to the need to work together across all the following opportunities to improve efficiency to meet the national affordability challenge.
Pharmacy cost reduction
Procurement
Out of area spend
Agency resourcing
Catering
Estates rationalisation
local health & social care economy-wide inc .procurement & pharmacy
FY 14/15 FY 15/16 FY 16/17 FY 17/18 FY 18/19
Corporate restructuring
Front-line logistics & mobility
Resource scheduling
Lorenzo & process improvement
(New) treatment delivery channels
Service demand management
Cross-local health and social care economy governance
Trust service model integration
Operating model & governance
Shared corporate services
Service Provision Transformation
Business
Process Redesign
Efficiency Gains
Input Cost Reduction
Service definition & standardisation
Back-office standardisation
Lorenzo go-live
Risk to Sustainability and
Strategic OptionsMarket Analysis and Context
Declaration and
SustainabilityStrategic Plans
Supporting Financial
Information

44
Local health economy – overall CCG health spend
Source : Published 2012/13 Accounts
Market Analysis and ContextDeclaration of Sustainability Strategic PlansSustainability and Strategic
OptionsFinancial Overview
How the 4 Norfolk CCGs spend money on health
How Great Yarmouth & Waveney spend money on health
Summary
Total Population = 1.62m
Total local health economy budget: ~ £2.65b
Acute / Secondary Care spend: ~ £1.23b
Total Mental Health Spend: ~ £220m = 8.6%
NSFT share = £188m

45
Financial Overview
Market Analysis and ContextDeclaration of Sustainability Strategic PlansSustainability and Strategic
OptionsFinancial Overview
The financial plans show an operating surplus of £1.4m in 2016/17, £1.0m in 2017/18 and breakeven in 2018/19. The net deficit in 2017/18 is a “technical” deficit due to asset impairment as a result of planned asset disposals. The Trust’s cash position by the end of the 5 years will be £15.1m with a COSRR (Continuity of Service Risk Rating) of 3 throughout the period.
The achievement of these plans will require a delivery of £44.1m of Cost Improvements (CIPs) over this time frame with a Capital Expenditure programme of £44.4m.
A summary of the planned income & expenditure position for the 5 years is detailed below.

46
Financial assumptions
Market Analysis and ContextDeclaration of Sustainability Strategic PlansSustainability and Strategic
OptionsFinancial Overview
Income
The Trust is not anticipating significant new revenue, but rather a reducing position based on the NHS deflator assumptions -1.8% on the main four contracts as per current understanding of Commissioning Intentions going forward, and demographic growth +0.5% with the 7 CCGs, but not with NHS Eastern Area (NHS EA).
Full CQUIN (Commissioning for Quality and Innovation delivery is assumed in all 5 years.
There are no impacts of service developments factored in from 2016/17 onwards.
As within the existing 2 year plan already submitted to Monitor the impact of moving to a new Mental Health Payment System (MHPS) has not been factored into the remaining 3 years as joint work is still on-going with Commissioners to assess the Trust’s readiness in terms of contracting on this basis.
Clinical income from other sources is assumed to remain constant with the exception of the Section 75 agreement with Norfolk County Council which will cease during 2014/15 with a corresponding reduction in costs.
Other income, Research and Development, Training and Education, non-clinical and trading, is expected also to continue at similar rates. No adjustment has been made in respect of potential Training and Education funding changes as the result of the Department of Health’s planned transition to Training and Education tariffs.
Suffolk GY&W Norfolk NHS EA
2016/17 onwards
Deflator (1.80%) (1.80%) (1.80%) (1.80%)
Demographic growth 0.50% 0.50% 0.50% -
Net (1.30%) (1.30%) (1.30%) (1.80%)
Expenditure
A basic pay award of 1% for all 5 years in addition to the estimate of on-going incremental increases gives a total pay inflation of just over 2% each year.
Non pay growth is assumed to be consistent with existing plans.
Expenditure on depreciation rises considerably during the 5 years as the capital programme becomes heavily weighted towards ICT investment during this time.
The capital impairment in 2016/17 relates to the revaluation of the Fermoy Unit in Kings Lynn based on the estimated current value compared to the existing net book value. This is effectively a technical accounting adjustment and has no impact on the Trust’s COSRR.
Plan Plan Plan Plan Plan
2014/15 2015/16 2016/17 2017/18 2018/19
Pay award 1% 1% 1% 1% 1%
Pay increments 1% 1% 1% 1% 1%
Total pay 2% 2% 2% 2% 2%
Drugs 5% 5% 5% 5% 5%
Other non-pay 3% 3% 3% 3% 3%

47
Financial assumptions
Market Analysis and ContextDeclaration of Sustainability Strategic PlansSustainability and Strategic
OptionsFinancial Overview
CIP (Cost Improvement Programme)
The total CIPs for the 5 years total £44.1m. The below table summarises these plans over existing Trust Service Strategy (TSS) schemes, Patient Administration System and other.
Given that the majority of the Trust’s cost base is pay related then it has been assumed that for the purpose of planning a large proportion (64%) of the total £44.1m will be identified through pay savings. To date these type of efficiencies have been achieved through service redesign, corporate restructuring and reduction in temporary pay costs. For the purpose of this plan an assumption has had to be made that there will be continuing reductions in headcounts in order to achieve these targets with total planned Whole Time Equivalents reducing from 3,500 to 3,300 between 2015/16 and 2018/19.
It is the view of the Trust that in addition to any internal cost savings opportunities that may be identified going forward that a significant proportion of the £44.1m will need to be met from external system reviews or structural changes within the local health and social care economy.
COSRR
The COSRR throughout the 5 years is planned to be 3 overall. However the breakdown of this between the two metrics demonstrates that any significant variation in the liquidity metric will reduce the headroom and therefore reduce the rating to a 2.
Planned savings as a %age of operating expenditure
TSS
Patient
Administration
System
Other
Schemes Total %
Year £m £m £m £m
2014/15 6.2 - 8.5 14.7 7.0%
2015/16 3.2 - 6.1 9.3 4.7%
2016/17 - 2.1 4.4 6.5 3.5%
2017/18 - 2.3 4.1 6.4 3.5%
2018/19 - 2.3 4.8 7.1 4.0%
Sub-Total 9.4 6.8 28.0 44.1
Metric
Metric Rating Metric Rating Metric Rating Metric Rating Metric Rating
Capital Service Cover Rating 2.33x 3 2.17x 3 2.41x 3 2.44x 3 2.39x 3
Liquidity Metric (5.0) 3 (12.1) 2 (9.8) 2 (4.0) 3 (4.7) 3
COSRR 3 3 3 3 3
2014/15 2015/16 2016/17 2017/18 2018/19
Plan Plan Plan Plan Plan

48
Financial Sensitivity Analysis
Market Analysis and ContextDeclaration of Sustainability Strategic PlansSustainability and Strategic
OptionsFinancial Overview
Within the plans for 2015/16 are two sensitivity scenarios, one relating to the Norfolk IAPT (Improving Access to Psychological Therapy)/Wellbeing tender and one relating to the potential increase in employer pension costs. The first was originally included in the two year plan submission but not the second.
The IAPT/Wellbeing scenario models the loss of the existing contract along with an estimate of income associated with Clusters 1-4. This has then been mitigated by a reduction in expenditure although not full costs and therefore impacts adversely on the “bottom line” by £2.4m.
Further to the original 2 year plan submission where no impact of the potential increase to employer pension costs was taken into account this has now been factored into the sensitivity analysis. The estimate of this increase in costs is £1.3m in 2015/16 rising to £2.7m in 2016/17. These figures are based on a prudent assumption of 0.7% and 2.1% of operating costs respectively and not just pay costs. These are recurring. These percentages were taken using Monitor Annual Planning Guidance. These changes have only been modelled in as a sensitivity analysis as it is still not clear whether these increases will be funded centrally (as they have been in the past).
A third sensitivity analysis has been carried out in 2017/18 and 2018/19 in relation to additional pay cost pressures over and above those already built into the 2% uplift assumptions (see Table 3). This is to assess the impact of any other national decisions which could be made in the future in respect of increases in pay awards and other pay incentives. This additional 0.5% results in additional costs of £0.8m in 2017/18 and £1.5m in 2018/19.
The result of these scenarios is that should these all transpire, with assumed mitigation then the COSRR will remain at 3 in 2014/15, 2017/18 and 2018/19 but will drop to a 2 in 2015/16 and 2016/17 with a reduced liquidity metric of 1.

49
Capital Expenditure
Market Analysis and ContextDeclaration of Sustainability Strategic PlansSustainability and Strategic
OptionsFinancial Overview
The Trust’s capital programme of £44.4m over the 5 years is summarised in the table below.
Since the capital return submitted to Monitor in January 2014, the capital investment plans have reduced for the periods 2014/15 to2018/19 by £9.9m. This was necessary to ensure sufficient headroom in the cash flow projections for the Trust to maintain a satisfactory COSRR throughout the life of the plan.
Previous years have seen substantial investment in inpatient areas across both Norfolk and Suffolk. The plans over the next three years concentrate on ensuring the Trust has the appropriate estate in the correct location to deliver quality services in line with the Trust Service Strategy. As a result of this an estates review is being undertaken to identify if there are any further assets surplus to the Trust’s requirements.
In addition to the planned disposal of the St Clements site in 2014/15 there is currently an additional £3.3m of property disposals planned in 2017/18.
The future years of capital expenditure anticipate significant continued investment in the ICT infrastructure which is required to ensure that Trust staff are working consistently across the various sites. This is reflected in the increased depreciation charges over the outer years.
The impairment for £1.3m in 2017/18 is based on the anticipated market value of the Fermoy Unit in King Lynn compared to the net book value. Future revaluations are planned as part of the three and five year revaluation exercises but it is not anticipated that there will be significant changes in the net book value of the Trust’s estates and so no adjustment for these has been taken into account.
Plan Plan Plan Plan Plan 5 Yr
Capital Expenditure 2014/15 2015/16 2016/17 2017/18 2018/19 Total
£m £m £m £m £m £m
Property, Plant and equipment - other 5.4 5.6 6.5 5.8 3.2 26.4
Maintenance 0.8 0.8 0.5 0.8 0.8 3.7
ICT 2.7 3.6 2.0 2.0 4.0 14.3
Total 8.9 10.0 9.0 8.5 8.0 44.4

50
Statement of Position and Cashflow
Market Analysis and ContextDeclaration of Sustainability Strategic PlansSustainability and Strategic
OptionsFinancial Overview
The Statement of Financial Position remains relatively stable over the five year period.
The Trust is required to undertake a full property revaluation at the end of 2014/15 as part of the five year cycle as required by International Financial Reporting Standards. As there is a great deal of uncertainty as to property values at the time no impact has been included in the figures going forward.
The Trust will continue to manage working capital closely to ensure it meets its targets in the outer years. Control on the levels of accruals and provisions, as well as strong debt management will continue to play a key role in this.
The one change to the 2015/16 Balance Sheet has been the inclusion of a post audit adjustment relating to 2013/14 outturn which related to an additional £708k of Public Dividend Capital relating to the Technology Fund bid for “Safer Hospitals, Safer Wards” monies. It was not possible to adjust the 2014/15 Balance Sheet for this owing to the limitations of the Monitor model.
Delivery of the Trust’s CIP schemes remains a key component to the Trust achieving a robust cash and liquidity position. The plans are therefore to maintain this liquidity through a stable EBITDA (Earning Before Interest, Taxes, Deprecation and Amortization) and planned estate rationalisation through the sale of assets going forward.
Cashflow Plan Plan Plan Plan Plan
2014/15 2015/16 2016/17 2017/18 2018/19
£m £m £m £m £m
Operating Cash Flow 12.3 11.1 12.7 12.9 12.7
Increase (Decrease) in working capital 3.9 (2.6) (3.0) (0.0) (0.8)
Capital Financing (9.7) (9.8) (7.4) (7.8) (7.3)
Sale of Assets 4.8 - - 3.3 -
Interest Paid (1.0) (1.2) (1.2) (1.2) (1.2)
Interest Received - - - -
Dividend Paid/received (3.1) (2.3) (3.1) (3.1) (3.1)
Loan Repaid (1.1) (1.1) (1.1) (1.1) (1.1)
Net cash inflow/(outflow) 6.3 (5.8) (2.9) 3.1 (0.7)
Opening Balance 15.1 21.4 15.6 12.7 15.8
Closing Balance 21.4 15.6 12.7 15.8 15.1
Statement of Position Plan Plan Plan Plan Plan
2014/15 2015/16 2016/17 2017/18 2018/19
£m £m £m £m £m
Non-Current Assets 142.7 145.7 146.9 142.4 141.2
Current Assets 26.9 20.7 17.7 20.7 19.9
Current Liabilities (29.2) (26.8) (22.5) (22.4) (21.9)
Non-Current Liabilities (20.2) (17.9) (18.9) (17.7) (16.2)
TOTAL ASSETS EMPLOYED 120.1 121.8 123.2 122.9 122.9
Public Dividend Capital 80.6 81.3 81.3 81.3 81.3
Retained Earnings 13.8 14.8 16.2 15.9 15.9
Revaluation Reserve 25.7 25.7 25.7 25.7 25.7
TOTAL FUNDS EMPLOYED 120.1 121.8 123.2 122.9 122.9