Embed Size (px)
Citation preview

Norges Bank Watch 2013
An Independent Evaluation of Monetary Policy in Norway
Katrine Godding Boye Nordea Markets
Tommy Sveen BI Norwegian Business School
Centre for Monetary Economics BI Norwegian Business School
4 March 2013

Contents
Foreword
Executive summary
1. Introduction
2. Monetary policy in 2012
3. Monetary policy issues for Norges Bank
2

Foreword
Each year the Centre for Monetary Economics (CME) at The Department of Economics, BI
Norwegian School of Management appoints an independent group of experts to evaluate
monetary policy in Norway.
This year the committee consists of Katrine Godding Boye, Senior Analyst at Nordea Markets,
and Tommy Sveen, Professor of Economics at BI Norwegian Business School. The committee
is solely responsible for the report and the views therein. The report does not necessarily
represent the views of the CME or of its members.
The Ministry of Finance partly funds the Norges Bank Watch reports, which contain useful
information and analyses for the Ministry’s evaluation of monetary policy that is presented
each year in a White Paper to Parliament.
Oslo, 4 March 2013
Centre for Monetary Economics
Arne Jon Isachsen
3
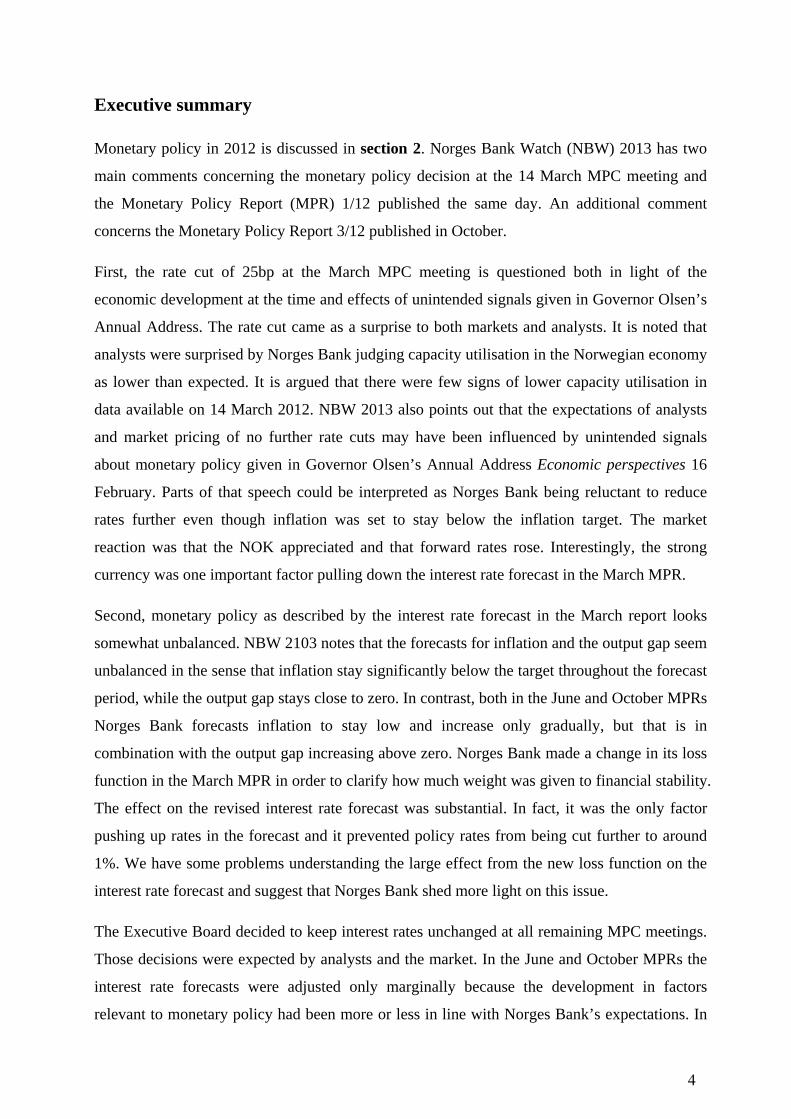
Executive summary
Monetary policy in 2012 is discussed in section 2. Norges Bank Watch (NBW) 2013 has two
main comments concerning the monetary policy decision at the 14 March MPC meeting and
the Monetary Policy Report (MPR) 1/12 published the same day. An additional comment
concerns the Monetary Policy Report 3/12 published in October.
First, the rate cut of 25bp at the March MPC meeting is questioned both in light of the
economic development at the time and effects of unintended signals given in Governor Olsen’s
Annual Address. The rate cut came as a surprise to both markets and analysts. It is noted that
analysts were surprised by Norges Bank judging capacity utilisation in the Norwegian economy
as lower than expected. It is argued that there were few signs of lower capacity utilisation in
data available on 14 March 2012. NBW 2013 also points out that the expectations of analysts
and market pricing of no further rate cuts may have been influenced by unintended signals
about monetary policy given in Governor Olsen’s Annual Address Economic perspectives 16
February. Parts of that speech could be interpreted as Norges Bank being reluctant to reduce
rates further even though inflation was set to stay below the inflation target. The market
reaction was that the NOK appreciated and that forward rates rose. Interestingly, the strong
currency was one important factor pulling down the interest rate forecast in the March MPR.
Second, monetary policy as described by the interest rate forecast in the March report looks
somewhat unbalanced. NBW 2103 notes that the forecasts for inflation and the output gap seem
unbalanced in the sense that inflation stay significantly below the target throughout the forecast
period, while the output gap stays close to zero. In contrast, both in the June and October MPRs
Norges Bank forecasts inflation to stay low and increase only gradually, but that is in
combination with the output gap increasing above zero. Norges Bank made a change in its loss
function in the March MPR in order to clarify how much weight was given to financial stability.
The effect on the revised interest rate forecast was substantial. In fact, it was the only factor
pushing up rates in the forecast and it prevented policy rates from being cut further to around
1%. We have some problems understanding the large effect from the new loss function on the
interest rate forecast and suggest that Norges Bank shed more light on this issue.
The Executive Board decided to keep interest rates unchanged at all remaining MPC meetings.
Those decisions were expected by analysts and the market. In the June and October MPRs the
interest rate forecasts were adjusted only marginally because the development in factors
relevant to monetary policy had been more or less in line with Norges Bank’s expectations. In
4
June, the rate forecast was lifted in the short end and lowered in the long end, while in October
the forecast was adjusted down both short term and long term, i.e. a postponement of the first
rate hike.
In MPR 3/12 a new factor was introduced, namely banks’ lending margins. During the autumn
of 2012, banks’ lending margins were higher than expected by Norges Bank and contributed to
a lower forecast for the key policy rate. The final remark concerns Norges Bank’s view on
banks’ lending rates. What happens to banks’ lending margins and Norges Bank’s view on the
margins will be of increasing importance going into 2013 with all the upcoming changes in
banking regulation. NBW encourages Norges Bank to publish its view and forecasts also for
banks’ lending rates (or margins) going forward.
In section 3 we follow up on previous Norges Bank Watch reports. The focus is on three
separate topics. First, in light of the new instrument for macro prudential policy, we discuss
both the interaction between monetary policy and financial stability and issues related to central
bank independence. Norges Bank will publish one report four times a year and that report will
discuss both monetary policy and financial stability. NBW 2013 welcomes the efforts made by
Norges Bank to coordinate monetary policy with the new instrument for macro prudential
policy, i.e. the countercyclical buffer requirement. Norges Bank should clarify whether and
how the instrument will affect the conduct of monetary policy. To strengthen the independence
of Norges Bank, the bank staff should not be required to inform the Ministry of Finance about
policy recommendations before the meeting of the Executive Board. Moreover, the situation of
the external board members should be strengthened.
Second, NBW 2013 comments on the new criteria for the interest rate path, which were
published by Norges Bank in the Monetary Policy Report 1/12. The aim of the new criteria was
to clarify the interaction between monetary policy and financial stability. We welcome the
clarification of the new criteria for the interest rate path. During the recent international turmoil,
Norges Bank took financial stability into account by supplementary assessments, and it was
unclear as to how much weight was given to financial stability (see e.g. NBW 2012). We
question whether the new loss function is appropriate in order to capture the risk of future
financial instability, however. NBW 2013 recommends that Norges Bank develops model-
based indicators that are more closely linked to financial stability than those currently used.
5

Third, and lastly, we shed new light on the use of CPIXE inflation as the main measure of core
inflation. The use of CPIXE inflation to measure core inflation has been criticised in several
NBW reports. We document that the real-time series of CPIXE inflation, which is used in
policy analysis, have important short-comings. It is shown that revisions in the trend growth of
energy prices are remarkably large and that the real time series are considerably more volatile
than the revised series. Importantly, we show that the reason for this might be related to how
the trend in energy prices is computed. NBW 2013 recommends that CPI-ATE inflation is used
as the main measure and that simple corrections are made based on 5 or 10 year averages of
changes in energy prices.
6

Introduction 1.
This report, Norges Bank Watch 2013, is an evaluation of the conduct of monetary policy in
Norway in 2012. In addition, the report follows up on some themes introduced in previous
Norges Bank Watch reports.
In section 2 we review and comment on Norges Bank’s monetary policy in 2012. Most
comments concern monetary policy in the first part of 2012, i.e. including the March Monetary
Policy Report. NBW 2013 has three main comments to make. First, the rate cut of 25bp at the
March MPC meeting is questioned both in light of the economic development at the time and
effects of unintended signals given in Governor Olsen’s Annual Address. Second, the interest
rate forecast in the March report looks somewhat unbalanced. And finally, we suggest that
Norges Bank should publish forecasts for banks’ lending rates.
In section 3 we follow up on previous Norges Bank Watch reports. We focus on three topics.
First, in light of the new instrument for macro prudential policy, we discuss both the interaction
between monetary policy and financial stability and issues related to central bank independence.
Second, we comment on the new criteria for the interest rate path, which were published by
Norges Bank in the Monetary Policy Report 1/2012. The aim of the new criteria was to clarify
the interaction between monetary policy and financial stability. Third, and lastly, we shed new
light on the use of CPIXE inflation as the main measure of core inflation.
The committee met with the Ministry of Finance on 28 November 2012, and with Norges Bank
on 7 December 2012. We wish to thank Norges Bank for supplying us with useful data and
Hilde Christine Bjørnland, Eric Bruce, Steinar Juel, Arne Jon Isachsen and Erling Steigum for
constructive comments.
7

Monetary policy in 2012 2.
At the beginning of 2012 policy rates stood at 1.75% after a 50bp cut at the December
monetary policy meeting (MPC meeting). The development in financial markets deteriorated
significantly at the end of 2011 and made the Executive Board cut rates by a full 50bp at the
December meeting despite the interest rate forecast from the October 2011 Monetary Policy
Report (MPR) signalling unchanged policy rates at 2.25% until August 2012 and then a gradual
rise.
Even though the situation in financial markets improved from the turn of the year, the
economic outlook especially in Europe had deteriorated, expected policy rates abroad had
fallen further, the NOK was strong and inflation in Norway was very low. In addition, money
market premiums stayed elevated in the first months of 2012. All these factors contributed to a
sharp downward adjustment of Norges Bank’s interest rate forecast in the March 2012 MPR.
The board even decided to cut rates again by 25bp to 1.50 % at the March MPC meeting. The
rate cut came as a surprise to markets and analysts. At the same meeting, Norges Bank
announced a change in the bank’s loss function which was intended to clarify how much
weight the board gives to financial stability in monetary policy.
Chart 1: Sight deposit rate and Norges Bank’s forecasts
Source: Nordea Markets and Reuters Ecowin
08 09 10 11 12 13 14 151.0
1.5
2.0
2.5
3.0
3.5
4.0
4.5
5.0
5.5
6.0
1.0
1.5
2.0
2.5
3.0
3.5
4.0
4.5
5.0
5.5
6.0%
October 2012
October 2011March 2012
%
June 2012
8
Policy rates were kept unchanged at 1.50% during the remainder of 2012. In the June and
October MPRs the interest rate forecasts were adjusted only marginally as the development in
factors relevant to monetary policy had been more or less in line with Norges Bank’s
expectations. In June, the rate forecast was lifted in the short end and lowered in the long end,
while in October the forecast was adjusted down both short and long term, implying a
postponement of the first rate hike.
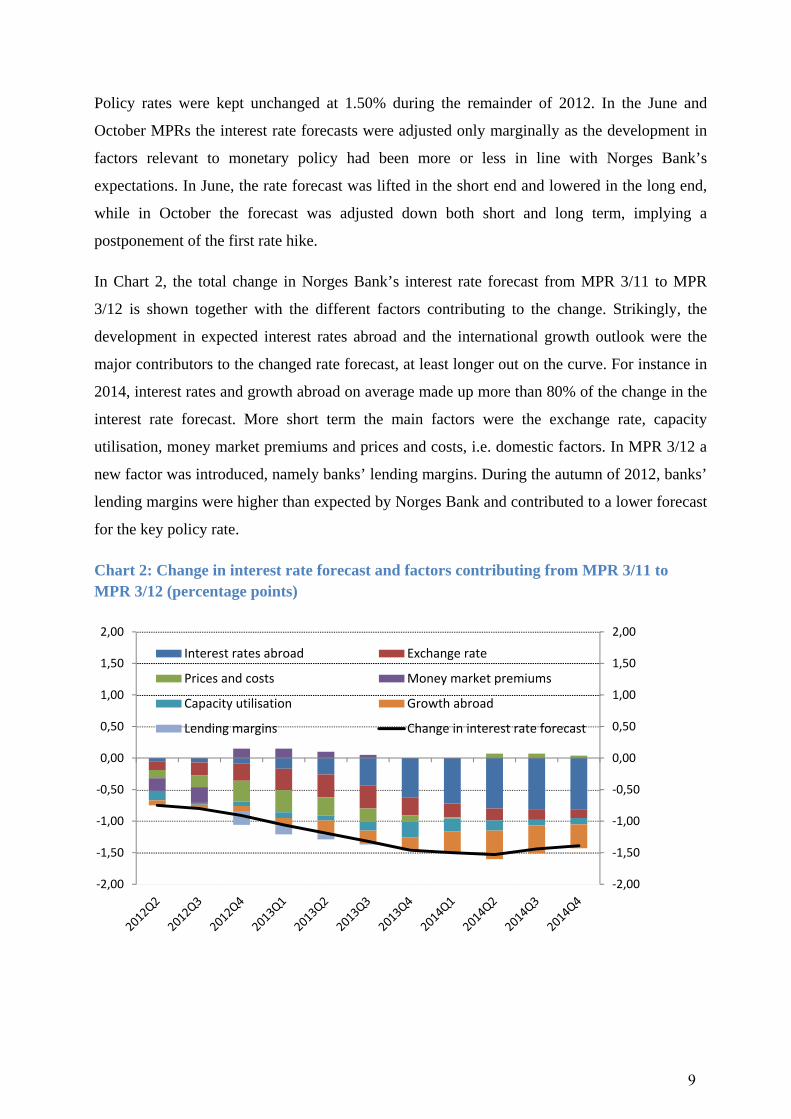
In Chart 2, the total change in Norges Bank’s interest rate forecast from MPR 3/11 to MPR
3/12 is shown together with the different factors contributing to the change. Strikingly, the
development in expected interest rates abroad and the international growth outlook were the
major contributors to the changed rate forecast, at least longer out on the curve. For instance in
2014, interest rates and growth abroad on average made up more than 80% of the change in the
interest rate forecast. More short term the main factors were the exchange rate, capacity
utilisation, money market premiums and prices and costs, i.e. domestic factors. In MPR 3/12 a
new factor was introduced, namely banks’ lending margins. During the autumn of 2012, banks’
lending margins were higher than expected by Norges Bank and contributed to a lower forecast
for the key policy rate.
Chart 2: Change in interest rate forecast and factors contributing from MPR 3/11 to MPR 3/12 (percentage points)
‐2,00
‐1,50
‐1,00
‐0,50
0,00
0,50
1,00
1,50
2,00
‐2,00
‐1,50
‐1,00
‐0,50
0,00
0,50
1,00
1,50
2,00
Interest rates abroad Exchange rate
Prices and costs Money market premiums
Capacity utilisation Growth abroad
Lending margins Change in interest rate forecast
9
Due to rather different situations and themes through 2012 the discussion of monetary policy is
split in three parts with the first covering the period up to and including March MPR, the
second up to and including the June MPR and the third spans from July and until end 2012.
2.1 January – March: Unexpected rate cut and clarification of weight given to
financial stability
2.1.1 Big downward revision of Norges Bank’s interest rate forecast
The Executive Board decided to reduce policy rates by 25bp to 1.50% at the first monetary
policy meeting in 2012 on 14 March. The rate cut came as a surprise to both markets and
analysts. 11 out of 13 analysts surveyed by Reuters expected unchanged policy rates ahead of
the 14 March MPC meeting, while 2 analysts expected a rate cut of 25bp. A sharp weakening
of the NOK and a drop in money market rates clearly indicate that the decision came as
surprise.
From the “Executive Board’s assessment” in the MPR we find the reasoning behind the rate
decisions at both the MPC meetings in December 2011 and March 2012. In December 2011,
the Executive Board was concerned by the intensified turbulence and greater risk of another
recession in Europe. As stated in the assessment:
“The Executive Board decided to lower the key policy rate by 0.5 percentage point to 1.75% to
guard against an economic setback and even lower inflation.”
Cleary, the Board was worried about the consequences of the turmoil related to the sovereign
debt crisis in the Euro area and found it right to deviate from the interest rate forecast from the
October 2011 MPR and cut policy rates by as much as 50bp.
Coming to March 2012, the situation had changed slightly. The financial turbulence was much
less intense due to the European Central Bank’s (ECB) unlimited supply of cheap long-term
liquidity loans (3 years maturity) to Euro area banks in two big auctions in late December and
in late February. The loans from the ECB led to a reduction in risk premiums on bank funding
and on government bonds. Norwegian money market premiums had also come down slightly,
but were still at a higher level than expected by Norges Bank back in October 2011. The
Executive Board pointed out that despite the improvement in financial markets, the uncertainty
was still very high and the growth outlook for Norway’s trading partners had weakened.
10
The NOK exchange rate was in March significantly stronger, about 2.5%, than Norges Bank’s
forecast in the October 2011 MPR. Expected policy rates abroad were lower, implying
exceptionally low rates for a long time. Both the exchange rate and rates abroad were
arguments for a downward revision of the interest rate forecast compared to the October MPR.
The domestic economy, however, continued to show strong growth in line with Norges Bank’s
forecast and unemployment had dropped while Norges Bank had expected unchanged
unemployment. Private consumption showed some weakness during the second half of 2011,
but the January figures pointed to a strong rebound. Norges Bank, however, revised down the
output gap (both the current and the forecast) which also led do a downward revision of the
interest rate forecast. Lastly, inflation figures had been slightly lower than expected by Norges
Bank in the October 2011 MPR.
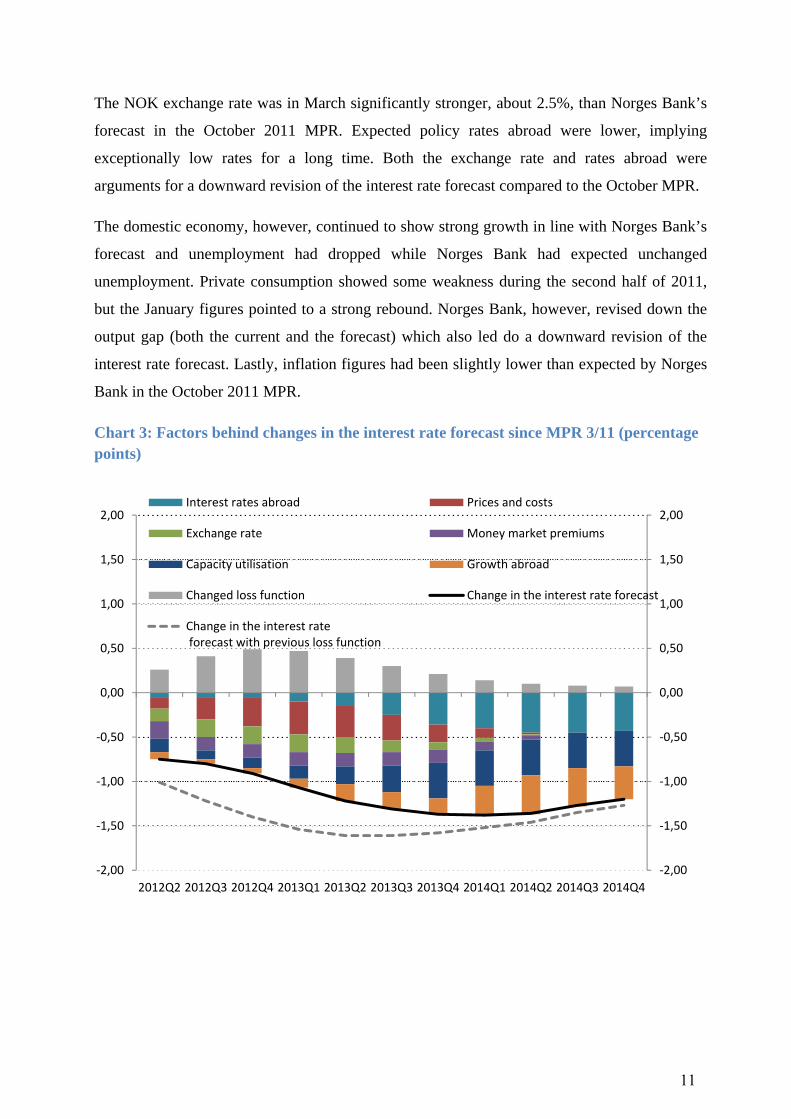
Chart 3: Factors behind changes in the interest rate forecast since MPR 3/11 (percentage points)
‐2,00
‐1,50
‐1,00
‐0,50
0,00
0,50
1,00
1,50
2,00
‐2,00
‐1,50
‐1,00
‐0,50
0,00
0,50
1,00
1,50
2,00
2012Q2 2012Q3 2012Q4 2013Q1 2013Q2 2013Q3 2013Q4 2014Q1 2014Q2 2014Q3 2014Q4
Interest rates abroad Prices and costs
Exchange rate Money market premiums
Capacity utilisation Growth abroad
Changed loss function Change in the interest rate forecast
Change in the interest rate forecast with previous loss function
11
The chart above shows the contributions from different factors to the change in Norges Bank’s
interest rate forecast. Lower growth abroad, higher money market premiums, stronger exchange
rate, lower rates abroad, lower inflation as well as a lower forecast for wage growth and finally
lower capacity utilisation in the domestic economy all pulled down the new interest rate
forecast. The only factor pulling the rate forecast up was “changed loss function” which will be
discussed in detail below and in section 3. The factors “strong exchange rate” and “lower
capacity utilisation” will be discussed further below.
The downward adjustment of the interest rate forecast was substantial, but that came as no
surprise as interest rates had already been cut 50bp at the December 2011 MPC meeting. But
the adjustment was so big that it justified another rate cut of 25bp at the March MPC meeting
and that surprised the market as well as analysts.
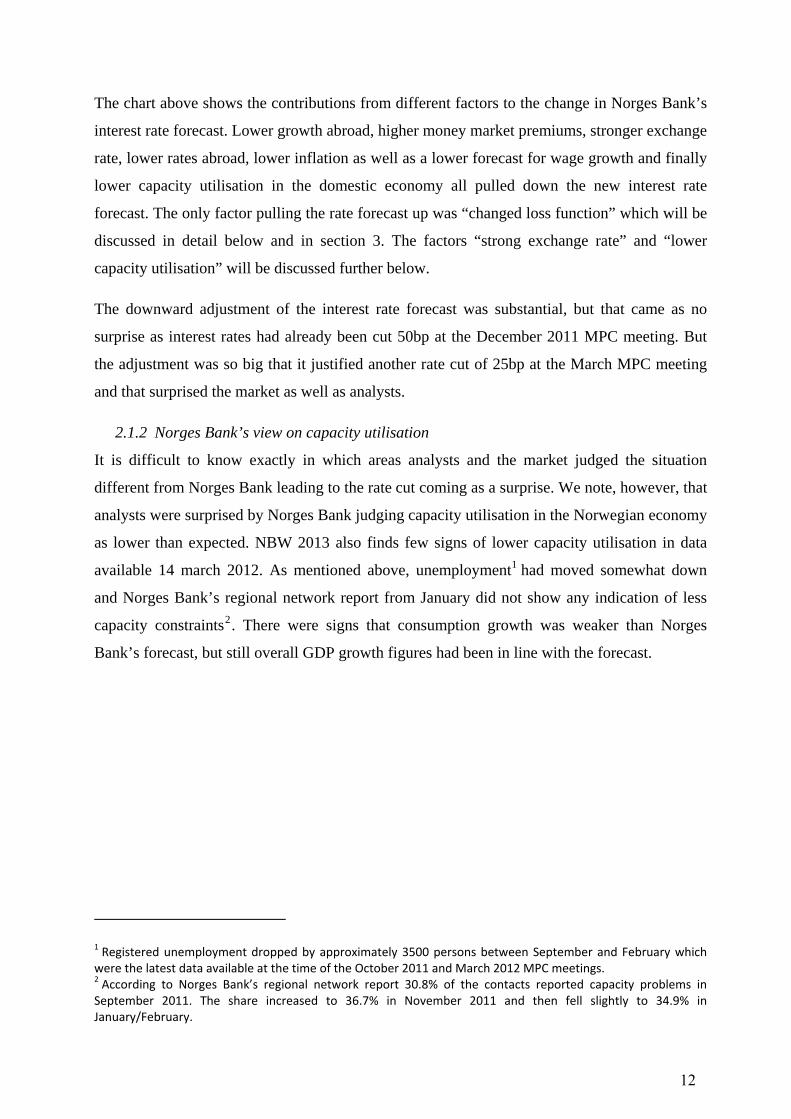
2.1.2 Norges Bank’s view on capacity utilisation
It is difficult to know exactly in which areas analysts and the market judged the situation
different from Norges Bank leading to the rate cut coming as a surprise. We note, however, that
analysts were surprised by Norges Bank judging capacity utilisation in the Norwegian economy
as lower than expected. NBW 2013 also finds few signs of lower capacity utilisation in data
available 14 march 2012. As mentioned above, unemployment1 had moved somewhat down
and Norges Bank’s regional network report from January did not show any indication of less
capacity constraints2. There were signs that consumption growth was weaker than Norges
Bank’s forecast, but still overall GDP growth figures had been in line with the forecast.
1 Registered unemployment dropped by approximately 3500 persons between September and February which were the latest data available at the time of the October 2011 and March 2012 MPC meetings. 2 According to Norges Bank’s regional network report 30.8% of the contacts reported capacity problems in September 2011. The share increased to 36.7% in November 2011 and then fell slightly to 34.9% in January/February.
12
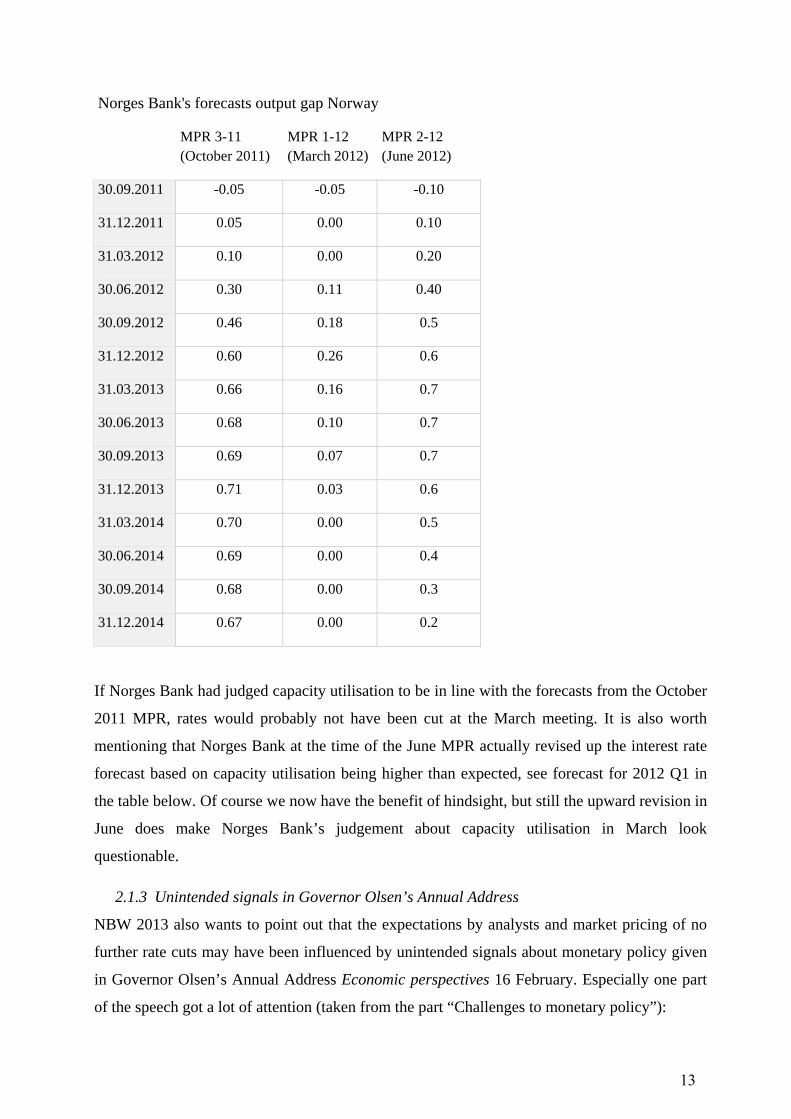
Norges Bank's forecasts output gap Norway
MPR 3-11 (October 2011)
MPR 1-12 (March 2012)
MPR 2-12 (June 2012)
30.09.2011 -0.05 -0.05 -0.10
31.12.2011 0.05 0.00 0.10
31.03.2012 0.10 0.00 0.20
30.06.2012 0.30 0.11 0.40
30.09.2012 0.46 0.18 0.5
31.12.2012 0.60 0.26 0.6
31.03.2013 0.66 0.16 0.7
30.06.2013 0.68 0.10 0.7
30.09.2013 0.69 0.07 0.7
31.12.2013 0.71 0.03 0.6
31.03.2014 0.70 0.00 0.5
30.06.2014 0.69 0.00 0.4
30.09.2014 0.68 0.00 0.3
31.12.2014 0.67 0.00 0.2
If Norges Bank had judged capacity utilisation to be in line with the forecasts from the October
2011 MPR, rates would probably not have been cut at the March meeting. It is also worth
mentioning that Norges Bank at the time of the June MPR actually revised up the interest rate
forecast based on capacity utilisation being higher than expected, see forecast for 2012 Q1 in
the table below. Of course we now have the benefit of hindsight, but still the upward revision in
June does make Norges Bank’s judgement about capacity utilisation in March look
questionable.
2.1.3 Unintended signals in Governor Olsen’s Annual Address
NBW 2013 also wants to point out that the expectations by analysts and market pricing of no
further rate cuts may have been influenced by unintended signals about monetary policy given
in Governor Olsen’s Annual Address Economic perspectives 16 February. Especially one part
of the speech got a lot of attention (taken from the part “Challenges to monetary policy”):
13

“Monetary policy is the first line of defence in demand management. Norges Bank still has
room for manoeuvre in interest rate setting – in both directions.
The question nonetheless remains of whether it is desirable to use monetary policy to
accelerate the pace of inflation when the countries around us are in a recession. Even if the
krone depreciates somewhat, relatively high cost growth in Norway that could quicken the pace
of inflation might lead to a further deterioration in competitiveness. This cannot be the way to
go.” (NBW 2013’s highlight).
The wording in the speech was judged as quite hawkish by both the market and analysts. It
could be interpreted as Norges Bank (or at least Governor Olsen) being very reluctant to reduce
rates further (“use monetary policies”) even though inflation was set to stay below the inflation
target.
The market reaction was very clear, the exchange rate appreciated and forward rates rose after
the speech3. The speech may as such have been an important reason behind the general
expectations that further rate cuts were quite unlikely. It obviously turned out that Norges Bank
did not intend to give such a signal, since policy rates were cut after all. It is not clear what kind
of message Governor Olsen wanted to give by the statement4. Anyway, the misperception by
the market and analysts is a sign that Norges Bank’s communication was unclear.
The problem was that the wording in the speech was remarkably clear and strong and could
easily be perceived as hawkish. In our opinion, Norges Bank should have realised that there
was a high probability that the speech could be interpreted as hawkish. The wording could
either have been less strong or there should have been a wider discussion of the possible
implications of the statement. On 21 and 27 February, just days after the Annual Address,
Governor Olsen commented on the exchange rate, saying that the exchange rate was an
important factor in setting policy rates5. These statements can be viewed as attempts to play
down the hawkish signals from the Annual Address.
3 On 17 February, the day after the Annual Address, import weighted NOK (I‐44) traded 1.1% stronger and 3m FRA (1 position) 6bp higher than on 16 February. 4 One possibility is that the Governor wanted to signal the upcoming change in the board’s loss function, see below and section 3. If that was the case, the Governor should have elaborated more on the subject to avoid confusion. Another possibility is that he was defending that rates were not even lower, given the low level of inflation. 5 The actual speeches were not published, but Reuters reported from the speeches.
14

A further implication of the unclear communication in the Annual Address is that it led to an
appreciation of the NOK which was based on misperceived signals (see Chart 4), a
strengthening of the NOK which actually ended up being an important factor behind the
decision to cut rates and revise down the interest rate forecast at the March MPC meeting6. In
the March MPR we find that Norges Bank’s forecast for the import-weighted NOK (I-44) was
86.6 on average in Q2, only slightly weaker than at the time of the publication of the report,
indicating that Norges Bank viewed the NOK strengthening not only as a temporary effect of
misperceived signals in the Annual Address. After rates were cut 14 March I-44 in fact
weakened considerably and ended up even weaker than Norges Bank’s forecast in Q2 (I-44 was
on average 87.5 in Q2).
Chart 4: Import-weighted NOK (I-44)
6 Green bars in Chart 3. The effect on the interest rate forecast from the exchange rate was 14bp in Q2 2012.
15

2.1.4 Change in the Executive Board’s loss function
As mentioned above, Norges Bank also made a change in its loss function in the March MPR
which affected the revision of the interest rate forecast. The change in loss function came as a
consequence of a new criterion for an appropriate interest rate path. It reads:
“3. Monetary policy is robust: The interest rate should be set so that monetary policy mitigates
the risk of a build-up of financial imbalances, and so that acceptable developments in inflation
and output are also the likely outcome under alternative assumptions about the functioning of
the economy.”
The new criterion explicitly states that monetary policy gives weight to the risk of financial
instability. In the new loss function, a higher weight is given to the output gap and a new term
is included, implying a loss when key policy rates are deviating from a “normal level” of key
policy rates7. The term implying a loss when key rates deviate from simple monetary policy
rules is no longer included in the loss function8.
With the new loss function, Norges Banks tries to clarify its stand regarding how much weight
is given to financial stability. As remarked by NBW 2012, it was highly unclear how much
weight was given to financial stability in 2011. Even though the new loss function has elements
of giving weight to financial stability, it does so in a very indirect way. Neither the level of the
output gap nor the deviation from normal interest rates says anything about possible imbalances
present in the economy or if imbalances actually are building up. For a further discussion see
section 3.
Anyway, the change in loss function had a significant effect on the new interest rate forecast in
the March MPR. The factor “changed loss function” was the only factor pulling rates up in the
forecast and the effect was quite substantial9. It prevented policy rates from being cut further
down to around 1%. NBW 2013 has some problems understanding the large effect from the
new loss function on the interest rate forecast and suggests that Norges Bank shed more light
on this issue.10
7It is indicated by Norges Bank to be approximately 4% for the time being. 8 A more detailed description of the new loss function is given in section 3. 9 The factor “changed loss function” amounted to nearly 50bp at the most in 2012 Q4. 10 The differences in impulse responses to representative shocks with old and new loss function given in Lund and Robstad (2012) are very small and do not offer any explanation of how the effects on the interest rate forecast were so large in MPR 1/12.
16
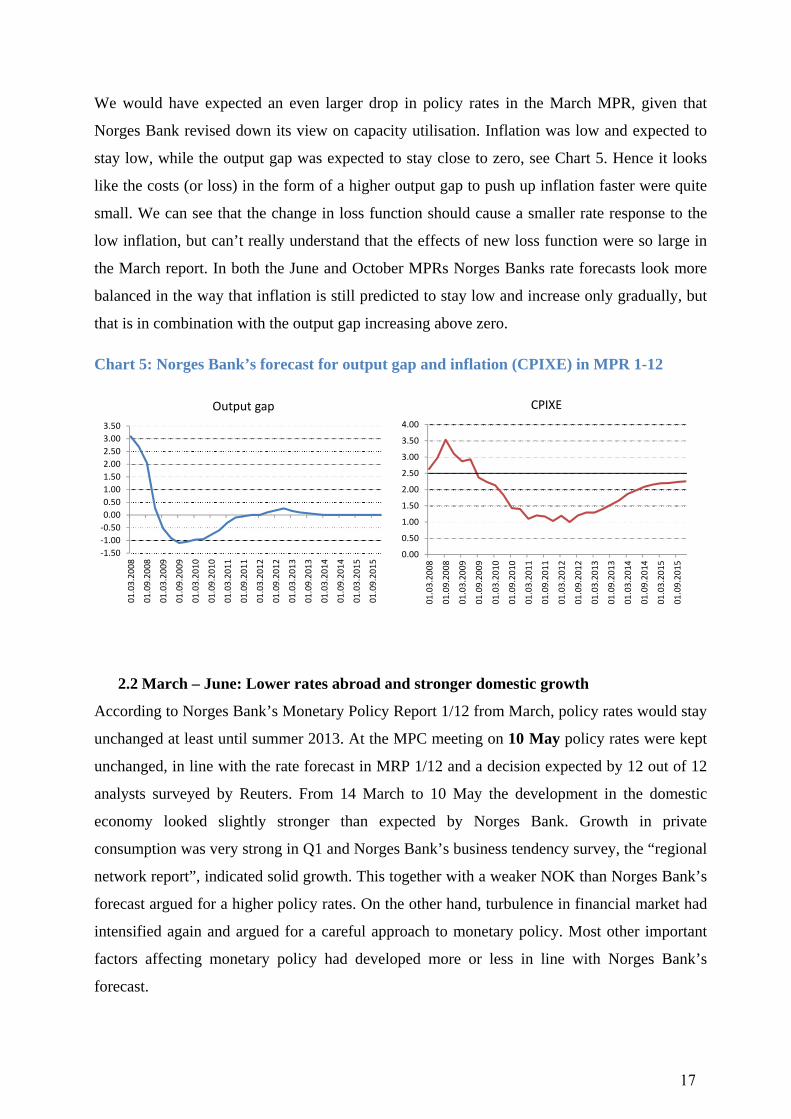
We would have expected an even larger drop in policy rates in the March MPR, given that
Norges Bank revised down its view on capacity utilisation. Inflation was low and expected to
stay low, while the output gap was expected to stay close to zero, see Chart 5. Hence it looks
like the costs (or loss) in the form of a higher output gap to push up inflation faster were quite
small. We can see that the change in loss function should cause a smaller rate response to the
low inflation, but can’t really understand that the effects of new loss function were so large in
the March report. In both the June and October MPRs Norges Banks rate forecasts look more
balanced in the way that inflation is still predicted to stay low and increase only gradually, but
that is in combination with the output gap increasing above zero.
Chart 5: Norges Bank’s forecast for output gap and inflation (CPIXE) in MPR 1-12
2.2 March – June: Lower rates abroad and stronger domestic growth
According to Norges Bank’s Monetary Policy Report 1/12 from March, policy rates would stay
unchanged at least until summer 2013. At the MPC meeting on 10 May policy rates were kept
unchanged, in line with the rate forecast in MRP 1/12 and a decision expected by 12 out of 12
analysts surveyed by Reuters. From 14 March to 10 May the development in the domestic
economy looked slightly stronger than expected by Norges Bank. Growth in private
consumption was very strong in Q1 and Norges Bank’s business tendency survey, the “regional
network report”, indicated solid growth. This together with a weaker NOK than Norges Bank’s
forecast argued for a higher policy rates. On the other hand, turbulence in financial market had
intensified again and argued for a careful approach to monetary policy. Most other important
factors affecting monetary policy had developed more or less in line with Norges Bank’s
forecast.
‐1.50
‐1.00
‐0.50
0.00
0.50
1.00
1.50
2.00
2.50
3.00
3.50
01.03.2008
01.09.2008
01.03.2009
01.09.2009
01.03.2010
01.09.2010
01.03.2011
01.09.2011
01.03.2012
01.09.2012
01.03.2013
01.09.2013
01.03.2014
01.09.2014
01.03.2015
01.09.2015
Output gap
0.00
0.50
1.00
1.50
2.00
2.50
3.00
3.50
4.0001
.03.2008
01.09.2008
01.03.2009
01.09.2009
01.03.2010
01.09.2010
01.03.2011
01.09.2011
01.03.2012
01.09.2012
01.03.2013
01.09.2013
01.03.2014
01.09.2014
01.03.2015
01.09.2015
CPIXE
17

Going into June the mixed picture continued to dominate with on the one hand a strong
domestic economy and on the other turbulence and a weak growth outlook abroad. At the MPC
meeting 20 June the Executive Board decided to leave interest rates unchanged, in line with the
interest rate forecast from the March MPR. The decision was expected by 12 out of 12 analysts
surveyed by Reuters. Norges Bank also published an updated Monetary Policy Report
including a new policy rate forecast.
Compared to the sharp revision of the interest rate forecast in March there were only minor
revisions in June. Indications of stronger growth in the domestic economy as well as more
enterprises reporting increasing capacity problems (Norges Bank’s regional network report) led
to an upward revision of Norges Bank’s forecast for capacity utilisation and was one of the
main factors pulling up the interest rate forecast, see Chart 6. In the Executive Board’s
assessment it was stated that “capacity utilisation is now projected to be a little above normal”.
Also pulling in the direction of higher policy rates was a weaker NOK than expected by Norges
Bank and an upward adjustment of the wage growth estimate.
As mentioned above there were factors pulling in the direction of lower rates as well. The
largest contribution on the downside was another drop in expected policy rates abroad. Given
that key policy rates were already close to zero, the drop in rates reflected an expectation of
rates staying near zero even longer. Money market premiums had stayed high approximately as
expected by Norges Bank, but the projection for premiums was adjusted up going forward,
pulling down policy rates. Finally, there was a marginal effect from lower growth prospects
abroad. The degree of uncertainty related to the Euro area crisis was very high in June with
yield spreads on Spanish vs. German government bonds reaching record levels just days before
the MPC meeting. The increased uncertainty did not lead to a sharp downward revision of
growth prospects abroad, probably because the view on growth in the Euro area in the March
MPR was already very pessimistic compared to other forecasters like the IMF and OECD.
18

Chart 6: Factors behind changes in the interest rate forecast since MPR 1/12 (percentage points)
In total, the new interest rate forecast was adjusted slightly up short-term and slightly down
long-term. The adjustment entailed that the first hike in policy rates was moved forward
approximately half a year to the end of 2012 from summer 2013 in the March MPR.
2.3 July – December: Less turmoil and sharply lower money market premiums
During the summer important events took centre regarding the Euro-area crisis. Yield spreads
between Spanish and German government bonds increased further after the June MPC meeting
and reached new record highs at the end of July. But in a speech on 26 July 2012 the ECB
president Mario Draghi made a pledge: “Within our mandate, the ECB is ready to do whatever
it takes to preserve the euro. And believe me, it will be enough”11. The speech had almost an
instant effect on Spanish and Italian spreads which came down substantially the following days.
At the ECB meeting on 6 September it turned out that the ECB was ready to buy unlimited
amounts of shorter term government bonds from countries applying for loans from the EU
crisis fund EFSF/ESM. The pledge from ECB turned out to work as an effective backstop in
11 Verbatim of the remarks made by Mario Draghi, President of the European Central Bank at the Global Investment Conference in London, 26 July 2012 (www.ecb.int)
‐1,00
‐0,80
‐0,60
‐0,40
‐0,20
0,00
0,20
0,40
0,60
0,80
1,00
‐1,00
‐0,80
‐0,60
‐0,40
‐0,20
0,00
0,20
0,40
0,60
0,80
1,00Capacity utilisation Exchange rate
Prices and costs Interest rates abroad
Money market premiums Growth abroad
Change in the interest rate forecast
19

the European government bond markets and spreads continued to narrow gradually through the
autumn.
Chart 7: 3M money markets rates (and Norges Bank’s forecasts) and policy key rates
At the MPC meeting on 29 August the Executive Board left policy rates unchanged in line with
the interest rate forecast from the June MPR and as expected by 12 out of 12 analysts surveyed
by Reuters. Again, there were factors pulling in different directions. A stronger NOK and lower
inflation figures than expected by Norges Bank were the only arguments for a more careful
approach to the interest rate setting. The only argument for higher policy rates was a significant
and unexpected drop in money market premiums, see Chart 7. 3-month money market rates
stood at 2.05% at the time of the MPC meeting while Norges Bank’s forecast implied money
market rates at about 2.35%. Apart from those factors, most of the development had been in
line with Norges Bank’s forecasts.
The Executive Board decided at the MPC meeting on 31 October to leave policy rates
unchanged at 1.50%, also this time in line with the interest rate forecast in the June MPR and
expected by 13 out of 13 analysts surveyed by Reuters. The interest rate forecast in the new
Monetary Policy Report was revised slightly down with the first rate hike postponed by roughly
6 months. The forecast implied that the first rate hike most likely would be done in either Q2 or
Q3 2013, i.e. almost the same timing as in the forecast from the March MPR.
20
Between the August MPC meeting and the October MPC meeting, there were no major
surprises to Norges Bank. Turmoil in financial markets related to the Euro-area crisis abated
further, but growth indicators from Europe were very weak (though not weaker than Norges
Bank’s rather pessimistic view). Money markets premiums continued to drop in September and
October and were at the time of the MPC meeting about 40bp lower than Norges Bank’s
forecast from the June MPR. All else equal, according to Norges Bank’s reaction function since
the financial crisis 2008, this should have been translated into 40bp higher key policy rates. The
drop in the interest rate premiums was actually bigger than the contribution from traditional
factors pulling the other direction, the exchange rate being stronger, interest rates abroad lower
and inflation lower than Norges Bank’s forecasts in the June MPR. But in the October MPR a
new factor came into consideration for monetary policy: banks’ lending margins. As shown in
Chart 8, the factor “lending margins” had quite a significant effect on the change in the interest
rate forecast and actually prevented a rise in policy rates in Q4.
It was not the first time Norges Bank was occupied by the development in banks’ lending rates,
but it was the first time this was stated explicitly as a separate factor influencing monetary
policy rates. Prior to the financial crisis in 2008, banks usually changed lending rates when
Norges Bank changed policy rates since the spread between money market rates and policy
rates was almost constant at 25bp. Since 2007-2008, when money market spreads started to
increase, banks started to change lending rates when money market rates moved significantly,
not necessarily due to a rate change from Norges Bank. To Norges Bank, this change in the
transmission channel led Norges Bank to adjust the policy rate in accordance with the change
in money market premiums. Last autumn there was another change in the transmission channel:
banks did not lower lending rates despite the sharp drop in money market rates. Banks’ funding
costs (credit margins on covered bonds and senior financial bonds) were also reduced, but
banks still did not lower the lending rates. Possible reasons for the changed behaviour may be
tighter regulation and higher capital requirements as well as a catch-up effect after lending
margins were squeezed from end 2011 and into 2012 due to high funding costs.
Even though Norges Bank quantified the effect of higher lending margins than expected in the
overview of factors behind the change in interest rate forecast (see Chart 8), it did not publish
forecasts for banks’ lending rates or lending margins. As lending margins was such an
important factor influencing monetary policy at the October MPC meeting/ MPR and will be
important also in 2013 (in relation to effects from new macro prudential instruments and other
21

regulatory changes), we suggest that Norges Bank start to publish forecasts also for banks’
lending rates.
Chart 8: Factors behind changes in the interest rate forecast since MPR 2/12 (percentage points)
At the final MPC meeting 19 December the Executive Board again decided to keep policy
rates unchanged at 1.50%. That was in line with the interest rate forecast from October MPR
and a decision expected by 12 out of 12 analysts surveyed by Reuters.
In the weeks before the December MPC the NOK had appreciated further and was on 19
December about ¾ % stronger than Norges Bank’s forecast in the October MPR. Apart from
that, most factors important to the interest rate setting had developed in line with Norges
Bank’s forecasts. In Europe, the situation continued to be characterised by less financial
turmoil, but considerable weakness in economic indicators. Growth in the Norwegian economy
on the other hand appeared to be strong and as Norges Bank said in the press statement
“Unemployment is low and capacity utilisation is above a normal level”. Interestingly, in the
Executive Board’s general assessment, it was stated that “the import-weighted krone (I-44) has
on average been approximately in line with that projected in the October 2012 Monetary Policy
Report”. That could have been a signal that the NOK strengthening had not lasted long enough
‐1,00
‐0,80
‐0,60
‐0,40
‐0,20
0,00
0,20
0,40
0,60
0,80
1,00
‐1,00
‐0,80
‐0,60
‐0,40
‐0,20
0,00
0,20
0,40
0,60
0,80
1,00
Money market premiums Lending margins
Interest rates abroad Prices
Exchange rate Change in the interest rate forecast
22

to influence the interest rate setting significantly. On the other hand, when evaluating the
development in the exchange rate in Monetary Policy Reports we have the impression that
Norges Bank often look at shorter time periods and not the average for the last two months.
Varying the time span referred to when evaluating the development in the exchange rate creates
uncertainty around Norges Bank’s response to exchange rate developments.
2.4 NBW view
When looking at monetary policy in 2012 there is a clear difference between the first quarter of
the year and the rest. NBW 2013 has pointed at several issues in the period up until and
including the March MPC meeting, while during the remainder of the year there was less to
comment on.
Firstly, we question the 25bp cut in policy rates at the March MPC meeting. One reason is that
the downward revision of the domestic output gap which Norges Bank made in the March 2012
MPR does not look fully justified by the economic development at the time. The other reason is
related to unintended signals given by Governor Olsen in his Annual Address that policy rates
would not be cut further. The signals led to a substantial strengthening of the NOK which again
ended up as one of the factors contributing to the downward revision of the interest rate
forecast and the rate cut at the March meeting.
The second issue concerns the new loss function which was introduced at the March PMC
meeting. Our view on the new loss function is given in section 3, but the actual effects on
monetary policy from the change are discussed in this section. Given that Norges Bank actually
revised down the output gap, we would have expected an even larger downward revision of the
interest rate forecast. The reason is that the output gap was expected to stay close to zero, while
inflation still was very low and expected to stay low. Probably the relatively small response in
interest rates had to do with the change in loss function, but we cannot see why the contribution
was so large.
The final remark concerns the October MPR and Norges Bank’s view on banks’ lending rates.
In the October MPR there was for the first time a separate effect on the interest rate forecast
from banks’ lending margins. What happens to banks’ lending margins and Norges Bank’s
view on the margins will be of increasing importance going into 2013 with all the upcoming
changes in banking regulation. NBW 2013 encourages Norges Bank to publish its view and
forecast also for banks’ lending rates (or margins) going forward.
23

Monetary policy issues for Norges Bank 3.
In this section we follow up previous NB Watch reports, with particular focus on some of the
topics in NBW 2012. That report concentrated on two important issues related to monetary
policy and central banking, namely the links between monetary policy and financial stability,
and the independence of the central bank. In addition, we will discuss the choice of measure for
the core rate of inflation, which has been a topic in several NBW reports, most recently in 2011.
NBW 2012 discusses the links between monetary policy and financial stability in three steps.
The first step concerns the question of whether and how the monetary policy transmission
mechanism is affected by the degree of financial stability. The second step concerns whether or
not monetary policy is to be conducted independently of concerns of financial stability. The
third and last step concerns how Norges Bank’s responsibility for financial stability needs to be
coordinated with policies carried out by other authorities. We will not discuss each of these
steps in detail. Instead we will concentrate on recent developments as far as the new policy
instrument for macroprudential policy is concerned and on the new criteria for interest rate
setting. We turn to this next.
3.1 The new policy instrument
In the autumn of 2012 it was decided that in the future Norges Bank will provide the Ministry
of Finance with the decision basis and give advice on countercyclical buffer requirements for
banks.12 This is in accordance with the majority suggestion in a report to the Ministry of
Finance from a working group with members from the Ministry, Norges Bank and
Finanstilsynet (the Norwegian financial supervisory authority). The majority also suggested
that Norges Bank should be responsible for the new tool, but the Ministry of Finance decided
not to delegate the decision on the buffer. In a report from a Nordic working group on
macroprudential policy, the following reason was given: “The Ministry envisages itself taking
on the role as designated authority until some experience with this new tool is gained, while
Norges Bank will be given primary responsibility for developing the basis for the counter-
cyclical capital buffer requirement decision.”
In order to prepare for the new task, Norges Bank has decided to merge its triannual monetary
policy report with its biannual financial stability report. The new report will come out four
times each year, and the aim of this change is to coordinate the two policy instruments.
12 The regulatory framework will be in place in the autumn of 2013 at the earliest.
24

The objective of monetary policy is to stabilise inflation around the inflation target (the
inflation gap). In Norway, as in many other countries, monetary policy is described by flexible
inflation targeting, where stabilising the inflation gap is balanced against stabilising real
economic activity (the output gap, say). Norges Bank describes this trade-off in its criteria for
an appropriate interest rate path. The instrument to achieve the trade-off is the key policy rate,
but also the central bank’s communication with the market. The latter is the main reason for
publishing interest rate forecasts, which is done by only a few other central banks. The
objective of macroprudential policy is different, namely to promote financial stability. This is
normally done using supervision and regulation. The new instrument – the countercyclical
buffer requirement – falls into this category. It is important to note, however, that even though
the two policies have different objectives and different instruments, they are by no means
independent. Clearly, decreasing the nominal interest rate and keeping it low will lead to
increased borrowing that might imply a build-up of financial imbalances; and increasing the
interest rate and keeping it high might lead to many firm bankruptcies that affect bank losses
and ultimately financial stability.
Viewed in isolation, the buffer requirement will tend to increase interest rates to households
and firms, and it seems natural to assume that Norges Bank to some extent will try to
counteract this with a reduction in the key policy rate. It is unclear how important this will be in
practice, and it will ultimately depend on how much the buffer requirement affects the
prospects of interest rates, inflation and capacity utilisation. Monetary policy may also be
changed through the effects on financial stability. In its March 2012 issue of the Monetary
Policy Report, Norges Bank shows the effect of the changes in the loss function, which
presumably captures the concern for financial stability in interest rate setting. Looking at those
graphs suggests that key policy rates would have fallen by up to 50 bp in some periods of the
forecast if there were no financial stability concerns. Hence, with new macroprudential policies
in place, one could easily envisage important changes in actual policy, since there would be
less need to use the key policy rate for financial stability concerns.13 Therefore it is wise to
consider the two policies together and try to coordinate them.14 We welcome the organisational
13 Presumably, a more efficient macroprudential policy could also imply smaller fluctuations in the output gap. In that case there will be less of a trade‐off between stabilising real activity and inflation, which in itself could affect the interest rate setting for a given objective function (see, e.g., Galí 2012). 14 What is not clear, however, is whether it is wise or not to use interest rates as an instrument to enhance financial stability (see, e.g., Svensson 2012).
25

changes made at Norges Bank and the decision to merge the monetary policy report and the
financial stability report.15
Are the new macroprudential policies sufficient? This is an open question that goes well
beyond the scope of this report. We expect this to be an important issue in the years to come.
We strongly recommend that Norges Bank clarifies whether and how the new buffer
requirement will affect the conduct of monetary policy.
NBW 2012 raised the question about central bank independence, since Norges Bank, the day
before the Executive Board meets, has to inform the Ministry of Finance what advice the
Governor will give to the Executive Board about policy issues, e.g. the rate of interest on banks’
deposits with Norges Bank. Norges Bank and the Ministry of Finance stress that this is just a
formality and that it does not influence actual policy, and, importantly, that the Ministry of
Finance has never used its right to instruct Norges Bank. As explained in NBW 2012, the fact
that this right has never been used does not imply that the set-up does not influence policy. In a
nutshell the reason is as follows. If it is costly for Norges Bank to be overruled in its interest
rate decision (due to e.g. loss of credibility or prestige), we would expect the bank to suggest a
policy that would not be overruled. As far as we see, having two instruments that partly overlap,
and where the final decision on one of the instruments lies with the Ministry of Finance, makes
these considerations even more important in the future. We therefore suggest that the practice is
changed. One possibility is to follow Sweden, where the Ministry of Finance is informed about
the decision after the meeting of the Executive Board, but before the decision becomes public.
It remains to be seen whether monetary policy and macroprudential policy will be coordinated
in practice. It seems likely that Norges Bank prefers to coordinate the two decisions, but it is
not yet certain whether the Ministry of Finance will follow the advice given by Norges Bank.
The quote from the Nordic report above suggests, however, that it will. We thus expect that
monetary policy and the countercyclical buffer will eventually be decided upon by the
Executive Board of Norges Bank. This raises the question if there are sufficient checks and
balances inside the bank. NBW 12 concluded that:
“Given the extensive responsibilities of the Executive Board (and especially if their
responsibilities are increased further, e.g. with respect to financial stability), the situation of
15 The fact that there will be four instead of three reports is also welcomed as the number of reports has been a recurrent concern in Norges Bank Watch reports in the past.
26

the external members of the Board should be strengthened. For instance, their current part-
time involvement is not entirely consistent with their responsibilities.”
It has been argued that the part-time involvement is part of a Norwegian tradition and that this
arrangement is also normal in large private (or public) enterprises. We are not convinced by
this line of reasoning. Board members of large enterprises serve a very different purpose,
namely to establish broad policies and objectives. The Executive Board of Norges Bank, on the
other hand, is operational and the members are jointly responsible for the conduct of monetary
policy. Another line of reasoning is that it will be difficult to fully occupy all the board
members if they were employed full time.16 We do not know the extent to which full-time
board members of other similar central banks are less than fully occupied.17 If this is a real
concern, we suggest that other arrangements are found for the external board members that will
strengthen the checks and balances inside Norges Bank.18
3.2 The new criteria for the interest rate path
NBW 2012 puts forward the question of whether financial stability was given any weight in
2011, independently and in addition to the weight given to stabilising inflation and real
economic activity. On the one hand, financial stability was not mentioned in the so-called
criteria for an appropriate interest rate path. The first two criteria referred to stabilising inflation
and having a reasonable balance between volatility in inflation and real activity. The last two
criteria were related to the gradual changes in interest rates and to cross-checking with robust
simple interest rates rules. Therefore there was nothing in the criteria that suggested that weight
was given to financial stability per se. On the other hand, in several press statements the
Executive Board stated that the interest rate path also reflected the concern for financial
instability if rates are kept low for too long.
16 See Qvigstad et al. (2013, page 6). 17 According to Qvigstad et al (2013), some of those central banks have individualistic monetary policy committees, which make part‐time involvement less appropriate. For example, the Riksbank has only full‐time board members, but its committee is individualistic and board members typically defend their views in public. 18 Apel et al. (2013) conducted a survey of former board members of Norges Bank (and the Riksbank). That survey revealed that the staff plays an important role in providing information and much more so than fellow board members. The study also revealed that board members often have decided before the board meeting and that they tended to prefer to show unanimity and follow the view of the Governor, if it was reasonably close to their own. It is important to note, however, that the authors discovered only small differences between the board members at Norges Bank and the Riksbank. Though we think these observations call for strengthening the situation of the external members of the Board, it is not clear that a full‐time individualistic committee – as is the case at the Riksbank – is preferable.
27

In MPR 1/12 Norges Bank changed the criteria for an appropriate interest rate path. The third
and fourth criteria mentioned above were replaced by a new third criterion.19 It reads:
“3. Monetary policy is robust: The interest rate should be set so that monetary policy mitigates
the risk of a buildup of financial imbalances, and so that acceptable developments in inflation
and output are also the likely outcome under alternative assumptions about the functioning of
the economy.”
We welcome this clarification. In MPRs preceding this change, Norges Bank took financial
stability into account by supplementary assessments, and it was unclear how much weight was
given to financial stability (see, e.g., NBW 2012).
As a consequence of the change in criteria, Norges Bank changed its description of monetary
policy, that is, the so-called loss function. The (period) loss function now reads:
(1) ∗ ∗ ∗
where and ∗ are the rate of inflation and the inflation target, respectively, and ∗ are (the
logarithm of) output and natural output, the nominal interest rate and ∗ the natural nominal
interest rate. Parameters , , are weights that are assigned to the different objectives,
measured relative to the weight on stabilising inflation around the inflation target.
Compared to earlier reports the loss function is changed in two important ways.20 First, the
weight on stabilising real activity, which is measured by the parameter , is increased. Norges
Bank motivates this by the observation that financial imbalances often build up during booms.
Second, there is a new last term, which penalises deviations of the interest rate from its natural
(or average) level. The motivation is that low interest rates for extended periods can increase
the risk of financial instability due to asset price inflation and unsustainable levels of debt. We
will discuss each of these changes in turn.
Both changes are motivated by financial stability or rather by the risk of unsustainable asset
price inflation and credit expansions that might lead to future financial instability. Two points
are worth mentioning. First, there is a question regarding the apparent symmetry in the loss
function. Sustained high nominal interest rates are just as costly as sustained low interest rates
19 The changes in the criteria are discussed and justified in Evjen and Kloster (2012). See Lund and Robstad (2012) for a comparison of some of the key impulse responses with the old loss function. 20 The weight assigned to interest rate smoothing was also changed somewhat.
28

and the same is true for real activity. The motivation given for changing the loss function is,
however, asymmetric. What is said to be costly is to have high capacity utilisation and low
nominal interest rates for too long – but not having low capacity utilisation and high interest
rates. In fact, a reduction in real activity could very well be good for financial stability, if that
reduction comes about due to an increase in savings. Thus, there are good reasons to expect that
policy will in fact be asymmetric due to concerns for financial stability. If policy is, in fact,
asymmetric, this will therefore imply a contractionary bias that will make inflation lower than
would otherwise be the case. We suggest that Norges Bank clarifies this point.
Second, and more fundamentally, it is unclear if the two terms capture the risk of future
financial instability. Galí (2012) lists a set of variables that are potential indicators of the build-
up of imbalances:21
Stock and housing prices and their price/earnings ratios.
Bank credit relative to nominal GDP.
Measures of leverage and liquidity in the banking sector.
Clearly, the two terms in the loss function are not directly linked to any of these indicators.
First, the interest rate term only measures period-by-period differences and not accumulated
effects of low interest rates. We think this is important. In the justification for adding this term,
it is argued that low interest rates for extended periods can increase the risk of financial
instability. If this is important, what needs to be in the loss function is something related to the
average interest rate over some periods in the past, not just the current difference between the
actual rate and some average rate. Second, it is not even clear why sustained low interest rates
or a booming economy would constitute a risk to financial stability, if none of the indicators
above are influenced.
We recommend Norges Bank to develop model-based indicators that are more closely linked to
financial stability. Given the work currently undertaken at Norges Bank incorporating financial
stability concerns into the model used for policy analysis and forecasting, we expect to see
changes in the loss function when the new model is made operational.
21 In addition, he mentions current account imbalances and government debt, both of which are less relevant for the Norwegian economy.
29

3.3 Measures of underlying inflation – the use of CPIXE
In 2008 Norges Bank adopted a new main measure of underlying inflation, CPIXE inflation,
which is CPI inflation adjusted for taxes and excluding temporary changes in energy prices.
This was an important change, since conditional forecasts are only prepared for the main
measure of core inflation and because that variable is used in model-based monetary policy
analysis. The CPIXE is a weighted average of the CPI-ATE – the consumer price index
adjusted for changes in indirect taxes and excluding energy prices – and permanent changes in
energy prices. Before this the bank used CPI-ATE inflation as its main indicator.
The main motivation for using CPIXE inflation instead of CPI-ATE inflation is that the latter
does not capture trend growth in energy prices, since energy prices are excluded. Positive trend
growth in relative energy prices makes CPI-ATE inflation on average lower than CPI inflation
and therefore changes in the CPI-ATE is a biased estimator of future inflationary pressure. To
correct for this bias the trend growth in energy prices is added to CPI-ATE inflation with the
appropriate weight. More precisely, CPIXE inflation is computed as
(2) ∆ 1 ∆CPI ∆CPI
where ∆ denotes the year-on-year change in the variable, the weight is computed by Statistics
Norway and ∆CPI is the trend growth in energy prices. The latter is computed using an
HP filter using both data on energy prices and future prices of electricity and crude oil.
Importantly, Norges Bank does not use revised data in its model analysis, but it does provide
updated data series on its website. We will discuss some issues regarding the use of CPIXE
inflation below.
In an article in Norges Banks’s economic bulletin Jonassen and Nordbø (2006) list the standard
criteria for choosing an indicator for underlying inflation – echoed in NBW 2009.
The indicator should:
not systematically deviate from CPI inflation in the long run,
be published at the same time as CPI inflation published by Statistics Norway and historical values should not be revised when new data becomes available,
be able to predict future CPI inflation,
be computed outside the central bank in order to increase the credibility of the indicator,
be understood by the public,
be founded in economic theory.
30

NBW 2009 concludes that the CPIXE does not fulfil these basic requirements:
“The new index CPIXE is not an optimal indicator of underlying inflation using standard
criteria and should therefore not be used as the main indicator when designing monetary policy.
Our view is that the previously used index of underlying inflation, CPI-ATE should still be used
as the focus measure since it has been tested, evaluated and has good properties at least
compared to other alternative measures of underlying inflation.”
Similar concerns have later been expressed in both NBW 2010 and 2011. We share the concern
about the use of CPIXE inflation as the main indicator.
There are two important questions that are worth discussing. First, how important are energy
prices and how large are the expected errors using CPI-ATE inflation instead of CPIXE
inflation? Second, how is the performance of the complicated procedure involving future prices
of (some) energy components and HP filtering, and, related to that, are there easier and more
transparent ways of correcting the CPI-ATE measure?
Chart 9: Measures of core inflation
0
0,5
1
1,5
2
2,5
3
3,5
4 CPI‐ATE
CPIXE
Revised CPIXE
31
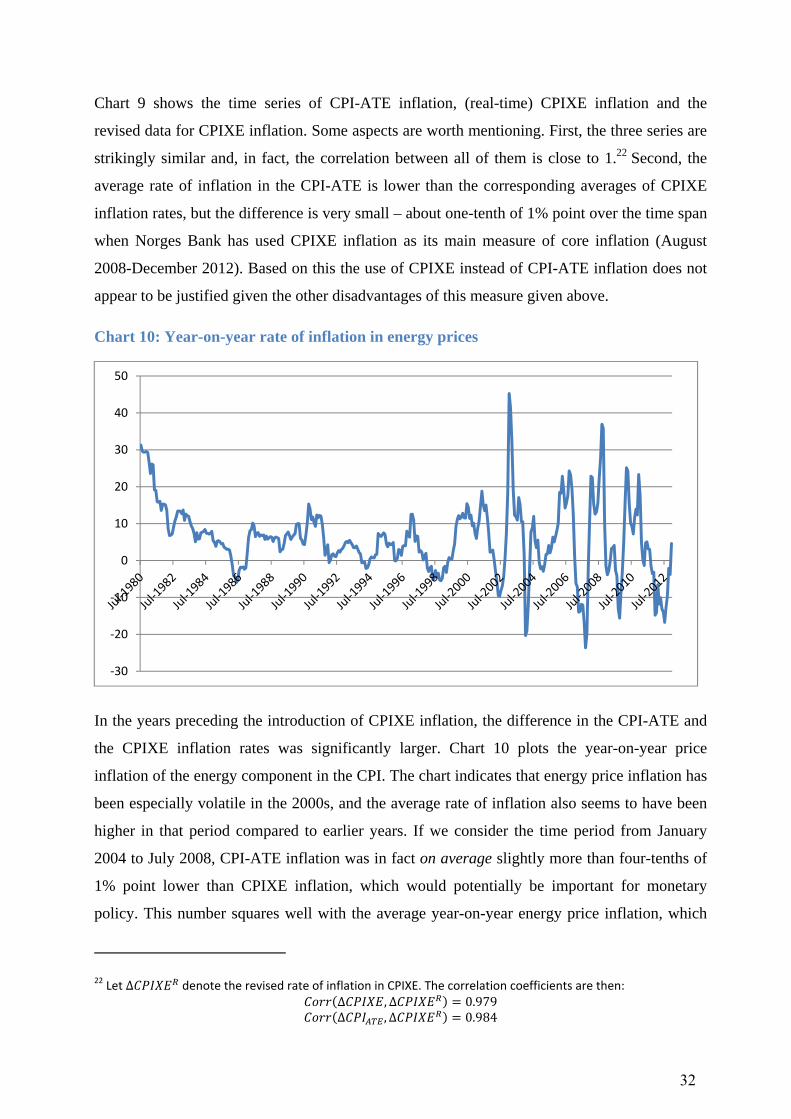
Chart 9 shows the time series of CPI-ATE inflation, (real-time) CPIXE inflation and the
revised data for CPIXE inflation. Some aspects are worth mentioning. First, the three series are
strikingly similar and, in fact, the correlation between all of them is close to 1.22 Second, the
average rate of inflation in the CPI-ATE is lower than the corresponding averages of CPIXE
inflation rates, but the difference is very small – about one-tenth of 1% point over the time span
when Norges Bank has used CPIXE inflation as its main measure of core inflation (August
2008-December 2012). Based on this the use of CPIXE instead of CPI-ATE inflation does not
appear to be justified given the other disadvantages of this measure given above.
Chart 10: Year-on-year rate of inflation in energy prices
In the years preceding the introduction of CPIXE inflation, the difference in the CPI-ATE and
the CPIXE inflation rates was significantly larger. Chart 10 plots the year-on-year price
inflation of the energy component in the CPI. The chart indicates that energy price inflation has
been especially volatile in the 2000s, and the average rate of inflation also seems to have been
higher in that period compared to earlier years. If we consider the time period from January
2004 to July 2008, CPI-ATE inflation was in fact on average slightly more than four-tenths of
1% point lower than CPIXE inflation, which would potentially be important for monetary
policy. This number squares well with the average year-on-year energy price inflation, which
22 Let ∆ denote the revised rate of inflation in CPIXE. The correlation coefficients are then: ∆ , ∆ 0.979 ∆ , ∆ 0.984
‐30
‐20
‐10
0
10
20
30
40
50
32

has been about 5.5% in the 2000s. With an average core rate of inflation of about 1.5%, this
implies a trend in real energy prices of roughly 4%.
Why is the difference between the CPIXE and CPI-ATE inflation rates so small after August
2008? One reason for this might be related to how the energy trend is computed. We turn to
this next.
There are good theoretical reasons for constructing future prices of energy when using the HP
filter. The filter is two-sided, which means that it uses data both before and after the
observation to split each observation into a cyclical and a trend component. This implies that
there is an end-point problem, since at the end of the sample there are no future observations.
The two main components of energy in the CPI are electricity and petrol. Norges Bank uses
future prices for electricity from Nord Pool. For petrol Norges Bank staff makes forecasts of
petrol prices based on future prices for crude oil using an econometric model.23 Future prices of
crude oil are quoted in US dollars, so the Norwegian krone/US dollar spot rate at the point in
time of the forecast is used to convert them into Norwegian kroner. Using this procedure (up
to) 12 months of “future prices” of energy are estimated and used together with past actual data
to measure the trend in the price of energy.24
Chart 11: Real-time issues with computing trends in energy prices
23 There are also future prices for petrol, which in principle could have been used instead of future prices for crude oil. We thank Thina Margrethe Saltvedt for making this point. 24 Details on how to construct CPIXE are given by Nordbø (2008).
‐20
‐10
0
10
20
30
40
‐4
‐2
0
2
4
6
8
10
12 Trend growth in energy prices (LHS)
Revised trend growth in energy prices (LHS)
Y‐O‐Y changes in the energy component of CPI (RHS)
33

Chart 11 shows the real-time measure of the trend in energy prices (blue line, left-hand scale)
and the revised measure of the same variable (red line, left-hand scale). Those series are plotted
against the actual year-on-year changes in the energy component of CPI (green line, right-hand
scale).25 There are several points worth mentioning. First, the differences between the real-time
trend, which is used in policy analysis at Norges Bank, and its revised counterpart are strikingly
large.26 In fact, the average absolute difference between the two series is about 2.3% points for
the time period August 2008 and December 2010. This implies that the revisions of the series
are of the same order of magnitude as the average value of the variable itself. Second, the real-
time trend is considerably more volatile than the revised measure. The former varies between
0.9% and 10.2%, while the corresponding figures for the revised data are 3.4% and 6.4%.
Actually, most of the cyclical fluctuations disappear in the revised data. This means that the
current extraordinarily low real-time trend growth might very well disappear in the revised data.
Third, it is striking to observe how well the real-time trend corresponds to the fluctuations in
the year-on-year changes in the energy component of the CPI. Obviously, the latter series is
much more volatile, but the correlation between the two series is 0.82, while for the revised
measure of the trend the corresponding correlation coefficient drops to 0.47.27
It is beyond the scope of this report to try to fully understand the nature of these major revisions
in the trend growth in energy prices. The revisions will be large in periods with rapid changes
in forward prices of energy, as stressed by NBW 2009 and 2010. The forward prices of
commodities not only reflect expectations about prices ahead, but will also be influenced by
risk factors, market sentiment and even herd behaviour. What is clear from our simple analysis
is that Norges Bank lets those risk factors influence its measure of core inflation in a significant
way, which is clearly unsatisfactory. We therefore conclude that there are important
shortcomings in using CPIXE inflation as the main measure of core inflation.
25 To compute these series we have used the definition of the CPIXE rate of inflation given in equation (2) above.
We have data for ∆CPI , ∆CPIXE and , which are then used to compute ∆CPI . The revised trend is
computed using the revised data for ∆CPIXE. 26 The difference is for obvious reasons small at the end of the sample, since little new data have been used to revise the series. 27 For the time period from August 2008 to December 2010 the correlation is as low as ‐0.21.
34

What is a good alternative measure of core inflation? The answer to that question depends on
how important the trend in energy prices is. We are sympathetic to the view that some
correction of CPI-ATE inflation is warranted. We therefore think that Statistics Norway should
construct some measure of trends in energy prices based on historical data. One possibility is a
simple 5- or 10-year moving average of the year-on-year percentage change in energy prices.
3.4 NBW view
NBW 2013 welcomes the efforts made by Norges Bank to coordinate monetary policy with the
new instrument for macroprudential policy, i.e. the countercyclical buffer.
Norges Bank should clarify whether and how the instrument will affect the conduct of
monetary policy. To strengthen the independence of Norges Bank, the bank staff should not be
required to inform the Ministry of Finance about policy recommendations before the meeting
of the Executive Board. Moreover, the situation of the external board members should be
strengthened.
We welcome the clarification of the new criteria for the interest rate path. During the recent
international turmoil, Norges Bank took financial stability into account by supplementary
assessments and it was unclear how much weight was given to financial stability (see, e.g.
NBW 2012). We are not convinced that the new criteria and, in particular, the new loss
function, are appropriate in order to capture the risk of future financial instability, however. We
recommend that Norges Bank develops model-based indicators that are more closely linked to
financial stability than those currently used.
The use of CPIXE inflation to measure core inflation has been criticised in several NBW
reports. We document that the real-time series of CPIXE inflation, which is used in policy
analysis, have important shortcomings. First, revisions in the trend growth of energy prices are
remarkably large and the real-time series are considerably more volatile than the revised series.
We recommend that CPI-ATE inflation is used as the main measure and that simple corrections
are made based on 5- or 10-year averages of changes in energy prices.
35

References
Apel, M., C.A. Claussen, P. Gerlach-Kristen, P. Lennarstsdotter and Ø. Røisland (2013), ”Monetary Policy Decisions – Comparing Theory and ‘Inside’ Information from MPC Members”, Norges Bank Working Papers 3/2013. Evjen, S., and T.B. Kloster (2012), “Norges Bank’s new monetary policy loss function – further discussion”, Norges Bank Staff Memo 11/2012. Galí, J. (2012), “The Monetary Pillar and the Great Financial Crisis”, The Great Financial Crisis: Lessons for Financial Stability and Monetary Policy, European Central Bank, 2012, 74-95. Jonassen, M., and E.W. Nordbø (2006), “Indicators of Underlying Inflation in Norway”, Norges Bank Economic Bulletin 4/06. Lund, K., and Ø. Robstad (2012): “Effects of a new loss function in NEMO“, Norges Bank Staff Memo, 10/2012 Nordbø, E.W. (2008), “CPIXE and projections for energy prices”, Norges Bank Staff Memo, 7/2008. Qvigstad, J.F. with I. Fridriksson and N. Langbraaten (2013), “Monetary Policy Committees and Communication”, Norges Bank Staff Memo 2/2013. Svensson, L.E.O. (2012), “The Relation between Monetary Policy and Financial Policy”, International Journal of Central Banking 8, 293-295.
36
Norges Bank Watch Report Series
No Title and authors
1/2000 Norsk pengepolitikk, Norges Banks rolle og bankens gjennomføring av pengepolitikken i 1999 og første del av 2000. (Norwegian version only) Carl Hamilton Øystein Thøgersen Marianne Andreassen Harald Magnus Andreassen
2/2001 A review of inflation targeting, the Norwegian monetary regime and its institutio-nal arrangements and Norges Bank’s actual monetary policy and communication. Harald Magnus Andreassen Paul De Grauwe Haakon Solheim Øystein Thøgersen
3/2002 An Independent Review of Monetary Policy and Institutions in Norway. Lars E.O. Svensson Kjetil Houg Haakon Solheim Erling Steigum
4/2003 An Independent Review of Monetary Policy in Norway. Thomas Ekeli Anne Kari Haug Kjetil Houg Erling Steigum
5/2004 An Independent Review of Monetary Policymaking in Norway Hilde C. Bjørnland Thomas Ekeli Petra M. Geraats Kai Leitemo
6/2005 An Independent Review of Monetary Policymaking in Norway Øystein Dørum Steinar Holden Arne Jon Isachsen
7/2006 An Independent Review of Monetary Policymaking in Norway Øystein Dørum Steinar Holden
8/2007 An Independent Review of Monetary Policymaking in Norway Marvin Goodfriend Knut Anton Mork Ulf Söderström

Norges Bank Watch Report Series
No Title and authors 9/2008 An Independent Review of Monetary Policymaking in Norway
Steinar Juel Krisztina Molnar Knut Røed
10/2009 Monetary Policy and the Financial Turmoil
Michael Bergman Steinar Juel Erling Steigum
11/2010 An Independent Evaluation of Monetary Policy in Norway Hilde C. Bjørnland Richard Clarida Elisabeth Holvik Erling Steigum
12/2011 An Independent Evaluation of Monetary Policy in Norway Hilde C. Bjørnland Bjørn Roger Wilhelmsen
13/2012 An Independent Evaluation of Monetary Policy in Norway
Ragnar Torvik Anders Vredin Bjørn Roger Wilhelmsen
14/2013 An Independent Evaluation of Monetary Policy in Norway Boye Katrine Godding Sveen Tommy