Embed Size (px)
Citation preview
Appendix 6.2 Normal Distribution Using MegaStat 271
The desired probability is in cell D19, the sum of the lower tail probability for 153 and the upper tail probability for167. This value differs slightly from the value in Example 6.4 since Excel carries out probability calculations to higherprecision than can be achieved using normal probability tables.
Inverse normal probability st such that P(X � st) �0.05 in Example 6.5 (pages 249–250):
• Click in the cell where you wish the answer to beplaced. Here we will click in cell A19. Select theInsert Function button from the Excel toolbar.
• In the Insert Function dialog box, select Statisticalfrom the “Or select a category:” menu, selectNORMINV from the “Select a function:” menu,and click OK.
• In the NORMINV Function Arguments dialog box,enter the value 0.95 in the Probability window;that is,
[P(X � st) � 0.95 when P(X � st) � 0.05.]
• Enter the value 100 in the Mean window.
• Enter the value 10 in the Standard_dev window.
• Click OK in the NORMINV Function Arguments dialog window.
• When you click OK, the answer is placed in cell A19.
fx
Appendix 6.2 ■ Normal Distribution Using MegaStat
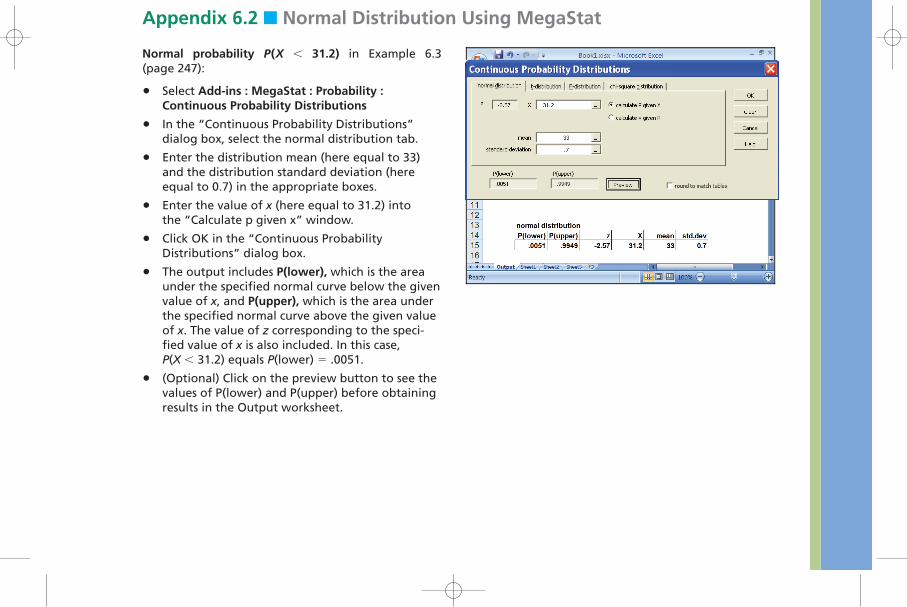
Normal probability P(X � 31.2) in Example 6.3 (page 247):
• Select Add-ins : MegaStat : Probability :Continuous Probability Distributions
• In the “Continuous Probability Distributions” dialog box, select the normal distribution tab.
• Enter the distribution mean (here equal to 33)and the distribution standard deviation (hereequal to 0.7) in the appropriate boxes.
• Enter the value of x (here equal to 31.2) intothe “Calculate p given x” window.
• Click OK in the “Continuous Probability Distributions” dialog box.
• The output includes P(lower), which is the areaunder the specified normal curve below the givenvalue of x, and P(upper), which is the area underthe specified normal curve above the given valueof x. The value of z corresponding to the speci-fied value of x is also included. In this case, P(X � 31.2) equals P(lower) � .0051.
• (Optional) Click on the preview button to see thevalues of P(lower) and P(upper) before obtainingresults in the Output worksheet.
bow01838_ch06_232-273.qxd 11/27/09 1:38 PM Page 271
272 Chapter 6 Continuous Random Variables
Appendix 6.3 ■ Normal Distribution Using MINITAB
Normal probability P(X � 31.2) in Example 6.3(page 247):
• Select Calc : Probability Distributions : Normal.
• In the Normal Distribution dialog box, selectthe Cumulative probability option.
• In the Mean window, enter 33.
• In the Standard deviation window, enter 0.7.
• Click on the “Input constant” option andenter 31.2 in the “Input constant” window.
• Click OK in Normal Distribution dialog box tosee the desired probability in the Sessionwindow.
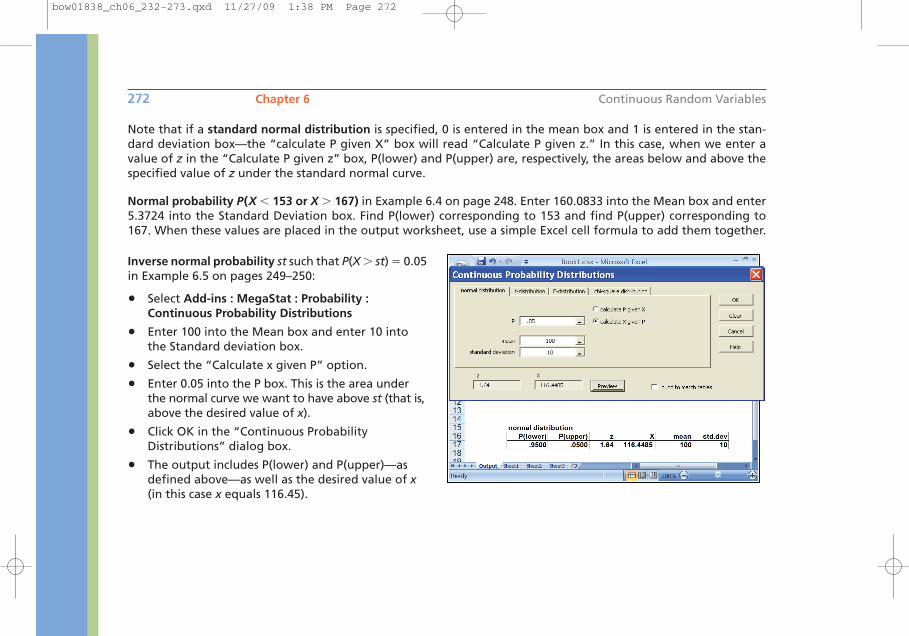
Note that if a standard normal distribution is specified, 0 is entered in the mean box and 1 is entered in the stan-dard deviation box—the “calculate P given X” box will read “Calculate P given z.” In this case, when we enter avalue of z in the “Calculate P given z” box, P(lower) and P(upper) are, respectively, the areas below and above thespecified value of z under the standard normal curve.
Normal probability P(X � 153 or X � 167) in Example 6.4 on page 248. Enter 160.0833 into the Mean box and enter5.3724 into the Standard Deviation box. Find P(lower) corresponding to 153 and find P(upper) corresponding to167. When these values are placed in the output worksheet, use a simple Excel cell formula to add them together.
Inverse normal probability st such that P(X � st) � 0.05in Example 6.5 on pages 249–250:
• Select Add-ins : MegaStat : Probability :Continuous Probability Distributions
• Enter 100 into the Mean box and enter 10 intothe Standard deviation box.
• Select the “Calculate x given P” option.
• Enter 0.05 into the P box. This is the area underthe normal curve we want to have above st (that is,above the desired value of x).
• Click OK in the “Continuous Probability Distributions” dialog box.
• The output includes P(lower) and P(upper)—asdefined above—as well as the desired value of x(in this case x equals 116.45).
bow01838_ch06_232-273.qxd 11/27/09 1:38 PM Page 272


![Index [canmedia.mcgrawhill.ca]canmedia.mcgrawhill.ca/college/olcsupport/beechy/6ce/vol2/bee33882... · for exchange rate fluctuations, 788–790 for finance leases, lessee, 1068 for](https://img.pdfslide.net/doc/110x75/5aa0e8767f8b9a89178eb3d2/index-exchange-rate-fluctuations-788790-for-finance-leases-lessee-1068.jpg)