Embed Size (px)
Citation preview
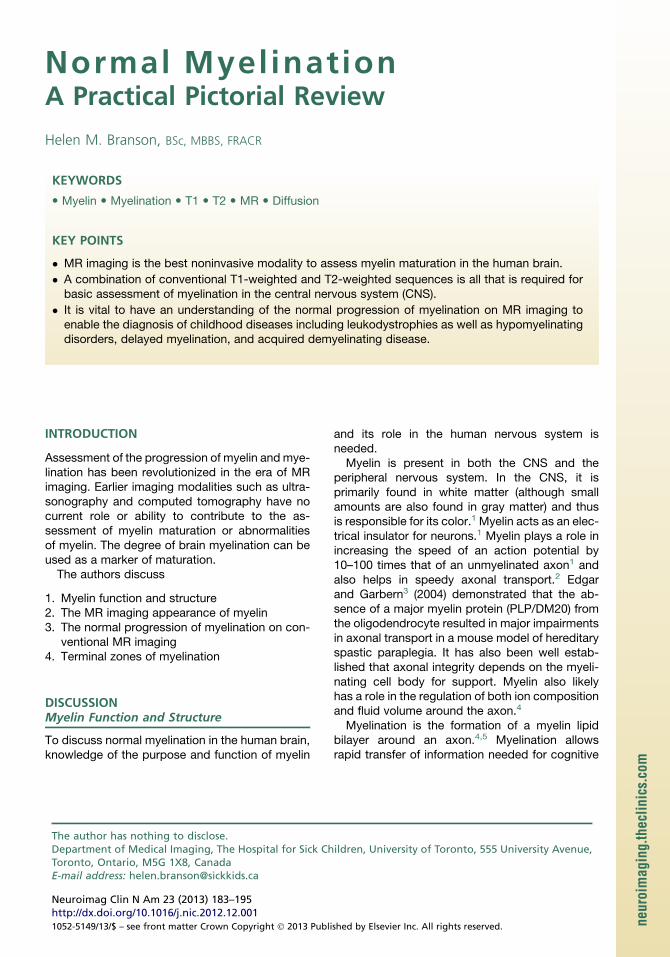
Normal MyelinationA Practical Pictorial Review
Helen M. Branson, BSc, MBBS, FRACR
KEYWORDS
� Myelin � Myelination � T1 � T2 � MR � Diffusion
KEY POINTS
� MR imaging is the best noninvasive modality to assess myelin maturation in the human brain.
� A combination of conventional T1-weighted and T2-weighted sequences is all that is required forbasic assessment of myelination in the central nervous system (CNS).
� It is vital to have an understanding of the normal progression of myelination on MR imaging toenable the diagnosis of childhood diseases including leukodystrophies as well as hypomyelinatingdisorders, delayed myelination, and acquired demyelinating disease.
INTRODUCTION
Assessment of the progression of myelin andmye-lination has been revolutionized in the era of MRimaging. Earlier imaging modalities such as ultra-sonography and computed tomography have nocurrent role or ability to contribute to the as-sessment of myelin maturation or abnormalitiesof myelin. The degree of brain myelination can beused as a marker of maturation.
The authors discuss
1. Myelin function and structure2. The MR imaging appearance of myelin3. The normal progression of myelination on con-
ventional MR imaging4. Terminal zones of myelination
m
DISCUSSIONMyelin Function and Structure
To discuss normal myelination in the human brain,knowledge of the purpose and function of myelin
The author has nothing to disclose.Department of Medical Imaging, The Hospital for Sick ChToronto, Ontario, M5G 1X8, CanadaE-mail address: [email protected]
Neuroimag Clin N Am 23 (2013) 183–195http://dx.doi.org/10.1016/j.nic.2012.12.0011052-5149/13/$ – see front matter Crown Copyright � 2013 Publi
and its role in the human nervous system isneeded.
Myelin is present in both the CNS and theperipheral nervous system. In the CNS, it isprimarily found in white matter (although smallamounts are also found in gray matter) and thusis responsible for its color.1 Myelin acts as an elec-trical insulator for neurons.1 Myelin plays a role inincreasing the speed of an action potential by10–100 times that of an unmyelinated axon1 andalso helps in speedy axonal transport.2 Edgarand Garbern3 (2004) demonstrated that the ab-sence of a major myelin protein (PLP/DM20) fromthe oligodendrocyte resulted in major impairmentsin axonal transport in a mouse model of hereditaryspastic paraplegia. It has also been well estab-lished that axonal integrity depends on the myeli-nating cell body for support. Myelin also likelyhas a role in the regulation of both ion compositionand fluid volume around the axon.4
Myelination is the formation of a myelin lipidbilayer around an axon.4,5 Myelination allowsrapid transfer of information needed for cognitive
ildren, University of Toronto, 555 University Avenue,
shed by Elsevier Inc. All rights reserved. neuroimaging.theclinics.co
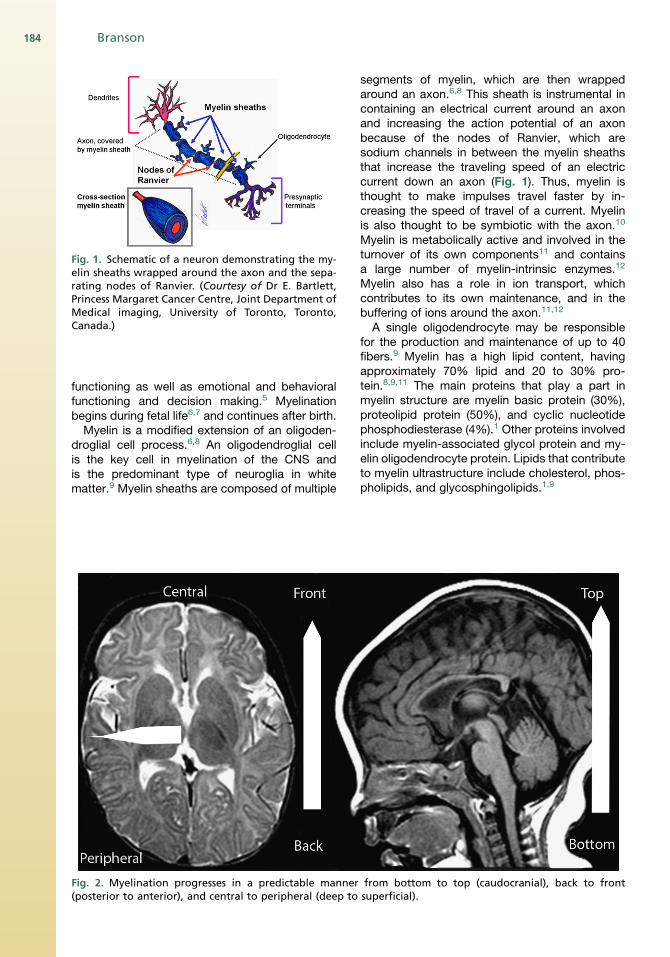
Fig. 1. Schematic of a neuron demonstrating the my-elin sheaths wrapped around the axon and the sepa-rating nodes of Ranvier. (Courtesy of Dr E. Bartlett,Princess Margaret Cancer Centre, Joint Department ofMedical imaging, University of Toronto, Toronto,Canada.)
Branson184
functioning as well as emotional and behavioralfunctioning and decision making.5 Myelinationbegins during fetal life6,7 and continues after birth.Myelin is a modified extension of an oligoden-
droglial cell process.6,8 An oligodendroglial cellis the key cell in myelination of the CNS andis the predominant type of neuroglia in whitematter.9 Myelin sheaths are composed of multiple
Fig. 2. Myelination progresses in a predictable manner(posterior to anterior), and central to peripheral (deep to
segments of myelin, which are then wrappedaround an axon.6,8 This sheath is instrumental incontaining an electrical current around an axonand increasing the action potential of an axonbecause of the nodes of Ranvier, which aresodium channels in between the myelin sheathsthat increase the traveling speed of an electriccurrent down an axon (Fig. 1). Thus, myelin isthought to make impulses travel faster by in-creasing the speed of travel of a current. Myelinis also thought to be symbiotic with the axon.10
Myelin is metabolically active and involved in theturnover of its own components11 and containsa large number of myelin-intrinsic enzymes.12
Myelin also has a role in ion transport, whichcontributes to its own maintenance, and in thebuffering of ions around the axon.11,12
A single oligodendrocyte may be responsiblefor the production and maintenance of up to 40fibers.9 Myelin has a high lipid content, havingapproximately 70% lipid and 20 to 30% pro-tein.8,9,11 The main proteins that play a part inmyelin structure are myelin basic protein (30%),proteolipid protein (50%), and cyclic nucleotidephosphodiesterase (4%).1 Other proteins involvedinclude myelin-associated glycol protein and my-elin oligodendrocyte protein. Lipids that contributeto myelin ultrastructure include cholesterol, phos-pholipids, and glycosphingolipids.1,9
from bottom to top (caudocranial), back to frontsuperficial).
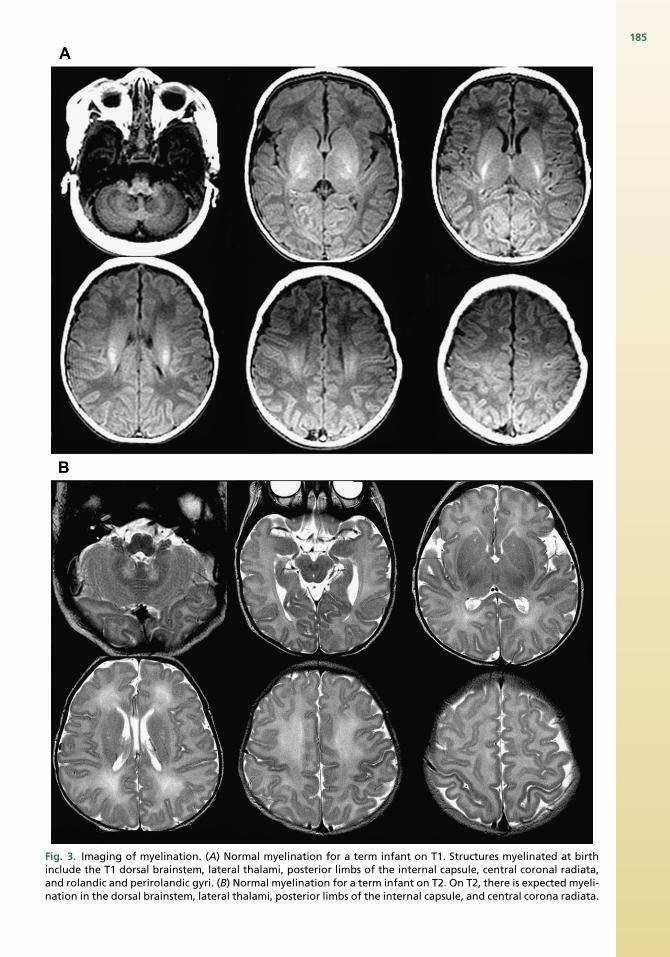
Fig. 3. Imaging of myelination. (A) Normal myelination for a term infant on T1. Structures myelinated at birthinclude the T1 dorsal brainstem, lateral thalami, posterior limbs of the internal capsule, central coronal radiata,and rolandic and perirolandic gyri. (B) Normal myelination for a term infant on T2. On T2, there is expected myeli-nation in the dorsal brainstem, lateral thalami, posterior limbs of the internal capsule, and central corona radiata.
185
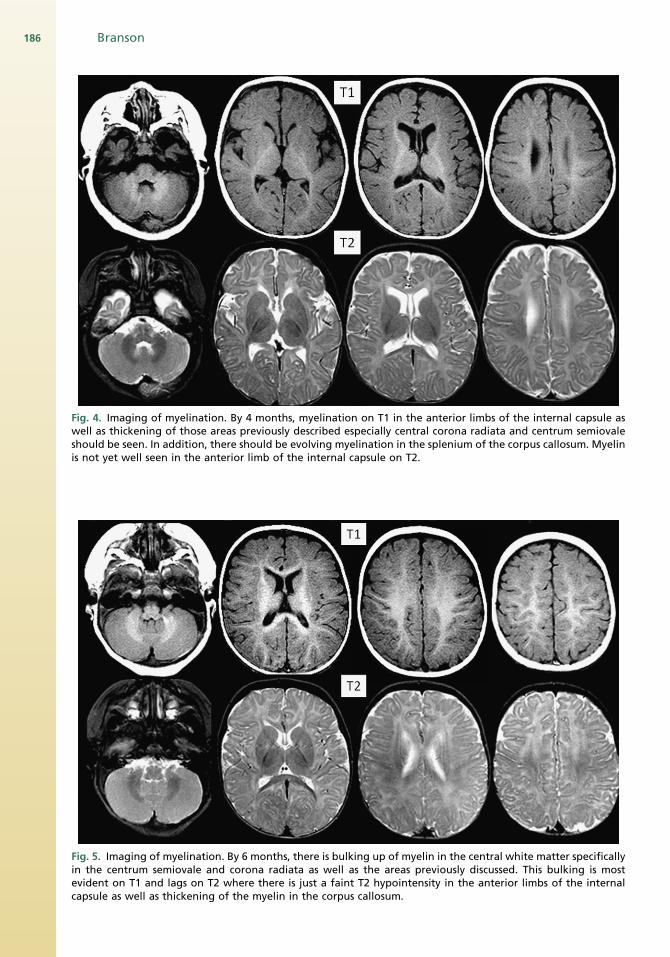
Fig. 4. Imaging of myelination. By 4 months, myelination on T1 in the anterior limbs of the internal capsule aswell as thickening of those areas previously described especially central corona radiata and centrum semiovaleshould be seen. In addition, there should be evolving myelination in the splenium of the corpus callosum. Myelinis not yet well seen in the anterior limb of the internal capsule on T2.
Fig. 5. Imaging of myelination. By 6 months, there is bulking up of myelin in the central white matter specificallyin the centrum semiovale and corona radiata as well as the areas previously discussed. This bulking is mostevident on T1 and lags on T2 where there is just a faint T2 hypointensity in the anterior limbs of the internalcapsule as well as thickening of the myelin in the corpus callosum.
186 Branson

Fig. 6. Imaging of myelination. By 9 months, there is progressive darkening on T2 as well as further bulking up ofthe myelinated white matter on T1. Myelin should now be seen in the anterior limb of the internal capsule on T2.
Fig. 7. Imaging of myelination. By 12 months, myelination on T1 is complete and there has been further myeli-nation in the centrum semiovale and coronal radiata as well as the corpus callosum and internal capsule on T2.There is still a fairly large amount of unmyelinated white matter, in particular in the frontal and temporal lobes.
Normal Myelination 187
Branson188
Electron microscopy has demonstrated thatmyelin is composed of multiple sheaths wrappedaround the axon and that the sheaths are madeup of a “protein-lipid-protein-lipid-protein” struc-ture. Compaction of these sheaths or processesgives rise to apposition of extracellular and cyto-plasmic surfaces, which represents alternatingextracellular and intracellular spaces.12 The lipidbilayer is composed of phospholipids, glycolipids,and cholesterol. Most of the glycolipids (sulfatideand cerebroside) and cholesterol are in the outerlayer and exposed to the extracellular space,whereas the phospholipids (plasmalogen) are inthe inner layer and are hydrophobic.6 The forma-tion of compact myelin is required for the growthand maturation of the axon.10
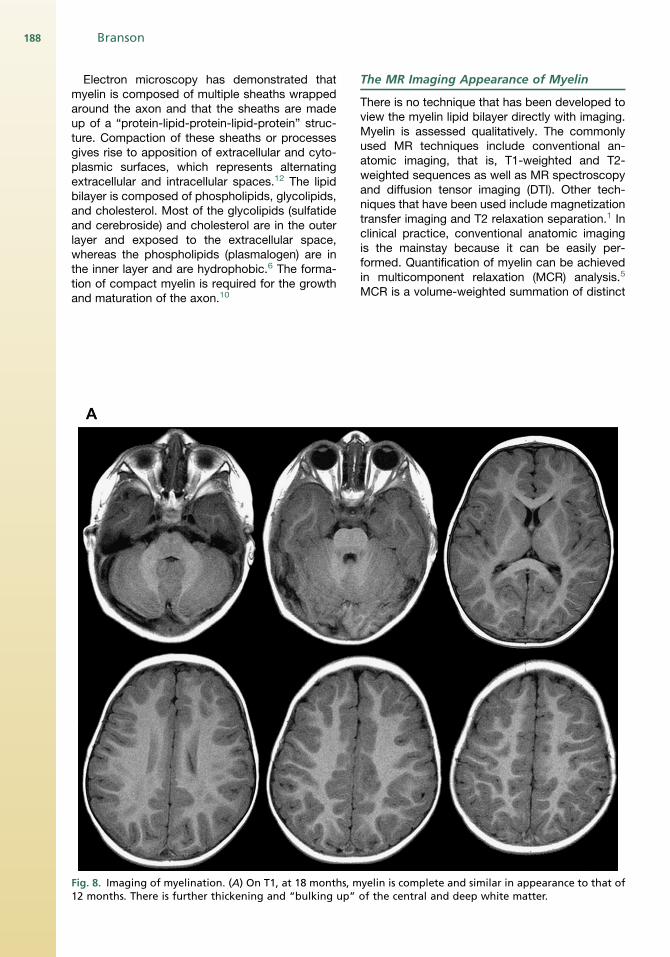
Fig. 8. Imaging of myelination. (A) On T1, at 18 months, m12 months. There is further thickening and “bulking up”
The MR Imaging Appearance of Myelin
There is no technique that has been developed toview the myelin lipid bilayer directly with imaging.Myelin is assessed qualitatively. The commonlyused MR techniques include conventional an-atomic imaging, that is, T1-weighted and T2-weighted sequences as well as MR spectroscopyand diffusion tensor imaging (DTI). Other tech-niques that have been used include magnetizationtransfer imaging and T2 relaxation separation.1 Inclinical practice, conventional anatomic imagingis the mainstay because it can be easily per-formed. Quantification of myelin can be achievedin multicomponent relaxation (MCR) analysis.5
MCR is a volume-weighted summation of distinct
yelin is complete and similar in appearance to that ofof the central and deep white matter.
Normal Myelination 189
microanatomic water compartments. This analysishas revealed 2 water subdomains, namely, a slowrelaxing species with free intracellular and extra-cellular water and a faster relaxing species ofmolecules from the water trapped between thelipid bilayer sheath.5,6
Currently, standard MR imaging techniques donot specifically have the ability to quantitatemyelin. Instead, these techniques study a combi-nation of the following: changes in axonal sizeand density, changes in membrane structure in-cluding lipid and protein content, and water andmacromolecule content.5 DTI is not a reliable indi-cator of the total amount of myelin, but it can givesome information on changes in myelin.1
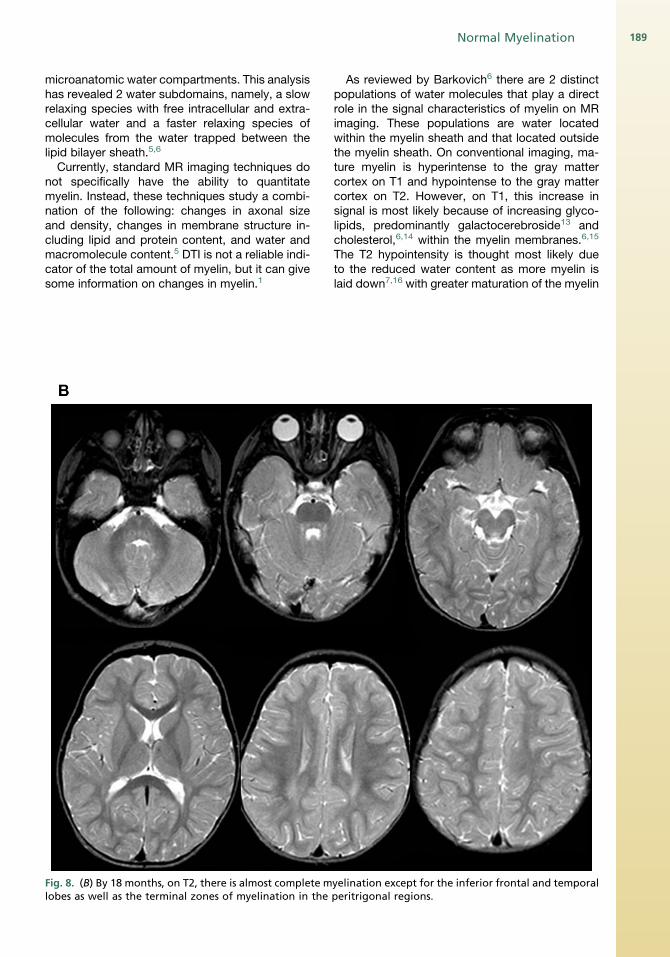
Fig. 8. (B) By 18 months, on T2, there is almost complete mlobes as well as the terminal zones of myelination in the
As reviewed by Barkovich6 there are 2 distinctpopulations of water molecules that play a directrole in the signal characteristics of myelin on MRimaging. These populations are water locatedwithin the myelin sheath and that located outsidethe myelin sheath. On conventional imaging, ma-ture myelin is hyperintense to the gray mattercortex on T1 and hypointense to the gray mattercortex on T2. However, on T1, this increase insignal is most likely because of increasing glyco-lipids, predominantly galactocerebroside13 andcholesterol,6,14 within the myelin membranes.6,15
The T2 hypointensity is thought most likely dueto the reduced water content as more myelin islaid down7,16 with greater maturation of the myelin
yelination except for the inferior frontal and temporalperitrigonal regions.
Branson190
sheath, and tightening of the myelin spiral aroundthe axon.6,15
The Normal Progression of Myelination
The general rule of progression of normal myeli-nation as outlined by Barkovich8 is that myelina-tion begins in the fifth fetal month and continuesthroughout life. Myelination commences withthe cranial nerves, which makes sense becausewe need these to rely on for survival. Generally,myelination progresses from bottom to top (cau-docranial), back to front (posterior to anterior),and central to peripheral (deep to superficial)(Fig. 2).17,18 It therefore makes sense that the
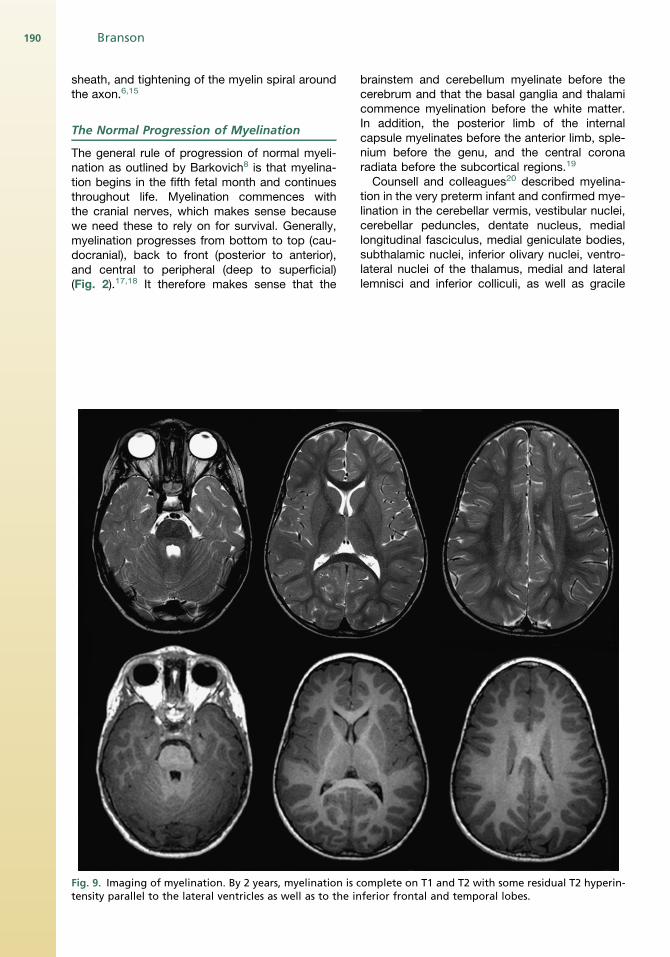
Fig. 9. Imaging of myelination. By 2 years, myelination is ctensity parallel to the lateral ventricles as well as to the in
brainstem and cerebellum myelinate before thecerebrum and that the basal ganglia and thalamicommence myelination before the white matter.In addition, the posterior limb of the internalcapsule myelinates before the anterior limb, sple-nium before the genu, and the central coronaradiata before the subcortical regions.19
Counsell and colleagues20 described myelina-tion in the very preterm infant and confirmed mye-lination in the cerebellar vermis, vestibular nuclei,cerebellar peduncles, dentate nucleus, mediallongitudinal fasciculus, medial geniculate bodies,subthalamic nuclei, inferior olivary nuclei, ventro-lateral nuclei of the thalamus, medial and laterallemnisci and inferior colliculi, as well as gracile
omplete on T1 and T2 with some residual T2 hyperin-ferior frontal and temporal lobes.
Normal Myelination 191
and cuneate nuclei and fasciculi. The investigatorsdid not find any new myelin sites between 28 and36 weeks, after which there were again newmyelinsites at the posterior limb of internal capsule,corona radiata, and the corticospinal tracts of theprecentral and postcentral gyrus.
Histologic studies demonstrate myelination atbirth in the brainstem, cerebellar white matter,and posterior limb of the internal capsule withextension to the thalamus and basal ganglia.21
Bird and colleagues19 (1989) reviewed 60 pa-tients on MR imaging and found that there waswide variation in the rate, onset, and appearanceof changes associated with myelination. The in-vestigators studied marker sites for certain agesin determining normal myelin. For example, at birth(term), there was mature myelination in the poste-rior limb of the internal capsule, the cerebellar
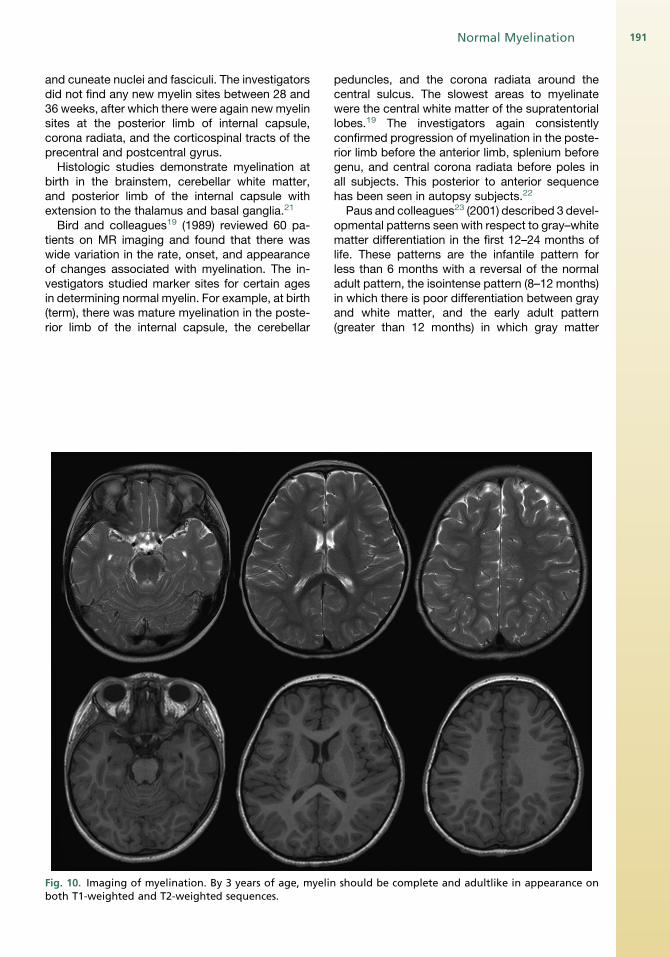
Fig. 10. Imaging of myelination. By 3 years of age, myelinboth T1-weighted and T2-weighted sequences.
peduncles, and the corona radiata around thecentral sulcus. The slowest areas to myelinatewere the central white matter of the supratentoriallobes.19 The investigators again consistentlyconfirmed progression of myelination in the poste-rior limb before the anterior limb, splenium beforegenu, and central corona radiata before poles inall subjects. This posterior to anterior sequencehas been seen in autopsy subjects.22
Paus and colleagues23 (2001) described 3 devel-opmental patterns seen with respect to gray–whitematter differentiation in the first 12–24 months oflife. These patterns are the infantile pattern forless than 6 months with a reversal of the normaladult pattern, the isointense pattern (8–12 months)in which there is poor differentiation between grayand white matter, and the early adult pattern(greater than 12 months) in which gray matter
should be complete and adultlike in appearance on
Branson192
signal is greater than that of white matter on T2 andless than that of white matter on T1. This change isthought to be related to changes in relaxation timeswith rapid shortening in the first 12monthsbecauseof a rapid decrease in thewater content of gray andwhite matter.23
Welker and Patton (2011)15 recently publisheda table of age-specific progression of myelinationon MR imaging with reference to T1, T2, Fluid-attenuated inversion recovery (FLAIR), and DTIsequences (Figs. 3–11). The reader is referred tothis article for further detail.The corpus callosum also undergoes a fairly
uniform pattern of thickening and myelination.The splenium myelinates first by approximately
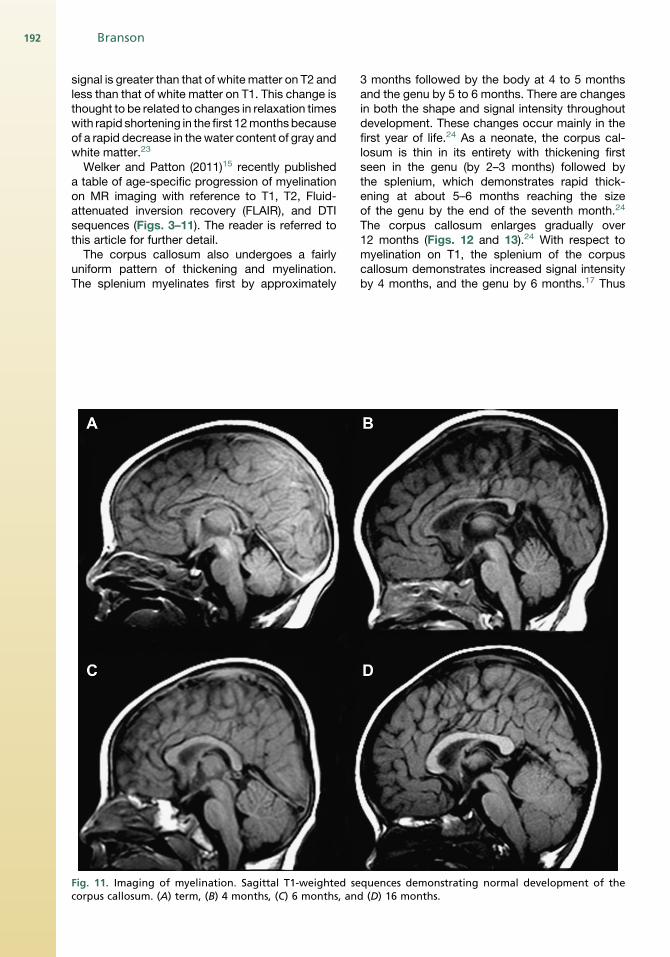
Fig. 11. Imaging of myelination. Sagittal T1-weighted secorpus callosum. (A) term, (B) 4 months, (C) 6 months, an
3 months followed by the body at 4 to 5 monthsand the genu by 5 to 6 months. There are changesin both the shape and signal intensity throughoutdevelopment. These changes occur mainly in thefirst year of life.24 As a neonate, the corpus cal-losum is thin in its entirety with thickening firstseen in the genu (by 2–3 months) followed bythe splenium, which demonstrates rapid thick-ening at about 5–6 months reaching the sizeof the genu by the end of the seventh month.24
The corpus callosum enlarges gradually over12 months (Figs. 12 and 13).24 With respect tomyelination on T1, the splenium of the corpuscallosum demonstrates increased signal intensityby 4 months, and the genu by 6 months.17 Thus
quences demonstrating normal development of thed (D) 16 months.
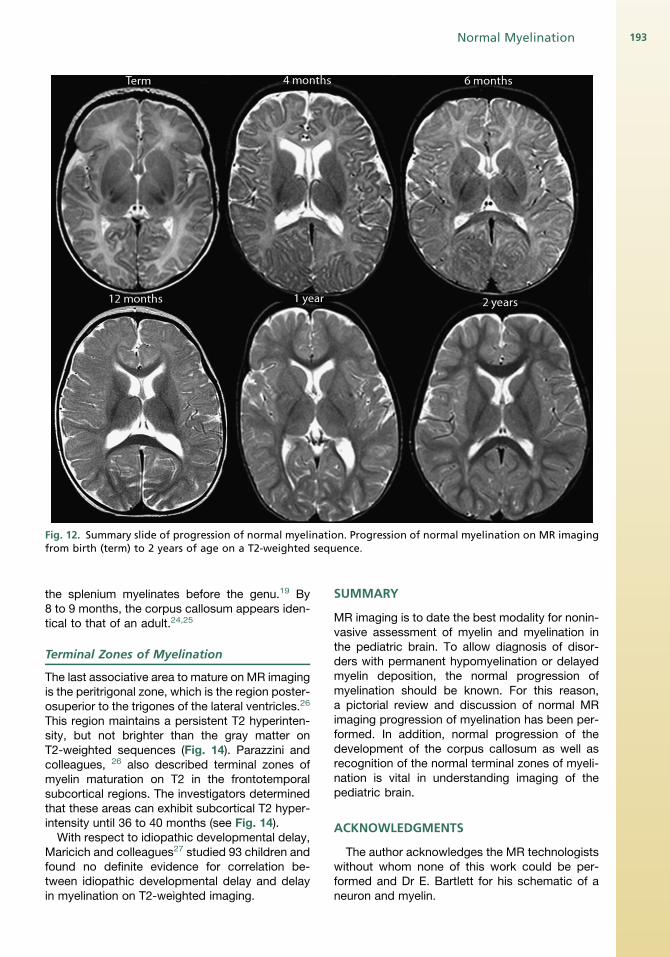
Fig. 12. Summary slide of progression of normal myelination. Progression of normal myelination on MR imagingfrom birth (term) to 2 years of age on a T2-weighted sequence.
Normal Myelination 193
the splenium myelinates before the genu.19 By8 to 9 months, the corpus callosum appears iden-tical to that of an adult.24,25
Terminal Zones of Myelination
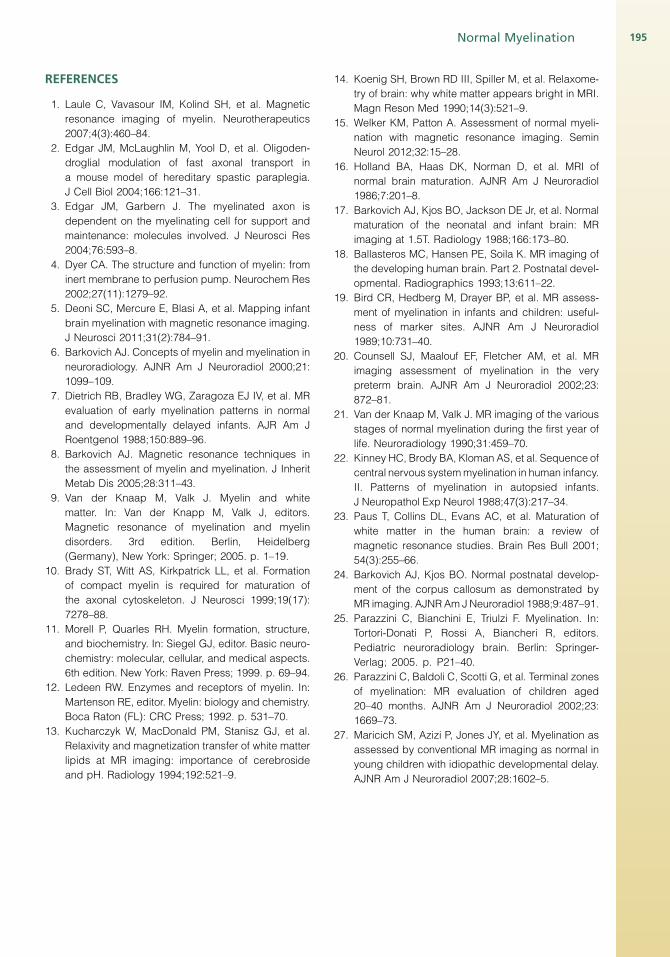
The last associative area to mature on MR imagingis the peritrigonal zone, which is the region poster-osuperior to the trigones of the lateral ventricles.26
This region maintains a persistent T2 hyperinten-sity, but not brighter than the gray matter onT2-weighted sequences (Fig. 14). Parazzini andcolleagues, 26 also described terminal zones ofmyelin maturation on T2 in the frontotemporalsubcortical regions. The investigators determinedthat these areas can exhibit subcortical T2 hyper-intensity until 36 to 40 months (see Fig. 14).
With respect to idiopathic developmental delay,Maricich and colleagues27 studied 93 children andfound no definite evidence for correlation be-tween idiopathic developmental delay and delayin myelination on T2-weighted imaging.
SUMMARY
MR imaging is to date the best modality for nonin-vasive assessment of myelin and myelination inthe pediatric brain. To allow diagnosis of disor-ders with permanent hypomyelination or delayedmyelin deposition, the normal progression ofmyelination should be known. For this reason,a pictorial review and discussion of normal MRimaging progression of myelination has been per-formed. In addition, normal progression of thedevelopment of the corpus callosum as well asrecognition of the normal terminal zones of myeli-nation is vital in understanding imaging of thepediatric brain.
ACKNOWLEDGMENTS
The author acknowledges the MR technologistswithout whom none of this work could be per-formed and Dr E. Bartlett for his schematic of aneuron and myelin.
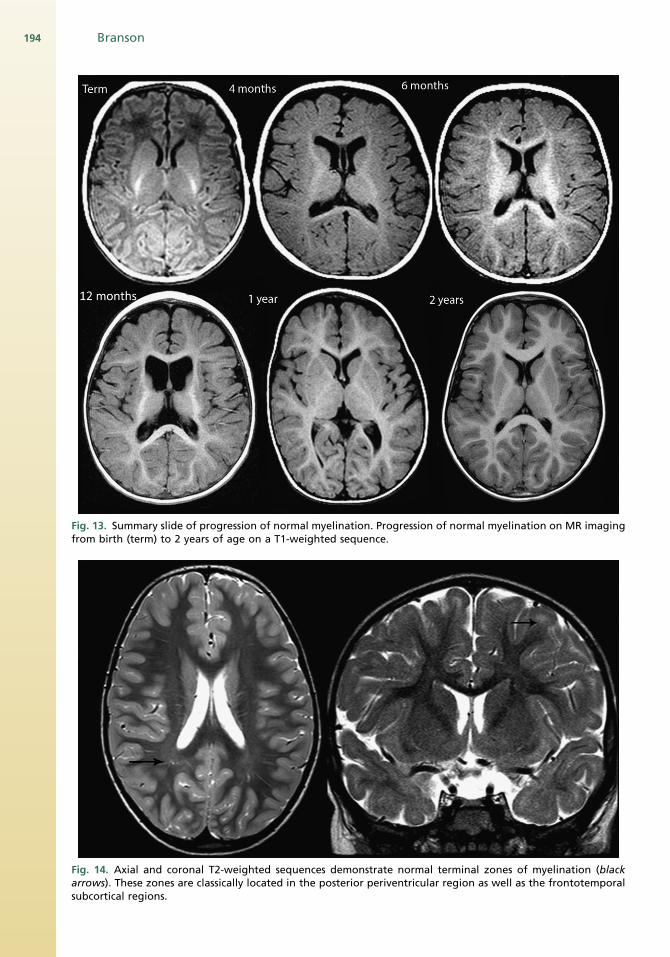
Fig. 13. Summary slide of progression of normal myelination. Progression of normal myelination on MR imagingfrom birth (term) to 2 years of age on a T1-weighted sequence.
Fig. 14. Axial and coronal T2-weighted sequences demonstrate normal terminal zones of myelination (blackarrows). These zones are classically located in the posterior periventricular region as well as the frontotemporalsubcortical regions.
Branson194
Normal Myelination 195
REFERENCES
1. Laule C, Vavasour IM, Kolind SH, et al. Magnetic
resonance imaging of myelin. Neurotherapeutics
2007;4(3):460–84.
2. Edgar JM, McLaughlin M, Yool D, et al. Oligoden-
droglial modulation of fast axonal transport in
a mouse model of hereditary spastic paraplegia.
J Cell Biol 2004;166:121–31.
3. Edgar JM, Garbern J. The myelinated axon is
dependent on the myelinating cell for support and
maintenance: molecules involved. J Neurosci Res
2004;76:593–8.
4. Dyer CA. The structure and function of myelin: from
inert membrane to perfusion pump. Neurochem Res
2002;27(11):1279–92.
5. Deoni SC, Mercure E, Blasi A, et al. Mapping infant
brain myelination with magnetic resonance imaging.
J Neurosci 2011;31(2):784–91.
6. Barkovich AJ. Concepts of myelin and myelination in
neuroradiology. AJNR Am J Neuroradiol 2000;21:
1099–109.
7. Dietrich RB, Bradley WG, Zaragoza EJ IV, et al. MR
evaluation of early myelination patterns in normal
and developmentally delayed infants. AJR Am J
Roentgenol 1988;150:889–96.
8. Barkovich AJ. Magnetic resonance techniques in
the assessment of myelin and myelination. J Inherit
Metab Dis 2005;28:311–43.
9. Van der Knaap M, Valk J. Myelin and white
matter. In: Van der Knapp M, Valk J, editors.
Magnetic resonance of myelination and myelin
disorders. 3rd edition. Berlin, Heidelberg
(Germany), New York: Springer; 2005. p. 1–19.
10. Brady ST, Witt AS, Kirkpatrick LL, et al. Formation
of compact myelin is required for maturation of
the axonal cytoskeleton. J Neurosci 1999;19(17):
7278–88.
11. Morell P, Quarles RH. Myelin formation, structure,
and biochemistry. In: Siegel GJ, editor. Basic neuro-
chemistry: molecular, cellular, and medical aspects.
6th edition. New York: Raven Press; 1999. p. 69–94.
12. Ledeen RW. Enzymes and receptors of myelin. In:
Martenson RE, editor. Myelin: biology and chemistry.
Boca Raton (FL): CRC Press; 1992. p. 531–70.
13. Kucharczyk W, MacDonald PM, Stanisz GJ, et al.
Relaxivity and magnetization transfer of white matter
lipids at MR imaging: importance of cerebroside
and pH. Radiology 1994;192:521–9.
14. Koenig SH, Brown RD III, Spiller M, et al. Relaxome-
try of brain: why white matter appears bright in MRI.
Magn Reson Med 1990;14(3):521–9.
15. Welker KM, Patton A. Assessment of normal myeli-
nation with magnetic resonance imaging. Semin
Neurol 2012;32:15–28.
16. Holland BA, Haas DK, Norman D, et al. MRI of
normal brain maturation. AJNR Am J Neuroradiol
1986;7:201–8.
17. Barkovich AJ, Kjos BO, Jackson DE Jr, et al. Normal
maturation of the neonatal and infant brain: MR
imaging at 1.5T. Radiology 1988;166:173–80.
18. Ballasteros MC, Hansen PE, Soila K. MR imaging of
the developing human brain. Part 2. Postnatal devel-
opmental. Radiographics 1993;13:611–22.
19. Bird CR, Hedberg M, Drayer BP, et al. MR assess-
ment of myelination in infants and children: useful-
ness of marker sites. AJNR Am J Neuroradiol
1989;10:731–40.
20. Counsell SJ, Maalouf EF, Fletcher AM, et al. MR
imaging assessment of myelination in the very
preterm brain. AJNR Am J Neuroradiol 2002;23:
872–81.
21. Van der Knaap M, Valk J. MR imaging of the various
stages of normal myelination during the first year of
life. Neuroradiology 1990;31:459–70.
22. Kinney HC, Brody BA, Kloman AS, et al. Sequence of
central nervous systemmyelination in human infancy.
II. Patterns of myelination in autopsied infants.
J Neuropathol Exp Neurol 1988;47(3):217–34.
23. Paus T, Collins DL, Evans AC, et al. Maturation of
white matter in the human brain: a review of
magnetic resonance studies. Brain Res Bull 2001;
54(3):255–66.
24. Barkovich AJ, Kjos BO. Normal postnatal develop-
ment of the corpus callosum as demonstrated by
MR imaging. AJNRAm JNeuroradiol 1988;9:487–91.
25. Parazzini C, Bianchini E, Triulzi F. Myelination. In:
Tortori-Donati P, Rossi A, Biancheri R, editors.
Pediatric neuroradiology brain. Berlin: Springer-
Verlag; 2005. p. P21–40.
26. Parazzini C, Baldoli C, Scotti G, et al. Terminal zones
of myelination: MR evaluation of children aged
20–40 months. AJNR Am J Neuroradiol 2002;23:
1669–73.
27. Maricich SM, Azizi P, Jones JY, et al. Myelination as
assessed by conventional MR imaging as normal in
young children with idiopathic developmental delay.
AJNR Am J Neuroradiol 2007;28:1602–5.


![Oligodendroglial myelination requires astrocyte … 5...Accordingly, genetic impairment of endogenous lipid synthesis in Schwann cells (SC) interferes with the acute phase of PNS myelination[5]](https://img.pdfslide.net/doc/110x75/5ca0fba988c9932f098b64ec/oligodendroglial-myelination-requires-astrocyte-5accordingly-genetic-impairment.jpg)