Embed Size (px)
Citation preview
NORMAL PROBABILITY CURVE
Dr. Kuldeep Kaur
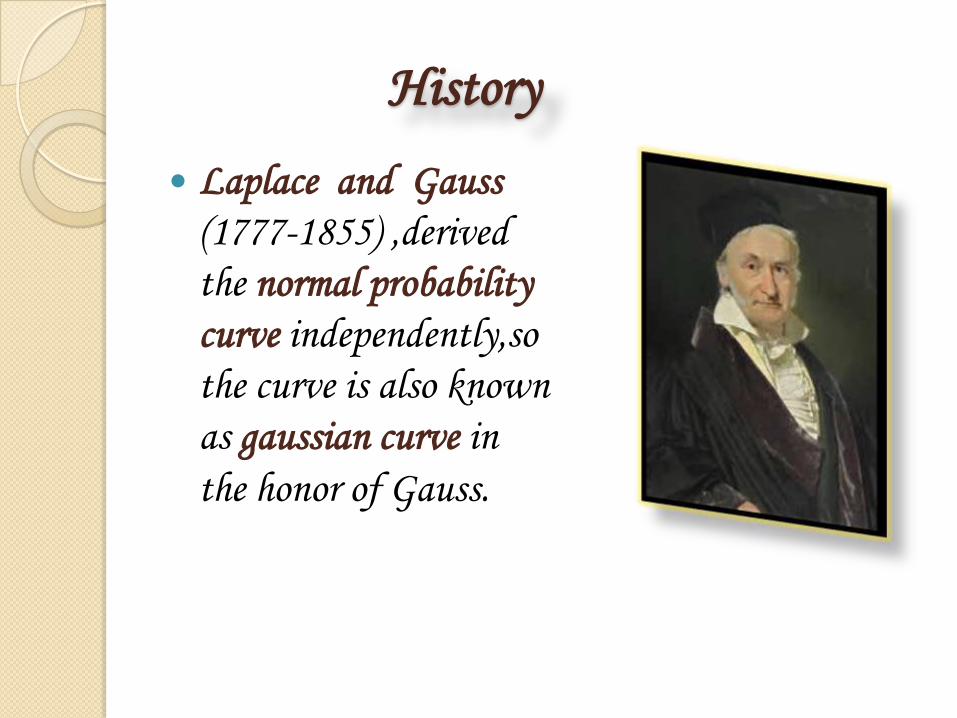
History
Laplace and Gauss
(1777-1855) ,derived
the normal probability
curve independently,so
the curve is also known
as gaussian curve in
the honor of Gauss.
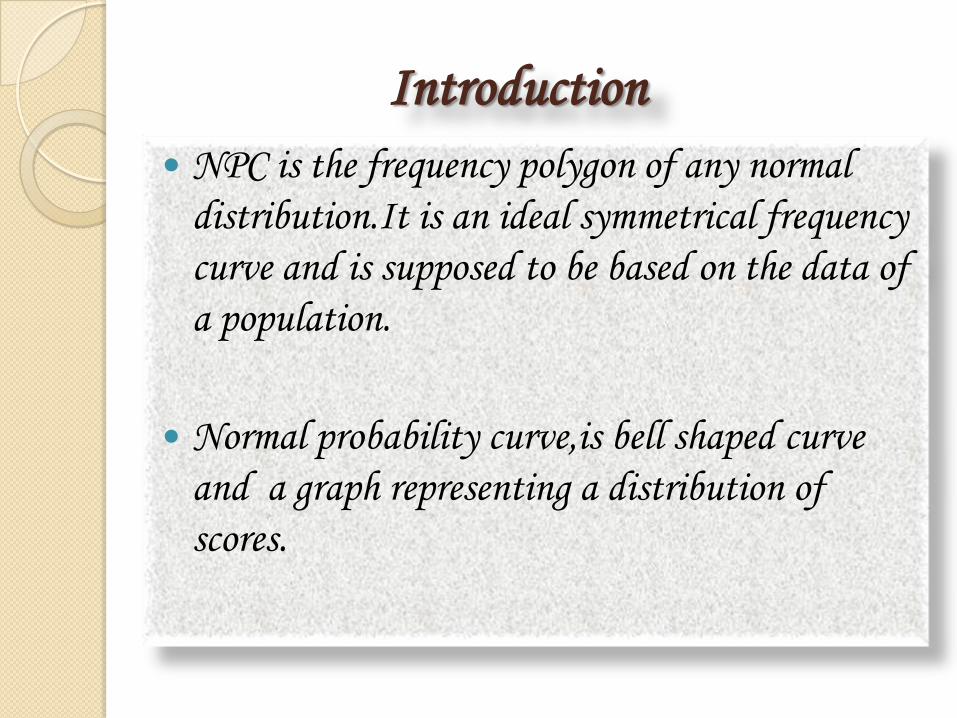
Introduction
NPC is the frequency polygon of any normal
distribution.It is an ideal symmetrical frequency
curve and is supposed to be based on the data of
a population.
Normal probability curve,is bell shaped curve
and a graph representing a distribution of
scores.
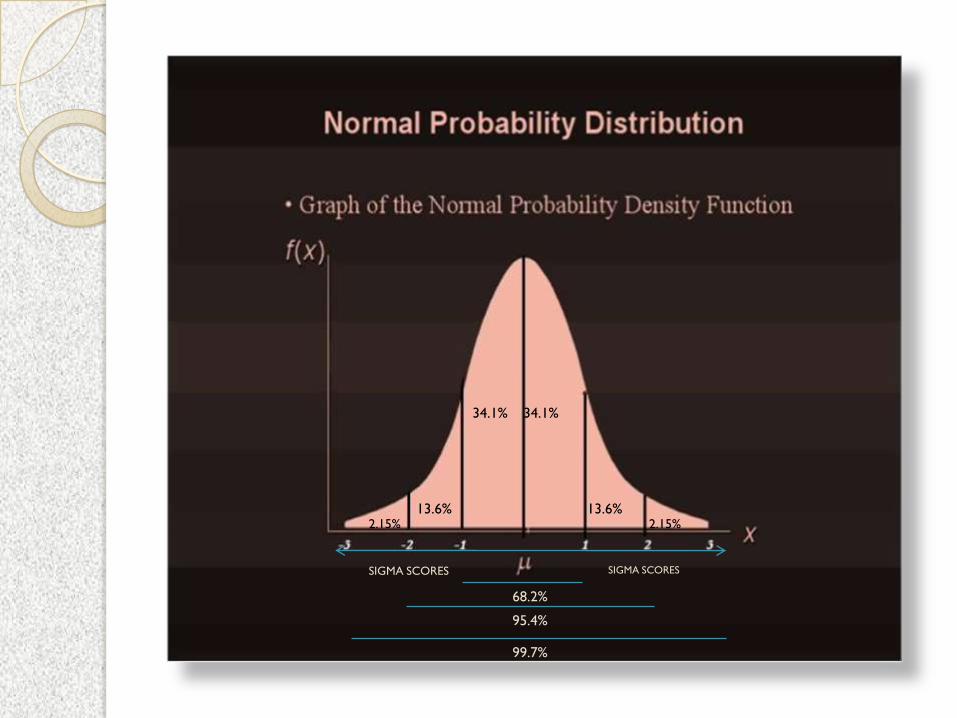
68.2%
95.4%
99.7%
34.1% 34.1%
13.6% 13.6% 2.15% 2.15%
SIGMA SCORES SIGMA SCORES
Characteristics/Properties of NPC
NPC is a bell shaped curve.
All the three central tendencies:mean,medianand mode coincide in it and are equal.
NPC is asymptotic.It approaches but never touches the base line.
The NPC is bilateral symmetrical.Itimplies size,shape and slope of the curve on one side are identical to that of the other side.
The curve has its maximum height or ordinate at the starting point.ie.the mean of the distributiom.
The first and the third quartile(Q1&Q3) are at equal distance from Q2 or median.
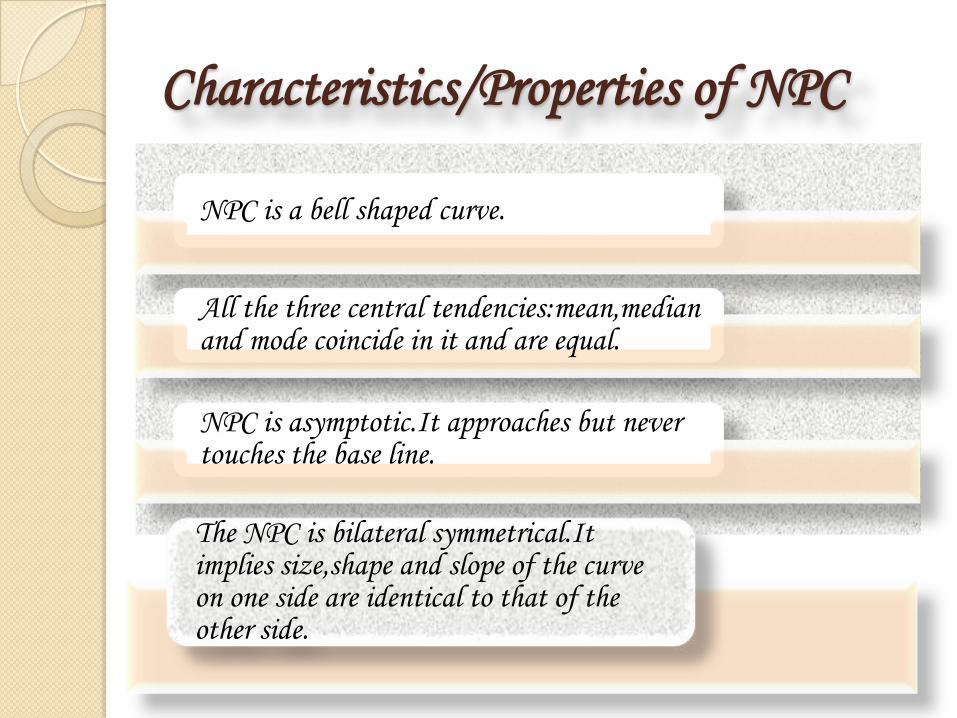
The point of inflection(where the curvature changes its direction) is at point +- 1 σ,up and below the mean.
The total area under the curve is taken arbitarily to be 10,000,for a greater ease in the computation.
The curve extends on both sides,ie. -3σ distance on the left to +3σ on the right.
To find the deviations from the point of departure(mean),standard deviation of the distribution(σ) is used as a unit of measurement.
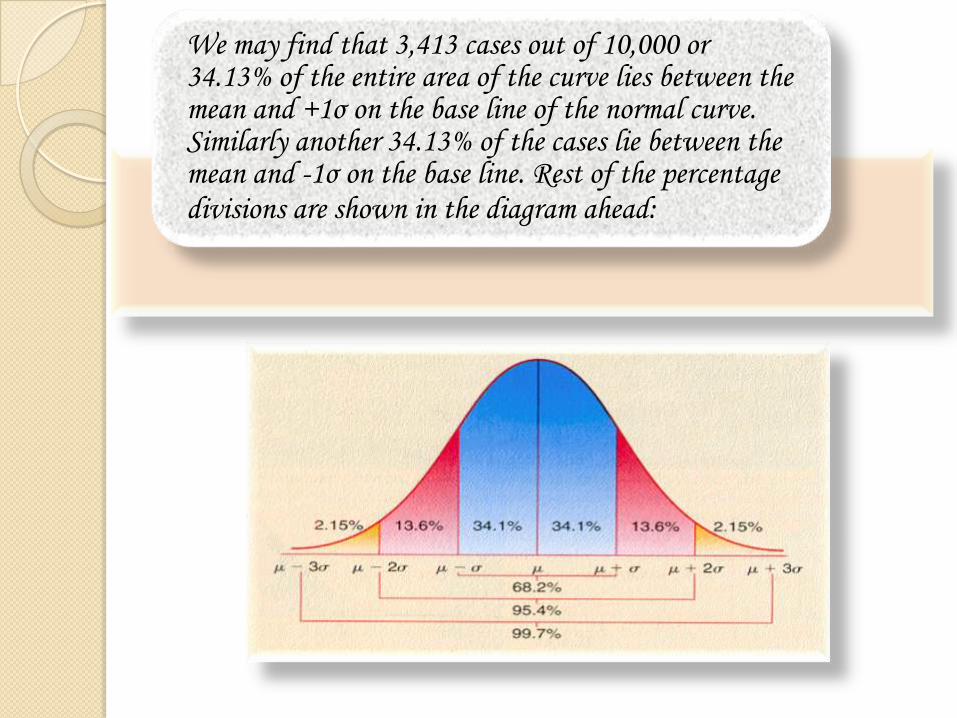
We may find that 3,413 cases out of 10,000 or 34.13% of the entire area of the curve lies between the mean and +1σ on the base line of the normal curve. Similarly another 34.13% of the cases lie between the mean and -1σ on the base line. Rest of the percentage divisions are shown in the diagram ahead:
NPC in terms of skewness
Skewness refers to lack of symmetry.A normal
curve is a perfect symmetrical curve.In many
distributions which deviate from the normal,the
value of mean,median and mode are different
and there is no symmetry between the two
halves of the curve.Such distributions are said to
be skewed.
Negative skewness
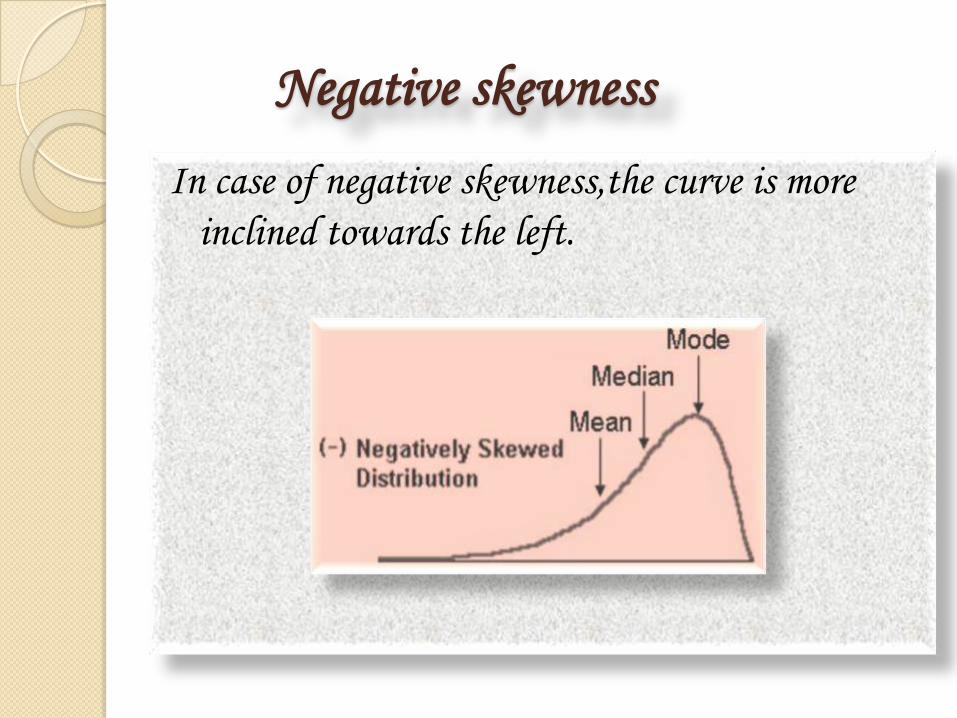
In case of negative skewness,the curve is more
inclined towards the left.
Positive skewness
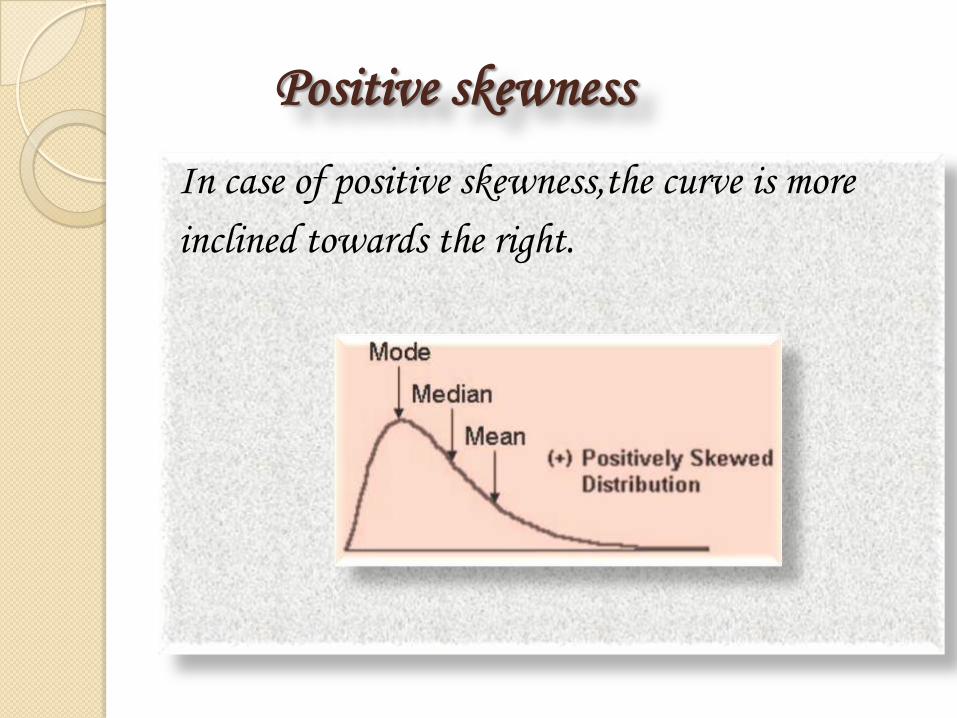
In case of positive skewness,the curve is more
inclined towards the right.
Formula for skewness
Sk= 3(M-md)/σ
(In terms of frequency distribution)
Sk= [P90+P10/2]-P50
(In terms of percentile)
NPC in terms of kurtosis
When there are very few individuals whose
scores are near to the average score for their
group,the curve representing such a distribution
becomes ‘flattened’ in the middle.On the other
hand,when there are too many cases in the
central area,the distribution curve becomes too
‘peaked’ in comparison with the normal
curve.Both these characteristics of being flat or
peaked ,are used to describe the term kurtosis.

Platykurtic
A freuency distribution is said to be platykurtic
when the curve is flatter than the normal curve.
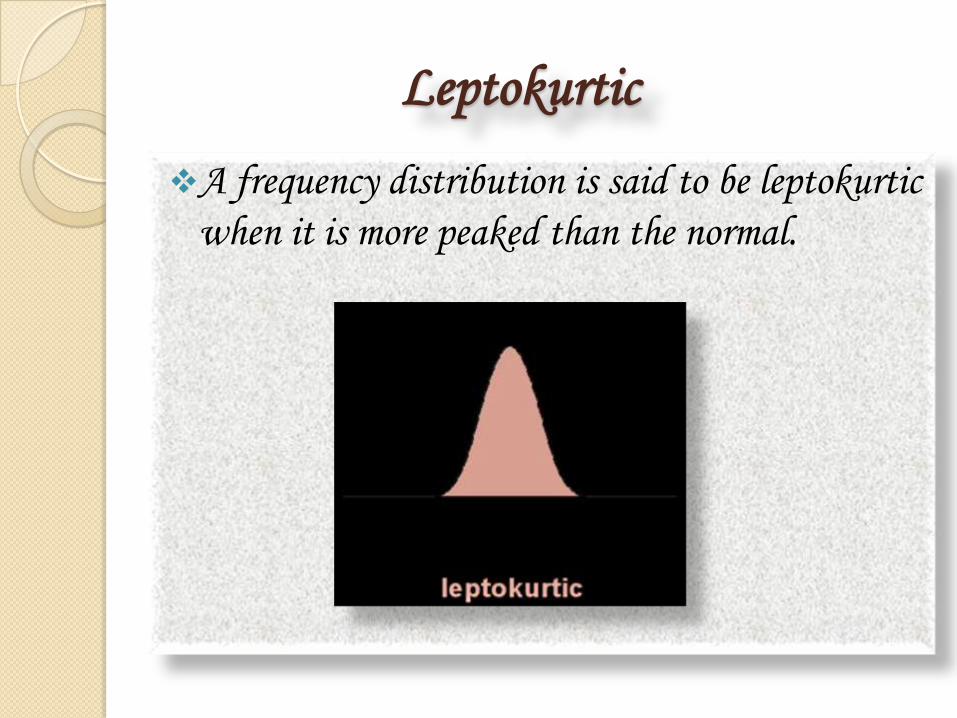
Leptokurtic
A frequency distribution is said to be leptokurtic
when it is more peaked than the normal.
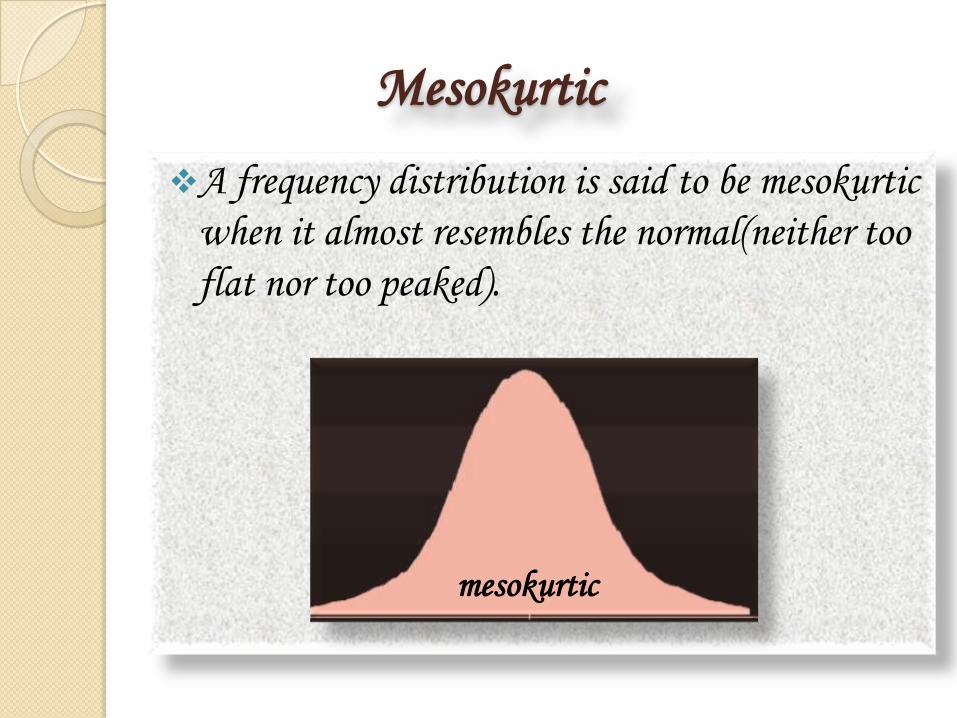
Mesokurtic
A frequency distribution is said to be mesokurtic
when it almost resembles the normal(neither too
flat nor too peaked).
mesokurtic
Formula for kurtosis
Ku= Q/P90-P10
Or;
Ku= [Q75-Q25/2]/P90-P10
Applications of the normal curve
Use as a model -> Normal curve represents a model
distribution.It can be used as a model to:
1)Compare various distributions with it,ie. To
say,whether the distribution is normal or not
and,if not,in what way it diverges from the
normal.
2)Compare two or more distributions in terms of
overlapping;and
3)Evaluate student’s performance from their scores.
Computing percentiles and percentile ranks
Normal probability curve may
be conveniently used for
computing percentiles and
percentile ranks in a given
normal distribution.
Ability grouping
A group of individuals may be conveniently
grouped into certain categories as
A,B,C,D,E(very good,good,average,poor,very
poor) in terms of some trait(assumed to be
normally distributed),with the help of a normal
curve.
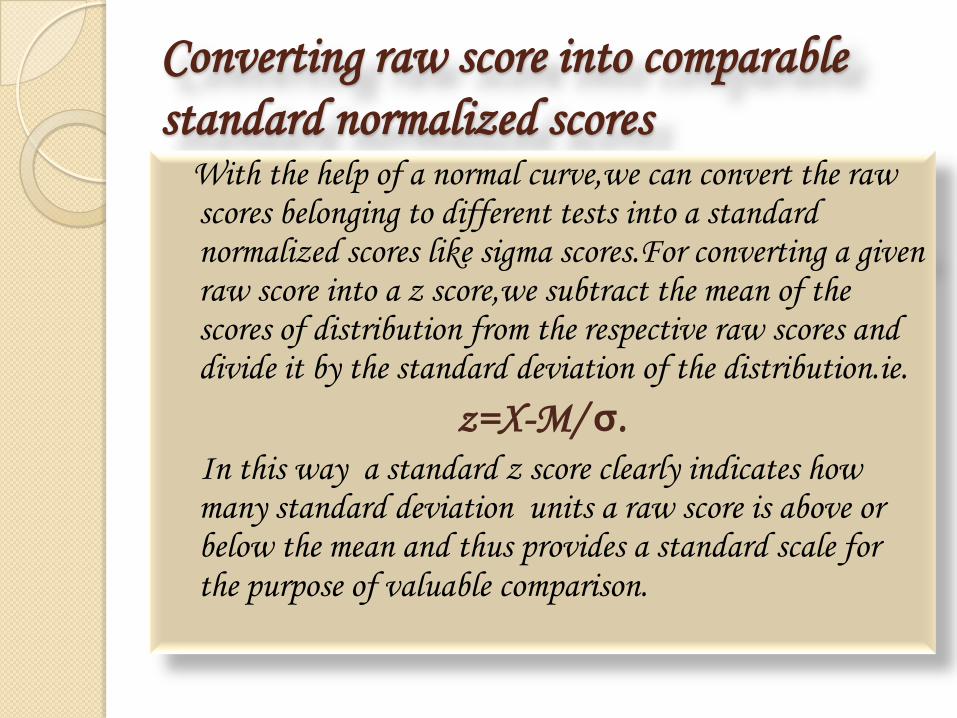
Converting raw score into comparable
standard normalized scoresWith the help of a normal curve,we can convert the raw scores belonging to different tests into a standard normalized scores like sigma scores.For converting a given raw score into a z score,we subtract the mean of the scores of distribution from the respective raw scores and divide it by the standard deviation of the distribution.ie.
z=X-M/ σ.In this way a standard z score clearly indicates how many standard deviation units a raw score is above or below the mean and thus provides a standard scale for the purpose of valuable comparison.
Determining the relative difficulty of test items
Normal curve provides the simplest rational
method of scaling test items for difficulty and
therefore,may be conveniently employed for
determining the relative difficulty of test
questions,problems and other test items.
Making use of the table of normal curve
Table A of the normal curve provides the
fractional parts of the total area (taken as
10,000) under the curve in relation to the
respective sigma distances from the mean.This
table may therefore be used to find the
fractional part of the total area when z scores or
sigma scores are given and also to find the sigma
or z scores,when the fractional parts of the total
area are given.
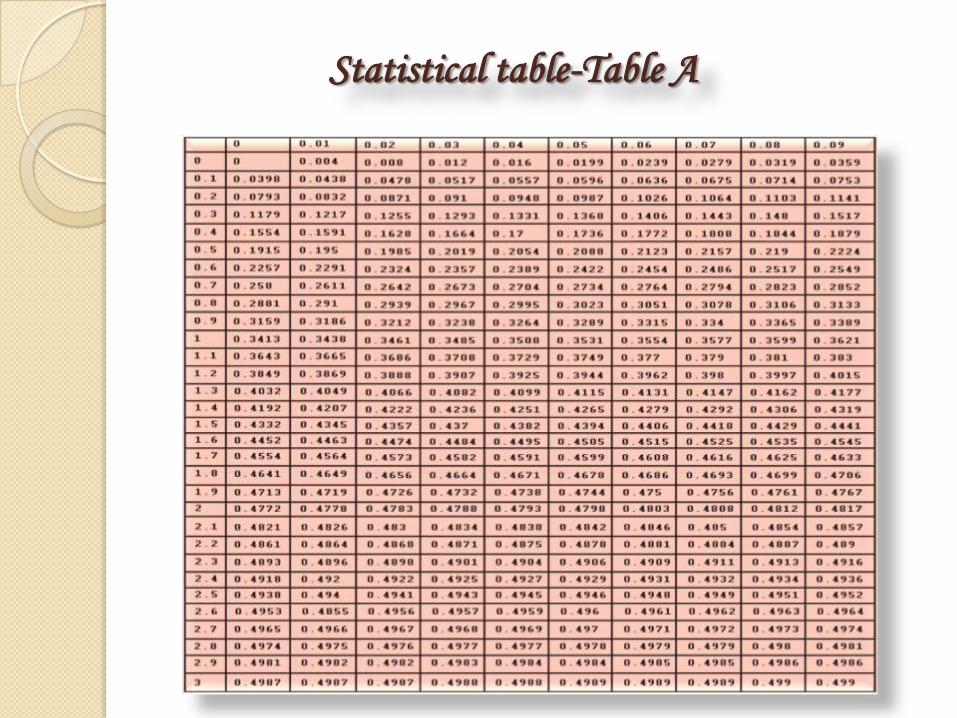
Statistical table-Table A
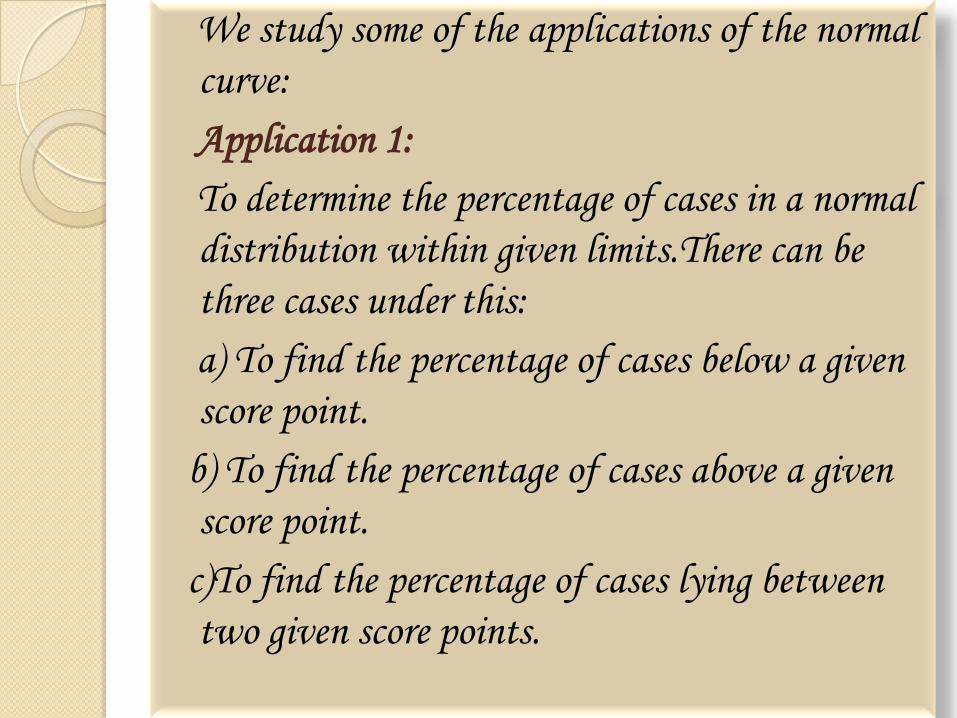
We study some of the applications of the normal
curve:
Application 1:
To determine the percentage of cases in a normal
distribution within given limits.There can be
three cases under this:
a) To find the percentage of cases below a given
score point.
b) To find the percentage of cases above a given
score point.
c)To find the percentage of cases lying between
two given score points.
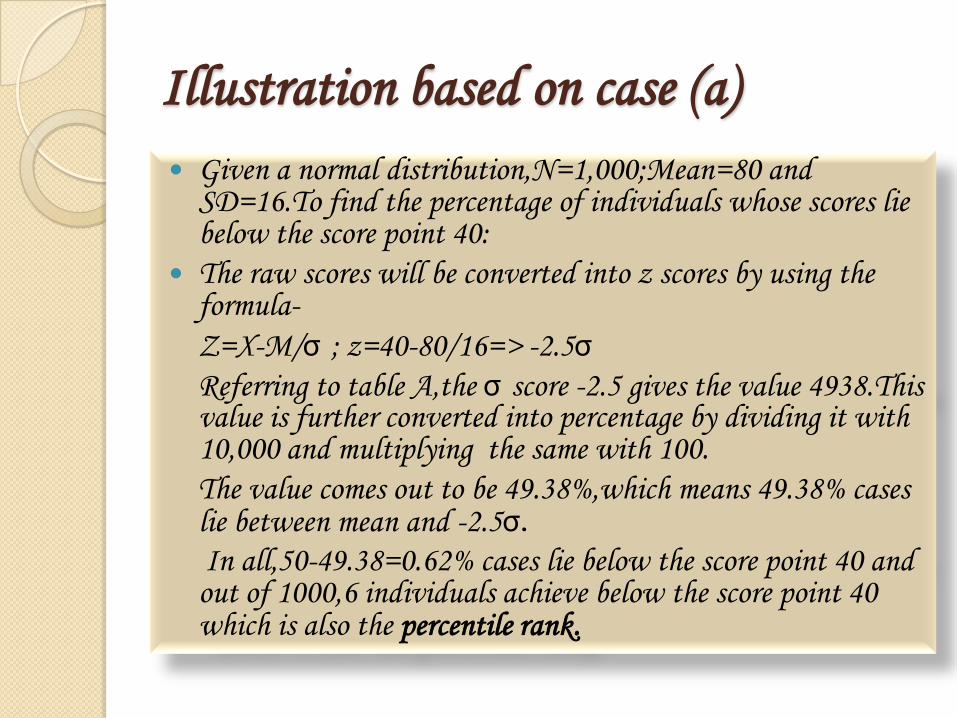
Illustration based on case (a)
Given a normal distribution,N=1,000;Mean=80 and SD=16.To find the percentage of individuals whose scores lie below the score point 40:
The raw scores will be converted into z scores by using the formula-
Z=X-M/σ ; z=40-80/16=> -2.5σReferring to table A,the σ score -2.5 gives the value 4938.This value is further converted into percentage by dividing it with 10,000 and multiplying the same with 100.
The value comes out to be 49.38%,which means 49.38% cases lie between mean and -2.5σ.
In all,50-49.38=0.62% cases lie below the score point 40 and out of 1000,6 individuals achieve below the score point 40 which is also the percentile rank.
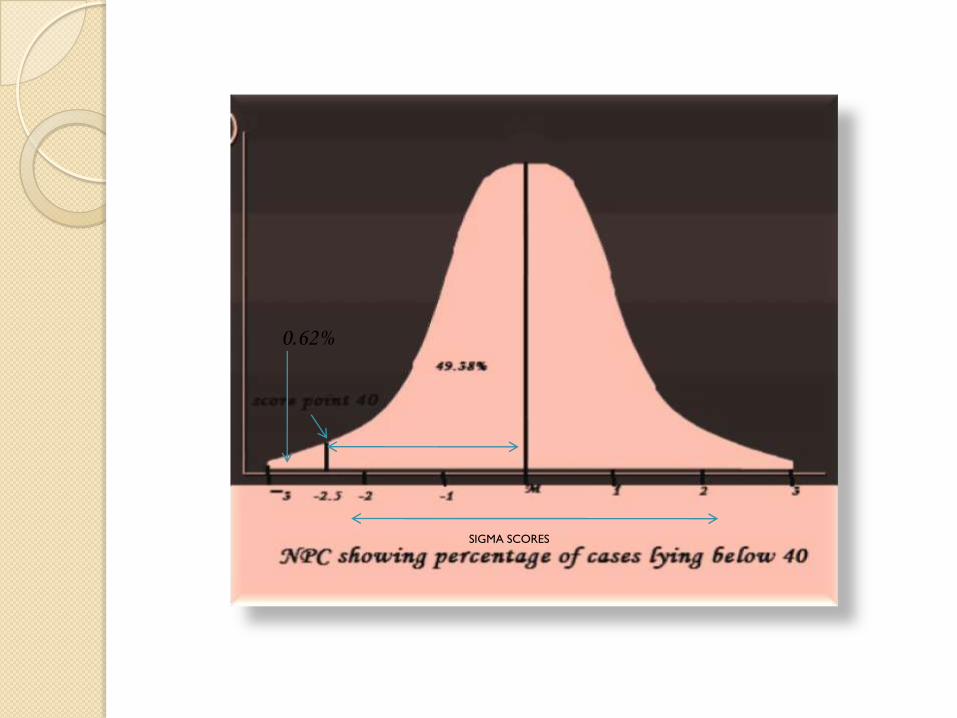
SIGMA SCORES
0.62%
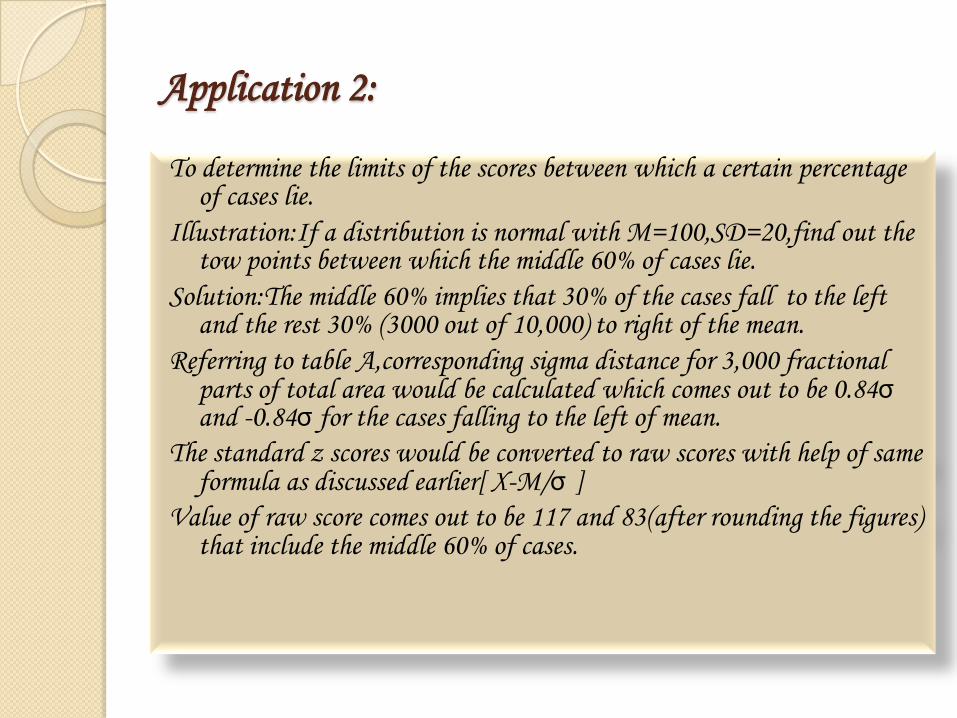
Application 2:
To determine the limits of the scores between which a certain percentage of cases lie.
Illustration:If a distribution is normal with M=100,SD=20,find out the tow points between which the middle 60% of cases lie.
Solution:The middle 60% implies that 30% of the cases fall to the left and the rest 30% (3000 out of 10,000) to right of the mean.
Referring to table A,corresponding sigma distance for 3,000 fractional parts of total area would be calculated which comes out to be 0.84σand -0.84σ for the cases falling to the left of mean.
The standard z scores would be converted to raw scores with help of same formula as discussed earlier[ X-M/σ ]
Value of raw score comes out to be 117 and 83(after rounding the figures) that include the middle 60% of cases.
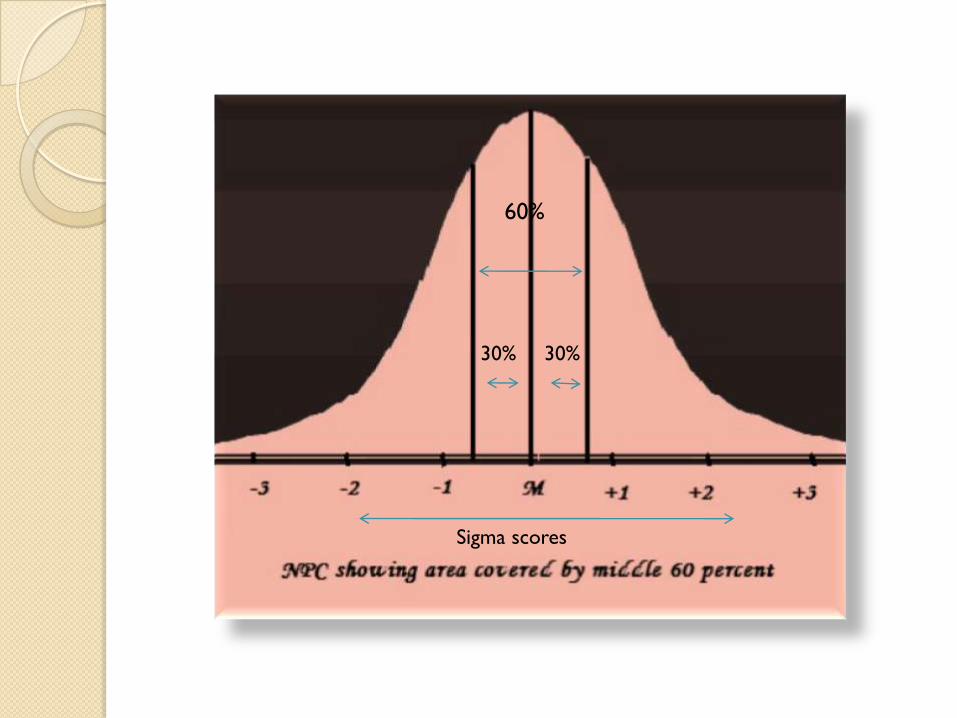
60%
30% 30%
Sigma scores
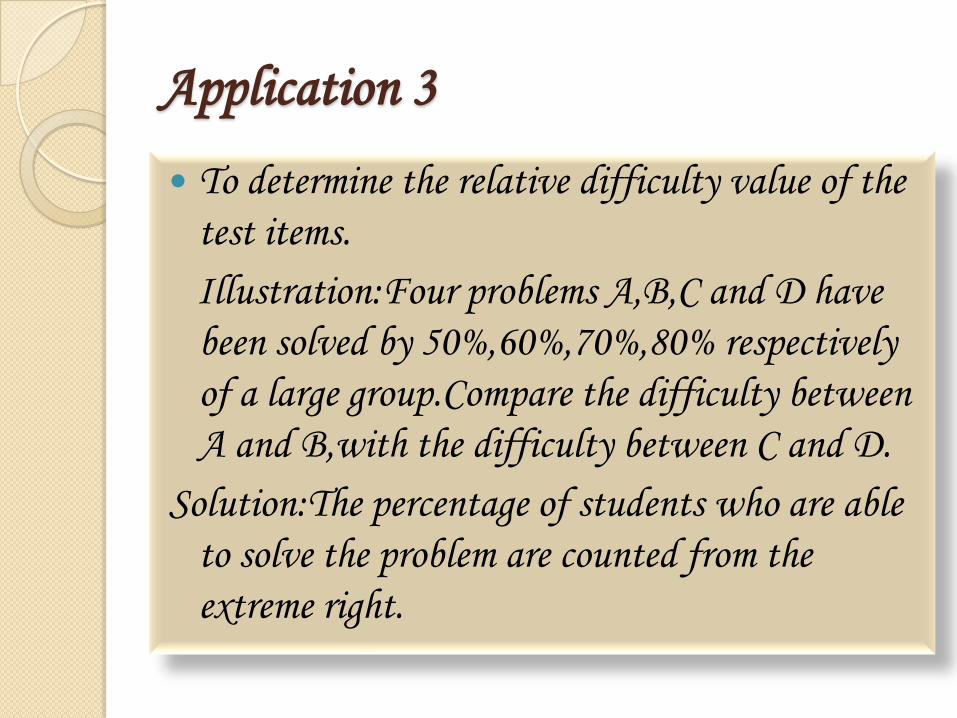
Application 3
To determine the relative difficulty value of the
test items.
Illustration:Four problems A,B,C and D have
been solved by 50%,60%,70%,80% respectively
of a large group.Compare the difficulty between
A and B,with the difficulty between C and D.
Solution:The percentage of students who are able
to solve the problem are counted from the
extreme right.
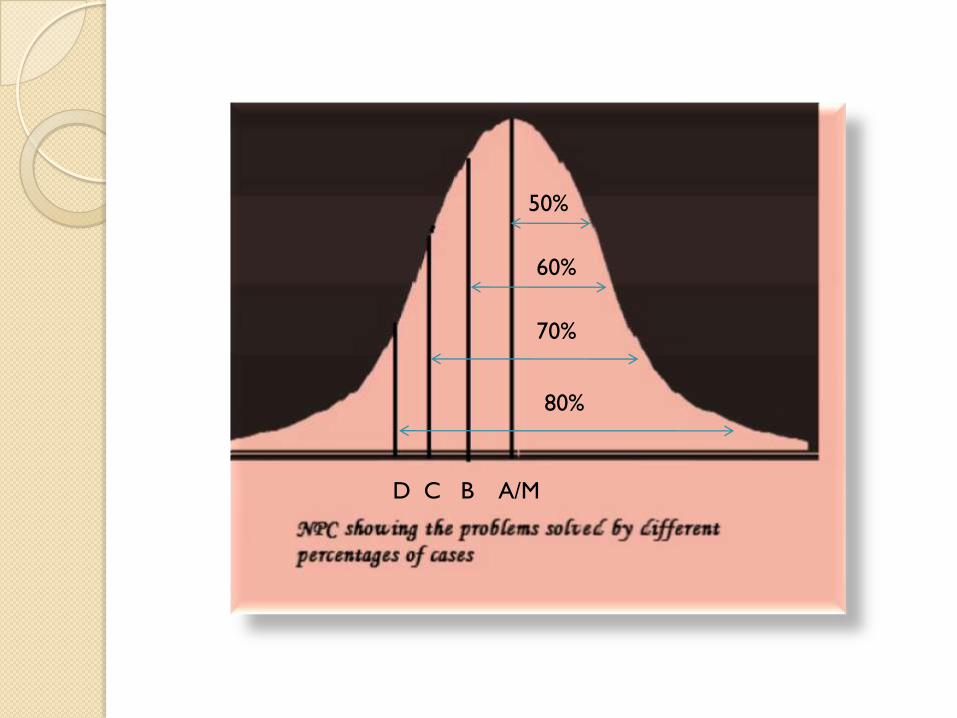
50%
60%
70%
80%
D C B A/M
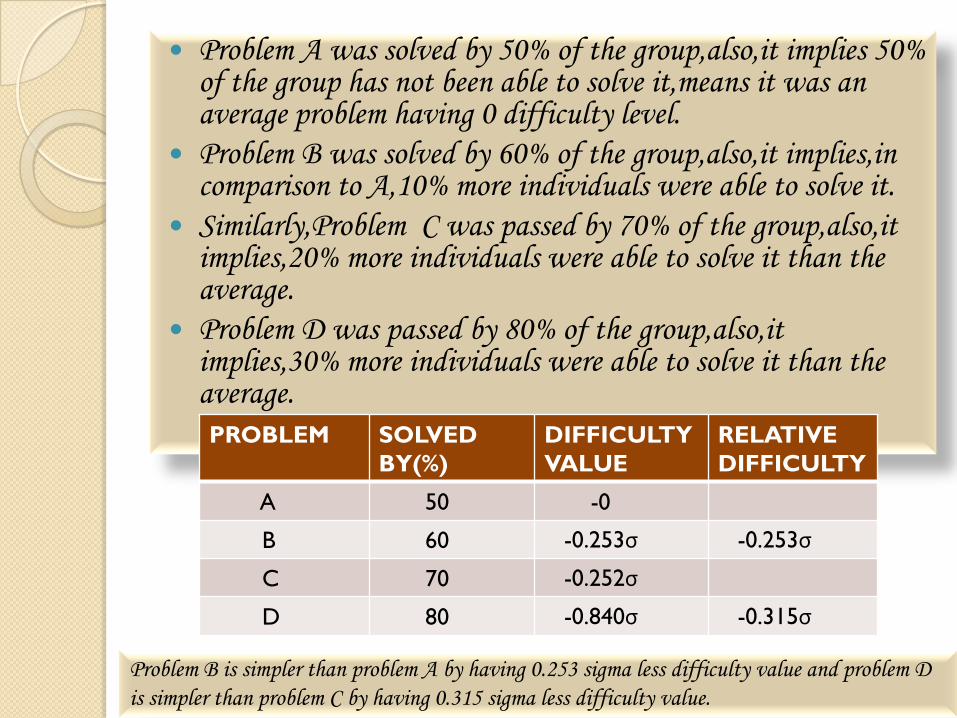
Problem A was solved by 50% of the group,also,it implies 50% of the group has not been able to solve it,means it was an average problem having 0 difficulty level.
Problem B was solved by 60% of the group,also,it implies,incomparison to A,10% more individuals were able to solve it.
Similarly,Problem C was passed by 70% of the group,also,itimplies,20% more individuals were able to solve it than the average.
Problem D was passed by 80% of the group,also,itimplies,30% more individuals were able to solve it than the average.
PROBLEM SOLVED
BY(%)
DIFFICULTY
VALUE
RELATIVE
DIFFICULTY
A 50 -0
B 60 -0.253σ -0.253σ
C 70 -0.252σ
D 80 -0.840σ -0.315σ
Problem B is simpler than problem A by having 0.253 sigma less difficulty value and problem D
is simpler than problem C by having 0.315 sigma less difficulty value.
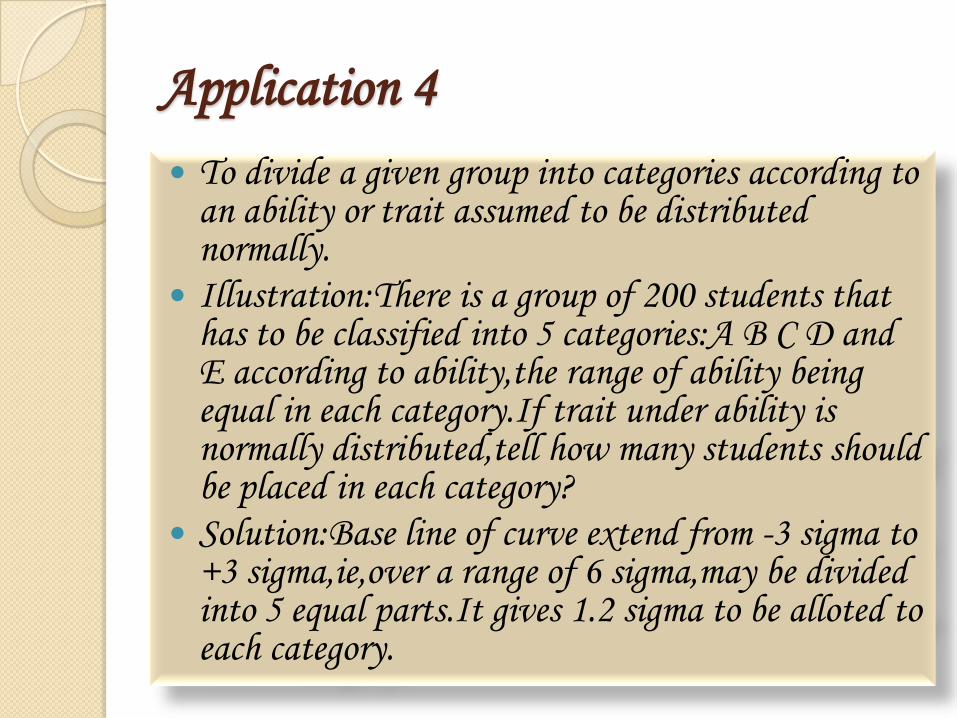
Application 4
To divide a given group into categories according to an ability or trait assumed to be distributed normally.
Illustration:There is a group of 200 students that has to be classified into 5 categories:A B C D and E according to ability,the range of ability being equal in each category.If trait under ability is normally distributed,tell how many students should be placed in each category?
Solution:Base line of curve extend from -3 sigma to +3 sigma,ie,over a range of 6 sigma,may be divided into 5 equal parts.It gives 1.2 sigma to be alloted to each category.
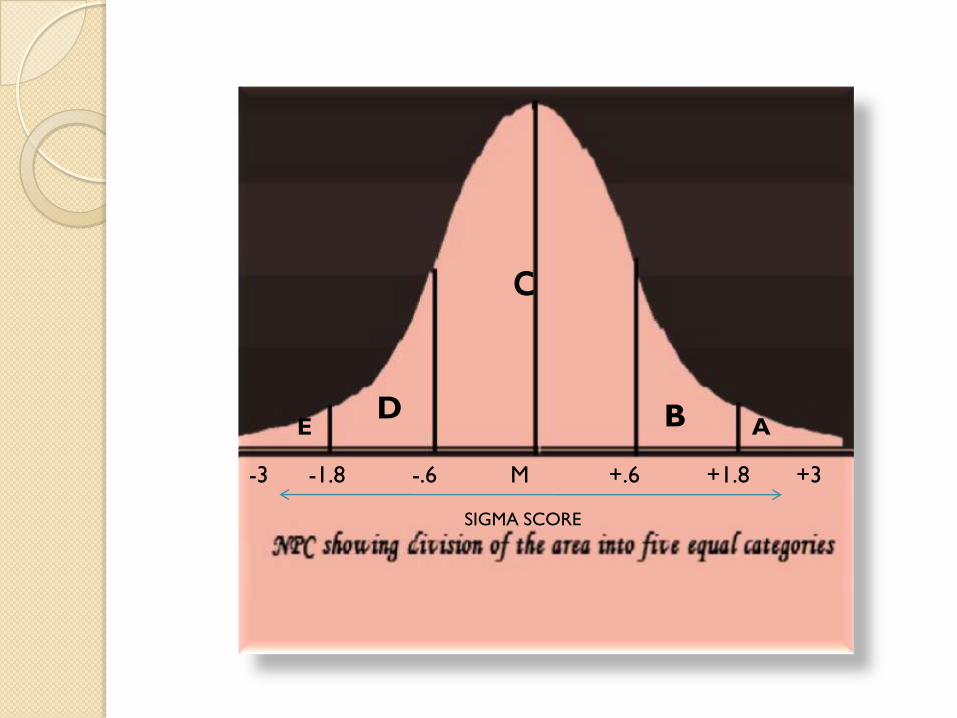
c
BDE A
-3 -1.8 -.6 M +.6 +1.8 +3
SIGMA SCORE
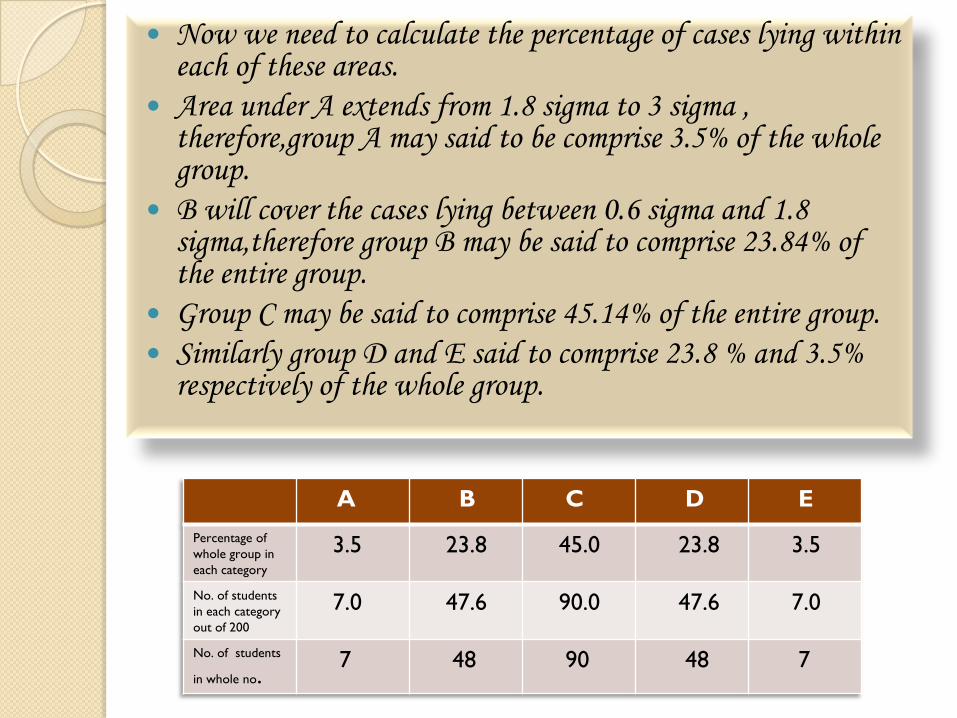
Now we need to calculate the percentage of cases lying within each of these areas.
Area under A extends from 1.8 sigma to 3 sigma , therefore,group A may said to be comprise 3.5% of the whole group.
B will cover the cases lying between 0.6 sigma and 1.8 sigma,therefore group B may be said to comprise 23.84% of the entire group.
Group C may be said to comprise 45.14% of the entire group.
Similarly group D and E said to comprise 23.8 % and 3.5% respectively of the whole group.
A B C D E
Percentage of
whole group in
each category
3.5 23.8 45.0 23.8 3.5
No. of students
in each category
out of 200
7.0 47.6 90.0 47.6 7.0
No. of students
in whole no.7 48 90 48 7

THANKYOU..