Embed Size (px)
Citation preview
Northern White Sand versus
Texas Brown Sand—Why
Wisconsin Sand Is Still Important
Dr. Kent M. Syverson, P.G.
Dept. of Geology
UW-Eau Claire
http://www.uwec.edu/geology/index.htm
Texas
From Kyle &
McBride (2014)
Wisconsin
From Benson & Wilson (2015)
12 May 2017
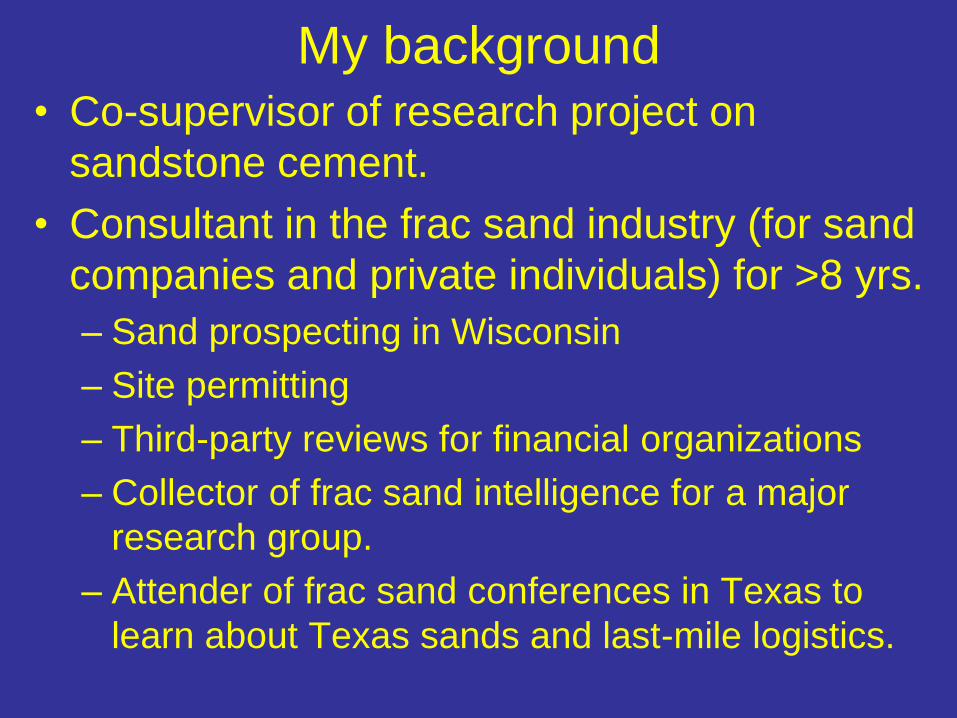
My background • Co-supervisor of research project on
sandstone cement.
• Consultant in the frac sand industry (for sand
companies and private individuals) for >8 yrs.
– Sand prospecting in Wisconsin
– Site permitting
– Third-party reviews for financial organizations
– Collector of frac sand intelligence for a major
research group.
– Attender of frac sand conferences in Texas to
learn about Texas sands and last-mile logistics.
Goals of talk
• Describe factors influencing the growth of
the sand industry in Wisconsin and Texas.
• Explain the attributes of “top-tier” Northern
White frac sands from WI, MN, and IL
• Summarize some attributes of Texas
brown sands (Hickory sand)
• Discuss the trends helping/hindering the
prospects for Wisconsin sand in today’s
market.
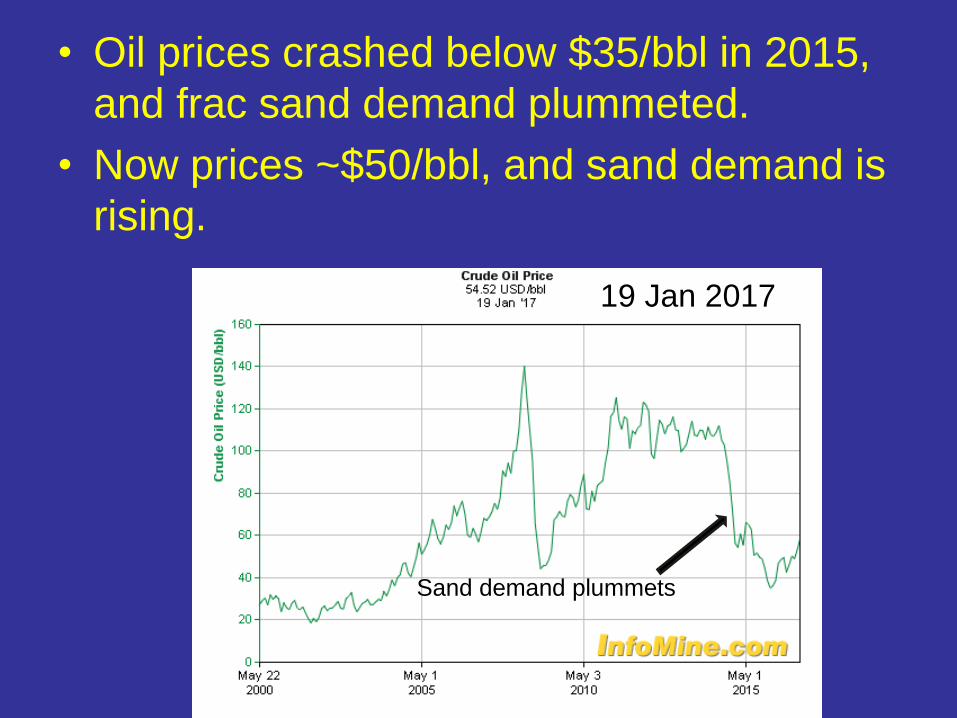
• Oil prices crashed below $35/bbl in 2015,
and frac sand demand plummeted.
• Now prices ~$50/bbl, and sand demand is
rising.
19 Jan 2017
Sand demand plummets
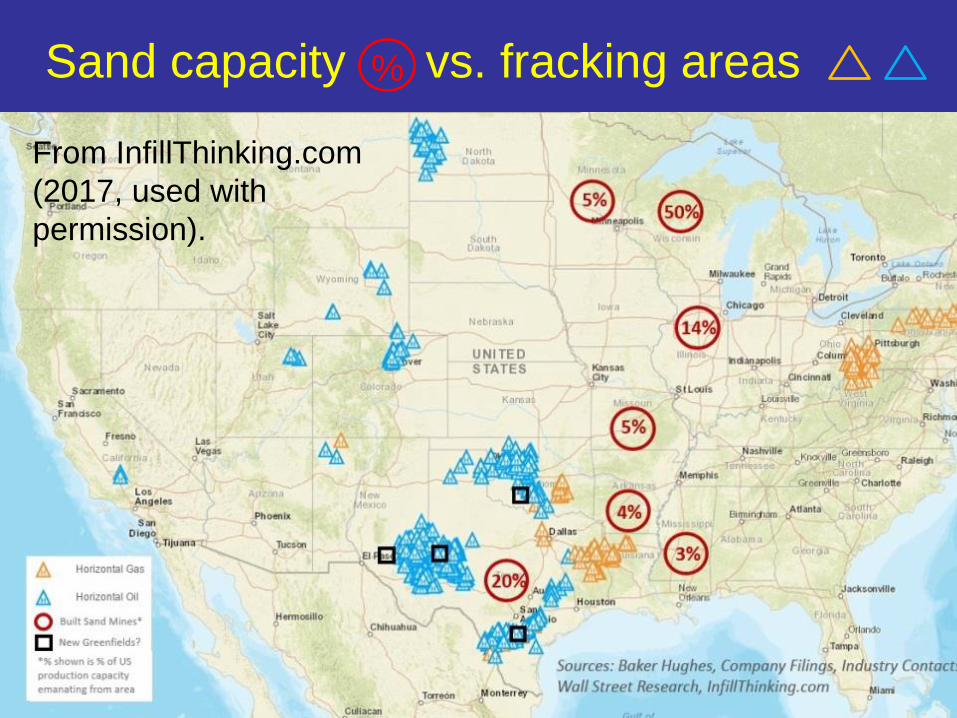
Sand capacity vs. fracking areas
From InfillThinking.com
(2017, used with
permission).
%
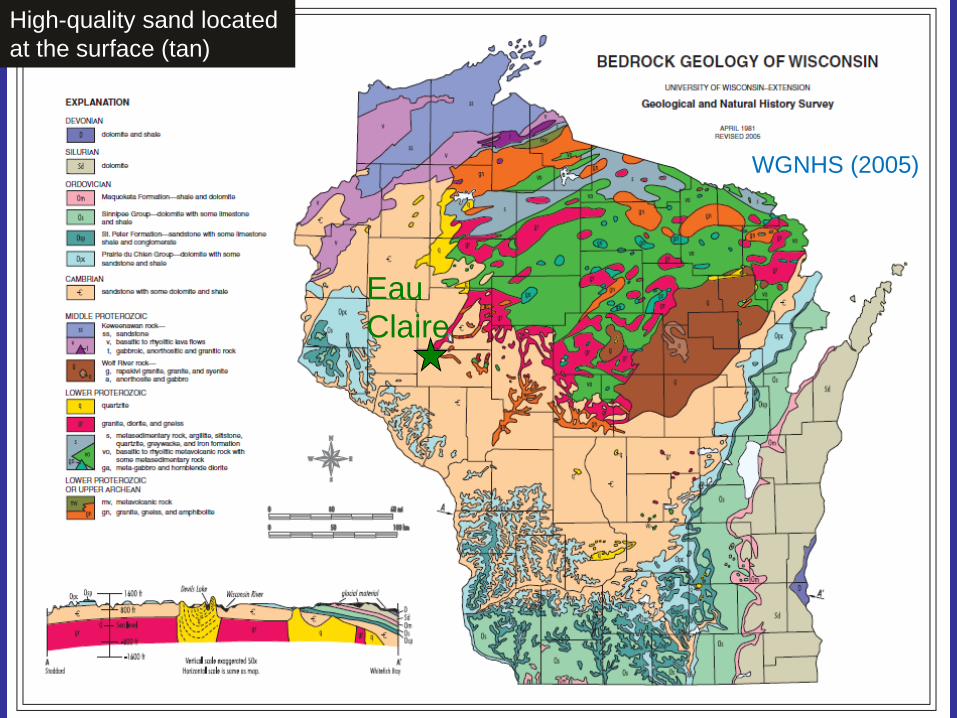
High-quality sand located
at the surface (tan)
WGNHS (2005)
Eau
Claire
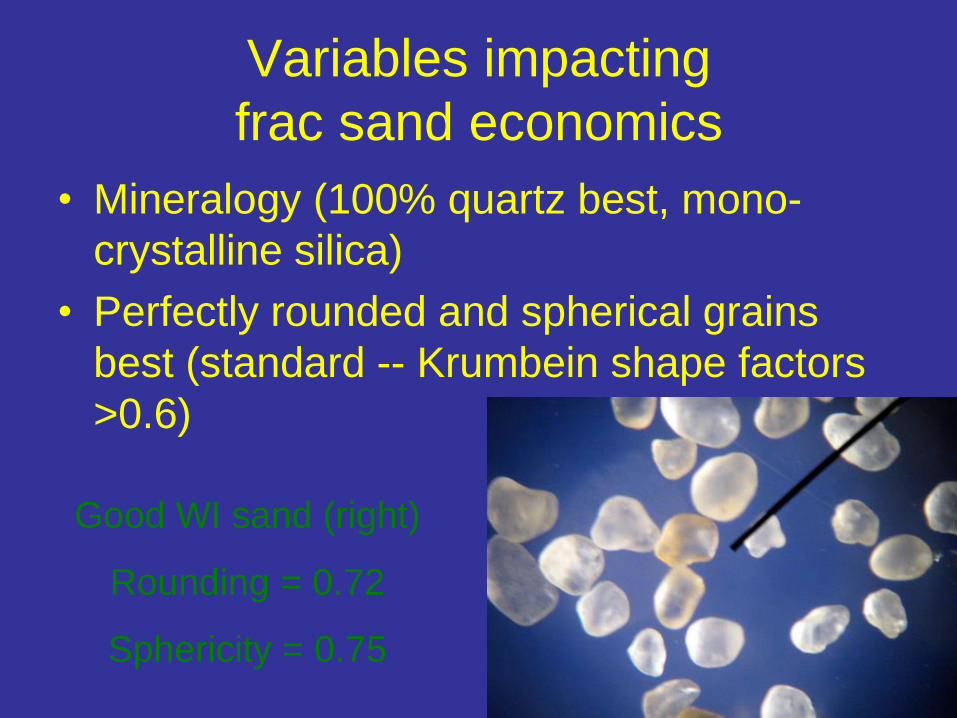
Variables impacting
frac sand economics
• Mineralogy (100% quartz best, mono-
crystalline silica)
• Perfectly rounded and spherical grains
best (standard -- Krumbein shape factors
>0.6)
Good WI sand (right)
Rounding = 0.72
Sphericity = 0.75
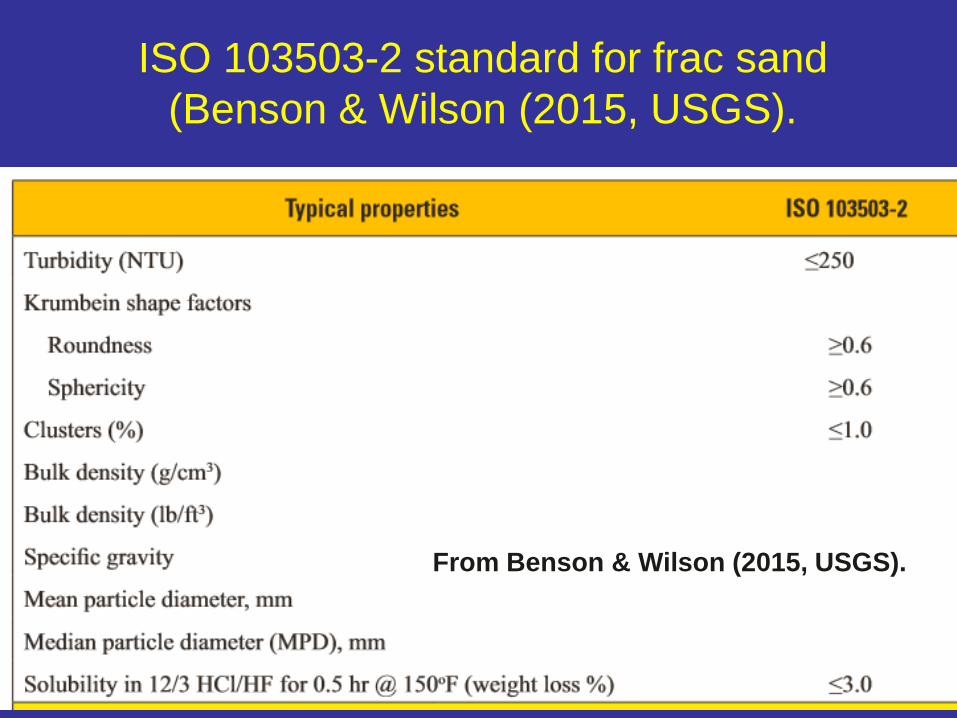
ISO 103503-2 standard for frac sand
(Benson & Wilson (2015, USGS).
From Benson & Wilson (2015, USGS).
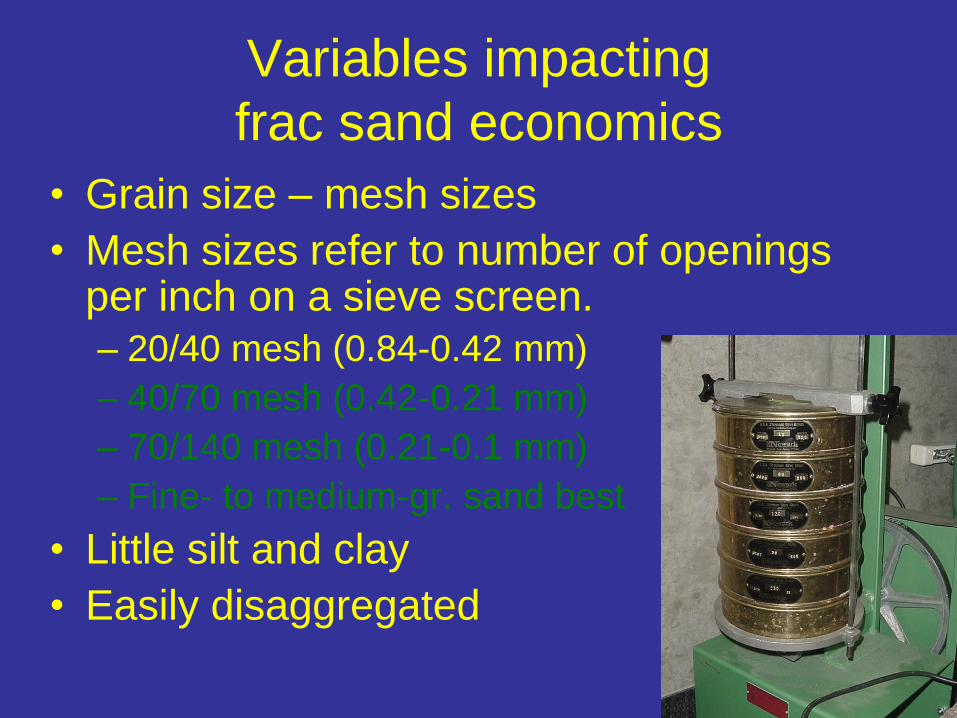
Variables impacting
frac sand economics
• Grain size – mesh sizes
• Mesh sizes refer to number of openings per inch on a sieve screen.
– 20/40 mesh (0.84-0.42 mm)
– 40/70 mesh (0.42-0.21 mm)
– 70/140 mesh (0.21-0.1 mm)
– Fine- to medium-gr. sand best
• Little silt and clay
• Easily disaggregated
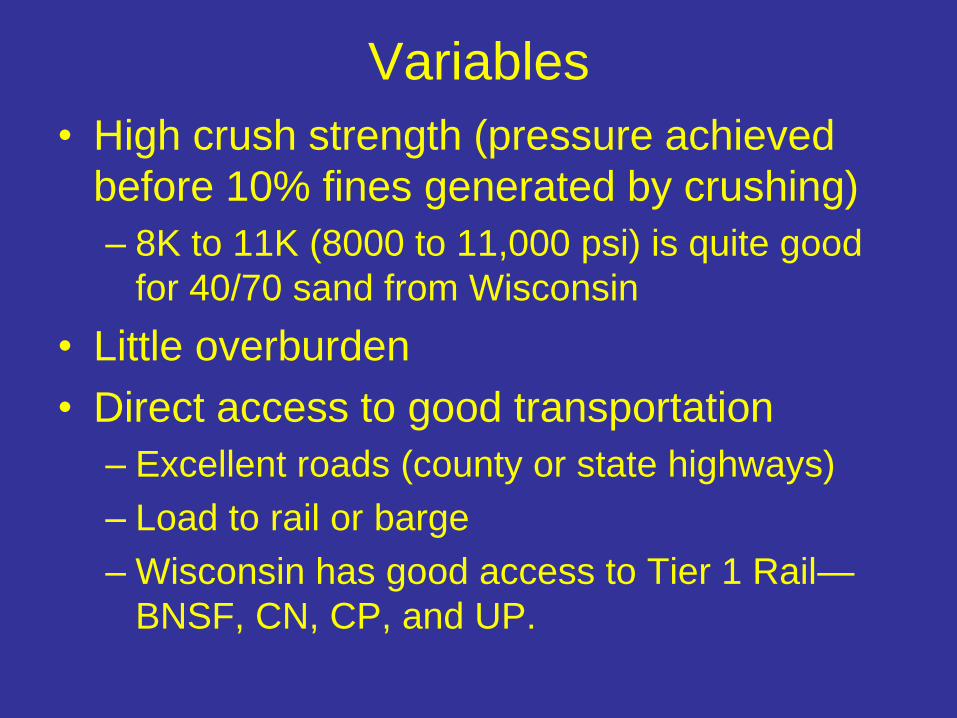
Variables
• High crush strength (pressure achieved
before 10% fines generated by crushing)
– 8K to 11K (8000 to 11,000 psi) is quite good
for 40/70 sand from Wisconsin
• Little overburden
• Direct access to good transportation
– Excellent roads (county or state highways)
– Load to rail or barge
– Wisconsin has good access to Tier 1 Rail—
BNSF, CN, CP, and UP.
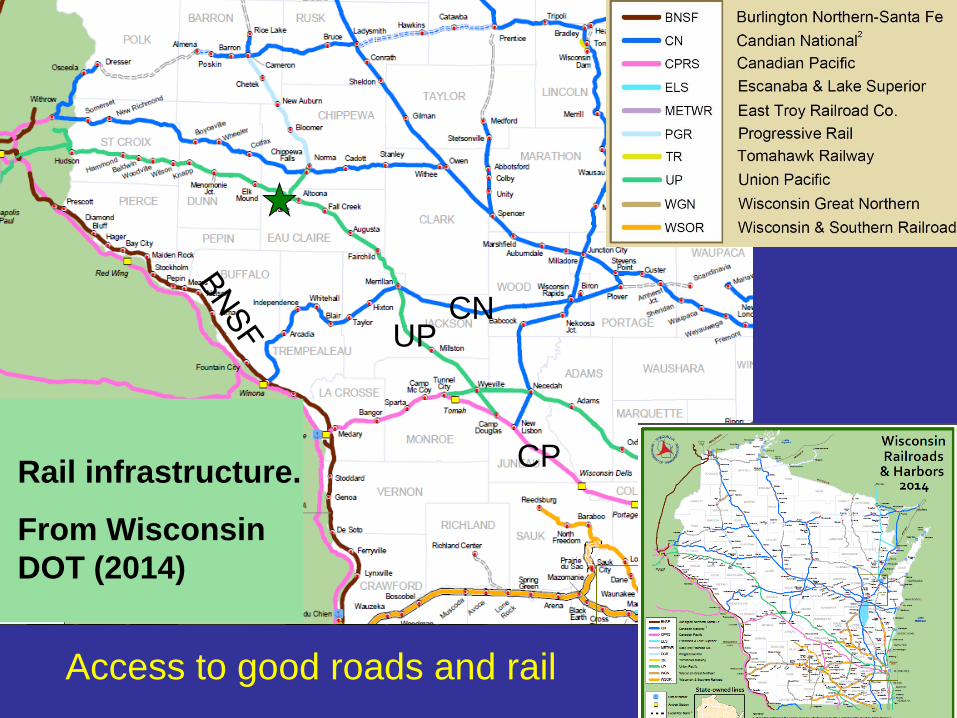
Rail infrastructure.
From Wisconsin
DOT (2014)
Access to good roads and rail
CN
CP
UP
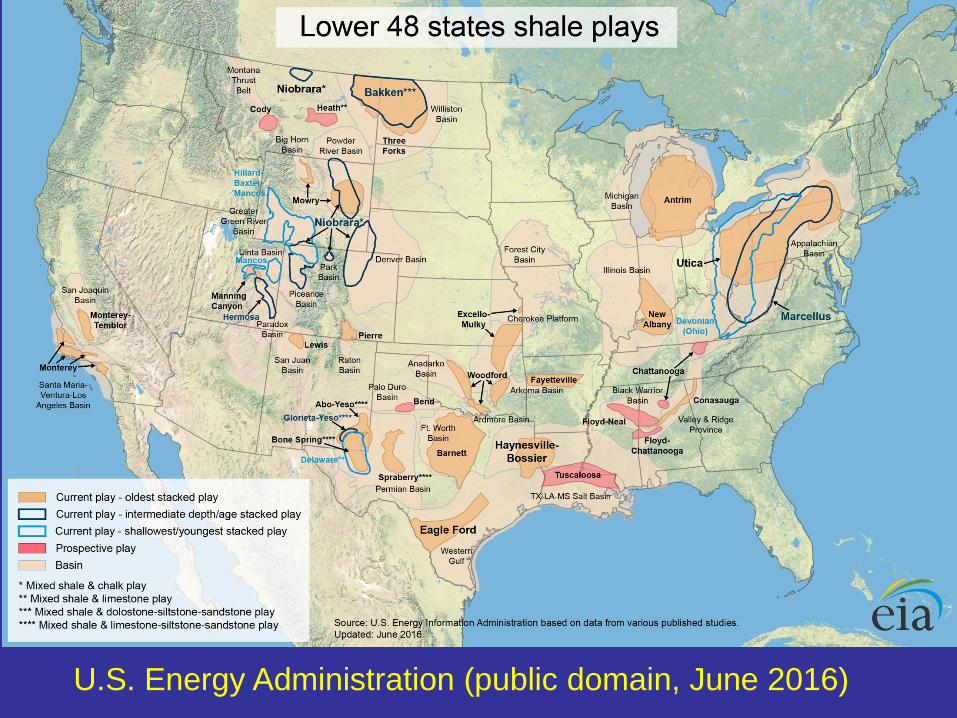
U.S. Energy Administration (public domain, June 2016)
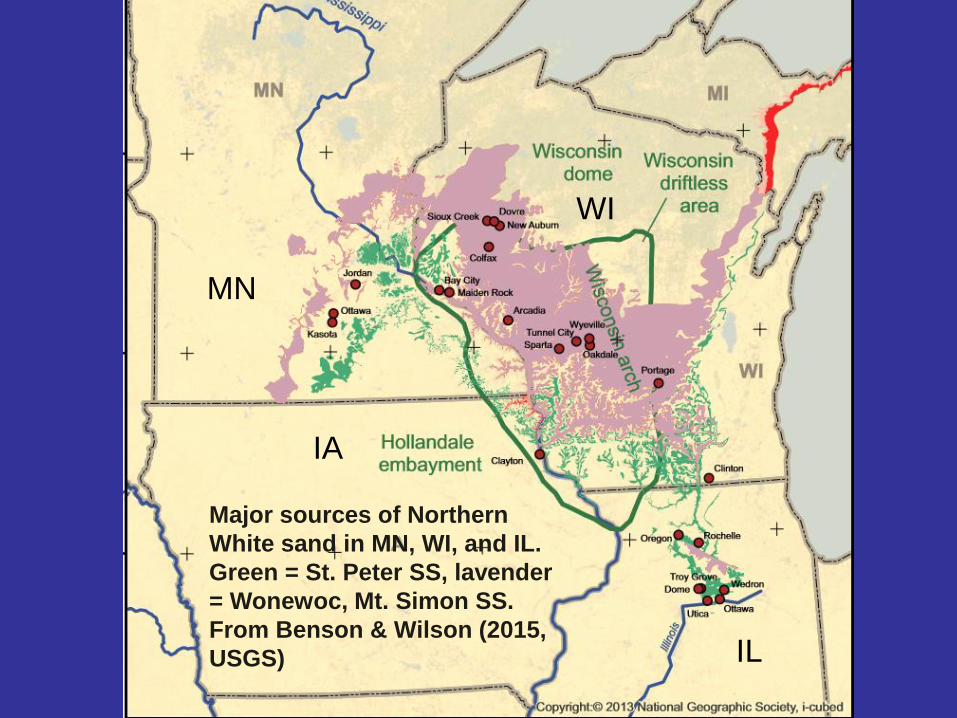
Major sources of Northern
White sand in MN, WI, and IL.
Green = St. Peter SS, lavender
= Wonewoc, Mt. Simon SS.
From Benson & Wilson (2015,
USGS)
IA
IL
MN
WI
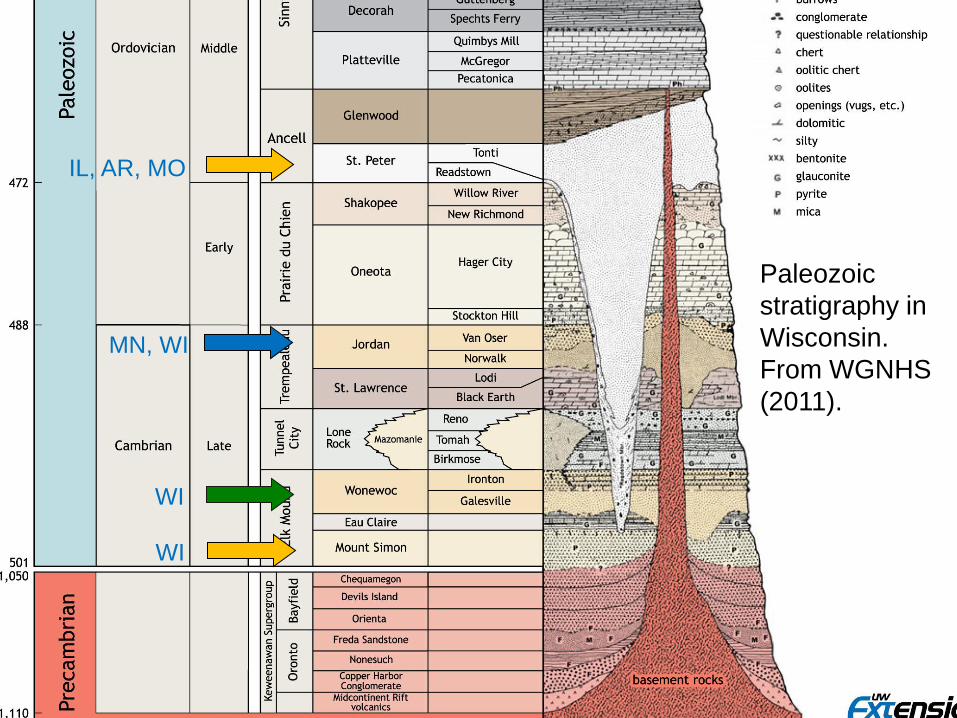
IL, AR, MO
Paleozoic
stratigraphy in
Wisconsin.
From WGNHS
(2011).
MN, WI
WI
WI
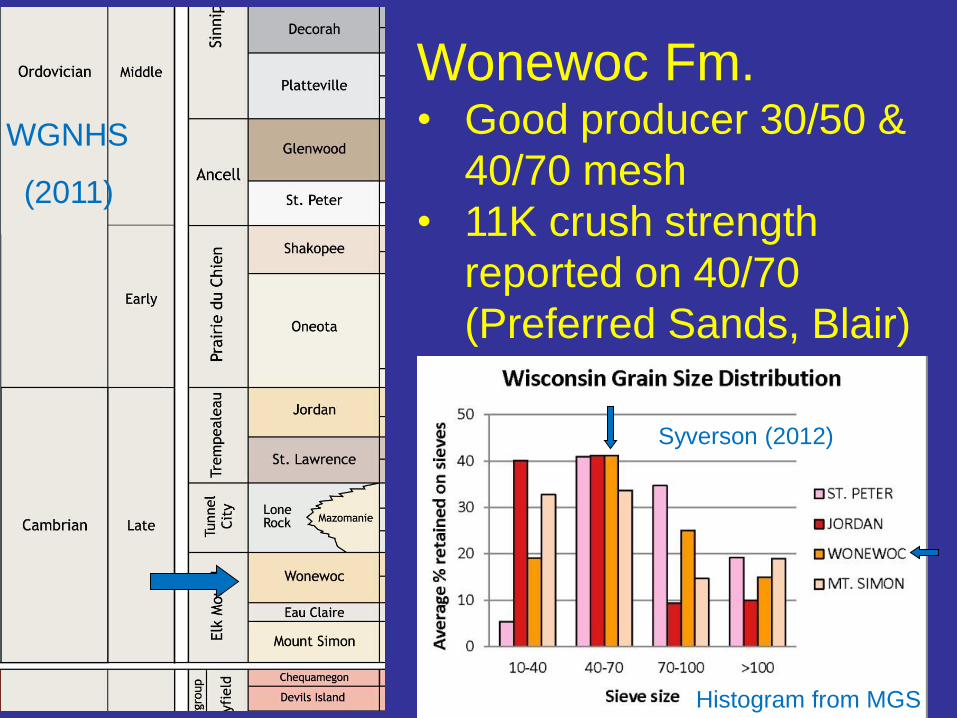
Wonewoc Fm. • Good producer 30/50 &
40/70 mesh
• 11K crush strength
reported on 40/70
(Preferred Sands, Blair)
WGNHS
(2011)
Syverson (2012)
Histogram from MGS
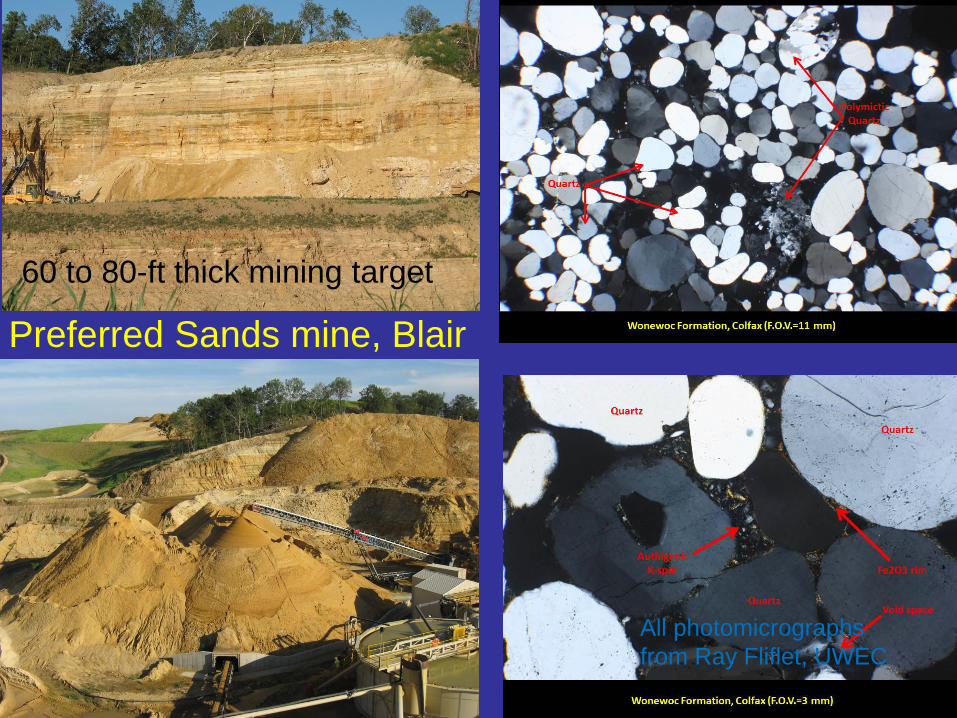
Preferred Sands mine, Blair
60 to 80-ft thick mining target
All photomicrographs
from Ray Fliflet, UWEC
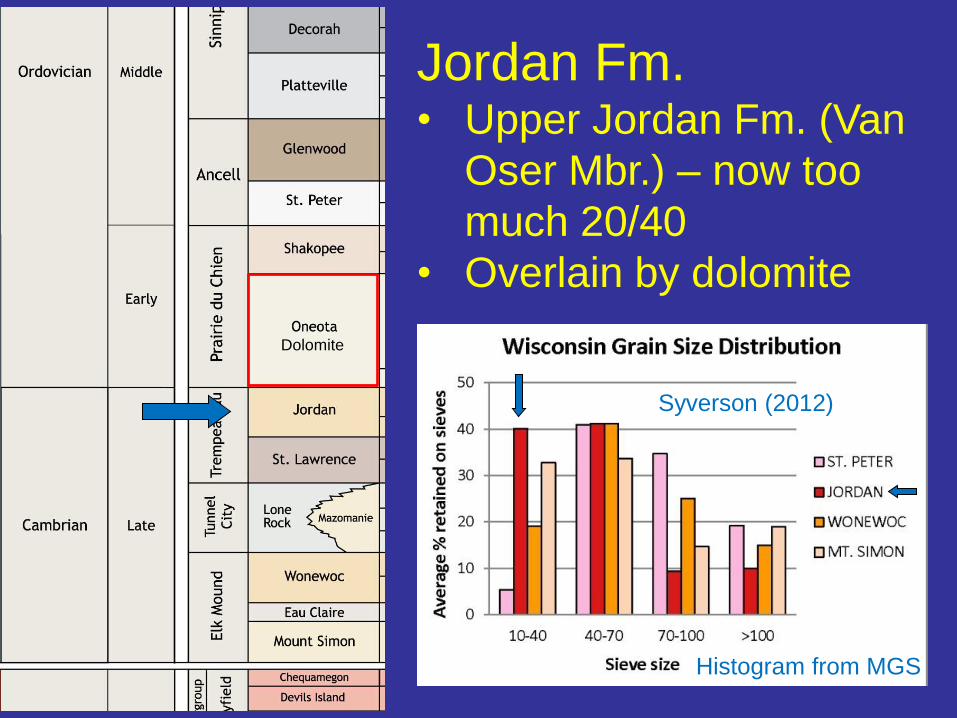
Jordan Fm. • Upper Jordan Fm. (Van
Oser Mbr.) – now too
much 20/40
• Overlain by dolomite
Dolomite
Syverson (2012)
Histogram from MGS
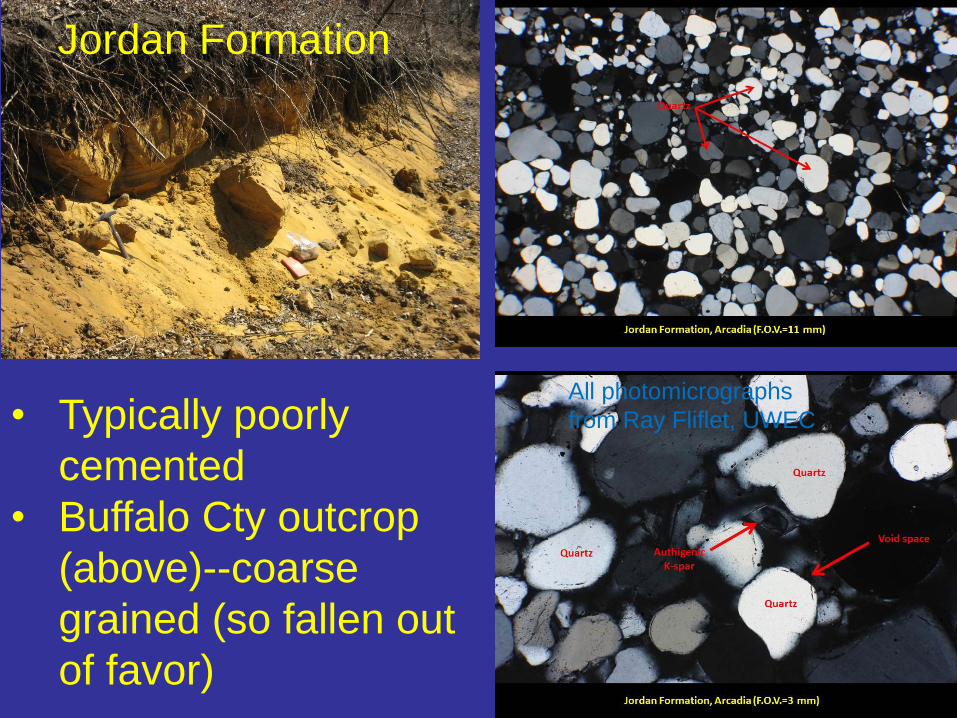
• Typically poorly
cemented
• Buffalo Cty outcrop
(above)--coarse
grained (so fallen out
of favor)
Jordan Formation
All photomicrographs
from Ray Fliflet, UWEC
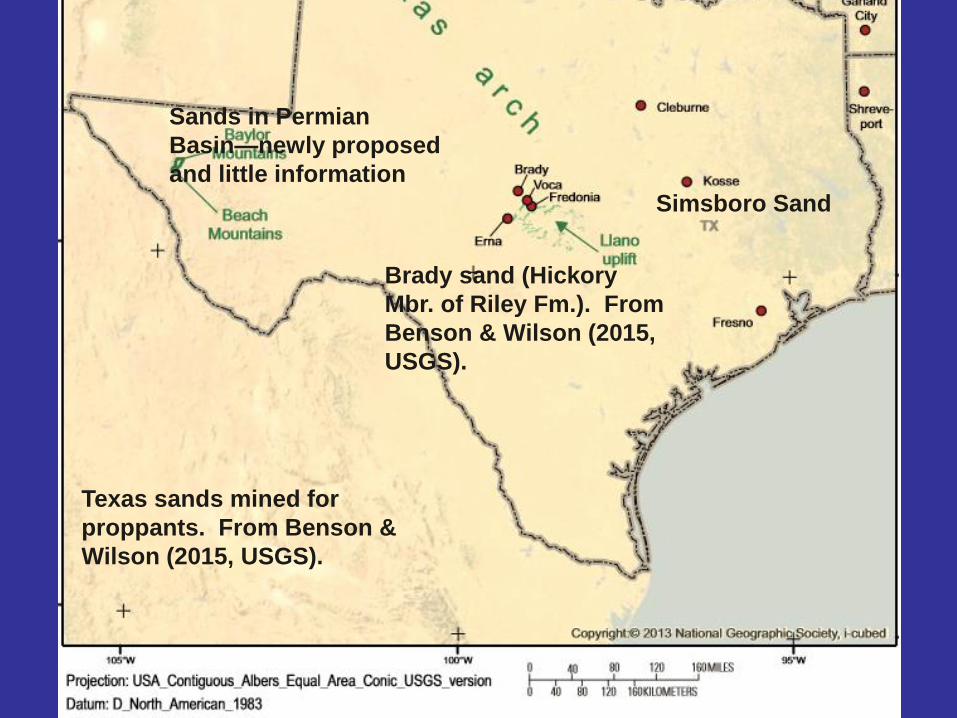
Texas sands mined for
proppants. From Benson &
Wilson (2015, USGS).
Brady sand (Hickory
Mbr. of Riley Fm.). From
Benson & Wilson (2015,
USGS).
Simsboro Sand
Sands in Permian
Basin—newly proposed
and little information
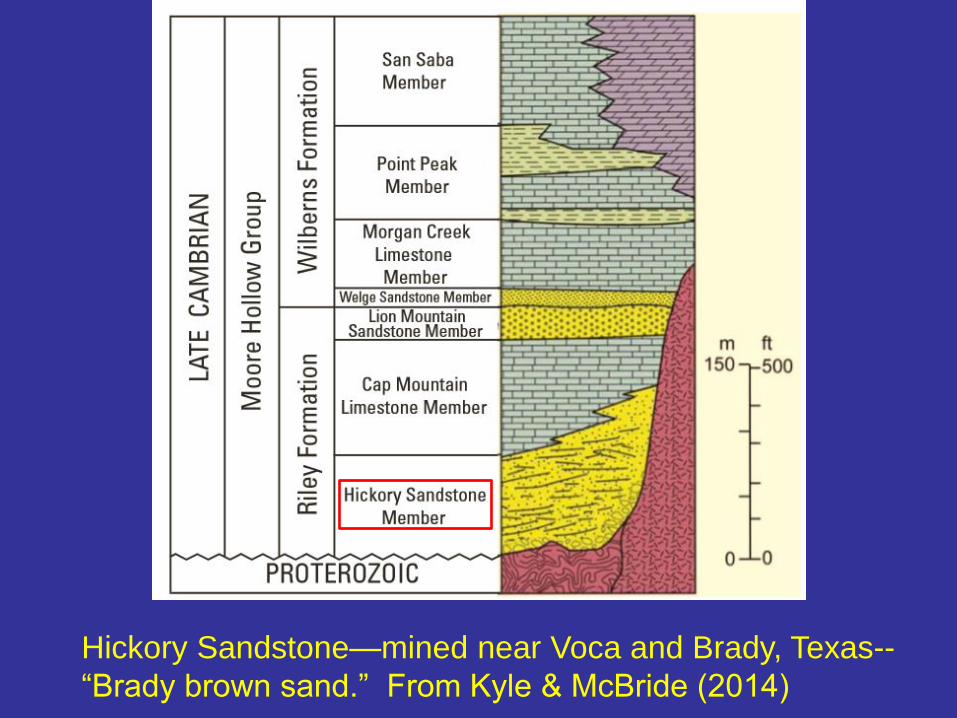
Hickory Sandstone—mined near Voca and Brady, Texas--
“Brady brown sand.” From Kyle & McBride (2014)
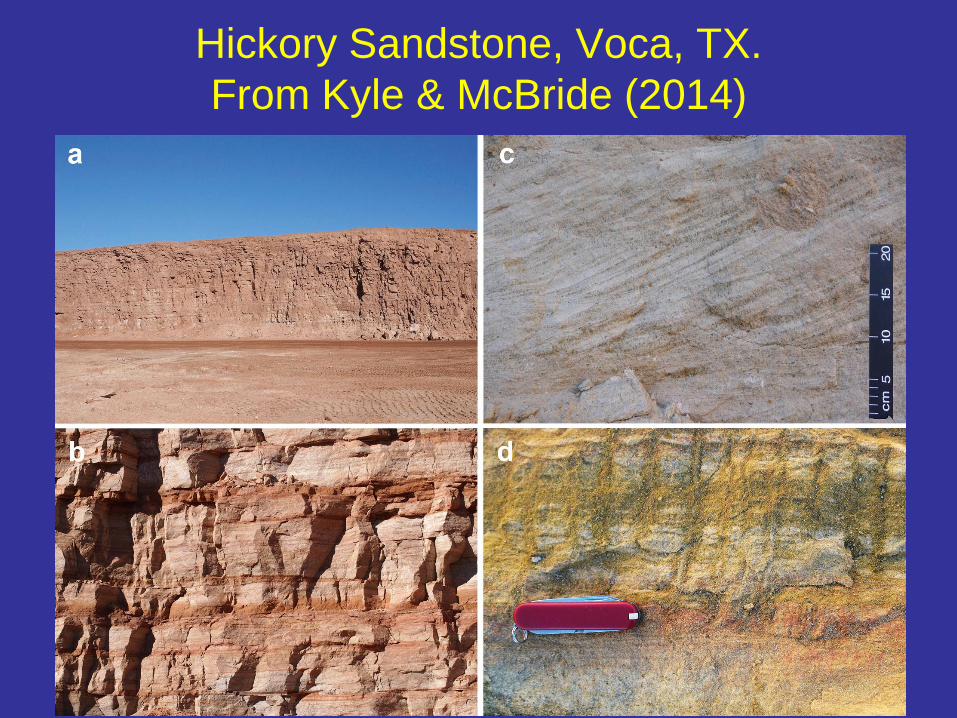
Hickory Sandstone, Voca, TX.
From Kyle & McBride (2014)
Kosse
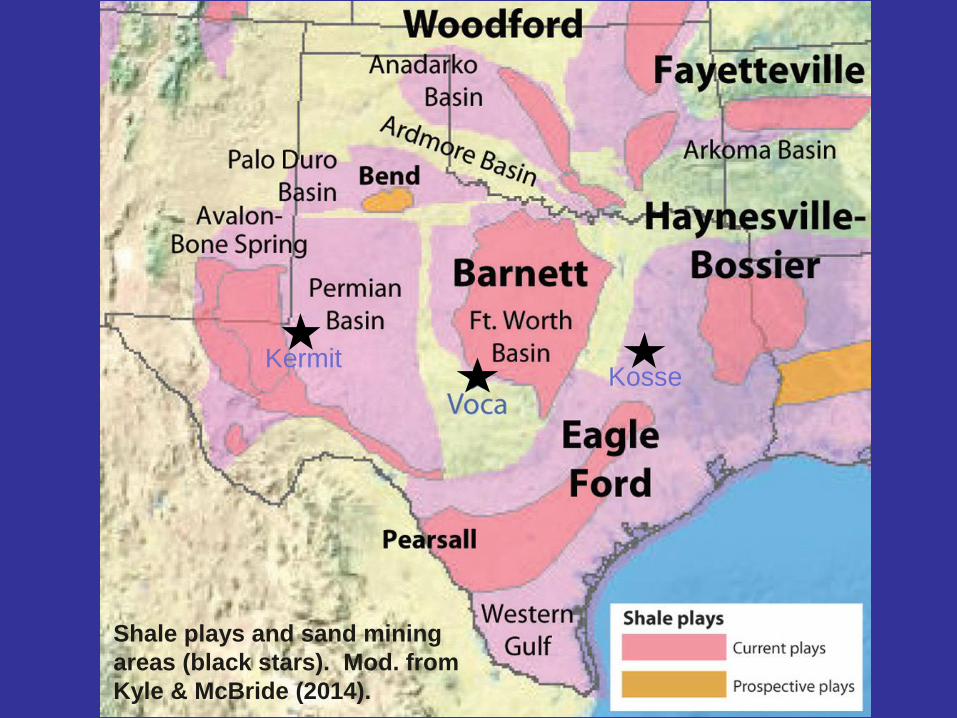
Shale plays and sand mining
areas (black stars). Mod. from
Kyle & McBride (2014).
Kermit
Can Northern White sand from
WI/MN compete with Texas sand?
• Companies will use sand that generates
the most profit.
• Texas sands do not require rail transport,
so they are less expensive than WI sand.
• Is Northern White sand from the Midwest
still relevant in today’s market and in the
future?
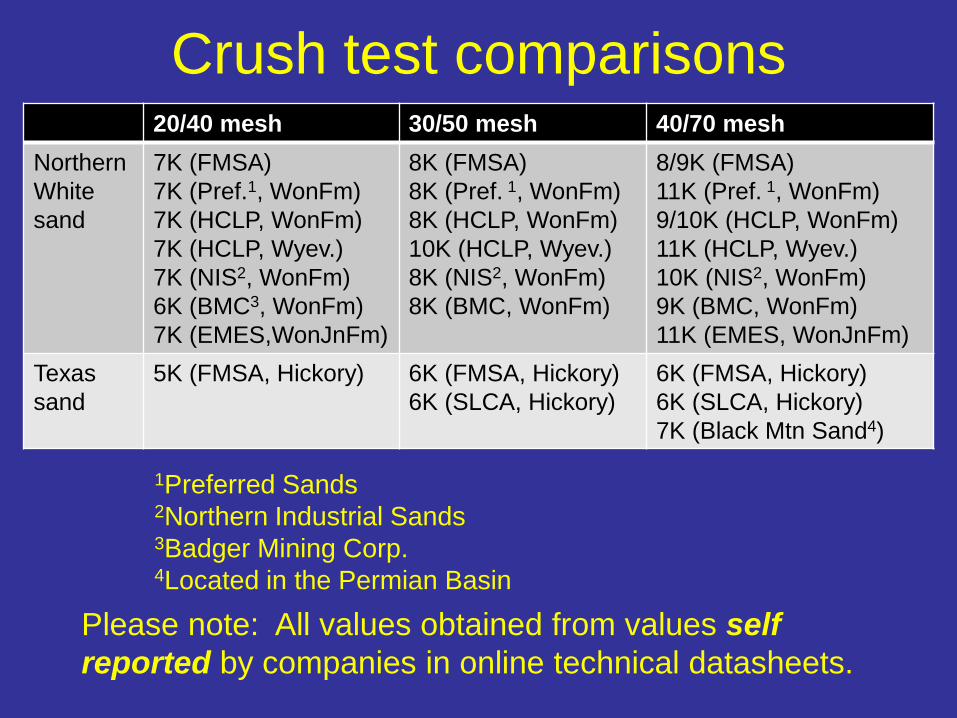
Crush test comparisons 20/40 mesh 30/50 mesh 40/70 mesh
Northern
White
sand
7K (FMSA)
7K (Pref.1, WonFm)
7K (HCLP, WonFm)
7K (HCLP, Wyev.)
7K (NIS2, WonFm)
6K (BMC3, WonFm)
7K (EMES,WonJnFm)
8K (FMSA)
8K (Pref. 1, WonFm)
8K (HCLP, WonFm)
10K (HCLP, Wyev.)
8K (NIS2, WonFm)
8K (BMC, WonFm)
8/9K (FMSA)
11K (Pref. 1, WonFm)
9/10K (HCLP, WonFm)
11K (HCLP, Wyev.)
10K (NIS2, WonFm)
9K (BMC, WonFm)
11K (EMES, WonJnFm)
Texas
sand
5K (FMSA, Hickory) 6K (FMSA, Hickory)
6K (SLCA, Hickory)
6K (FMSA, Hickory)
6K (SLCA, Hickory)
7K (Black Mtn Sand4)
Please note: All values obtained from values self
reported by companies in online technical datasheets.
1Preferred Sands 2Northern Industrial Sands 3Badger Mining Corp. 4Located in the Permian Basin
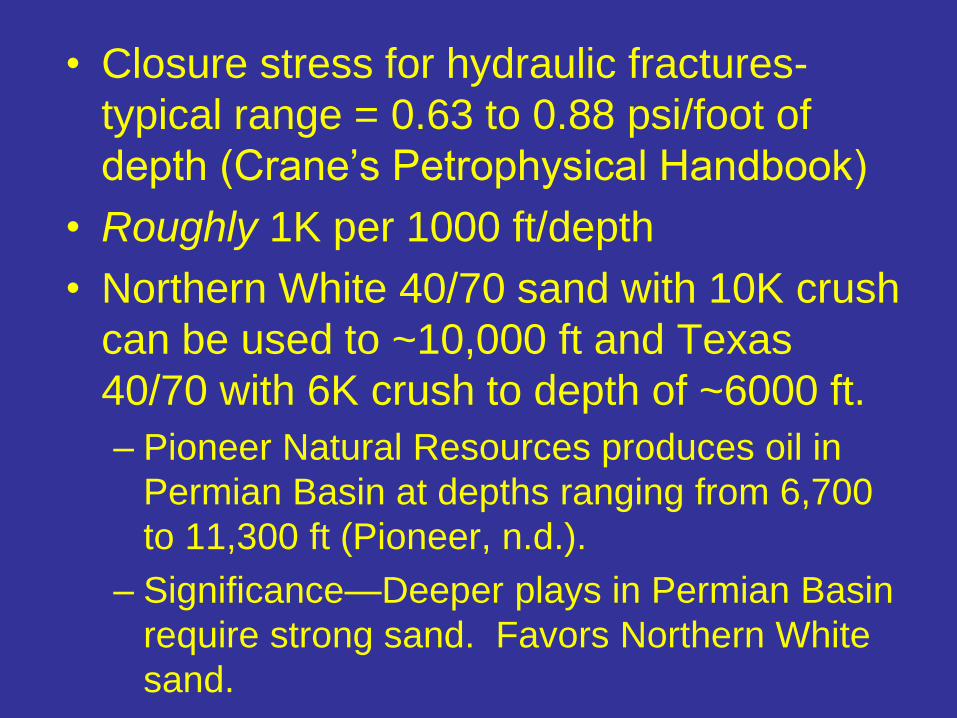
• Closure stress for hydraulic fractures-
typical range = 0.63 to 0.88 psi/foot of
depth (Crane’s Petrophysical Handbook)
• Roughly 1K per 1000 ft/depth
• Northern White 40/70 sand with 10K crush
can be used to ~10,000 ft and Texas
40/70 with 6K crush to depth of ~6000 ft.
– Pioneer Natural Resources produces oil in
Permian Basin at depths ranging from 6,700
to 11,300 ft (Pioneer, n.d.).
– Significance—Deeper plays in Permian Basin
require strong sand. Favors Northern White
sand.
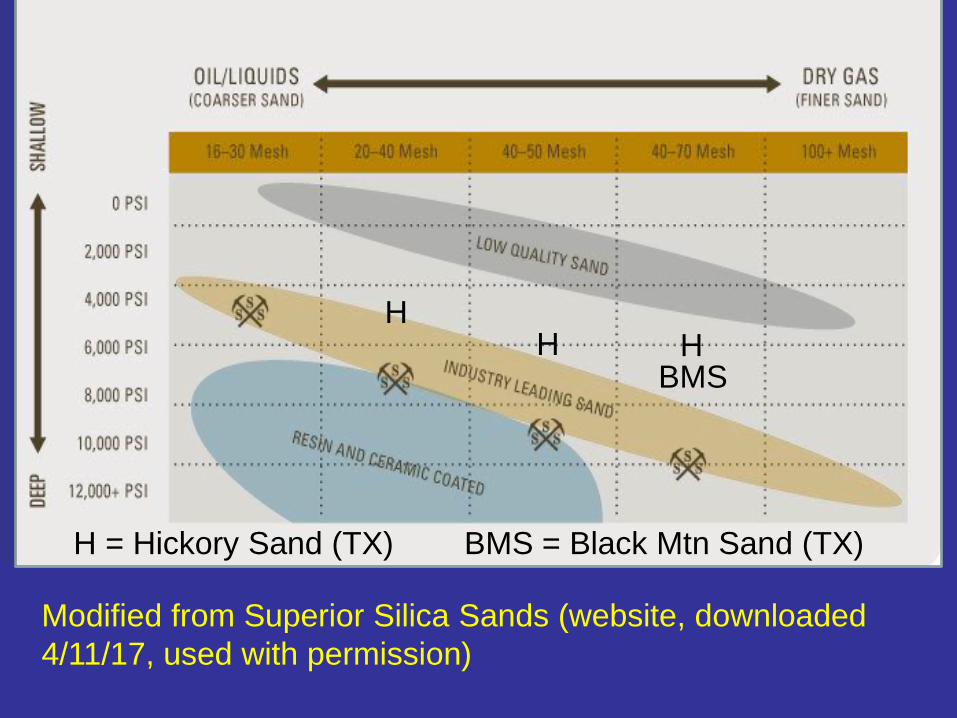
Modified from Superior Silica Sands (website, downloaded
4/11/17, used with permission)
H H H
H = Hickory Sand (TX) BMS = Black Mtn Sand (TX)
BMS
Trucking issues • Comments from logistics person at San
Antonio frac sand meeting
– Reported one-way trucking times for Texas
sand of 5 hrs—plus waiting time for unloading
– He preferred Northern White sand because of
higher quality AND brought by train to
transload near the center of the basin--
trucking ~1 hr one way.
• Last-mile logistics with Texas sands can
be complicated. Innovations—Sandbox
(SLCA) and PropStream (HCLP)
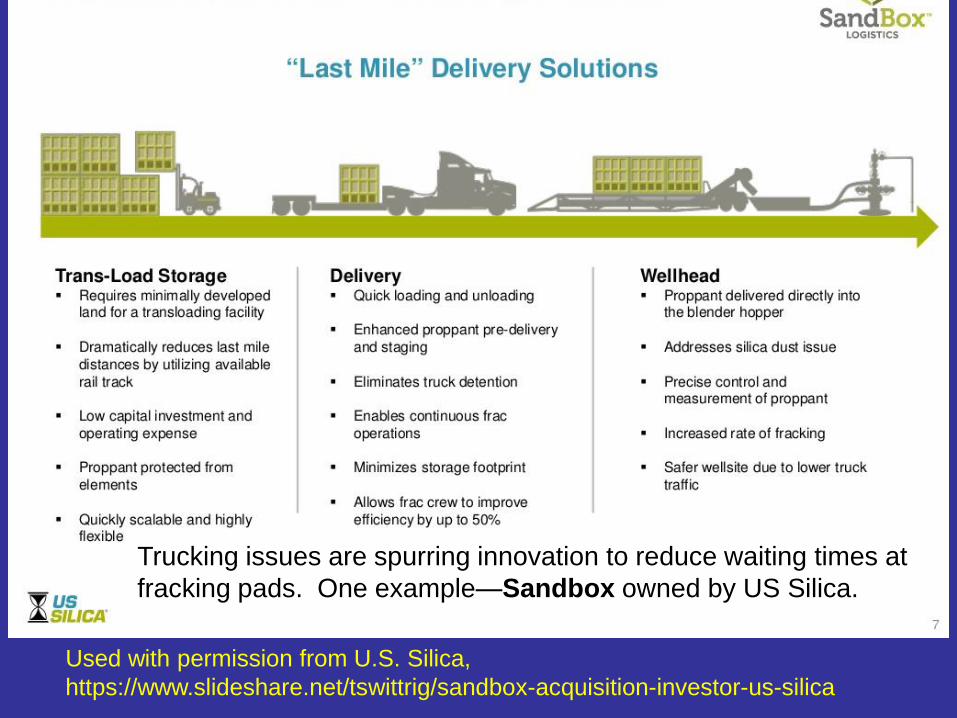
Trucking issues are spurring innovation to reduce waiting times at
fracking pads. One example—Sandbox owned by US Silica.
Used with permission from U.S. Silica,
https://www.slideshare.net/tswittrig/sandbox-acquisition-investor-us-silica
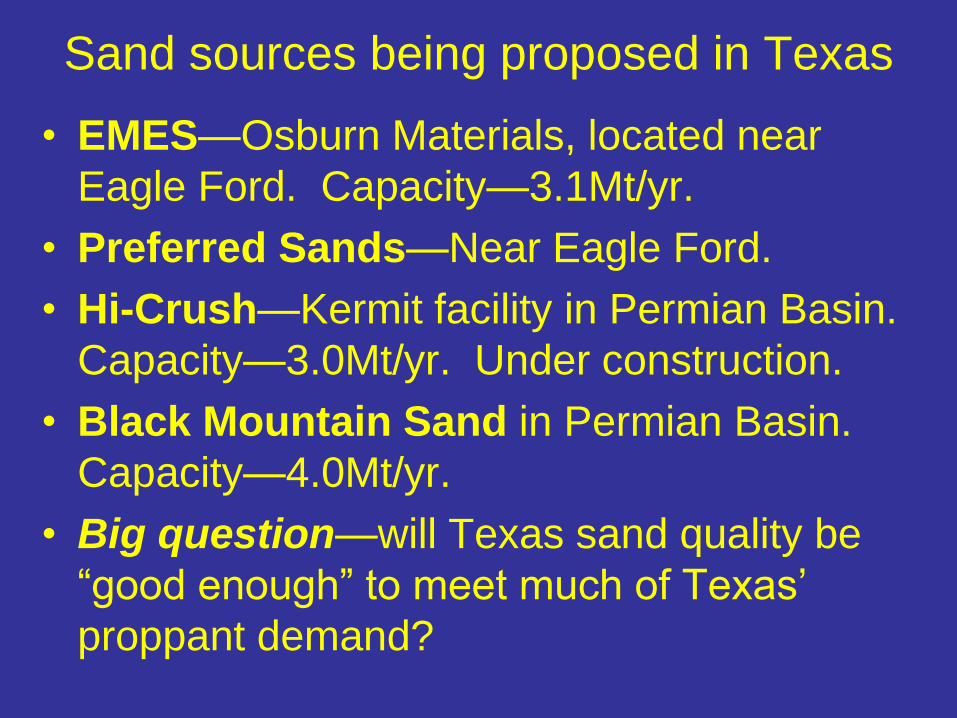
Sand sources being proposed in Texas
• EMES—Osburn Materials, located near
Eagle Ford. Capacity—3.1Mt/yr.
• Preferred Sands—Near Eagle Ford.
• Hi-Crush—Kermit facility in Permian Basin.
Capacity—3.0Mt/yr. Under construction.
• Black Mountain Sand in Permian Basin.
Capacity—4.0Mt/yr.
• Big question—will Texas sand quality be
“good enough” to meet much of Texas’
proppant demand?
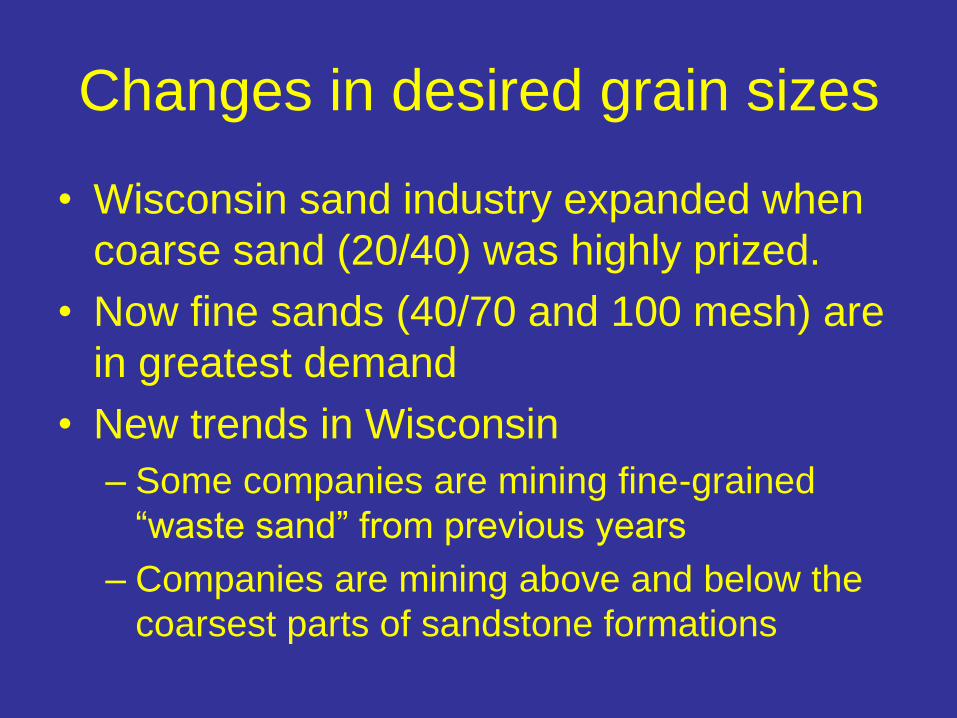
Changes in desired grain sizes
• Wisconsin sand industry expanded when
coarse sand (20/40) was highly prized.
• Now fine sands (40/70 and 100 mesh) are
in greatest demand
• New trends in Wisconsin
– Some companies are mining fine-grained
“waste sand” from previous years
– Companies are mining above and below the
coarsest parts of sandstone formations
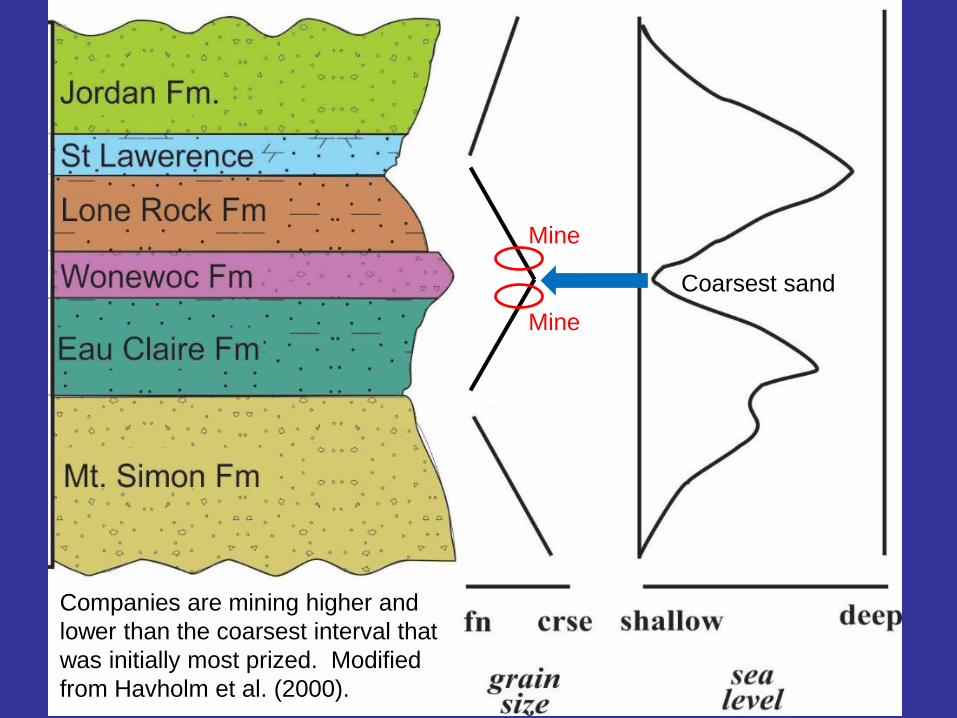
Companies are mining higher and
lower than the coarsest interval that
was initially most prized. Modified
from Havholm et al. (2000).
Coarsest sand
Mine
Mine
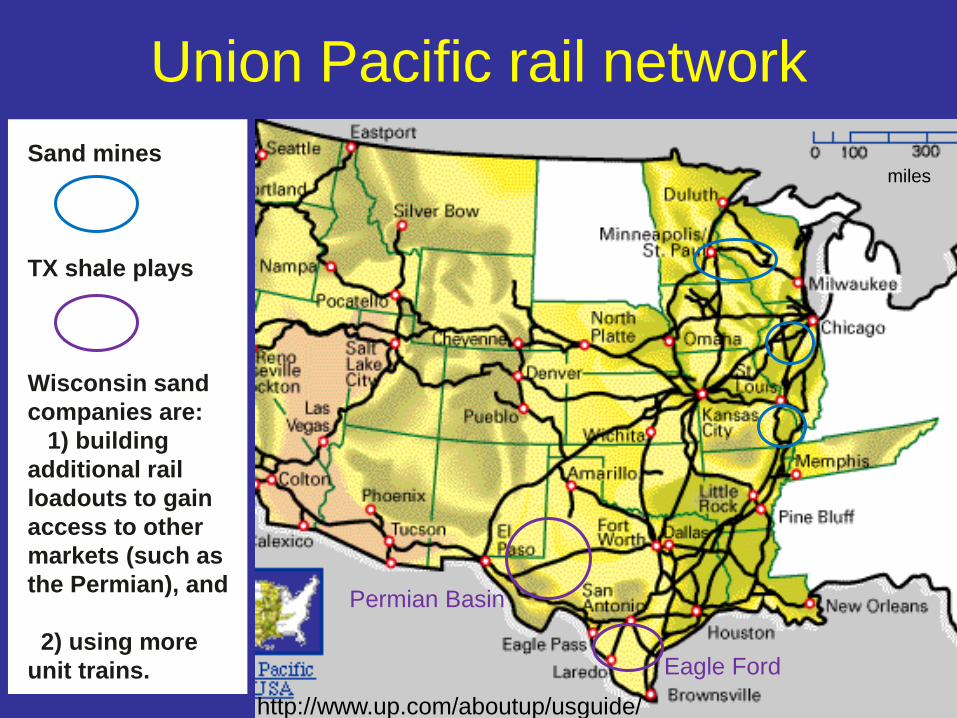
Union Pacific rail network
miles
Permian Basin
Eagle Ford
http://www.up.com/aboutup/usguide/
Sand mines
TX shale plays
Wisconsin sand
companies are:
1) building
additional rail
loadouts to gain
access to other
markets (such as
the Permian), and
2) using more
unit trains.
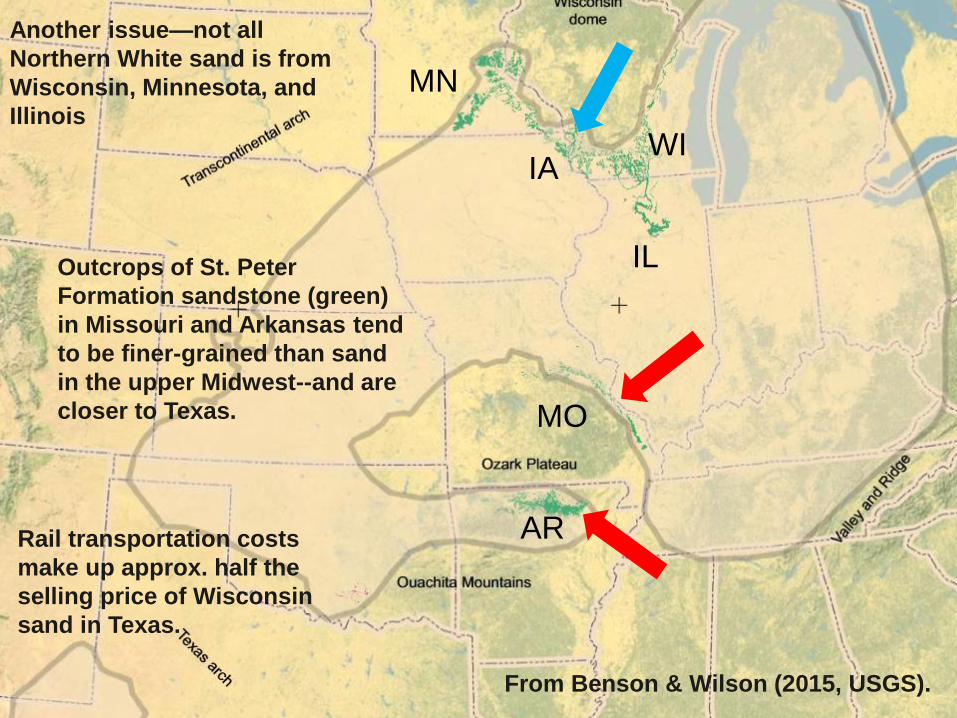
Outcrops of St. Peter
Formation sandstone (green)
in Missouri and Arkansas tend
to be finer-grained than sand
in the upper Midwest--and are
closer to Texas.
AR
IA
IL
MN
WI
MO
Another issue—not all
Northern White sand is from
Wisconsin, Minnesota, and
Illinois
From Benson & Wilson (2015, USGS).
Rail transportation costs
make up approx. half the
selling price of Wisconsin
sand in Texas.
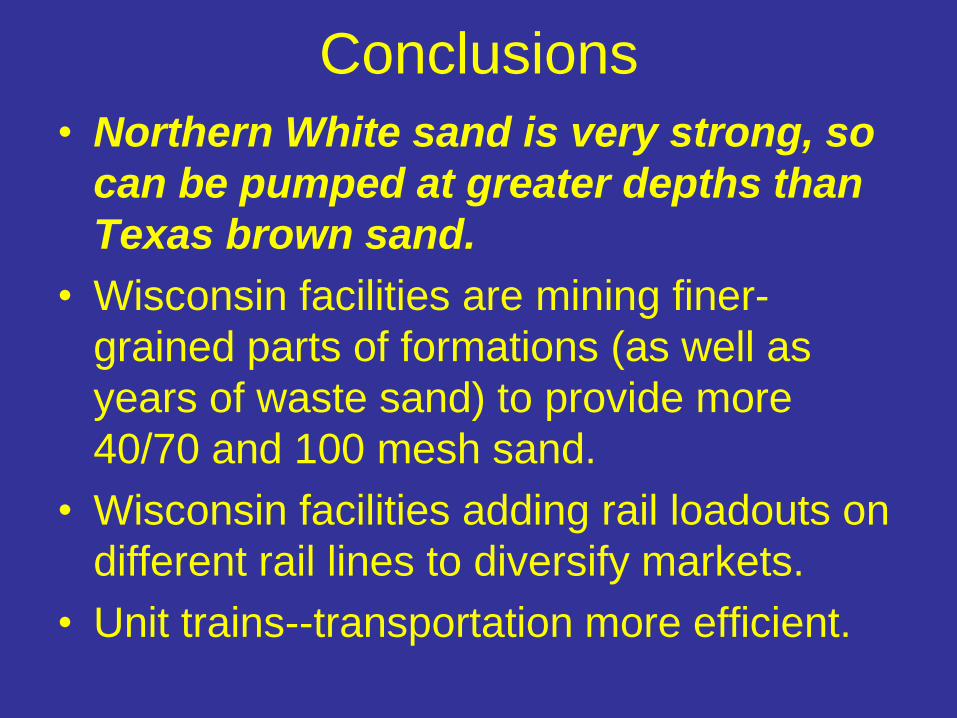
Conclusions
• Northern White sand is very strong, so
can be pumped at greater depths than
Texas brown sand.
• Wisconsin facilities are mining finer-
grained parts of formations (as well as
years of waste sand) to provide more
40/70 and 100 mesh sand.
• Wisconsin facilities adding rail loadouts on
different rail lines to diversify markets.
• Unit trains--transportation more efficient.
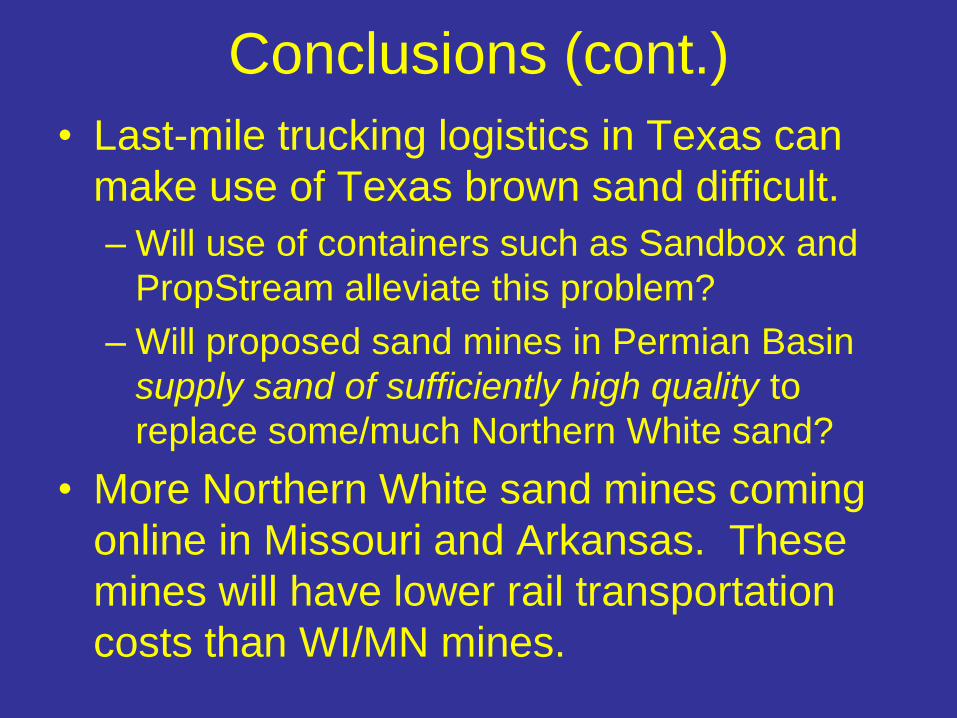
Conclusions (cont.)
• Last-mile trucking logistics in Texas can
make use of Texas brown sand difficult.
– Will use of containers such as Sandbox and
PropStream alleviate this problem?
– Will proposed sand mines in Permian Basin
supply sand of sufficiently high quality to
replace some/much Northern White sand?
• More Northern White sand mines coming
online in Missouri and Arkansas. These
mines will have lower rail transportation
costs than WI/MN mines.
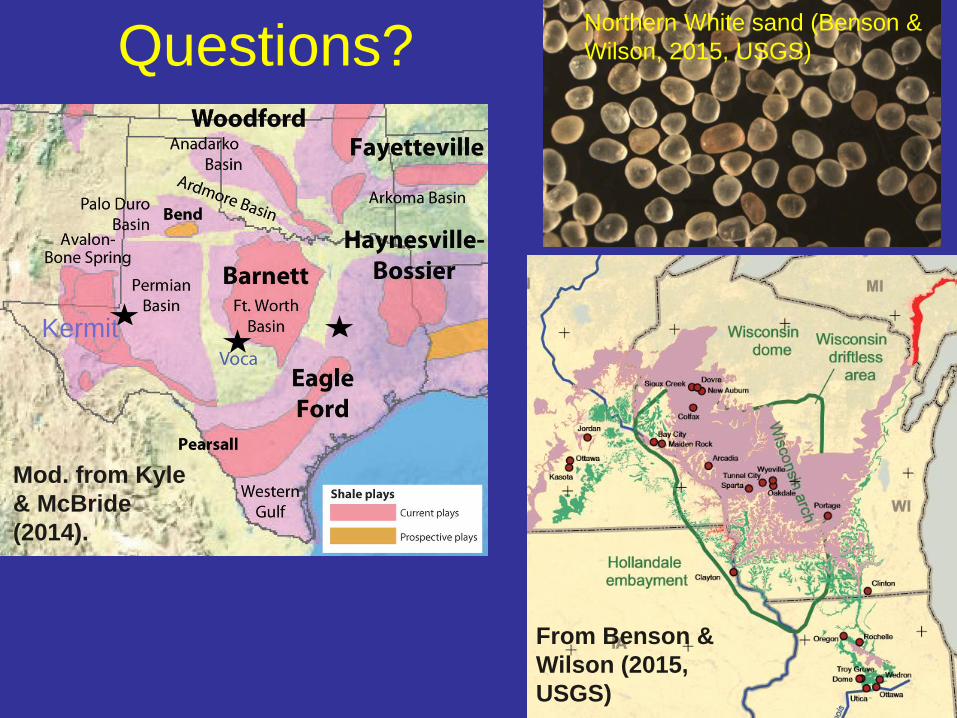
Questions?
Northern White sand (Benson &
Wilson, 2015, USGS)
Mod. from Kyle
& McBride
(2014).
Kermit
From Benson &
Wilson (2015,
USGS)
• Benson, M.E., and Wilson, A.B., 2015, Frac sand in the United States—A geological and
industry overview: USGS Open-File Report 2015–1107, 78 p.
• Brown, B.A., 1988, Bedrock geology of Wisconsin: West-Central Sheet: WGNHS Map 88-7,
scale 1:250,000.
• Crain's Petrophysical Handbook, 2000 - Present: https://www.spec2000.net/00-resume.htm.
• Havholm, K.G., Mahoney, J.B., and Runkel, A.C., 2000, Cambrian strata in the classic outcrop
belt of the central midcontinent: Recent investigations in Wisconsin and Minnesota: Guidebook
for the 30th Annual Field Conference, Great Lakes Section SEPM, p. 1-10.
• Infill Thinking, 2017, Horizontal US Rig Count As Of April 21, 2017 vs. Frac Sand Sources [Map],
https://www.infillthinking.com/infill-thoughts/rigs-vs-sand-mines-map/ (subscription only).
• Kyle, J.R., and McBride, E.F., 2014, Geology of the Voca frac sand district, western Llano uplift,
Texas, in Conway, F.M., ed., Proceedings of the 48th Annual Forum on the Geology of Industrial
Minerals, Phoenix, Arizona: Arizona Geological Survey Special Paper 9, Chapter 2, p. 1–13.
• Mudrey, M.G., Jr., LaBerge, G.L., Myers, P.E., and Cordua, W.S., 1987, Bedrock geology of
Wisconsin: Northwest sheet: WGNHS Map 87-11, scale 1:250,000.
• Pioneer, n.d., Permian Basin: Pioneer Natural Resources,
http://www.pxd.com/operations/permian-basin, downloaded 3 May 2017.
• Syverson, K.M., 2012, Geological occurrences and origins of silica sand formations Part II:
Overview of sand mining in Wisconsin: Twin Cities SME meeting, UMD Precambrian Research
Center Program and Abstracts, p. 15-27.
• WGNHS, 2011, Bedrock stratigraphic units in Wisconsin: WGNHS Education Series 51, 2 p.
• WGNHS, 2015, Bedrock geology of Wisconsin: WGNHS Map, page size.
References cited