Embed Size (px)
Citation preview
RA
PP
OR
T
22013
Norwegian Hydrological Reference Dataset for Climate Change Studies Anne K. Fleig (Ed.)

Norwegian Hydrological Reference Dataset for Climate Change Studies
Norwegian Water Resources and Energy Directorate 2013
Report no. 2 – 2013
Norwegian Hydrological Reference Dataset for Climate Change Studies
Published by: Norwegian Water Resources and Energy Directorate
Editor: Anne K. Fleig Authors: Anne K. Fleig, Liss M. Andreassen, Emma Barfod, Jonatan
Haga, Lars Egil Haugen, Hege Hisdal, Kjetil Melvold, Tuomo Saloranta
Print: Norwegian Water Resources and Energy Directorate Number printed: 50
Cover photo:
Femundsenden, spring 2000, Photo: Vidar Raubakken and Gunnar Haugen, NVE.
ISSN: 1501-2832
ISBN: 978-82-410-0869-6 Abstract: Based on the Norwegian hydrological measurement network,
NVE has selected a Hydrological Reference Dataset for studies of hydrological change. The dataset meets international standards with high data quality. It is suitable for monitoring and studying the effects of climate change on the hydrosphere and cryosphere in Norway. The dataset includes streamflow, groundwater, snow, glacier mass balance and length change, lake ice and water temperature in rivers and lakes.
Key words: Reference data, hydrology, climate change
Norwegian Water Resources and Energy Directorate
Middelthunsgate 29 P.O. Box 5091 Majorstua N 0301 OSLO
NORWAY Telephone: +47 22 95 95 95
Fax: +47 22 95 90 00 E-mail: [email protected] Internet: www.nve.no
January 2013
Contents Preface ................................................................................................. 5
Summary ............................................................................................. 6
1 Introduction ................................................................................... 7
2 Selection criteria for a Hydrological Reference Dataset ........... 8
3 Data and criteria for the Norwegian HRD ................................... 9
3.1 Streamflow ....................................................................................... 9 3.1.1 Available data .......................................................................... 9 3.1.2 Selection of streamflow stations .............................................. 9
3.2 Soil moisture .................................................................................. 18 3.2.1 Available data ........................................................................ 18
3.3 Groundwater .................................................................................. 19 3.3.1 Available data ........................................................................ 19 3.3.2 Selection of groundwater stations ......................................... 19
3.4 Snow .............................................................................................. 21 3.4.1 Available data ........................................................................ 21 3.4.2 Selection of snow stations ..................................................... 22
3.5 Glaciers .......................................................................................... 23 3.5.1 Available data ........................................................................ 23 3.5.2 Selection of glacier stations ................................................... 24
3.6 Lake and river ice ........................................................................... 27 3.6.1 Available data ........................................................................ 27 3.6.2 Selection of lake and river stations ........................................ 27
3.7 River and lake temperature ............................................................ 28 3.7.1 Available data ........................................................................ 28 3.7.2 Selection of river and lake temperature stations ................... 29
4 Final reference datasets ............................................................. 30
4.1 Streamflow ..................................................................................... 30 4.1.1 Reference series ................................................................... 30 4.1.2 Map ....................................................................................... 32 4.1.3 Catchment characteristics ..................................................... 35
4.2 Groundwater .................................................................................. 35 4.2.1 Reference series ................................................................... 35 4.2.2 Map ....................................................................................... 37
4.3 Snow .............................................................................................. 38 4.3.1 Reference series ................................................................... 38 4.3.2 Map ....................................................................................... 40
4.4 Glaciers .......................................................................................... 41 4.4.1 Reference series ................................................................... 41 4.4.2 Map ....................................................................................... 42 4.4.3 Station characteristics ........................................................... 43
4.5 Lake and river ice ........................................................................... 44 4.5.1 Reference series ................................................................... 44 4.5.2 Map ....................................................................................... 45
4.5.3 Station characteristics .......................................................... 45 4.6 River and lake temperature ........................................................... 46
4.6.1 Reference series .................................................................. 46 4.6.2 Map ....................................................................................... 53 4.6.3 Station characteristics .......................................................... 53
5 Further work ................................................................................ 54
5.1 Improving the streamflow RD ........................................................ 54 5.2 Improving the soil moisture RD ..................................................... 55 5.3 Improving the groundwater RD ...................................................... 55 5.4 Improving the snow RD ................................................................. 55 5.5 Improving the glacier RD ............................................................... 56 5.6 Improving the lake and river ice RD .............................................. 56 5.7 Improving the river and lake temperature RD ................................ 56 5.8 Maintaining the Hydrological Reference Dataset .......................... 57
Acknowledgements ........................................................................... 57
References ......................................................................................... 58
Appendix 1: Streamflow reference dataset ..................................... 60
6
Summary This report presents an action undertaken according to NVE’s Strategy for Climate Change Adaption. There it is stated that a Norwegian Hydrological Reference Dataset suitable to study climate change effects on hydrology needs to be established as a basis to fulfil NVE’s responsibility to monitor the effects of climate change and to improve knowledge about climate change related processes and impacts. Such a Hydrological Reference Dataset (HRD) needs to consist of long, high quality data series that are not affected by human activity causing non-climate related variability or change. The here presented HRD for Norway is selected from NVE’s existing station network for the hydrosphere and cryosphere, including streamflow, soil moisture, groundwater, snow, glacier mass balance and length, lake and river ice and water temperature in rivers and lakes. The selection criteria follow international standards and cover the degree of basin development and water usage, record length, data accuracy and available metadata. Depending on the fulfilment of these criteria some stations are assigned limited usability for certain kind of studies. The total resulting HRD consists of 189 streamflow series, 28 groundwater series, 68 snow water equivalent series, 9 series of glacier mass balance and 11 of glacier length, 22 lake ice and 2 river ice duration series as well as 9 water temperature series for rivers and 37 for lakes. Currently none of the existing soil moisture series are long enough to meet the requirements. For most of the variables, however, some parts of the country are underrepresented or not covered.
7
1 Introduction In recent decades, changes in climate, and in particular increased temperatures, have been observed (Solomon et al., 2007). In Norway, temperatures have increased and there have been regional changes in precipitation and annual runoff, as well as increased winter and spring runoff and earlier snowmelt (Wilson et al., 2010). A continued increase in temperature and precipitation (except for the summer season) is predicted (Hanssen-Bauer et al., 2009). More frequent episodes of extreme rainfall are also anticipated. Changes in climate are expected to lead to changes in hydrology, with increasing annual runoff, and greater runoff in the autumn and winter and less during summer (Beldring et al., 2008). Increased floods are expected in all rivers except for large inland rivers currently dominated by snowmelt floods under the present climate (Lawrence and Hisdal, 2011). Observed and predicted future changes in hydrology require adaptation, as the changes can have major economic, societal, political, and ecological impacts. For example, increased floods will have implications for land use planning and could change dam construction requirements. In order to predict and prepare for changes in hydrological characteristics under a changing climate, good knowledge about observed hydrological changes and their causes is necessary. This includes not only improved knowledge about changes in the mean hydrological characteristics, but also changes in annual and seasonal variability as well as in the frequency and magnitude of extreme events. In NVE’s Strategy for climate change adaption (NVE, 2010) improved knowledge about climate change, related processes and its impacts are identified as some of the main requirements to facilitate adaption to climate change. A high quality dataset suitable to study hydrological variability and change is required. As hydrological variability is driven by climate and modified by catchment characteristics and changes in land cover, it is difficult to attribute hydrological change to the different driving forces. In addition, human influences such as river regulations may change streamflow. Even in Norway where many long term series of hydrological measurements exist, the selection of an adequate dataset can be challenging due to the multiplicity of influences on hydrology. A Hydrological Reference Dataset (HRD) should consist of good-quality long-term series not influenced by human activities.
The need for adequate and high quality data to study climate change effects is internationally regarded as a pressing issue. Identifying regional patterns of hydrological change has been suggested as one of the most important challenges in contemporary hydrology (e.g. Stahl et al., 2010; Whitfield et al., 2012). In 2006, the World Meteorological Organization (WMO) requested its members to identify “Stream gauging stations appropriate for climate studies (Whitfield et al., 2012). A number of countries have or are in processes of establishing “Reference Hydrological Networks” consisting of good-quality, long-term series of observed streamflow from natural or near-natural catchments. In general, such networks should be representative for all hydrological regions in the country and provide a good regional coverage. Norway has a long and rugged coastline, spans 13 degrees of latitude, and has large seasonal and regional variations in climate and hydrology. A good regional coverage of hydrological stations is needed to capture this variability and also for the detection of future changes. Several studies have shown that climate predictions vary considerably between different parts of the country (Hanssen-Bauer et al., 2009). In NVE’s Strategy for climate change adaption (NVE, 2010) it is stated that the Norwegian reference dataset should represent all
8
elevations and special focus should be given to regions where large changes in streamflow (including floods and droughts), soil moisture, groundwater, snow, glaciers, period with lake/river ice, sediment transport and location of riverbeds are expected, as well as on regions with particularly high uncertainty in climate predictions.
Data from HRDs are not only necessary for studies of climate change related processes, trends and changes in hydrological characteristics, but also for improving climate models, as hydrological conditions provide feedback to the climatic system, for instance through the variability in snow cover and albedo or evapotranspiration. In general, HRDs are essential for research and good water management (Whitfield et al., 2012).
The aim of this report is to present a Hydrological Reference Dataset suitable for the study of the effects of climate variability and change on the hydrology and cryosphere in Norway. The reference dataset includes streamflow, soil moisture, groundwater, snow, glacier, lake and river ice and water temperature in rivers and lakes.
The necessary requirements for reference stations are specified in Chapter 2 in terms of six general selection criteria. In Chapter 3, these criteria are used, where applicable, to identify data series of each of the different variables. The resulting HRD is presented in Chapter 4, with strategies for maintaining and further improving the Norwegian Hydrological Reference Dataset suggested in Chapter 5.
2 Selection criteria for a Hydrological Reference Dataset
The six following selection criteria were used for identification of suitable reference stations (Whitfield et al., 2012):
Criteria:
1. Degree of basin development: Pristine or stable land-use conditions (<10% of the area is affected);
2. Absence of significant regulations, diversions, or water use. Only natural catchments. When regulation is present in a basin some gauging stations may be appropriate for analyzing high flows and average flows, but not low flows;
3. Record length: Minimum 20 years and some stations with > 50 years. This length ensures that underrepresented climatic or geographic areas, which are characterized by minimal data availability, are also included. However, record lengths should also be as long as possible to allow decadal variability to be distinguished from long-term trends; due to multi-decadal oscillations in streamflow.
4. Active data collection: Currently active and is expected to continue operation;
5. Data accuracy: Good quality data.
6. Adequate metadata: Adequate metadata should be available to support the previous five conditions.
9
These criteria are partly subjective and subject to interpretation, but they are identical to the WMO requirements in its request in 2006 for its members to identify “Stream gauging stations appropriate for climate studies” (Whitfield et al., 2012). These criteria were therefore chosen as the basis for the development of the Norwegian reference dataset, comprising data on streamflow, soil moisture, groundwater, snow, glaciers, lake/river ice and water temperature in rivers and lakes.
3 Data and criteria for the Norwegian HRD
3.1 Streamflow
3.1.1 Available data
All the daily streamflow records stored in NVE’s Hydra II database classified as active and unregulated were chosen as the basis for the selection of reference stations. This list of potential reference streamflow stations comprised data from 249 stations. A subset of these stations have previously been included in studies of trends in streamflow both in Europe (Hisdal et al. 2001, Stahl et al., 2010) and the Nordic countries (Wilson et al., 2010).
3.1.2 Selection of streamflow stations
The criteria for HRDs presented in Chapter 2 were applied to the Norwegian streamflow data as described in the following paragraphs. According to the evaluation of the Norwegian data, the streamflow series were categorized into the following seven categories:
A series can be used for all kind of climate change related studies:
1. based on daily data (since...), 2. but not for high flows / flood studies (before...), 3. but not for spring high flows (autumn floods ok to use), 4. but not for low flow studies (before...), 5. but not for winter low flows, 6. based on monthly data, 7. based on seasonal data, 8. based on annual data only.
Furthermore, a shorter record length than the existing is recommended to be used for some stations. The reference start date can either be applied for all or only selected categories. The resulting streamflow reference series are presented in Chapter 4.1 and Appendix 1.
1. Degree of river basin development
The land use classes for the individual catchments can be obtained from NVE’s Hydra II database. The specified classes have been derived in a GIS analysis of Norwegian topographic 1:50000 maps produced between 2004 and 2011. The following seven
10
classes were defined: agriculture, bog, lake, forest, glacier, mountain (i.e. bare rock above the tree line) and urban area. However, no class exists for open area below the tree line. As a consequence, for half of the stations the land use conditions are specified for less than 90% of the area. In most cases, the unspecified area is probably grass or grazing land. Using the above classification, the area defined as urban or agriculture can be considered as developed land.
No information exists on changes in local land use conditions. In general, the amount of agricultural and grazing land has decreased in Norway within the last 60 years, in particular in remote and mountainous areas. The amount of forest has in turn increased (Bryn, 2008). It is also known that draining of bogs has taken place as well as some changes in agricultural practices that affect runoff conditions. For example, the dominating ploughing direction has changed and more drain pipes are used.
It was decided to exclude stations from the list of potential reference stations, only if they have an urban area of more than 10%, irrespective of the amount of agricultural land. This was decided due to the lack of information on changes in local land use conditions and the proportion of grazing land within the undefined area. None of the 250 potential reference stations have an urban area proportion as high as 10%. For one station (21.49 Sømskleiva) no information is available. However, in Pettersson (2004) this station has been classified as “urban”, and it is therefore assumed that urban land covers more than 10% of the catchment area.
2. Absence of significant regulations, diversions, or water use
The 250 potential reference stations are classified as “unregulated” in the Hydra II database (March 2012; based on Pettersson, 2003). Further background information was obtained from previous reports on NVE’s network of streamflow stations (Pettersson, 2004; Pettersson, 2005; Kleivane, 2006; Pettersson & Astrup, 2007) and the station comments in Hydra II. The comments included information about earlier regulations such as small hydropower reservoirs or timber floating, minor water abstractions for local drinking water supply, water transfers of a certain part of the catchment and short term regulations for instance related to the construction of a bridge or street. However, not all of the comments were easy to interpret and the impact on streamflow could be difficult to judge. Personal contact with the responsible hydrometrist and people at NVE with long experience in using the streamflow series, helped to clarify most of the uncertainties. The information about existing regulations and water transfers was cross- checked with an ongoing station network project at NVE, where water transfers and power stations of at least 1 MWh are retrieved by GIS analysis. The maps applied for this analysis are produced between 2004 and 2011 depending on the station.
The degree of detail in this available information varies between stations, and it is likely that not all intervening activity is documented, in particular not older ones. The data series are therefore further checked for possible unnatural influences based on an earlier homogeneity tests and explorative analysis as described under 5 Data accuracy.
Based on this information and analyses, usability classes are assigned to all potential reference series, and new start dates are suggested where necessary. In case the regulations affect only parts of the hydrological regime, the recommended starting year is given in the respective usability category. For instance, station 133.7 Krinsvatn has
11
streamflow observations since 1915. However, until 1965 there was timber floating activity during the spring. For studies considering low flow, spring floods or monthly data, it is therefore recommend using data only from 1965 onwards. Studies of annual data or particularly looking at autumn floods could still use the complete record.
The water transfers are all constant, i.e. all water from a certain part of the natural catchment is permanently transferred into a neighbouring catchment. The water flow at these stations can therefore be considered as natural, however coming from a catchment area smaller than the natural one. The catchment area given in the table of catchment characteristics in Hydra II is the natural area. In the table of recommended reference data series (Appendix 1), the area change is therefore specified in km2.
Some catchments were described as little or insignificantly regulated in the reports, often, however, lacking information about the type of regulation. The missing information was obtained by personal communication with the authors and the impact of these regulations was evaluated for the different water levels. Usability categories were assigned, but in general it was decided to keep all of the catchments in the list of potential reference stations. Catchments not reported as regulated but with minor water abstractions, e.g. for local drinking water supply, are documented, were evaluated by the same approach. Also catchments with so called mini- or micro-power-stations are usually registered in Hydra II as unregulated. These power stations operate only with the naturally available water in a river at any time without retaining or abstracting any water. The streamflow at stations further downstream is considered as unregulated and meeting the requirements of a reference series.
3. Record length
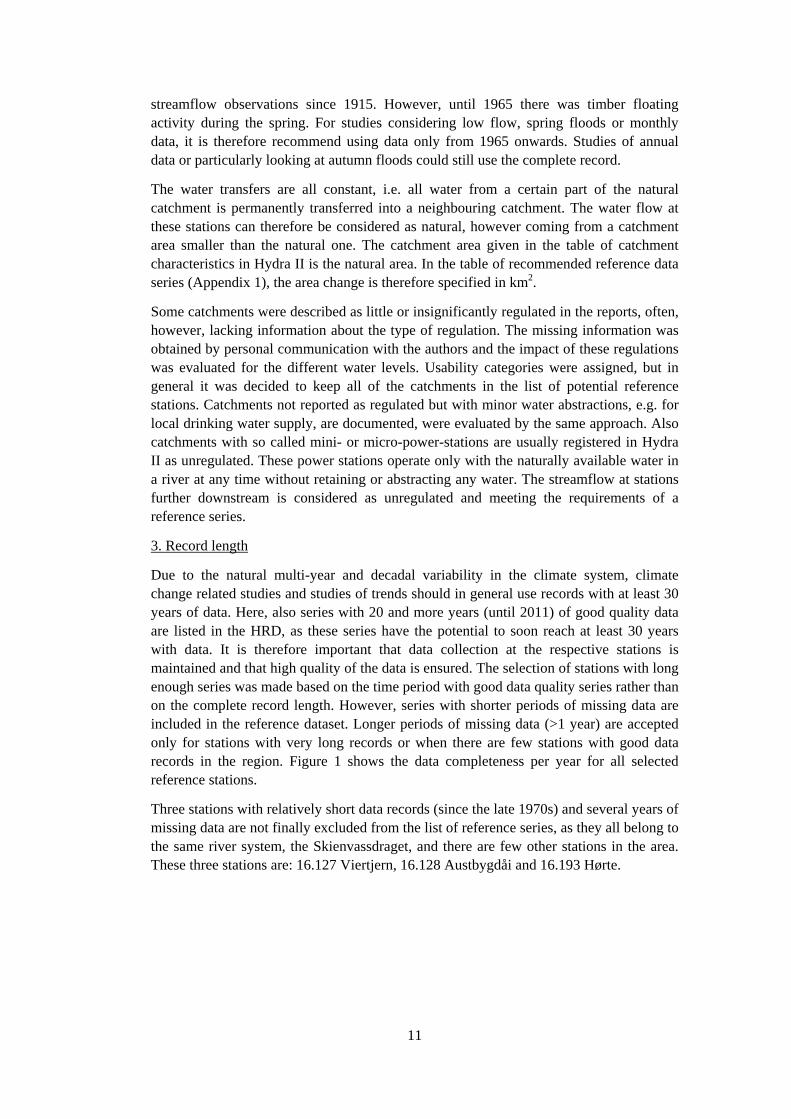
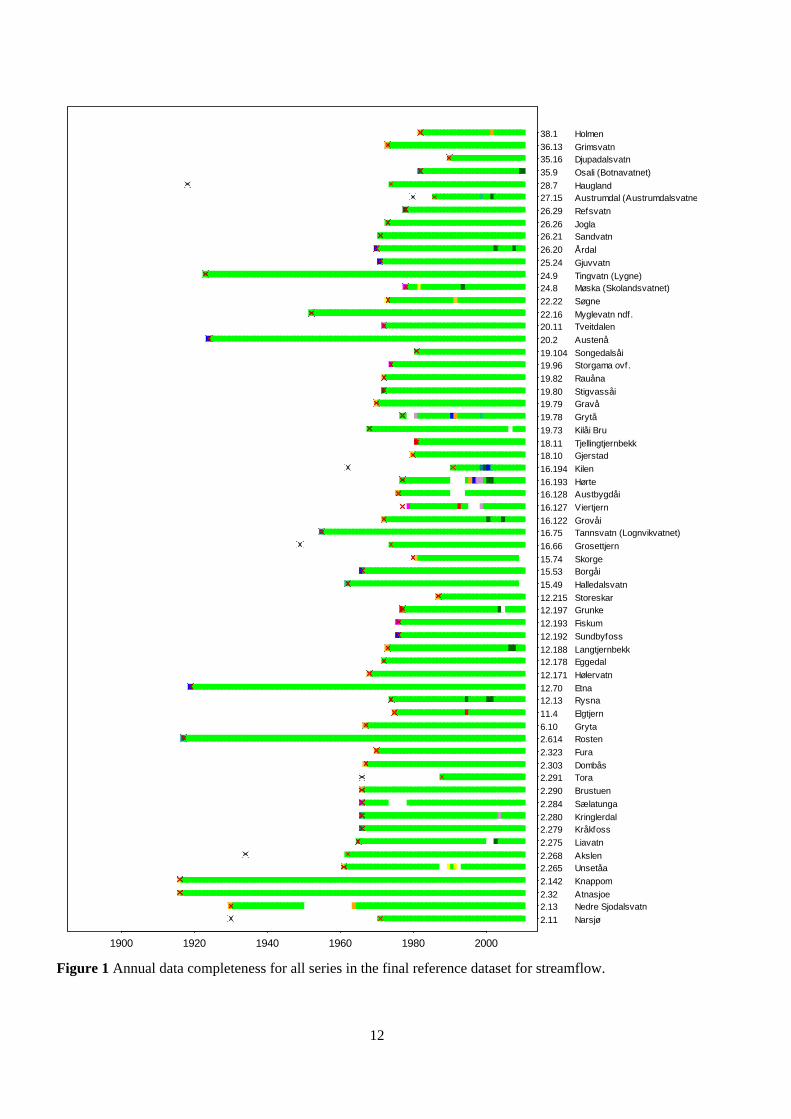
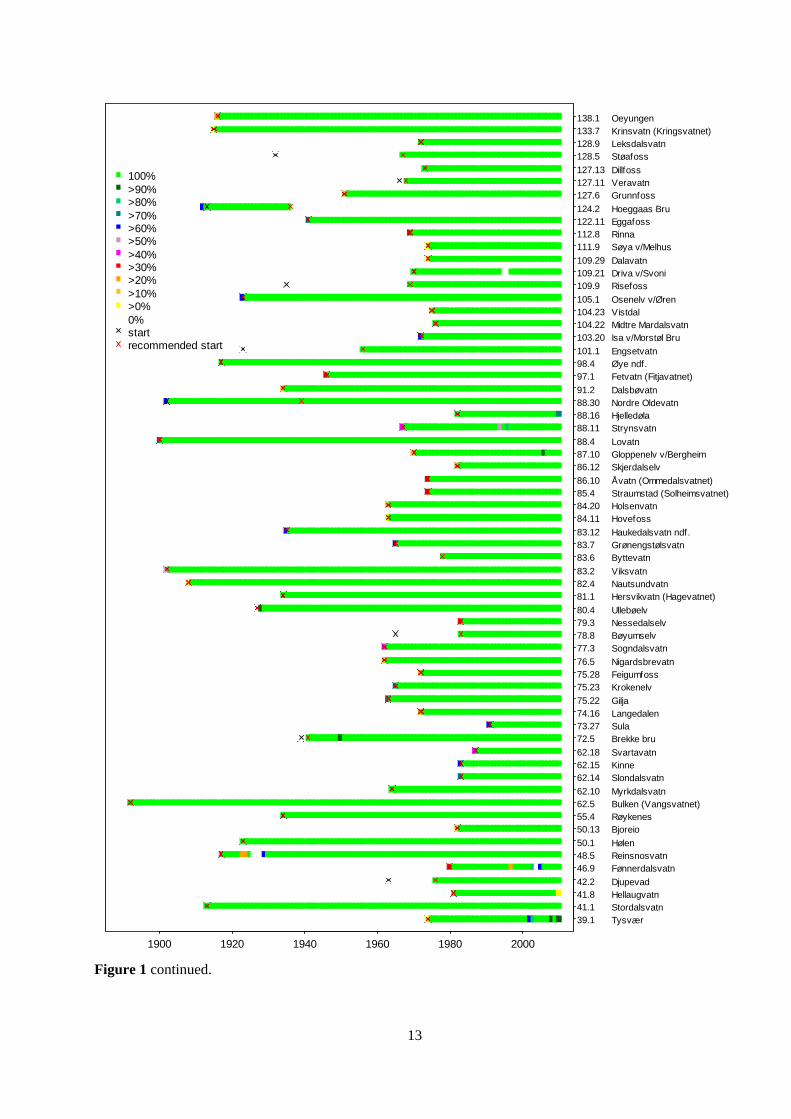
Due to the natural multi-year and decadal variability in the climate system, climate change related studies and studies of trends should in general use records with at least 30 years of data. Here, also series with 20 and more years (until 2011) of good quality data are listed in the HRD, as these series have the potential to soon reach at least 30 years with data. It is therefore important that data collection at the respective stations is maintained and that high quality of the data is ensured. The selection of stations with long enough series was made based on the time period with good data quality series rather than on the complete record length. However, series with shorter periods of missing data are included in the reference dataset. Longer periods of missing data (>1 year) are accepted only for stations with very long records or when there are few stations with good data records in the region. Figure 1 shows the data completeness per year for all selected reference stations.
Three stations with relatively short data records (since the late 1970s) and several years of missing data are not finally excluded from the list of reference series, as they all belong to the same river system, the Skienvassdraget, and there are few other stations in the area. These three stations are: 16.127 Viertjern, 16.128 Austbygdåi and 16.193 Hørte.
12
2.11
2.132.32
2.142
2.2652.268
2.275
2.2792.280
2.284
2.290
2.2912.303
2.323
2.6146.10
11.4
12.1312.70
12.171
12.17812.188
12.192
12.193
12.19712.215
15.49
15.5315.74
16.66
16.7516.122
16.127
16.12816.193
16.194
18.1018.11
19.73
19.78
19.7919.80
19.82
19.9619.104
20.2
20.1122.16
22.22
24.824.9
25.24
26.20
26.2126.26
26.29
27.1528.7
35.9
35.1636.13
38.1
Narsjø
Nedre SjodalsvatnAtnasjoe
Knappom
UnsetåaAkslen
Liavatn
KråkfossKringlerdal
Sælatunga
Brustuen
ToraDombås
Fura
RostenGryta
Elgtjern
RysnaEtna
Hølervatn
EggedalLangtjernbekk
Sundbyfoss
Fiskum
GrunkeStoreskar
Halledalsvatn
BorgåiSkorge
Grosettjern
Tannsvatn (Lognvikvatnet)Grovåi
Viertjern
AustbygdåiHørte
Kilen
GjerstadTjellingtjernbekk
Kilåi Bru
Grytå
GravåStigvassåi
Rauåna
Storgama ovf.Songedalsåi
Austenå
TveitdalenMyglevatn ndf.
Søgne
Møska (Skolandsvatnet)Tingvatn (Lygne)
Gjuvvatn
Årdal
SandvatnJogla
Refsvatn
Austrumdal (AustrumdalsvatneHaugland
Osali (Botnavatnet)
DjupadalsvatnGrimsvatn
Holmen
1900 1920 1940 1960 1980 2000
Figure 1 Annual data completeness for all series in the final reference dataset for streamflow.
13
39.141.141.842.2
46.948.550.1
50.1355.462.562.10
62.1462.1562.18
72.573.2774.1675.22
75.2375.2876.5
77.378.879.380.4
81.182.483.2
83.683.783.12
84.1184.2085.486.10
86.1287.1088.4
88.1188.1688.3091.2
97.198.4101.1
103.20104.22104.23105.1
109.9109.21109.29
111.9112.8122.11124.2
127.6127.11127.13
128.5128.9133.7138.1
TysværStordalsvatnHellaugvatnDjupevad
FønnerdalsvatnReinsnosvatnHølen
BjoreioRøykenesBulken (Vangsvatnet)Myrkdalsvatn
SlondalsvatnKinneSvartavatn
Brekke bruSulaLangedalenGilja
KrokenelvFeigumfossNigardsbrevatn
SogndalsvatnBøyumselvNessedalselvUllebøelv
Hersvikvatn (Hagevatnet)NautsundvatnViksvatn
ByttevatnGrønengstølsvatnHaukedalsvatn ndf.
HovefossHolsenvatnStraumstad (Solheimsvatnet)Åvatn (Ommedalsvatnet)
SkjerdalselvGloppenelv v/BergheimLovatn
StrynsvatnHjelledølaNordre OldevatnDalsbøvatn
Fetvatn (Fitjavatnet)Øye ndf.Engsetvatn
Isa v/Morstøl BruMidtre MardalsvatnVistdalOsenelv v/Øren
RisefossDriva v/SvoniDalavatn
Søya v/MelhusRinnaEggafossHoeggaas Bru
GrunnfossVeravatnDillfoss
StøafossLeksdalsvatnKrinsvatn (Kringsvatnet)Oeyungen
1900 1920 1940 1960 1980 2000
100%>90%>80%>70%>60%>50%>40%>30%>20%>10%>0%0%startrecommended start
Figure 1 continued.
14
139.20139.26139.35140.2
148.2151.13151.15
152.4153.1156.8156.10
156.15156.17156.24
156.27161.7162.3162.8
163.5163.6163.7
168.2168.3172.7172.8
173.8177.4178.1
185.1186.2189.3
191.2196.7196.11196.12
200.4203.2205.6
206.3208.2208.3209.4
211.1212.10212.48
212.49213.2213.4223.2
230.1234.13234.18
237.1244.2246.9247.3
307.5307.7308.1
311.4311.6311.460313.10
MoenEmbrethølenTrangenSalsvatn
MevatnetØvre GlugvatnNervoll
FustvatnStorvatnSvartisdalBerget
ForsbakkVirvatnBogvatn
LeirågaTollågaSkarsvatnValnesvatn
JunkerdalselvJordbrufjellKjemåvatn
Mørsvik BruLakså BruLeirpoldvatnRauvatn
CoarveijSneisvatnLangvatn
GåslandsvatnÅnesvatnTennevikvatn
OevrevatnYtre FiskeløsvatnLille RostavatnLundberg
SkogsfjordvatnJægervatnDidnojokka
Manndalen BruOksfjordvatnSvartfossbergetLillefossen
LangfjordhamnMasiSagafoss
HalsnesLeirbotnvatnKvalsundLombola
NordmannsetVækkava, IesjokkaPolmak nye
BåtsfjordNeidenSametielvKarpelva
MurusjøLandbru limn.Lenglingen
Femundsenden (Femunden)NybergsundEngerenMagnor
1900 1920 1940 1960 1980 2000
100%>90%>80%>70%>60%>50%>40%>30%>20%>10%>0%0%startrecommended start
Figure 1 continued.
15
4. Active data collection
All stations that are currently active (2012) are considered as potential reference stations. Two stations (68.1 Kløvtveitvatn, 111.8 Ålvundelva) had to be excluded from the list, as they are not operating anymore.
5. Data accuracy
Information about data accuracy was obtained from the station comments in Hydra II and personal communication. Comments about the data quality were also found in the stored information about the rating curve quality and in a report about homogeneity tests (Astrup, 2000). Furthermore, the data quality was checked by an explorative analysis. Special focus was given to the periods where an inhomogeneity had been found by Astrup (2000) as well as on the periods when a station had been moved or the series had been extended, as indicated by a new version number for the time series.
The reports and station comments contained information about general data quality, changes in the riverbed profile, river-ice and possible ice jams during winter, difficult measuring conditions in general or during summer due to vegetation and particularly high uncertainty in the rating curve due to few streamflow measurements. The written comments are subjective as is the interpretation of them to assess the consequences on data quality. The amount of detail in the available information varies between stations and there is no guarantee of completeness.
A statistical quality analysis of the rating curves exist for the rating curves established during the last years. As such, this information is only available for some series and rating curve periods. Excluding streamflow series from the list of potential reference series based on this information would therefore be misleading, because the rating curve quality of most of the series remaining in the list would still be unknown. For most of the series the rating curve quality also varies from low to high flows and between periods. Therefore only the written comments from this analysis are considered, e.g. when they refer to changes in the riverbed profile or other reasons for reduced data quality.
Series with reported changes in the riverbed profile have either been excluded as a whole, if the profile changes take place slowly over a longer time period, or a new starting date is recommended if the change is related to one particular event and the profile can be considered stable after that. Series with difficult measuring conditions due to vegetation should not be used for low flow studies. For series with river-ice during winter, the winter low flows cannot be used. In none of the series ice jams were found to cause high flows that could disturb flood studies.
The homogeneity test was performed in 2000 with series having at least 15 years of data during the period 1961 – 1990. This means that not all the stations were tested. Series with identified homogeneity breaks were excluded only, if:
- the inhomogeneity could be attributed to a known change in the catchment or events causing insufficient data quality;
- the inhomogeneity is clearly visible in the series of daily or annual mean values or in the annual minimum or maximum series and cannot be explained by climatic changes or glacier extension or decline.
16
Hence, series with suggested homogeneity breaks that could not be explained or were visible in the exploratory data analysis were included in the list of potential reference series. Series with non-accepted inhomogeneities were either excluded completely or a shorter time period was recommend as reference series, depending on the kind of inhomogeneity.
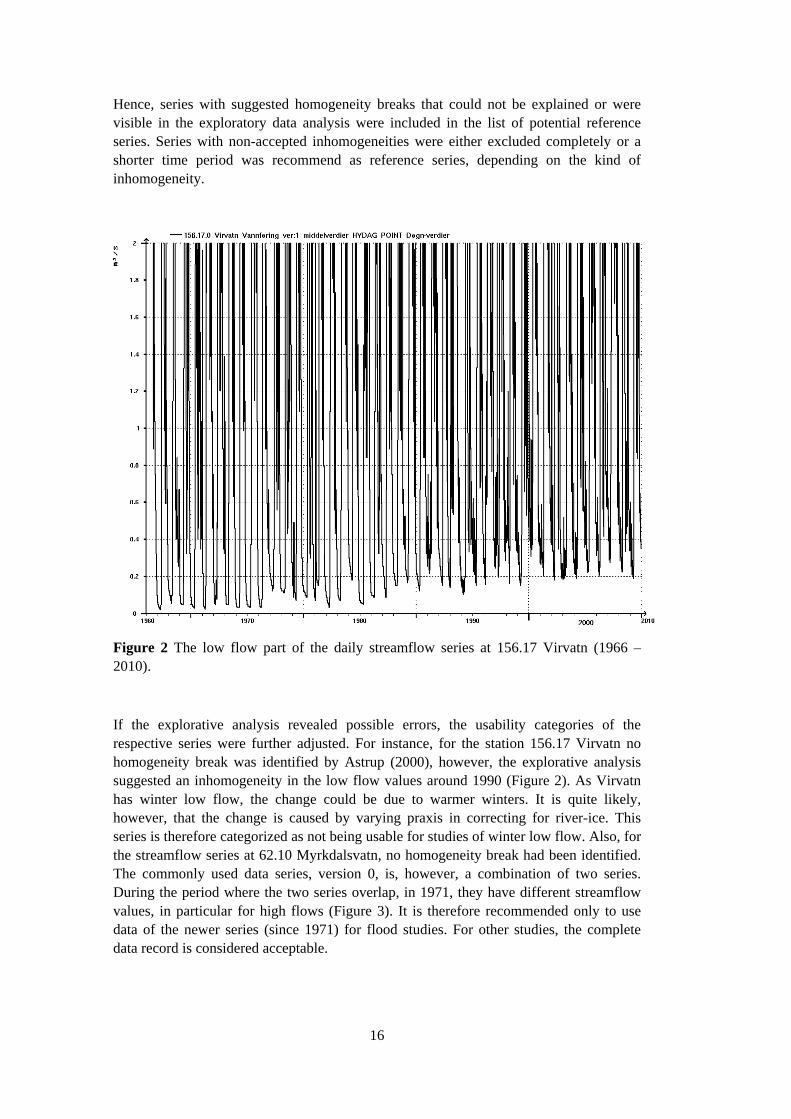
Figure 2 The low flow part of the daily streamflow series at 156.17 Virvatn (1966 – 2010).
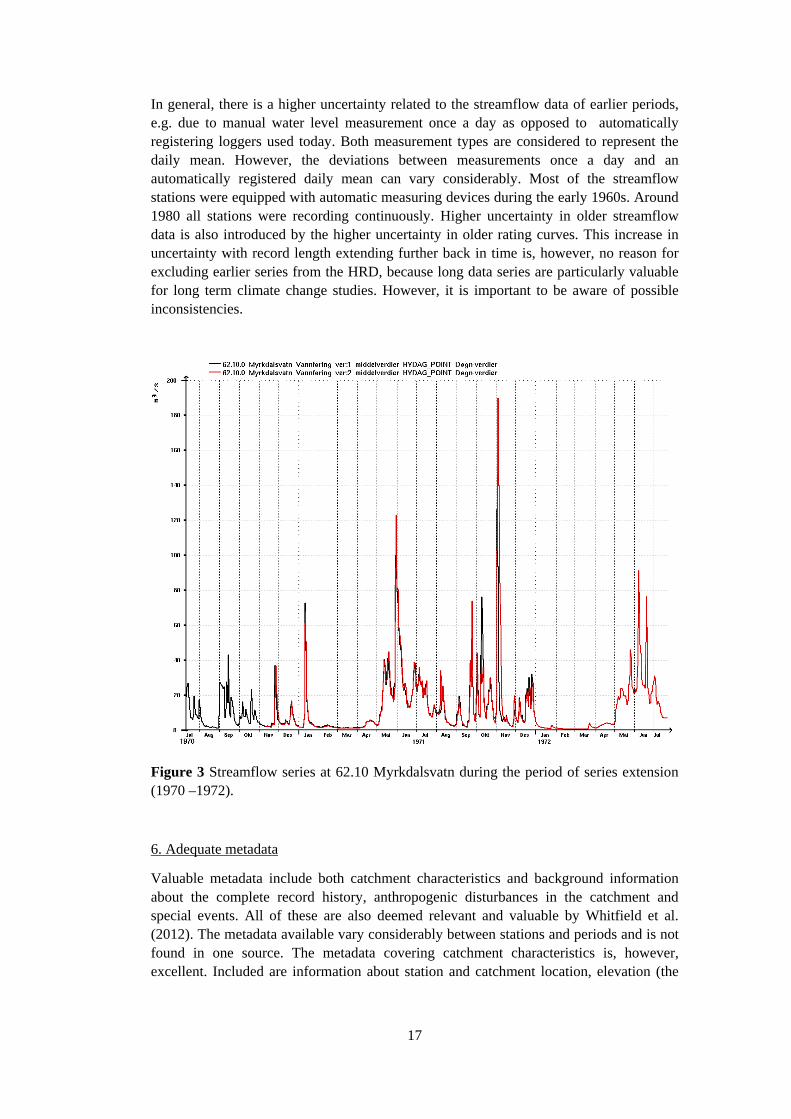
If the explorative analysis revealed possible errors, the usability categories of the respective series were further adjusted. For instance, for the station 156.17 Virvatn no homogeneity break was identified by Astrup (2000), however, the explorative analysis suggested an inhomogeneity in the low flow values around 1990 (Figure 2). As Virvatn has winter low flow, the change could be due to warmer winters. It is quite likely, however, that the change is caused by varying praxis in correcting for river-ice. This series is therefore categorized as not being usable for studies of winter low flow. Also, for the streamflow series at 62.10 Myrkdalsvatn, no homogeneity break had been identified. The commonly used data series, version 0, is, however, a combination of two series. During the period where the two series overlap, in 1971, they have different streamflow values, in particular for high flows (Figure 3). It is therefore recommended only to use data of the newer series (since 1971) for flood studies. For other studies, the complete data record is considered acceptable.
17
In general, there is a higher uncertainty related to the streamflow data of earlier periods, e.g. due to manual water level measurement once a day as opposed to automatically registering loggers used today. Both measurement types are considered to represent the daily mean. However, the deviations between measurements once a day and an automatically registered daily mean can vary considerably. Most of the streamflow stations were equipped with automatic measuring devices during the early 1960s. Around 1980 all stations were recording continuously. Higher uncertainty in older streamflow data is also introduced by the higher uncertainty in older rating curves. This increase in uncertainty with record length extending further back in time is, however, no reason for excluding earlier series from the HRD, because long data series are particularly valuable for long term climate change studies. However, it is important to be aware of possible inconsistencies.
Figure 3 Streamflow series at 62.10 Myrkdalsvatn during the period of series extension (1970 –1972).
6. Adequate metadata
Valuable metadata include both catchment characteristics and background information about the complete record history, anthropogenic disturbances in the catchment and special events. All of these are also deemed relevant and valuable by Whitfield et al. (2012). The metadata available vary considerably between stations and periods and is not found in one source. The metadata covering catchment characteristics is, however, excellent. Included are information about station and catchment location, elevation (the
18
hypsographic curve), area, catchment and river length and gradient as well as land cover (see above). What is missing is information about changes in the land cover.
Hydra II contains information about how the stations have been operated, including instrumentation, measurement location (river / lake) and profile (natural / artificial), control streamflow measurements, rating curves etc. However, not everything is stored in the same place and is easy to find for the user. For instance, in case a station has been moved or replaced by a new one, all of the control streamflow measurements from both stations are registered under the newest station without specifying where the single measurements were taken. The rating curves and instrumentation history, on the other hand, are registered under the station, where they actually have been used. In particular for the discontinued stations, information can also be missing.
The station description in Hydra II further specifies station type (i.e. the purpose for streamflow observations and that location), which other variables are measured at the station and what the data series are applied for. The application areas of the streamflow series is currently updated in the ongoing station network project mentioned above.
Relevant information is also available through personal communication and in reports. This is particularly the case for information about special events or varying catchment area, e.g. due the varying extension of glaciers or a lake with two outlets in the catchment. Whenever such information was found this has been included in the list of reference stations in Appendix 1.
3.2 Soil moisture
3.2.1 Available data
The existing soil moisture monitoring network at NVE includes 18 stations. In addition to groundwater monitoring, soil moisture at different depths is routinely measured.
Soil moisture potential (kPa) at every 15 cm depth, down to around 1 m, is measured with soil water resistance blocks (Watermark sensors, Irrometer Co, Riverside, California). The measurement range is from -20 kPa to -200 kPa. The sensors are mostly used for evaluation of soil frost depth and not soil water content. Therefore the measurements are discarded from the reference dataset.
Soil moisture is measured at the following depths: 0-10, 10-20, 20-30, 30-40, 40-60 and 60-100 cm with a PR2 Profile Probe from Delta-T mounted in an access tube. Measurement accuracy with soil calibration is ± 0.04 m3/m3. It is an indirect measurement of the soil moisture content by measuring the permittivity of the soil (Frequency domain reflectometry). The series are less than 10 years and a proper site calibration has to be performed before the data can be used as a reference dataset.
19
3.3 Groundwater
3.3.1 Available data
All daily groundwater series stored in NVE’s Hydra II database classified as active were chosen as basis for the selection of reference stations, totally 63 stations.
3.3.2 Selection of groundwater stations
The criteria for HRNs presented in Chapter 2 are adjusted for groundwater and commented shortly below
Criteria groundwater stations:
1. Stable land use conditions including absence of significant regulations, diversions or water use. Includes both natural and agricultural sites.
2. Record length. Minimum 20 years in total and more than 10 years of daily groundwater measurements. This length ensures that underrepresented climatic or geographic areas, which are characterized by minimal data availability, are also included. However, record lengths should also be as long as possible to allow decadal variability to be distinguished from long-term trends; due to multi-decadal oscillations in groundwater depth.
3. Active data collection. Currently active and is expected to continue operation;
4. Data accuracy. Good quality data.
5. Adequate metadata. Adequate metadata should be available to support the previous five conditions.
According to the evaluation of the Norwegian data, the groundwater data series were categorized into the following usability categories:
A series can be used for all kind of climate change related studies (comments for groundwater in bold):
1. based on daily data (since...), 2. based on weekly or monthly data (from – to), but not for max or min groundwater
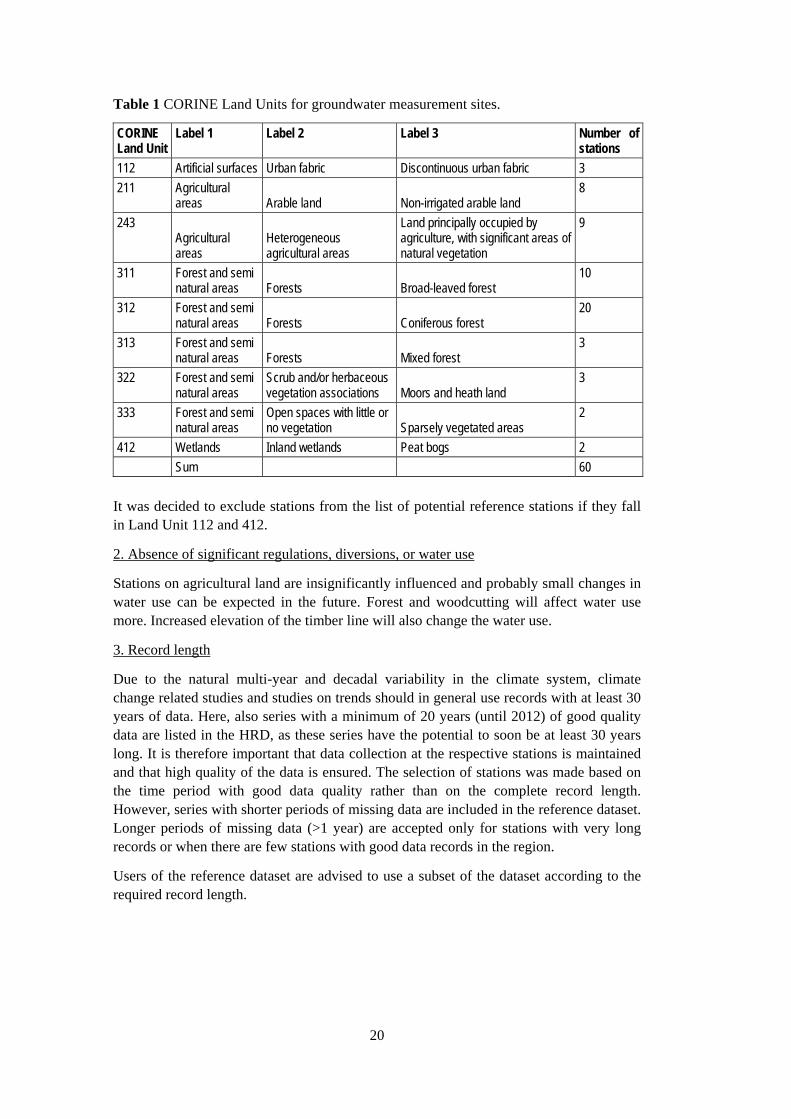
levels 1. Degree of basin development The main land cover unit according to the European Environment Agency (EEA) “Coordination of information on the environment”-programme (CORINE) are included in the metadata. For Norway, maps for 2000 and 2006 are published by The Norwegian Forest and Landscape Institute, UMB. Comparison of changes now and in the future will therefore be possible. Data from 2006 are given for the site of the groundwater measurement in the metadata. Descriptions of the classes are shown in Table 1.
20
Table 1 CORINE Land Units for groundwater measurement sites.
CORINE Land Unit
Label 1 Label 2 Label 3 Number of stations
112 Artificial surfaces Urban fabric Discontinuous urban fabric 3
211 Agricultural areas Arable land Non-irrigated arable land
8
243 Agricultural areas
Heterogeneous agricultural areas
Land principally occupied by agriculture, with significant areas of natural vegetation
9
311 Forest and semi natural areas Forests Broad-leaved forest
10
312 Forest and semi natural areas Forests Coniferous forest
20
313 Forest and semi natural areas Forests Mixed forest
3
322 Forest and semi natural areas
Scrub and/or herbaceous vegetation associations Moors and heath land
3
333 Forest and semi natural areas
Open spaces with little or no vegetation Sparsely vegetated areas
2
412 Wetlands Inland wetlands Peat bogs 2
Sum 60
It was decided to exclude stations from the list of potential reference stations if they fall in Land Unit 112 and 412.
2. Absence of significant regulations, diversions, or water use
Stations on agricultural land are insignificantly influenced and probably small changes in water use can be expected in the future. Forest and woodcutting will affect water use more. Increased elevation of the timber line will also change the water use.
3. Record length
Due to the natural multi-year and decadal variability in the climate system, climate change related studies and studies on trends should in general use records with at least 30 years of data. Here, also series with a minimum of 20 years (until 2012) of good quality data are listed in the HRD, as these series have the potential to soon be at least 30 years long. It is therefore important that data collection at the respective stations is maintained and that high quality of the data is ensured. The selection of stations was made based on the time period with good data quality rather than on the complete record length. However, series with shorter periods of missing data are included in the reference dataset. Longer periods of missing data (>1 year) are accepted only for stations with very long records or when there are few stations with good data records in the region.
Users of the reference dataset are advised to use a subset of the dataset according to the required record length.
21
4. Active data collection
All stations which currently are active (2012) are considered as potential reference stations. However, several stations were lacking data or quality controlled data for the most recent period. For most of these, the lacking data could easily be retrieved.
5. Data accuracy
The data quality was checked by an explorative graphical analysis. Special focus was given to the periods for which an inhomogeneity seems to occur, periods of changes in measurement frequency and method, and peaks which look unnatural.
The reports and station comments contained information about general data quality and changes in the measurement equipment (manual automatic) or change of groundwater pipe. The amount of detail in the available information varies between stations and there is no guarantee of completeness. It is for instance rarely commented on good data quality. Some series have occurrence of ice in the groundwater pipe during winter. These stations should not be used to evaluate changes in the winter climate.
If the explorative analysis revealed possible errors, the usability categories of the respective series were further evaluated. This was performed by a visual graphical check of estimated recharge and groundwater response (rain and snowmelt) from a conceptual precipitation-runoff model (HBV-model, 1x1 km2 grid).
In general, there is a higher uncertainty related to peak groundwater measurements in earlier periods, e.g. due to manual measurement weekly or monthly as opposed to the automatically registering loggers used today. Most of the groundwater stations were equipped with automatic measuring devices around 2000. From 2012 all stations were recording continuously.
6. Adequate metadata
Hydra II contains metadata about how the stations have been operated, including instrumentation, measurement location and elevation and control measurements. The station description in Hydra II further specifies station type and other variables measured at the station.
3.4 Snow
3.4.1 Available data Snow water equivalent (SWE) has been recorded by the hydropower companies since 1914, with the aim to obtain information about available water resources for hydropower production and to estimate the risk of flooding. This data (hereinafter referred as HPC-data) is managed by NVE and contains over 40000 measurements of snow depth and
density (SWE = snow depth density) from over 1300 stations. Most of the measurements are taken at the time of the annual snow maximum around the beginning of April. However, only a handful of stations have continuous data since the 1920s.
22
The measurements in the HPC-data are normally based on a snow course (~1 km) or a point swarm. Common for all measurements is that a “station” is a fixed coordinate along the snow course/in the point swarm, and that the reported SWE at the station is a mean of several snow depth measurements, combined with one or more density measurements.
The HPC-data set has recently been used to analyze long-term trends in snow depth (Dyrrdal et al., 2013) and snow water equivalent (Skaugen et al., 2012) in Norway, as well as to evaluate the seNorge snow model simulating snow maps for Norway (Saloranta, 2012).
In addition to the extensive HPC-data set, NVE has recorded time series from over 30 snow pillows around Norway measuring SWE directly by weighing the snow pack over the snow pillow. Some of these time series date back to 1967, but many of the snow pillow stations were established 10-15 years ago. NVE also operates a few snow courses, but the length of these time series is still relatively short (except for the Atna snow course dating back to the 1980s).
In the following, we focus on selecting representative time series of the HPC-data for the climate reference data set. We also briefly mention reference station candidates from the NVEs snow pillow and snow course data archives.
3.4.2 Selection of snow stations The following criteria were used to select a subset of the HPC-stations for the climate reference data set:
1. Observations taken at the approximate time of the annual snow maximum. This time window was selected to be 15. March - 15. April.
2. Continuous time series of at least 20 annual observations (by “continuous” we mean that missing data gaps of up to three years are tolerated).
3. The continuous time series must end within the last three years (2009-2011). Note that newer measurements, i.e. 2012, are not yet included in the analyzed data set.
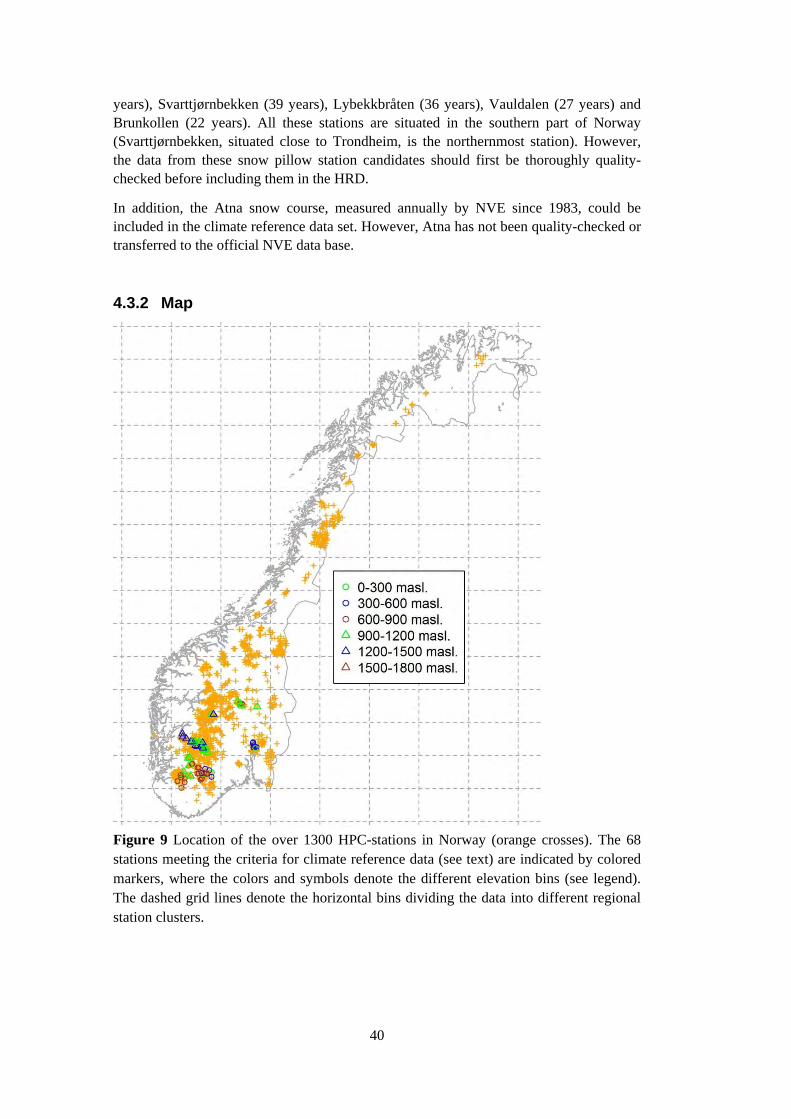
In total 68 stations passed these selection criteria. All these stations are situated in southern Norway, and as Figure 9 shows, many are clustered to certain areas. Therefore, additional binning of the data was done in order to find out how many different station regions and elevation classes that were included. Figure 9 shows the visually selected horizontal bin limits. The elevation bin limits were selected every 300 m from 0 to 1800 m a.s.l.
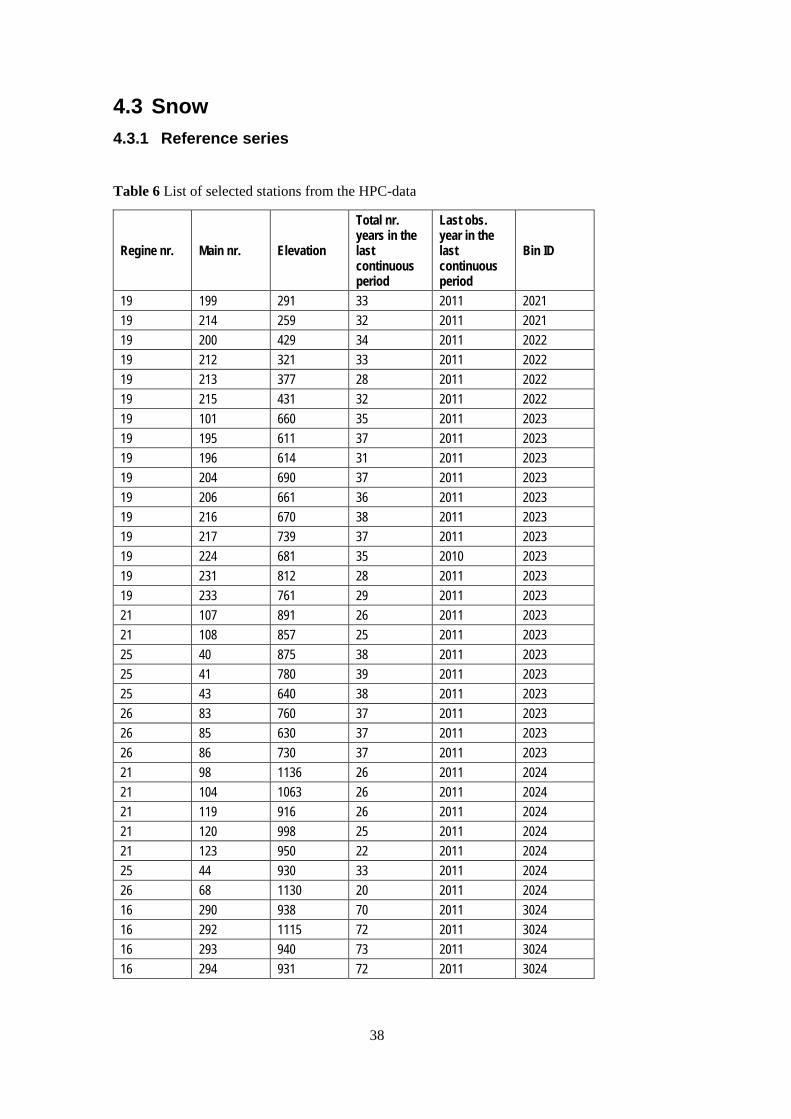
This simple bin-analysis showed that 12 different station bins could be distinguished from the HPC-stations passing the above selection criteria. Figure 9 shows the location of the horizontal bins, as well as the elevation classes of the stations in these bins. Table 6 lists the station numbers and other information about the 68 selected stations. The number of stations in each bin varies from 1 to 18 (see Table 6).
23
Other issues, which can be important selection criteria e.g. regarding streamflow data (such as basin development, significant water regulation and flow levels) are not relevant for the selection of the snow stations.
3.5 Glaciers The glacier series we considered for this report were mass balance and length change observations. Whereas the mass balance reflects annual weather directly, records of length change (also termed front-position change) are considered as proxies for climate change on a decadal-to-century time scale (Oerlemans, 2005).
3.5.1 Available data
We used criteria 3 (record length) and 4 (active data collection) as a first criteria for selecting the possible reference stations for glaciers. Thus, all annual glacier mass balance and length change series stored in NVE’s Hydra II database that are longer than 20 years and classified as active were chosen as basis for the selection of reference stations. Overviews of all the monitored glaciers as well as description of methods are found in Andreassen et al. (2005) with updates in Kjøllmoen et al. (2011).
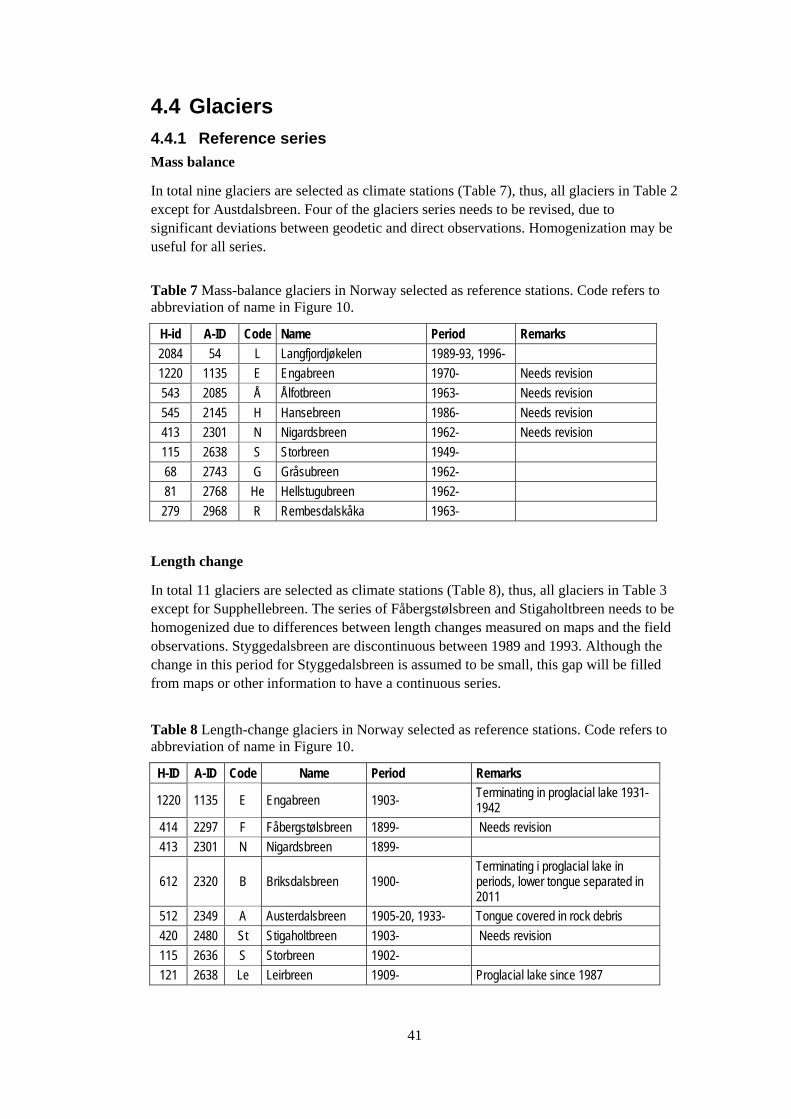
Mass balance
NVE’s glacier surface mass-balance series contain annual (net), winter and summer balances. The annual balance is the sum of winter balance and summer balance. Area-averaged values for winter and summer balances are calculated by inter- and extrapolating point measurements of snow density, snow depths and ablation. In 2012 mass balance are measured at 16 glaciers. Ten glaciers have been measured for 20 years or longer and were used as basis for the selection for reference stations (Table 2).
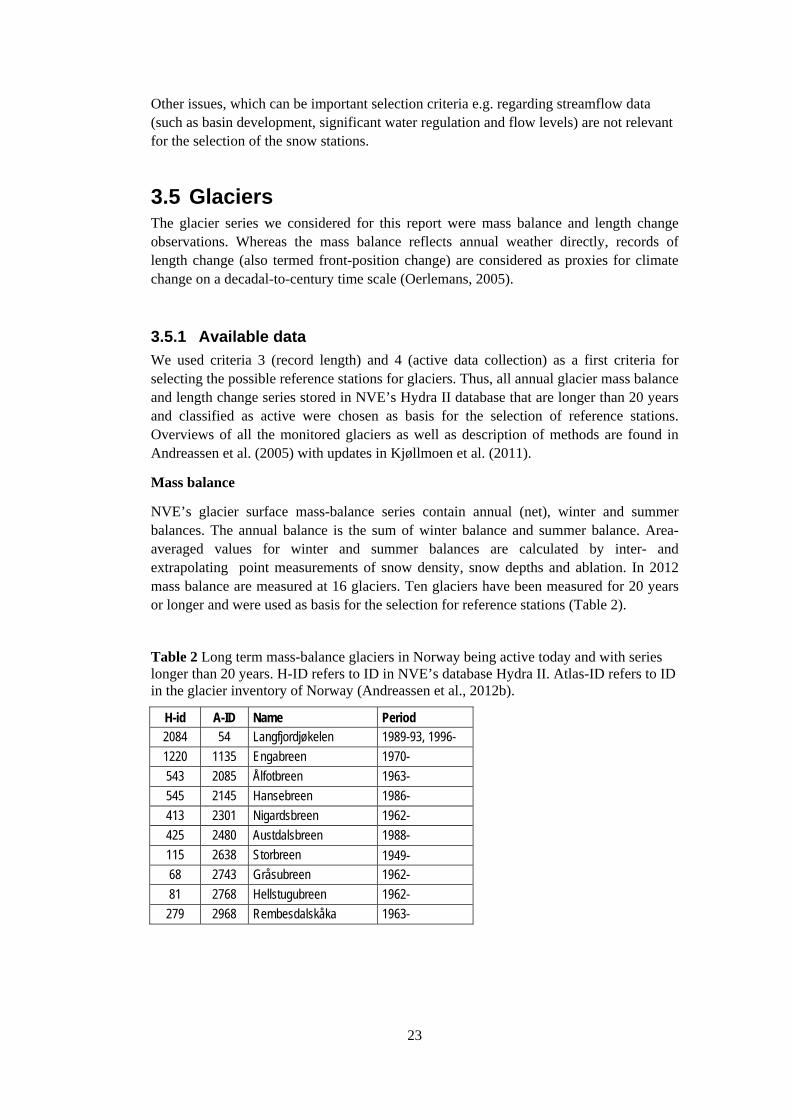
Table 2 Long term mass-balance glaciers in Norway being active today and with series longer than 20 years. H-ID refers to ID in NVE’s database Hydra II. Atlas-ID refers to ID in the glacier inventory of Norway (Andreassen et al., 2012b).
H-id A-ID Name Period 2084 54 Langfjordjøkelen 1989-93, 1996-
1220 1135 Engabreen 1970-
543 2085 Ålfotbreen 1963-
545 2145 Hansebreen 1986-
413 2301 Nigardsbreen 1962-
425 2480 Austdalsbreen 1988-
115 2638 Storbreen 1949- 68 2743 Gråsubreen 1962-
81 2768 Hellstugubreen 1962-
279 2968 Rembesdalskåka 1963-
24
Length change
Glacier length change is derived from annual, repeated measurements of distance between the glacier terminus and fixed landmarks. In 2012 length change are measured at about 30 glaciers. Totally 12 glaciers have been measured for the past 20 years or longer and were used as basis for the selection for reference stations (Table 3). It should be noted that length change must not be measured every year to have a continuous series such as mass balance. If one year is missing one get a length change of two years instead of one, thus losing the annual signal, but keeping the cumulative signal.
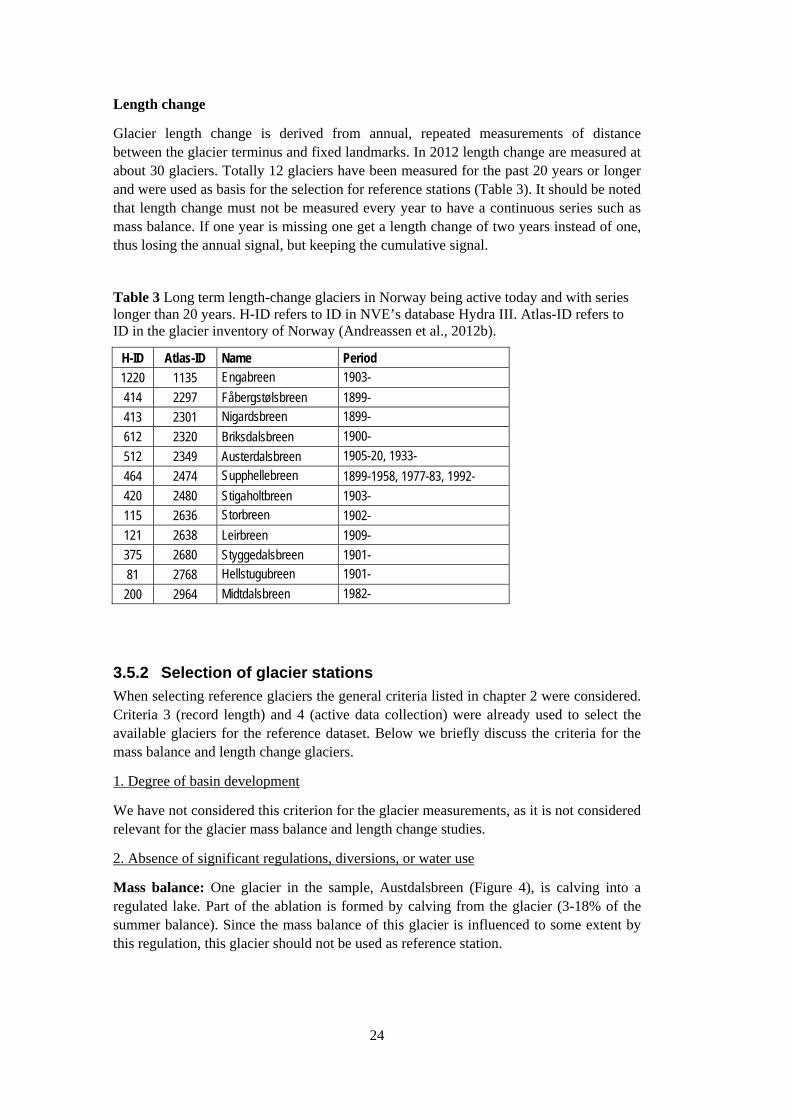
Table 3 Long term length-change glaciers in Norway being active today and with series longer than 20 years. H-ID refers to ID in NVE’s database Hydra III. Atlas-ID refers to ID in the glacier inventory of Norway (Andreassen et al., 2012b).
H-ID Atlas-ID Name Period
1220 1135 Engabreen 1903-
414 2297 Fåbergstølsbreen 1899-
413 2301 Nigardsbreen 1899-
612 2320 Briksdalsbreen 1900-
512 2349 Austerdalsbreen 1905-20, 1933-
464 2474 Supphellebreen 1899-1958, 1977-83, 1992-
420 2480 Stigaholtbreen 1903-
115 2636 Storbreen 1902-
121 2638 Leirbreen 1909-
375 2680 Styggedalsbreen 1901-
81 2768 Hellstugubreen 1901-
200 2964 Midtdalsbreen 1982-
3.5.2 Selection of glacier stations
When selecting reference glaciers the general criteria listed in chapter 2 were considered. Criteria 3 (record length) and 4 (active data collection) were already used to select the available glaciers for the reference dataset. Below we briefly discuss the criteria for the mass balance and length change glaciers.
1. Degree of basin development
We have not considered this criterion for the glacier measurements, as it is not considered relevant for the glacier mass balance and length change studies.
2. Absence of significant regulations, diversions, or water use
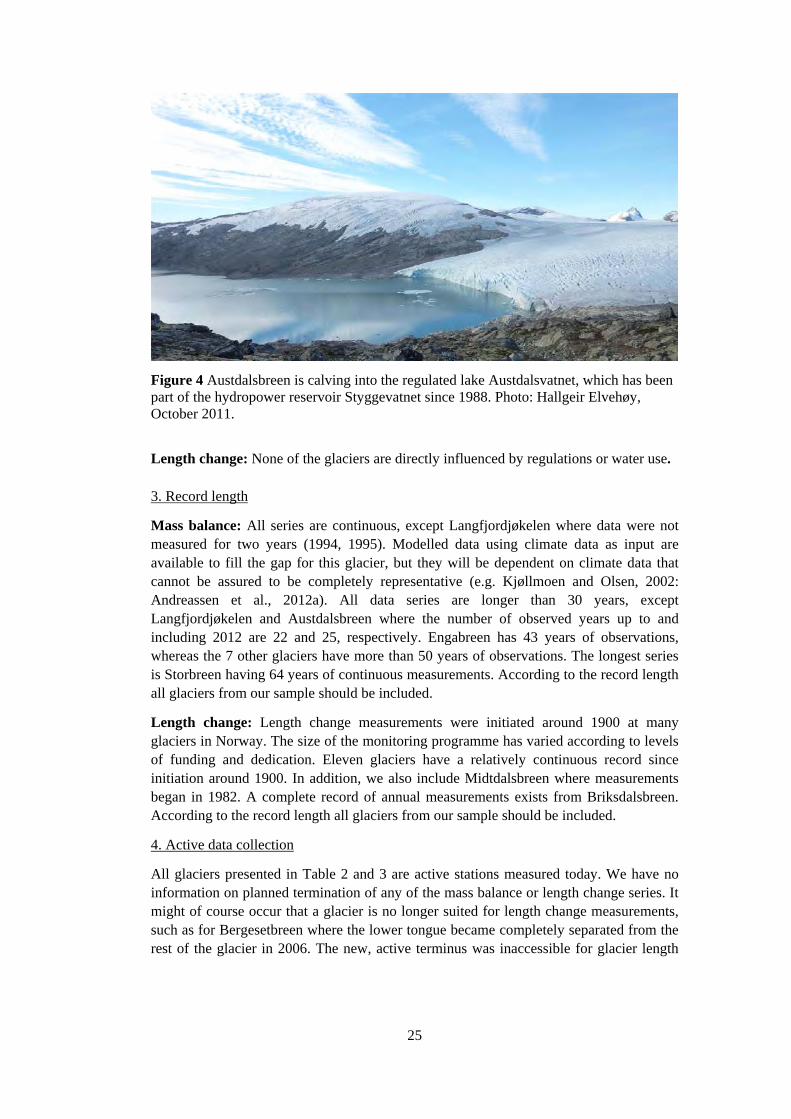
Mass balance: One glacier in the sample, Austdalsbreen (Figure 4), is calving into a regulated lake. Part of the ablation is formed by calving from the glacier (3-18% of the summer balance). Since the mass balance of this glacier is influenced to some extent by this regulation, this glacier should not be used as reference station.
25
Figure 4 Austdalsbreen is calving into the regulated lake Austdalsvatnet, which has been part of the hydropower reservoir Styggevatnet since 1988. Photo: Hallgeir Elvehøy, October 2011.
Length change: None of the glaciers are directly influenced by regulations or water use. 3. Record length
Mass balance: All series are continuous, except Langfjordjøkelen where data were not measured for two years (1994, 1995). Modelled data using climate data as input are available to fill the gap for this glacier, but they will be dependent on climate data that cannot be assured to be completely representative (e.g. Kjøllmoen and Olsen, 2002: Andreassen et al., 2012a). All data series are longer than 30 years, except Langfjordjøkelen and Austdalsbreen where the number of observed years up to and including 2012 are 22 and 25, respectively. Engabreen has 43 years of observations, whereas the 7 other glaciers have more than 50 years of observations. The longest series is Storbreen having 64 years of continuous measurements. According to the record length all glaciers from our sample should be included.
Length change: Length change measurements were initiated around 1900 at many glaciers in Norway. The size of the monitoring programme has varied according to levels of funding and dedication. Eleven glaciers have a relatively continuous record since initiation around 1900. In addition, we also include Midtdalsbreen where measurements began in 1982. A complete record of annual measurements exists from Briksdalsbreen. According to the record length all glaciers from our sample should be included.
4. Active data collection
All glaciers presented in Table 2 and 3 are active stations measured today. We have no information on planned termination of any of the mass balance or length change series. It might of course occur that a glacier is no longer suited for length change measurements, such as for Bergesetbreen where the lower tongue became completely separated from the rest of the glacier in 2006. The new, active terminus was inaccessible for glacier length
26
observations and the last year of observation was 2006. This glacier was not included in our selection due to too short record length.
5. Data accuracy
Mass balance: The accuracy of mass-balance measurements depends on both the accuracy of the point observations and the inter- and extrapolation of point values to spatially distributed values. Systematic errors may cause large cumulative errors in long term mass balance series.
To control the results of the direct mass balance observations, cumulative balance can be calculated from glacier surface elevations measured in different years by differencing digital terrain models (DTMs) and by converting the volume change to mass using density estimate, this is called the geodetic method. Since 2008 all the mass-balance glaciers in Table 2 have been mapped by highly accurate airborne laser scanning. The collected data are now compared with previous maps of surface elevations to calculate geodetic mass balance and to compare this with the cumulative measured mass balance. Preliminary results reveal larger discrepancies between the methods for four of the glaciers: Nigardsbreen, Ålfotbreen, Hansebreen and Engabreen, whereas the other glaciers have better or acceptable agreement (e.g. Andreassen et al., 2012a). The results of these analyses will be used to correct and revise the direct measurements where necessary.
Long series of measurements will seldom be perfectly homogeneous because of changes in personnel and procedure, and as there will be changes in glacier area (and elevation) when averaging the data (Braithwaite, 2002). To isolate the effects of climate from the effects of changing glacier topography one can create reference-surface mass-balance series (Elsberg et al., 2001). All the mass-balance glaciers referred to here have multiple maps which have been used in the calculations; they are thus not based on reference surface topography, so care must be taken when using long mass-balance series for extracting a climate signal.
It might be worthwhile to calculate (or if already available use such) reference-surface mass-balance series for climate studies, especially when changes in glacier geometry are large over the studied period.
Length change: The accuracy of the distance meter should be within 1-2 m. However, where access was limited or dangerous or line of sight has been changed, the accuracy could be considerably poorer. In general, glaciers have different response times because of different steepness, length, and mass balance gradients. Glacier retreat can also be enhanced significantly when calving into a lake. Monitoring a number of glaciers in an area is useful for filtering the influence of different glacier dynamics and geometries, and local meteorological conditions. Just using one glacier for extracting a climate change signal is not recommended.
6. Adequate metadata
All mass balance and length change data are stored in NVEs database Hydra II and published annually or biannually since 1963 in the report series ‘Glaciological investigations in Norway’ (e.g., Kjøllmoen, 2011).The data are also reported to the World Glacier Monitoring Service and published in their series Fluctuations of Glaciers (e.g.,
27
WGMS, 2008) and Glacier Mass Balance Bulletin (e.g., WGMS, 2011). Although the reporting might be less detailed for some years/periods and some glaciers, the available metadata is found to be satisfactory for using the glaciers as reference stations.
3.6 Lake and river ice
3.6.1 Available data
Available data on ice conditions in NVEs Hydra II database are freeze-up and break-up dates code=5100, ice thickness code=1005, ice map code=5101 and ice notes code=5102. Only active stations with code=5100 (lake ice 23 stations and river ice 3 stations) will be considered in this report. Data for the other codes are sparse and sporadic in Hydra II.
3.6.2 Selection of lake and river stations
When selecting reference stations the general criteria in chapter 2 were considered. Criteria 2 (Absence of significant regulation that could affect freeze-up and break-up dates) 3 (record length) and 4 (active data collection) were used to select the available reference dataset for ice duration. According to the evaluation of the Norwegian data, the ice duration series were categorized into the following two usability categories:
A series can be used for all kind of climate change related studies:
1. based on freeze-up, break-up data
2. based on season (ice duration) data,
1. Absence of significant regulations, diversions, or water use
The 23 (lake) and 3 (river) potential reference stations are classified as “unregulated” or regulated rivers or lakes with insignificant or small impact on freeze-up and break-up dates. Personal contact with the responsible group leader and people at NVE with long experience in using the ice data, helped to clarify most of the uncertainties. Further background information was obtained from previous reports on NVE’s network of hydrological stations in Norway (Pettersson, 2003) and the station comments. The effect of regulations is assumed to decrease when the distance increase between ice station and point where water are transferred or added to the river/lake or lakes. However, the degree of detail in this available information varies between stations, and it is likely that not all intervening activity is documented, in particular not older ones.
2. Record length
Due to the natural multi-year and decadal variability in the climate system, climate change related studies and studies on trends should in general use records with at least 20 years of data.
The selection of stations with sufficiently long series was made based on the time period with expected good data quality rather than on the complete record. Series with short
28
periods of missing data are included in the reference dataset. Long periods of missing data (>1 year) are accepted only if there are few stations with good quality records in the region or for stations where it is possibility to fill in missing data.
3. Active data collection
All stations which are currently active (2011) are considered as potential reference stations. However, several stations were lacking data or quality control in recent years.
3.7 River and lake temperature
3.7.1 Available data
All daily or sub daily river water temperature series stored in NVEs Hydra II database that are classified as active and unregulated (85 stations) or regulated rivers with insignificant impact on water temperature (18 stations) or regulated with small effect on water temperature (53 stations) were chosen as basis for the selection of reference station.
Similarly were all lake water temperature profiles in NVEs Hydra II database that are classified as active and not considered effected by regulations chosen as basis for selection of reference station (73 stations) River water temperature River water temperature before 1982-85 has been monitored by manual measurements mostly at a daily basis. Gradually, manual measurements have been replaced by automatic loggers, recording 4–12 times a day, most frequently in recent years as the logger memory has increased. If the loggers were deployed on the bottom, a bias towards more groundwater dominance on stream temperatures could be expected. However, all loggers were located in relatively shallow and turbulent rapids where significant temperature layering is unlikely. Also, great care was taken to avoid locations where the logger could be stranded during low flows, buried by bedload transport or embedded in ice during winter. However, such problems were not completely eliminated. Lake water temperature Lake water temperatures have been measured for most lakes twice a year. The temperature measurements consist of vertical lake temperature profiles where measurements are carried out at 1 m interval down to 10 m, at 2 m interval between 10 and 20 m, at 25 and 30 m depth, and for every 10 m deeper than 30 m to a maximum of 100 m (or to the bottom if the lakes are shallower). The first measurement was taken close to the temperature minimum, when most lakes were ice covered (February–May), the other around the temperature maximum in August/early September. In most years, and for most lakes the measurement site was located where the lake is deepest, but not all measurements were carried out to this depth due to difficulties in locating the exact position. However, in later years, GPS technology has significantly eased the task of finding the same location every year.
29
3.7.2 Selection of river and lake temperature stations
When selecting reference stations the general criteria in chapter 2 were considered. Criteria 2 (Absence of significant regulation that could affect water temperature) 3 (record length) and 4 (active data collection) were used to select the available reference dataset for water temperature. According to the evaluation of the Norwegian data, the river water temperature series were categorized into the following two usability categories:
A series can be used for all kind of climate change related studies:
1. based on daily data (since...), 2. but not during winter (since only summer measurements have been carried
out),
For the lake water temperature series the date could only be used for climate change related studies
1. based on maximum summer temperature and minimum winter temperature
The resulting river and lake water temperature reference series are presented in Chapter 4.
1. Absence of significant regulations, diversions, or water use
The 156 (river) and 72 (lake) potential reference stations are classified as “unregulated” or regulated rivers or lakes with insignificant impact on water temperature or with small effect on water temperature in our water temperature logger scheme. Personal contact with the responsible group leader and people at NVE with long experience in using the water temperature series, helped to clarify most of the uncertainties. Further background information was obtained from previous reports about the network of hydrological stations in Norway (Pettersson, 2003) and the station comments. The effect of regulations is assumed to decrease when the distance increase between water temperature station and point where water are transferred or added to the river/stream or lakes. However, the degree of detail in this available information varies between stations, and it is likely that not all intervening activity is documented, in particular not older ones.
In some rivers the documented water transfers are constant, i.e. all water from a certain part of the natural catchment is permanently transferred into a neighbouring catchment. The water flow in the remaining part can therefore be considered as natural, however, coming from a catchment area smaller than the natural one. In such cases the water temperature series after regulation could be used.
Catchments with so called mini- or micro-power-stations are usually registered in Hydra II as unregulated. These power stations operate only with the naturally available water in a river at any time without retaining or abstracting any water. The streamflow at stations further downstream is considered as unregulated but water temperature could be significant altered and thus not meeting the requirements of a reference series.
30
2. Record length
Due to the natural multi-year and decadal variability in the climate system, climate change related studies and studies on trends should in general use records with at least 30 years of data. Since most of the water temperature stations are shorter also series with 20 and more years (until 2011) of good quality data are listed in the HRD, as these series have the potential to soon reach at least 20 years with data.
The selection of stations with sufficiently long series was made based on the time period with good quality rather than on the complete record length. Series with shorter periods of missing data are included in the reference dataset. Longer periods of missing data (>1 year) are accepted only for stations when there are few stations in the region or for stations where it is possible to fill in missing data (by using other stations belonging to the same river system or stations situated under the same temperature conditions).
3. Active data collection
All stations which are currently active (2011) are considered as potential reference stations.
4 Final reference datasets 4.1 Streamflow According to the criteria for the Hydrological Reference Dataset stations described in Chapter 2, 188 of the 249 active and unregulated streamflow stations in Norway are included in the HRD. The types of analyses are limited for some of the series as specified by the assigned usability categories. 128 series have at least 30 years of data and no restrictions. The complete streamflow RD including usability categories and data quality comments is presented in Section 4.1.1 and listed in Appendix 1. The spatial coverage of the dataset across Norway is shown in Section 4.1.2, and in Section 4.1.3 the diversity in catchment characteristics in the dataset is described. Sections 4.1.2 and 4.1.3 includes a description of how the selected streamflow RD meets the demands of a HRD of being representative of a country’s hydrological, physiographic and climatic variability.
The streamflow reference dataset includes only series applicable for climate variability and change related studies as specified by the usability categories. Users might want to use only a sub-set of the complete dataset for their studies based on specific criteria, such as record length and completeness or catchment characteristics. For instance, for many climate change related studies it might be sensible to analyse catchments with and without glaciers separately.
4.1.1 Reference series
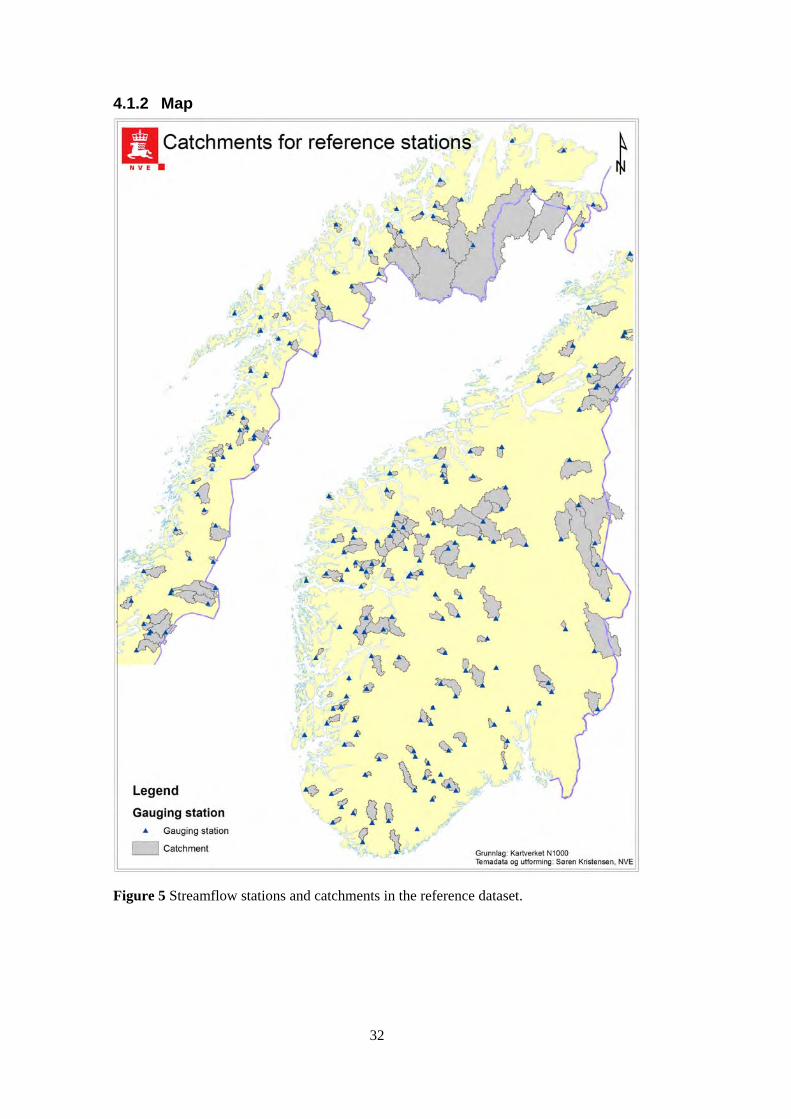
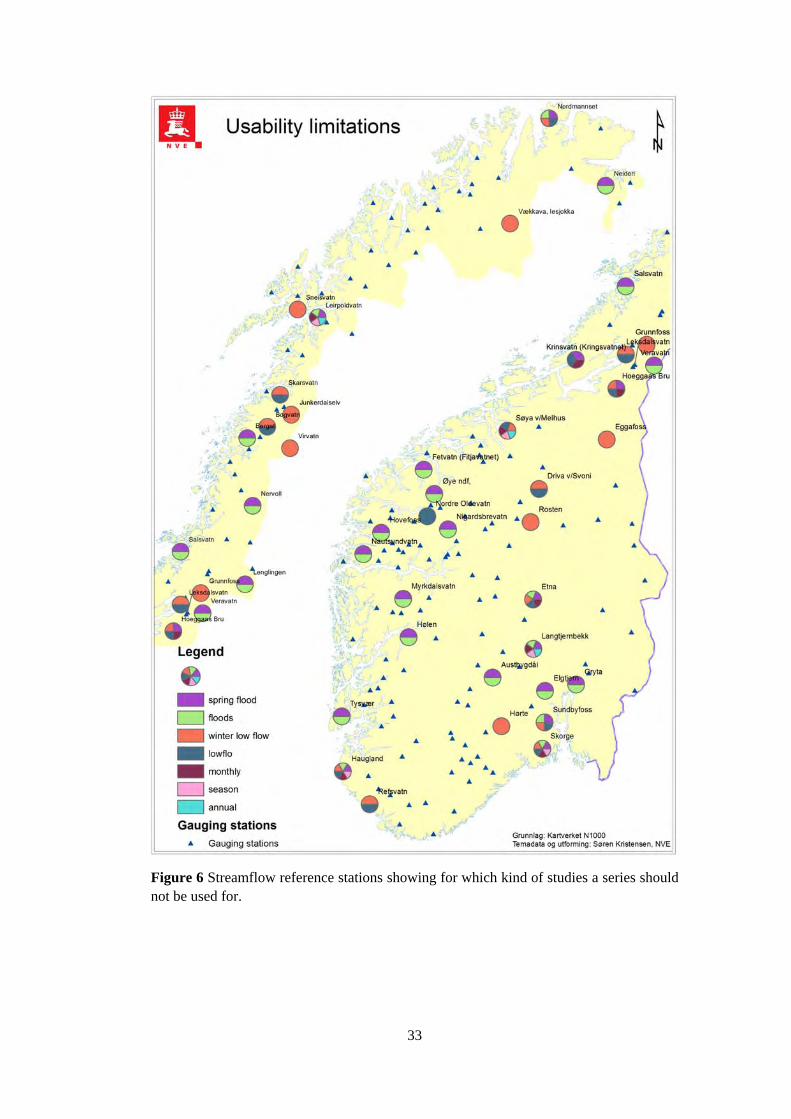
The streamflow reference series are presented in the maps in Section 4.1.2 with their catchments (Figure 5), the assigned usability categories (shown as limitations of usability, Figure 6) and series length (Figure 7). The streamflow
31
reference series are listed in Appendix 1. The table in Appendix 1 includes the following information:
Regine no Regine number (River basin number)
Main no Main number
Station name Station name
Record start Record start date
Reference series start Start date of the series usable as reference series
Homogeneity break Indicated breaks as identified by Astrup (2000), until 2000
Connection year The junction year, if a data series has been extended with data from another/previous station.
Area change (km2) The change in area due to water transfer or a lake with several outlets. The change is given in km2 with respect to the natural catchment area as specified in Hydra II, i.e. it is negative when water is transferred out of the natural catchment.
Varying area 1 catchment area varies between different flow amounts, e.g. in case of bifurcation or a lake in the catchment with two outlets;
2 catchment area varies slowly over time, e.g. due to glaciers;
3 catchment area changed at a certain point in time, e.g. due to a constant transfer of water;
23 catchment area varied slowly over time up to a certain point in time and is constant from then onwards, e.g. changes in glaciers do not influence that catchment anymore.
Usability categories If the usability of a series is restricted, this is marked in the respective column with “x”. If the usability is restricted only for part of the data record, the year from where on the data can be used is given instead.
Comment Information which is considered relevant for data quality.
32
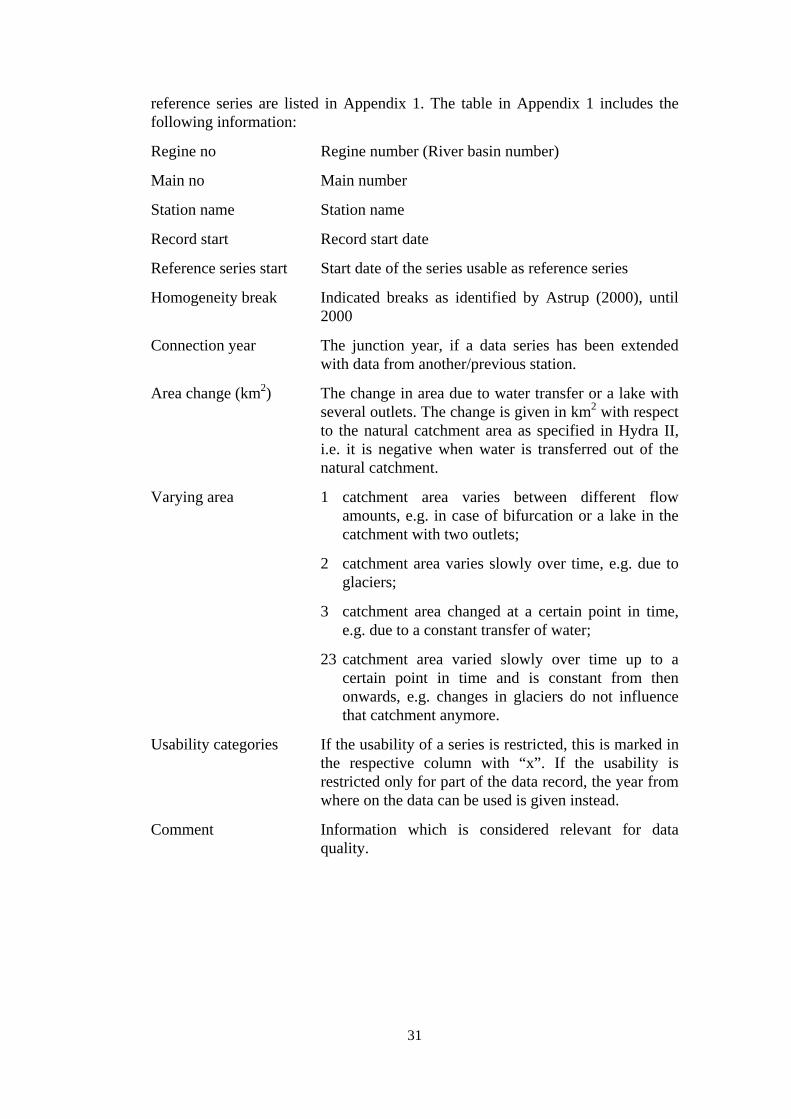
4.1.2 Map
Figure 5 Streamflow stations and catchments in the reference dataset.
33
Figure 6 Streamflow reference stations showing for which kind of studies a series should not be used for.
34
Figure 7 Streamflow stations in the reference dataset and record length of complete daily data until 2010.
35
4.1.3 Catchment characteristics
The stations included in the streamflow RD are distributed over the whole country (Figure 5-7). This ensures that the different climatic and hydrological regions of Norway are represented. However, the quality of the series in terms of record length, data completeness and usability varies. In particular, in the eastern part of southern Norway mostly shorter and incomplete or imperfect series are available. Most of the reference series are from small catchments (50% are <120 km2 and 86% <500 km2). This can be expected as most large catchments in Norway are affected by regulations. The largest catchments with reference series are all in located in northern Norway and along the Swedish border in the south-east. Most of the selected catchments are dominated by mountains or forest. Only four catchments are covered by more than 10% agricultural land and none has more than 1% of urban area. 19 catchments have more than 10% glacier cover, with up to 75% in 76.5 Nigardsbreevatn. The streamflow RD also covers catchments from different elevation zones, with station elevation varying from 0 to 1100 m a.s.l. and the maximum catchment elevation reaching up to 2462 m, which is almost as high as Galdhøpiggen (2469 m), the highest mountain in Norway.
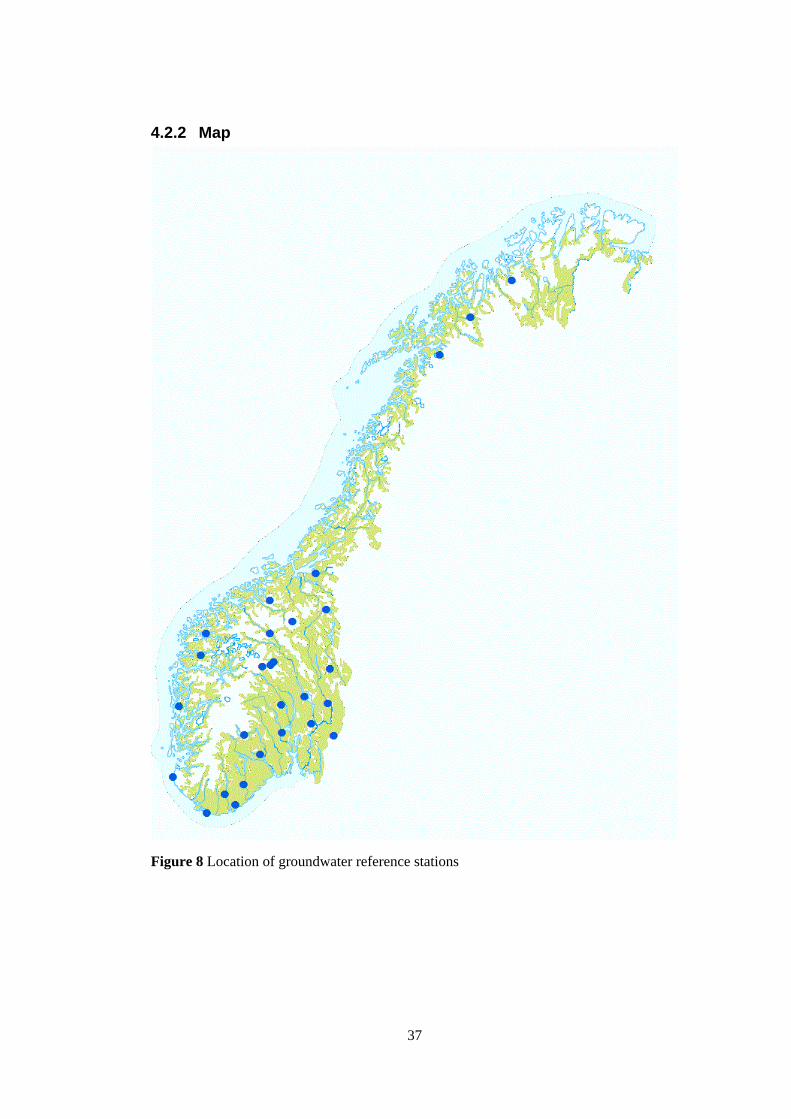
4.2 Groundwater Using the criteria for HRD stations described in Chapter 2 for the 63 active groundwater stations, resulted in a groundwater reference dataset (RD) including 28 series. All the series are longer than 20 years and 8 of the series have daily values for 10 years or more. Before automatisation, measurements were performed weekly or monthly. The other 20 series have daily values for a shorter time period than 10 years.
The criteria for discarding 25 of the series were:
a. shorter than 20 years
b. large gaps in the time series (several months/years)
c. probably errors/trends in the series not possible to verify or correct
The rest of the series, 10, are set on hold because further evaluations of e.g. large gaps and short periods of trends are necessary before they can be included.
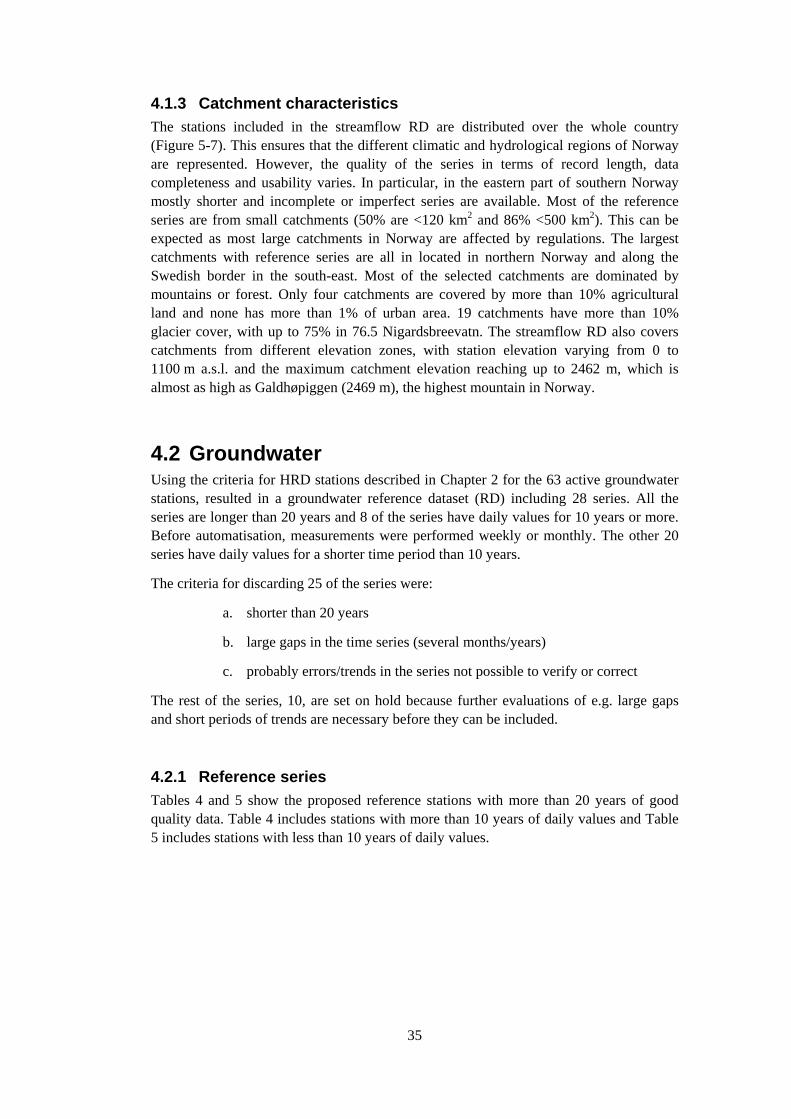
4.2.1 Reference series
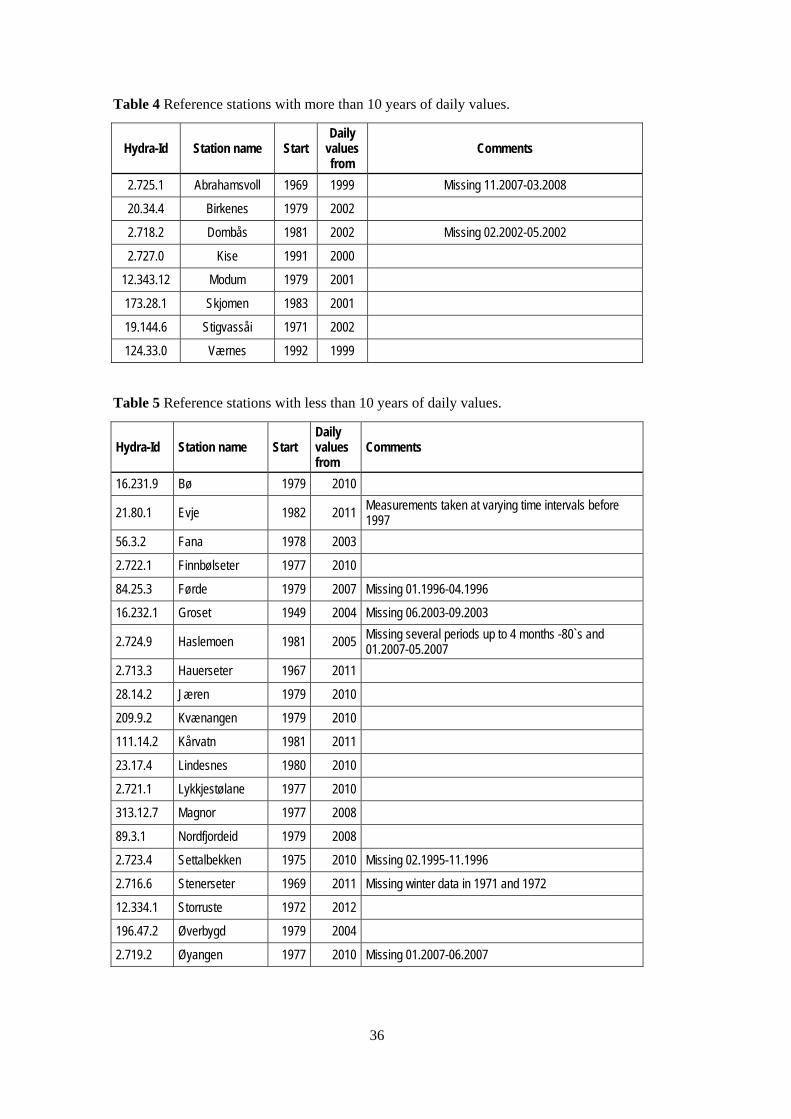
Tables 4 and 5 show the proposed reference stations with more than 20 years of good quality data. Table 4 includes stations with more than 10 years of daily values and Table 5 includes stations with less than 10 years of daily values.
36
Table 4 Reference stations with more than 10 years of daily values.
Hydra-Id Station name Start Daily
values from
Comments
2.725.1 Abrahamsvoll 1969 1999 Missing 11.2007-03.2008
20.34.4 Birkenes 1979 2002
2.718.2 Dombås 1981 2002 Missing 02.2002-05.2002
2.727.0 Kise 1991 2000 12.343.12 Modum 1979 2001
173.28.1 Skjomen 1983 2001
19.144.6 Stigvassåi 1971 2002 124.33.0 Værnes 1992 1999
Table 5 Reference stations with less than 10 years of daily values.
Hydra-Id Station name Start Daily values from
Comments
16.231.9 Bø 1979 2010
21.80.1 Evje 1982 2011 Measurements taken at varying time intervals before 1997
56.3.2 Fana 1978 2003
2.722.1 Finnbølseter 1977 2010
84.25.3 Førde 1979 2007 Missing 01.1996-04.1996
16.232.1 Groset 1949 2004 Missing 06.2003-09.2003
2.724.9 Haslemoen 1981 2005 Missing several periods up to 4 months -80`s and 01.2007-05.2007
2.713.3 Hauerseter 1967 2011
28.14.2 Jæren 1979 2010
209.9.2 Kvænangen 1979 2010
111.14.2 Kårvatn 1981 2011
23.17.4 Lindesnes 1980 2010
2.721.1 Lykkjestølane 1977 2010
313.12.7 Magnor 1977 2008
89.3.1 Nordfjordeid 1979 2008
2.723.4 Settalbekken 1975 2010 Missing 02.1995-11.1996
2.716.6 Stenerseter 1969 2011 Missing winter data in 1971 and 1972
12.334.1 Storruste 1972 2012
196.47.2 Øverbygd 1979 2004
2.719.2 Øyangen 1977 2010 Missing 01.2007-06.2007
37
4.2.2 Map
Figure 8 Location of groundwater reference stations
38
4.3 Snow
4.3.1 Reference series
Table 6 List of selected stations from the HPC-data
Regine nr. Main nr. Elevation
Total nr. years in the last continuous period
Last obs. year in the last continuous period
Bin ID
19 199 291 33 2011 2021
19 214 259 32 2011 2021
19 200 429 34 2011 2022
19 212 321 33 2011 2022
19 213 377 28 2011 2022
19 215 431 32 2011 2022
19 101 660 35 2011 2023
19 195 611 37 2011 2023
19 196 614 31 2011 2023
19 204 690 37 2011 2023
19 206 661 36 2011 2023
19 216 670 38 2011 2023
19 217 739 37 2011 2023
19 224 681 35 2010 2023
19 231 812 28 2011 2023
19 233 761 29 2011 2023
21 107 891 26 2011 2023
21 108 857 25 2011 2023
25 40 875 38 2011 2023
25 41 780 39 2011 2023
25 43 640 38 2011 2023
26 83 760 37 2011 2023
26 85 630 37 2011 2023
26 86 730 37 2011 2023
21 98 1136 26 2011 2024
21 104 1063 26 2011 2024
21 119 916 26 2011 2024
21 120 998 25 2011 2024
21 123 950 22 2011 2024
25 44 930 33 2011 2024
26 68 1130 20 2011 2024
16 290 938 70 2011 3024
16 292 1115 72 2011 3024
16 293 940 73 2011 3024
16 294 931 72 2011 3024
39
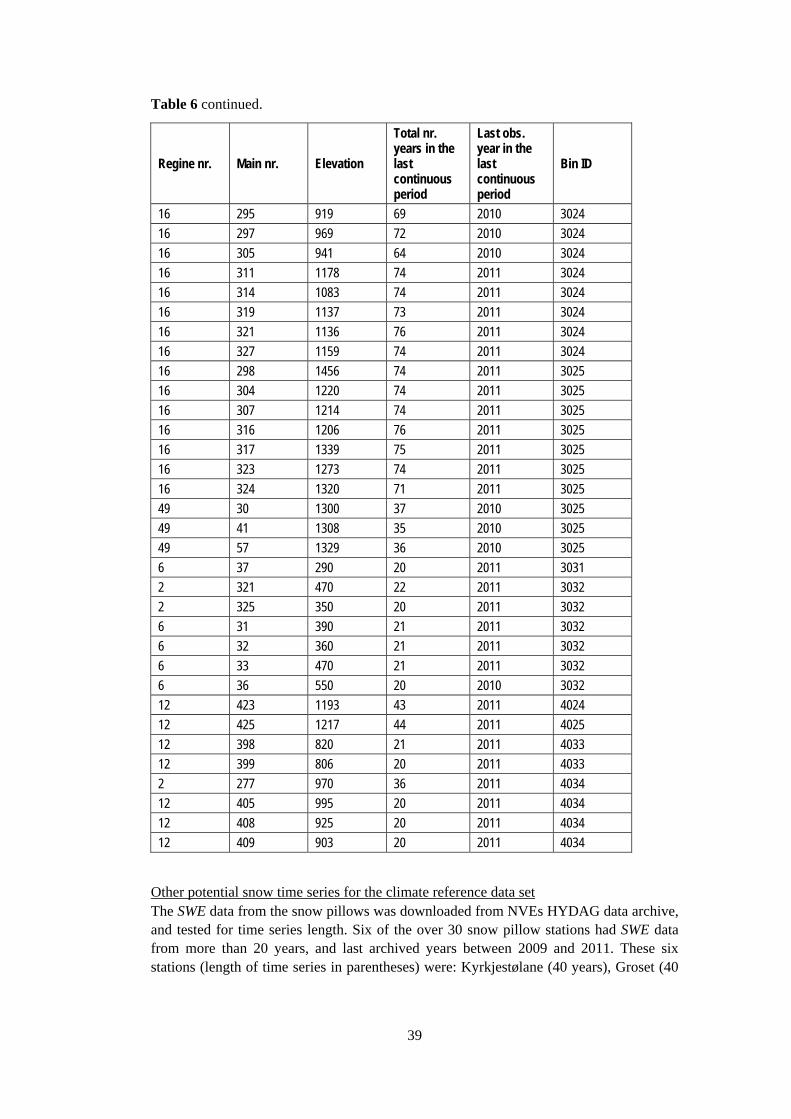
Table 6 continued.
Regine nr. Main nr. Elevation
Total nr. years in the last continuous period
Last obs. year in the last continuous period
Bin ID
16 295 919 69 2010 3024
16 297 969 72 2010 3024
16 305 941 64 2010 3024
16 311 1178 74 2011 3024
16 314 1083 74 2011 3024
16 319 1137 73 2011 3024
16 321 1136 76 2011 3024
16 327 1159 74 2011 3024
16 298 1456 74 2011 3025
16 304 1220 74 2011 3025
16 307 1214 74 2011 3025
16 316 1206 76 2011 3025
16 317 1339 75 2011 3025
16 323 1273 74 2011 3025
16 324 1320 71 2011 3025
49 30 1300 37 2010 3025
49 41 1308 35 2010 3025
49 57 1329 36 2010 3025
6 37 290 20 2011 3031
2 321 470 22 2011 3032
2 325 350 20 2011 3032
6 31 390 21 2011 3032
6 32 360 21 2011 3032
6 33 470 21 2011 3032
6 36 550 20 2010 3032
12 423 1193 43 2011 4024
12 425 1217 44 2011 4025
12 398 820 21 2011 4033
12 399 806 20 2011 4033
2 277 970 36 2011 4034
12 405 995 20 2011 4034
12 408 925 20 2011 4034
12 409 903 20 2011 4034
Other potential snow time series for the climate reference data set The SWE data from the snow pillows was downloaded from NVEs HYDAG data archive, and tested for time series length. Six of the over 30 snow pillow stations had SWE data from more than 20 years, and last archived years between 2009 and 2011. These six stations (length of time series in parentheses) were: Kyrkjestølane (40 years), Groset (40
40
years), Svarttjørnbekken (39 years), Lybekkbråten (36 years), Vauldalen (27 years) and Brunkollen (22 years). All these stations are situated in the southern part of Norway (Svarttjørnbekken, situated close to Trondheim, is the northernmost station). However, the data from these snow pillow station candidates should first be thoroughly quality-checked before including them in the HRD.
In addition, the Atna snow course, measured annually by NVE since 1983, could be included in the climate reference data set. However, Atna has not been quality-checked or transferred to the official NVE data base.
4.3.2 Map
Figure 9 Location of the over 1300 HPC-stations in Norway (orange crosses). The 68 stations meeting the criteria for climate reference data (see text) are indicated by colored markers, where the colors and symbols denote the different elevation bins (see legend). The dashed grid lines denote the horizontal bins dividing the data into different regional station clusters.
41
4.4 Glaciers
4.4.1 Reference series
Mass balance
In total nine glaciers are selected as climate stations (Table 7), thus, all glaciers in Table 2 except for Austdalsbreen. Four of the glaciers series needs to be revised, due to significant deviations between geodetic and direct observations. Homogenization may be useful for all series.
Table 7 Mass-balance glaciers in Norway selected as reference stations. Code refers to abbreviation of name in Figure 10.
H-id A-ID Code Name Period Remarks
2084 54 L Langfjordjøkelen 1989-93, 1996-
1220 1135 E Engabreen 1970- Needs revision
543 2085 Å Ålfotbreen 1963- Needs revision
545 2145 H Hansebreen 1986- Needs revision
413 2301 N Nigardsbreen 1962- Needs revision
115 2638 S Storbreen 1949-
68 2743 G Gråsubreen 1962-
81 2768 He Hellstugubreen 1962-
279 2968 R Rembesdalskåka 1963-
Length change
In total 11 glaciers are selected as climate stations (Table 8), thus, all glaciers in Table 3 except for Supphellebreen. The series of Fåbergstølsbreen and Stigaholtbreen needs to be homogenized due to differences between length changes measured on maps and the field observations. Styggedalsbreen are discontinuous between 1989 and 1993. Although the change in this period for Styggedalsbreen is assumed to be small, this gap will be filled from maps or other information to have a continuous series.
Table 8 Length-change glaciers in Norway selected as reference stations. Code refers to abbreviation of name in Figure 10.
H-ID A-ID Code Name Period Remarks
1220 1135 E Engabreen 1903- Terminating in proglacial lake 1931-1942
414 2297 F Fåbergstølsbreen 1899- Needs revision
413 2301 N Nigardsbreen 1899-
612 2320 B Briksdalsbreen 1900- Terminating i proglacial lake in periods, lower tongue separated in 2011
512 2349 A Austerdalsbreen 1905-20, 1933- Tongue covered in rock debris
420 2480 St Stigaholtbreen 1903- Needs revision
115 2636 S Storbreen 1902-
121 2638 Le Leirbreen 1909- Proglacial lake since 1987
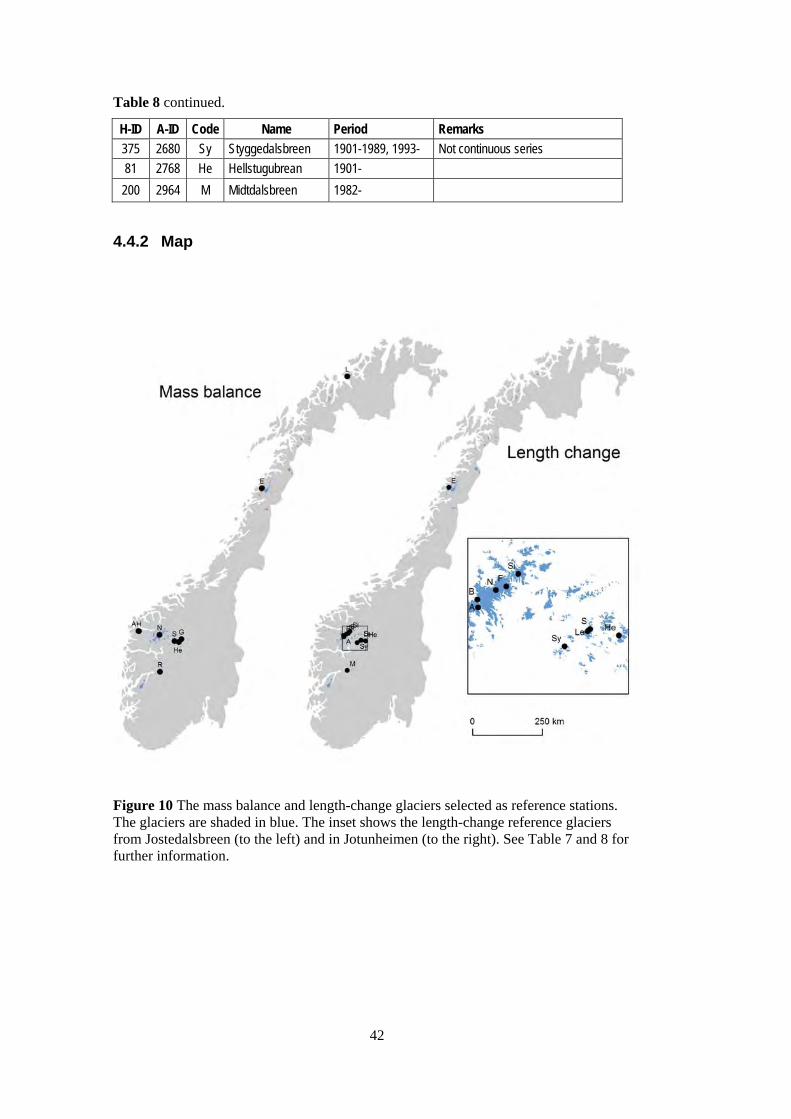
42
Table 8 continued.
H-ID A-ID Code Name Period Remarks
375 2680 Sy Styggedalsbreen 1901-1989, 1993- Not continuous series
81 2768 He Hellstugubrean 1901-
200 2964 M Midtdalsbreen 1982-
4.4.2 Map
Figure 10 The mass balance and length-change glaciers selected as reference stations. The glaciers are shaded in blue. The inset shows the length-change reference glaciers from Jostedalsbreen (to the left) and in Jotunheimen (to the right). See Table 7 and 8 for further information.
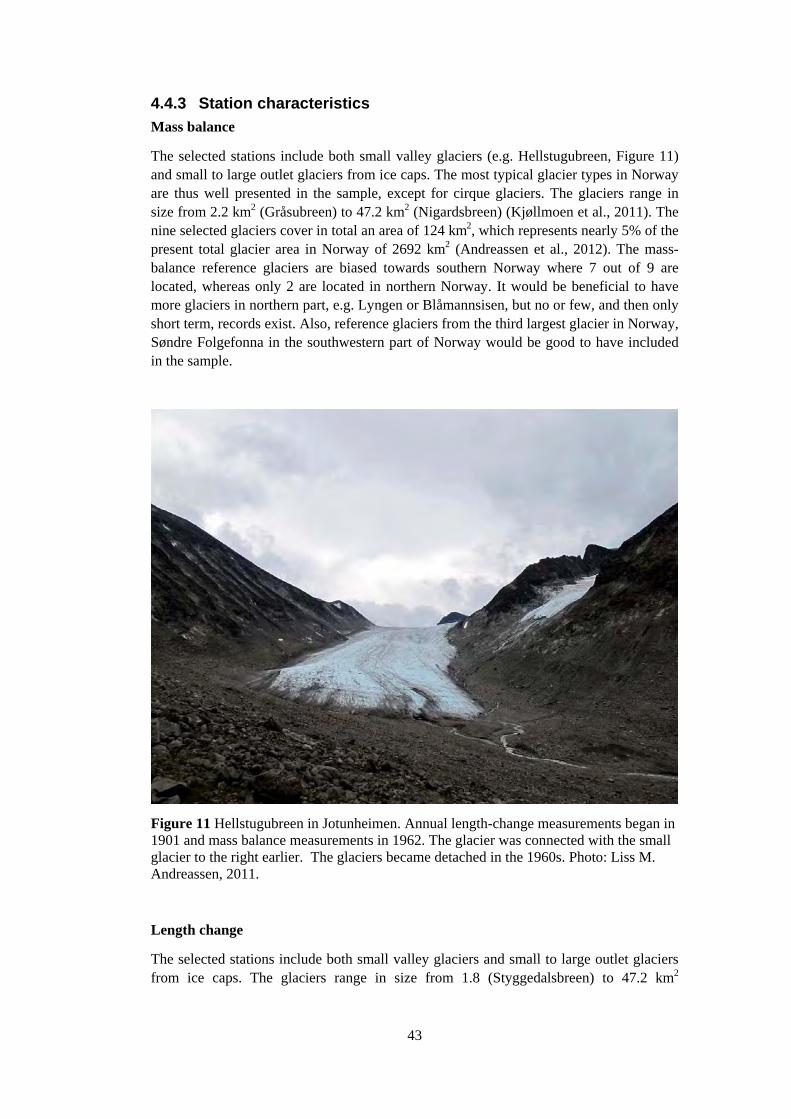
43
4.4.3 Station characteristics
Mass balance
The selected stations include both small valley glaciers (e.g. Hellstugubreen, Figure 11) and small to large outlet glaciers from ice caps. The most typical glacier types in Norway are thus well presented in the sample, except for cirque glaciers. The glaciers range in size from 2.2 km2 (Gråsubreen) to 47.2 km2 (Nigardsbreen) (Kjøllmoen et al., 2011). The nine selected glaciers cover in total an area of 124 km2, which represents nearly 5% of the present total glacier area in Norway of 2692 km2 (Andreassen et al., 2012). The mass-balance reference glaciers are biased towards southern Norway where 7 out of 9 are located, whereas only 2 are located in northern Norway. It would be beneficial to have more glaciers in northern part, e.g. Lyngen or Blåmannsisen, but no or few, and then only short term, records exist. Also, reference glaciers from the third largest glacier in Norway, Søndre Folgefonna in the southwestern part of Norway would be good to have included in the sample.
Figure 11 Hellstugubreen in Jotunheimen. Annual length-change measurements began in 1901 and mass balance measurements in 1962. The glacier was connected with the small glacier to the right earlier. The glaciers became detached in the 1960s. Photo: Liss M. Andreassen, 2011.
Length change
The selected stations include both small valley glaciers and small to large outlet glaciers from ice caps. The glaciers range in size from 1.8 (Styggedalsbreen) to 47.2 km2
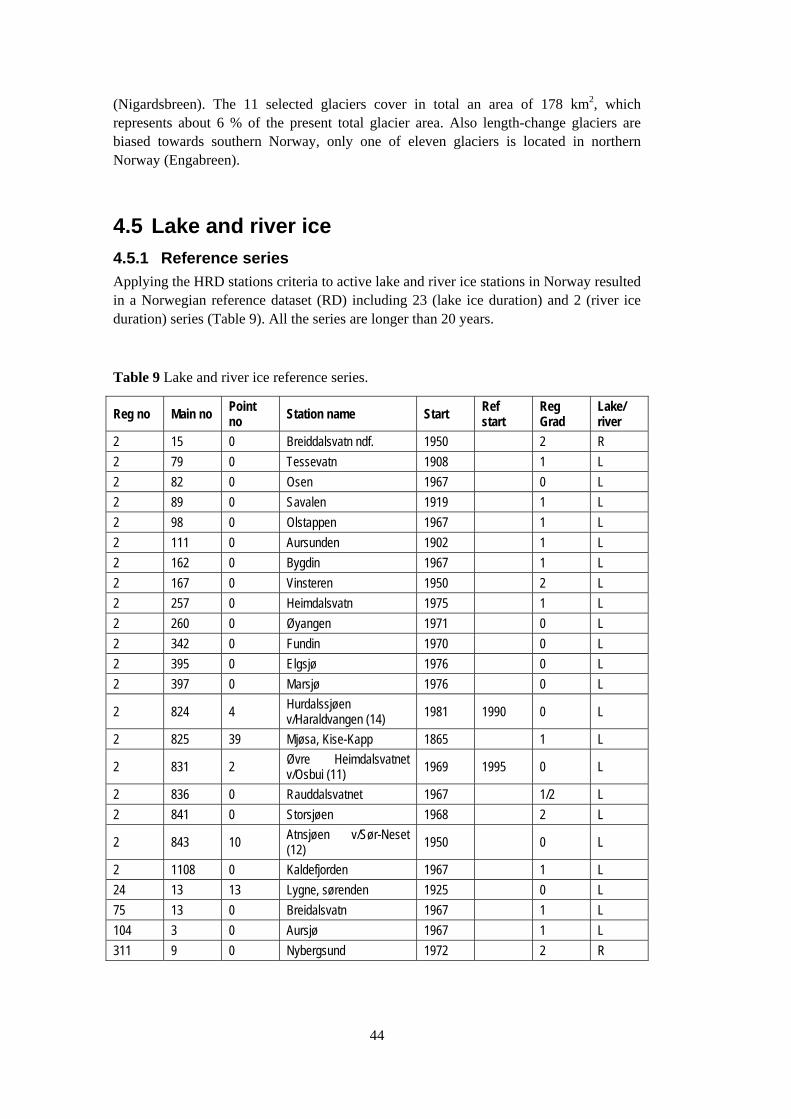
44
(Nigardsbreen). The 11 selected glaciers cover in total an area of 178 km2, which represents about 6 % of the present total glacier area. Also length-change glaciers are biased towards southern Norway, only one of eleven glaciers is located in northern Norway (Engabreen).
4.5 Lake and river ice
4.5.1 Reference series
Applying the HRD stations criteria to active lake and river ice stations in Norway resulted in a Norwegian reference dataset (RD) including 23 (lake ice duration) and 2 (river ice duration) series (Table 9). All the series are longer than 20 years.
Table 9 Lake and river ice reference series.
Reg no Main no Point no
Station name Start Ref start
Reg Grad
Lake/ river
2 15 0 Breiddalsvatn ndf. 1950
2 R
2 79 0 Tessevatn 1908 1 L
2 82 0 Osen 1967
0 L
2 89 0 Savalen 1919
1 L
2 98 0 Olstappen 1967 1 L
2 111 0 Aursunden 1902
1 L
2 162 0 Bygdin 1967
1 L
2 167 0 Vinsteren 1950 2 L
2 257 0 Heimdalsvatn 1975
1 L
2 260 0 Øyangen 1971
0 L
2 342 0 Fundin 1970 0 L
2 395 0 Elgsjø 1976
0 L
2 397 0 Marsjø 1976
0 L
2 824 4 Hurdalssjøen v/Haraldvangen (14) 1981 1990 0 L
2 825 39 Mjøsa, Kise-Kapp 1865
1 L
2 831 2 Øvre Heimdalsvatnet v/Osbui (11)
1969 1995 0 L
2 836 0 Rauddalsvatnet 1967
1/2 L
2 841 0 Storsjøen 1968
2 L
2 843 10 Atnsjøen v/Sør-Neset (12) 1950 0 L
2 1108 0 Kaldefjorden 1967
1 L
24 13 13 Lygne, sørenden 1925
0 L
75 13 0 Breidalsvatn 1967 1 L
104 3 0 Aursjø 1967
1 L
311 9 0 Nybergsund 1972
2 R
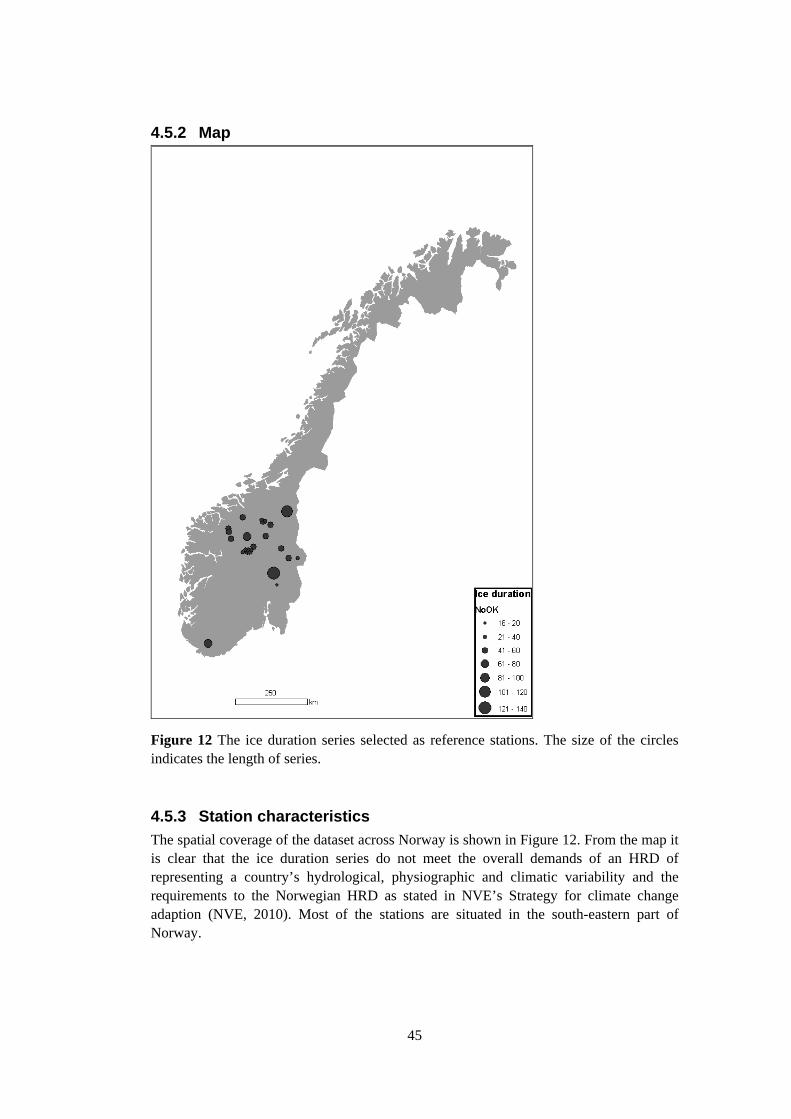
45
4.5.2 Map
Figure 12 The ice duration series selected as reference stations. The size of the circles indicates the length of series.
4.5.3 Station characteristics
The spatial coverage of the dataset across Norway is shown in Figure 12. From the map it is clear that the ice duration series do not meet the overall demands of an HRD of representing a country’s hydrological, physiographic and climatic variability and the requirements to the Norwegian HRD as stated in NVE’s Strategy for climate change adaption (NVE, 2010). Most of the stations are situated in the south-eastern part of Norway.
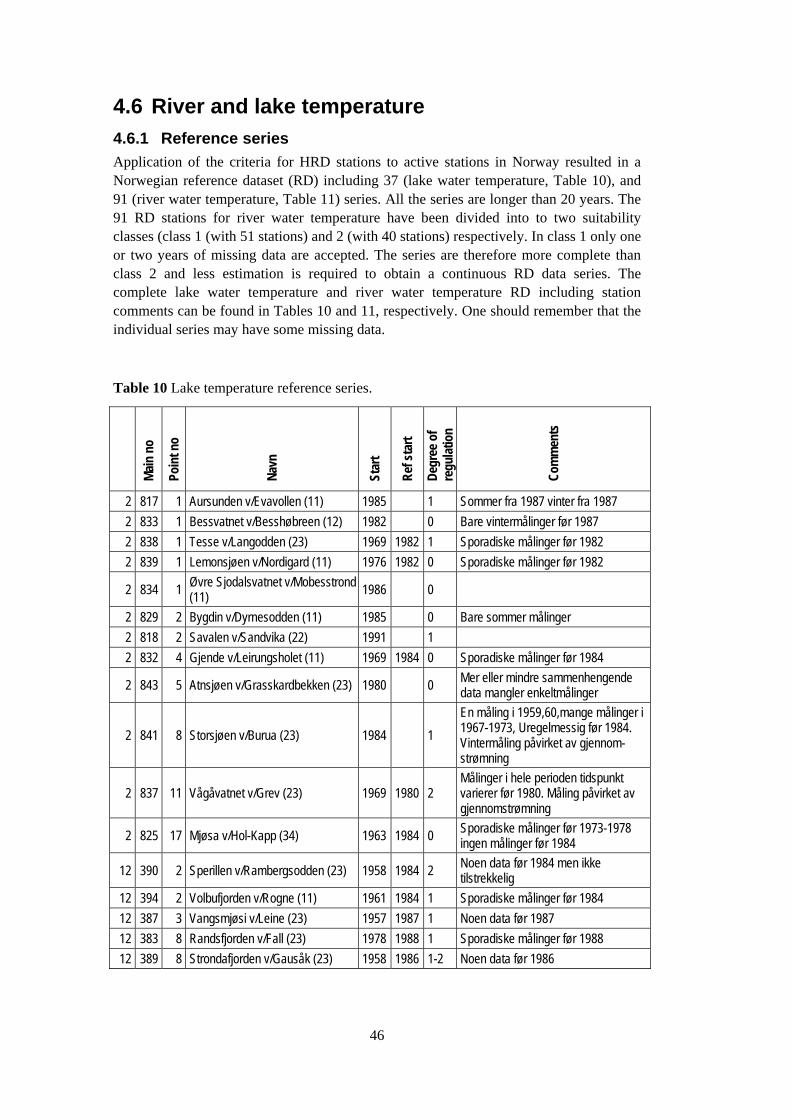
46
4.6 River and lake temperature
4.6.1 Reference series
Application of the criteria for HRD stations to active stations in Norway resulted in a Norwegian reference dataset (RD) including 37 (lake water temperature, Table 10), and 91 (river water temperature, Table 11) series. All the series are longer than 20 years. The 91 RD stations for river water temperature have been divided into to two suitability classes (class 1 (with 51 stations) and 2 (with 40 stations) respectively. In class 1 only one or two years of missing data are accepted. The series are therefore more complete than class 2 and less estimation is required to obtain a continuous RD data series. The complete lake water temperature and river water temperature RD including station comments can be found in Tables 10 and 11, respectively. One should remember that the individual series may have some missing data.
Table 10 Lake temperature reference series.
Mai
n no
Poin
t no
Nav
n
Star
t
Ref
sta
rt
Deg
ree
of
regu
latio
n
Com
men
ts
2 817 1 Aursunden v/Evavollen (11) 1985
1 Sommer fra 1987 vinter fra 1987
2 833 1 Bessvatnet v/Besshøbreen (12) 1982 0 Bare vintermålinger før 1987
2 838 1 Tesse v/Langodden (23) 1969 1982 1 Sporadiske målinger før 1982
2 839 1 Lemonsjøen v/Nordigard (11) 1976 1982 0 Sporadiske målinger før 1982
2 834 1 Øvre Sjodalsvatnet v/Mobesstrond (11) 1986 0
2 829 2 Bygdin v/Dyrnesodden (11) 1985
0 Bare sommer målinger
2 818 2 Savalen v/Sandvika (22) 1991
1
2 832 4 Gjende v/Leirungsholet (11) 1969 1984 0 Sporadiske målinger før 1984
2 843 5 Atnsjøen v/Grasskardbekken (23) 1980
0 Mer eller mindre sammenhengende data mangler enkeltmålinger
2 841 8 Storsjøen v/Burua (23) 1984
1
En måling i 1959,60,mange målinger i 1967-1973, Uregelmessig før 1984. Vintermåling påvirket av gjennom-strømning
2 837 11 Vågåvatnet v/Grev (23) 1969 1980 2 Målinger i hele perioden tidspunkt varierer før 1980. Måling påvirket av gjennomstrømning
2 825 17 Mjøsa v/Hol-Kapp (34) 1963 1984 0 Sporadiske målinger før 1973-1978 ingen målinger før 1984
12 390 2 Sperillen v/Rambergsodden (23) 1958 1984 2 Noen data før 1984 men ikke tilstrekkelig
12 394 2 Volbufjorden v/Rogne (11) 1961 1984 1 Sporadiske målinger før 1984
12 387 3 Vangsmjøsi v/Leine (23) 1957 1987 1 Noen data før 1987
12 383 8 Randsfjorden v/Fall (23) 1978 1988 1 Sporadiske målinger før 1988
12 389 8 Strondafjorden v/Gausåk (23) 1958 1986 1-2 Noen data før 1986
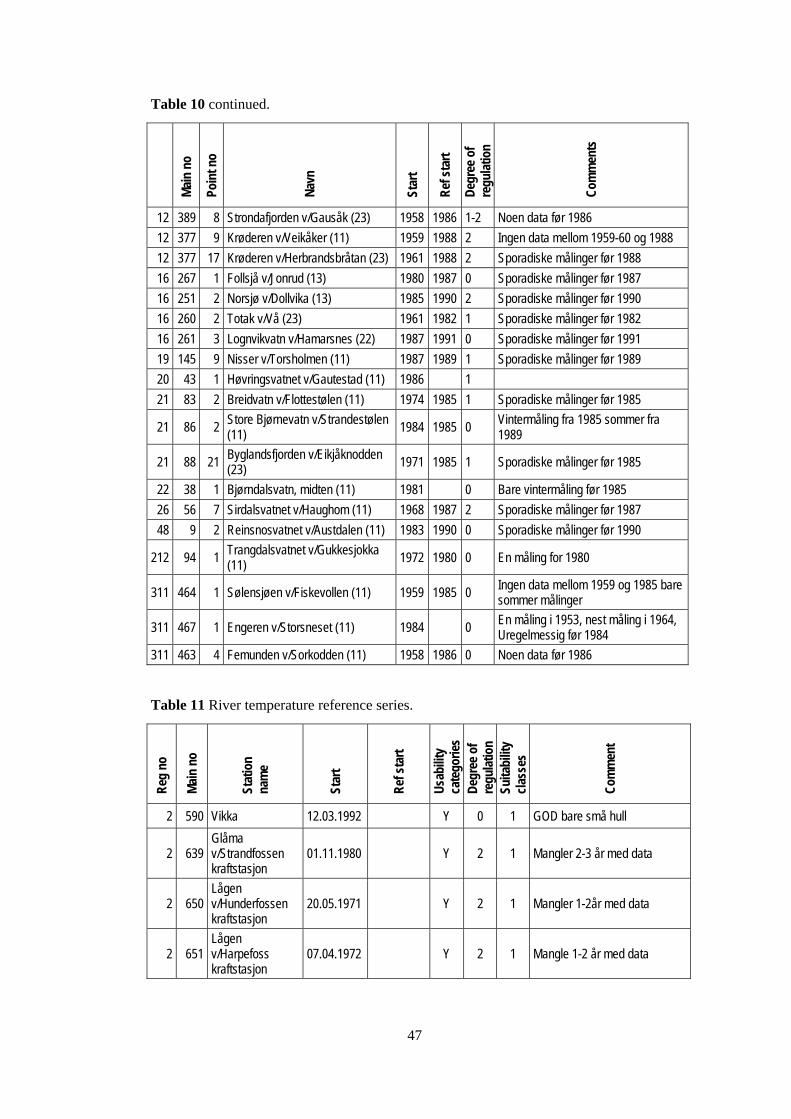
47
Table 10 continued.
Mai
n no
Poin
t no
Nav
n
Star
t
Ref
sta
rt
Deg
ree
of
regu
latio
n
Com
men
ts
12 389 8 Strondafjorden v/Gausåk (23) 1958 1986 1-2 Noen data før 1986
12 377 9 Krøderen v/Veikåker (11) 1959 1988 2 Ingen data mellom 1959-60 og 1988
12 377 17 Krøderen v/Herbrandsbråtan (23) 1961 1988 2 Sporadiske målinger før 1988
16 267 1 Follsjå v/Jonrud (13) 1980 1987 0 Sporadiske målinger før 1987
16 251 2 Norsjø v/Dollvika (13) 1985 1990 2 Sporadiske målinger før 1990
16 260 2 Totak v/Vå (23) 1961 1982 1 Sporadiske målinger før 1982
16 261 3 Lognvikvatn v/Hamarsnes (22) 1987 1991 0 Sporadiske målinger før 1991
19 145 9 Nisser v/Torsholmen (11) 1987 1989 1 Sporadiske målinger før 1989
20 43 1 Høvringsvatnet v/Gautestad (11) 1986
1
21 83 2 Breidvatn v/Flottestølen (11) 1974 1985 1 Sporadiske målinger før 1985
21 86 2 Store Bjørnevatn v/Strandestølen (11)
1984 1985 0 Vintermåling fra 1985 sommer fra 1989
21 88 21 Byglandsfjorden v/Eikjåknodden (23) 1971 1985 1 Sporadiske målinger før 1985
22 38 1 Bjørndalsvatn, midten (11) 1981
0 Bare vintermåling før 1985
26 56 7 Sirdalsvatnet v/Haughom (11) 1968 1987 2 Sporadiske målinger før 1987
48 9 2 Reinsnosvatnet v/Austdalen (11) 1983 1990 0 Sporadiske målinger før 1990
212 94 1 Trangdalsvatnet v/Gukkesjokka (11)
1972 1980 0 En måling for 1980
311 464 1 Sølensjøen v/Fiskevollen (11) 1959 1985 0 Ingen data mellom 1959 og 1985 bare sommer målinger
311 467 1 Engeren v/Storsneset (11) 1984
0 En måling i 1953, nest måling i 1964, Uregelmessig før 1984
311 463 4 Femunden v/Sorkodden (11) 1958 1986 0 Noen data før 1986
Table 11 River temperature reference series.
Reg
no
Mai
n no
Stat
ion
nam
e
Star
t
Ref
sta
rt
Usa
bilit
y ca
tego
ries
Deg
ree
of
regu
latio
n Su
itabi
lity
clas
ses
Com
men
t
2 590 Vikka 12.03.1992
Y 0 1 GOD bare små hull
2 639 Glåma v/Strandfossen kraftstasjon
01.11.1980
Y 2 1 Mangler 2-3 år med data
2 650 Lågen v/Hunderfossen kraftstasjon
20.05.1971 Y 2 1 Mangler 1-2år med data
2 651 Lågen v/Harpefoss kraftstasjon
07.04.1972 Y 2 1 Mangle 1-2 år med data
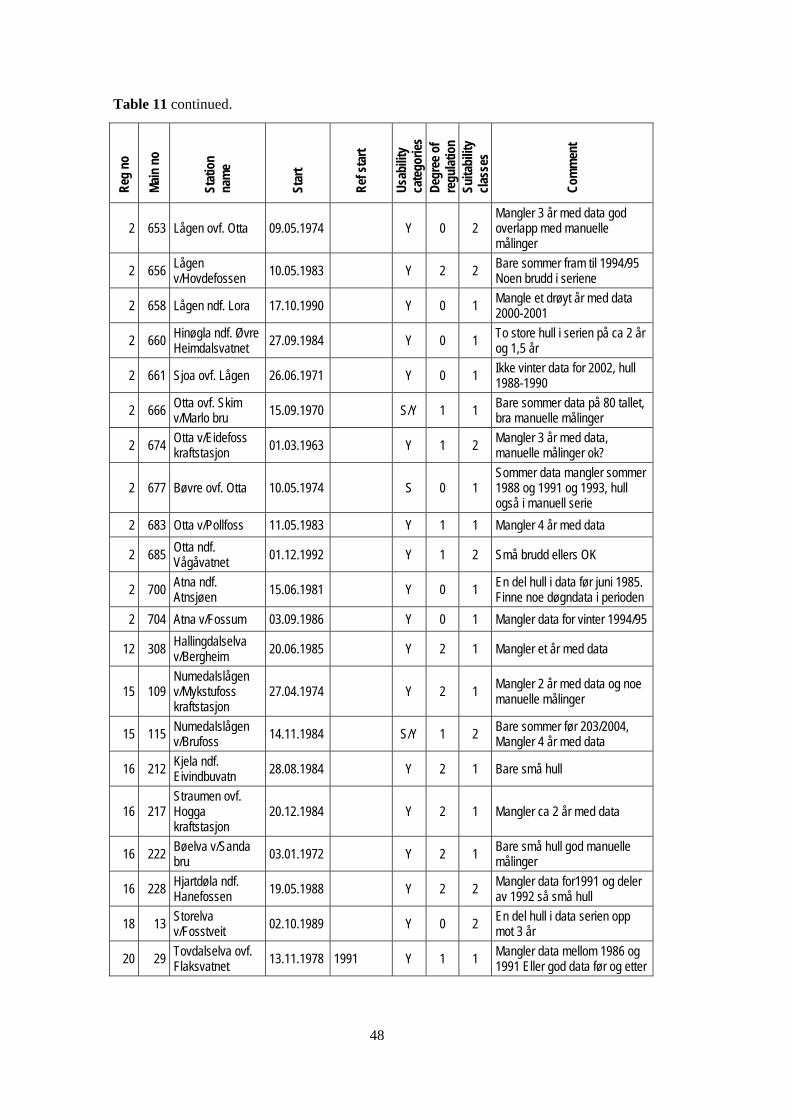
48
Table 11 continued. R
eg n
o
Mai
n no
Stat
ion
nam
e
Star
t
Ref
sta
rt
Usa
bilit
y ca
tego
ries
Deg
ree
of
regu
latio
n Su
itabi
lity
clas
ses
Com
men
t
2 653 Lågen ovf. Otta 09.05.1974
Y 0 2 Mangler 3 år med data god overlapp med manuelle målinger
2 656 Lågen v/Hovdefossen
10.05.1983
Y 2 2 Bare sommer fram til 1994/95 Noen brudd i seriene
2 658 Lågen ndf. Lora 17.10.1990 Y 0 1 Mangle et drøyt år med data 2000-2001
2 660 Hinøgla ndf. Øvre Heimdalsvatnet
27.09.1984
Y 0 1 To store hull i serien på ca 2 år og 1,5 år
2 661 Sjoa ovf. Lågen 26.06.1971 Y 0 1 Ikke vinter data for 2002, hull 1988-1990
2 666 Otta ovf. Skim v/Marlo bru
15.09.1970
S/Y 1 1 Bare sommer data på 80 tallet, bra manuelle målinger
2 674 Otta v/Eidefoss kraftstasjon 01.03.1963 Y 1 2
Mangler 3 år med data, manuelle målinger ok?
2 677 Bøvre ovf. Otta 10.05.1974 S 0 1 Sommer data mangler sommer 1988 og 1991 og 1993, hull også i manuell serie
2 683 Otta v/Pollfoss 11.05.1983 Y 1 1 Mangler 4 år med data
2 685 Otta ndf. Vågåvatnet
01.12.1992
Y 1 2 Små brudd ellers OK
2 700 Atna ndf. Atnsjøen
15.06.1981
Y 0 1 En del hull i data før juni 1985. Finne noe døgndata i perioden
2 704 Atna v/Fossum 03.09.1986 Y 0 1 Mangler data for vinter 1994/95
12 308 Hallingdalselva v/Bergheim
20.06.1985
Y 2 1 Mangler et år med data
15 109 Numedalslågen v/Mykstufoss kraftstasjon
27.04.1974
Y 2 1 Mangler 2 år med data og noe manuelle målinger
15 115 Numedalslågen v/Brufoss
14.11.1984
S/Y 1 2 Bare sommer før 203/2004, Mangler 4 år med data
16 212 Kjela ndf. Eivindbuvatn 28.08.1984 Y 2 1 Bare små hull
16 217 Straumen ovf. Hogga kraftstasjon
20.12.1984 Y 2 1 Mangler ca 2 år med data
16 222 Bøelva v/Sanda bru 03.01.1972 Y 2 1
Bare små hull god manuelle målinger
16 228 Hjartdøla ndf. Hanefossen
19.05.1988
Y 2 2 Mangler data for1991 og deler av 1992 så små hull
18 13 Storelva v/Fosstveit 02.10.1989 Y 0 2
En del hull i data serien opp mot 3 år
20 29 Tovdalselva ovf. Flaksvatnet
13.11.1978 1991 Y 1 1 Mangler data mellom 1986 og 1991 Eller god data før og etter
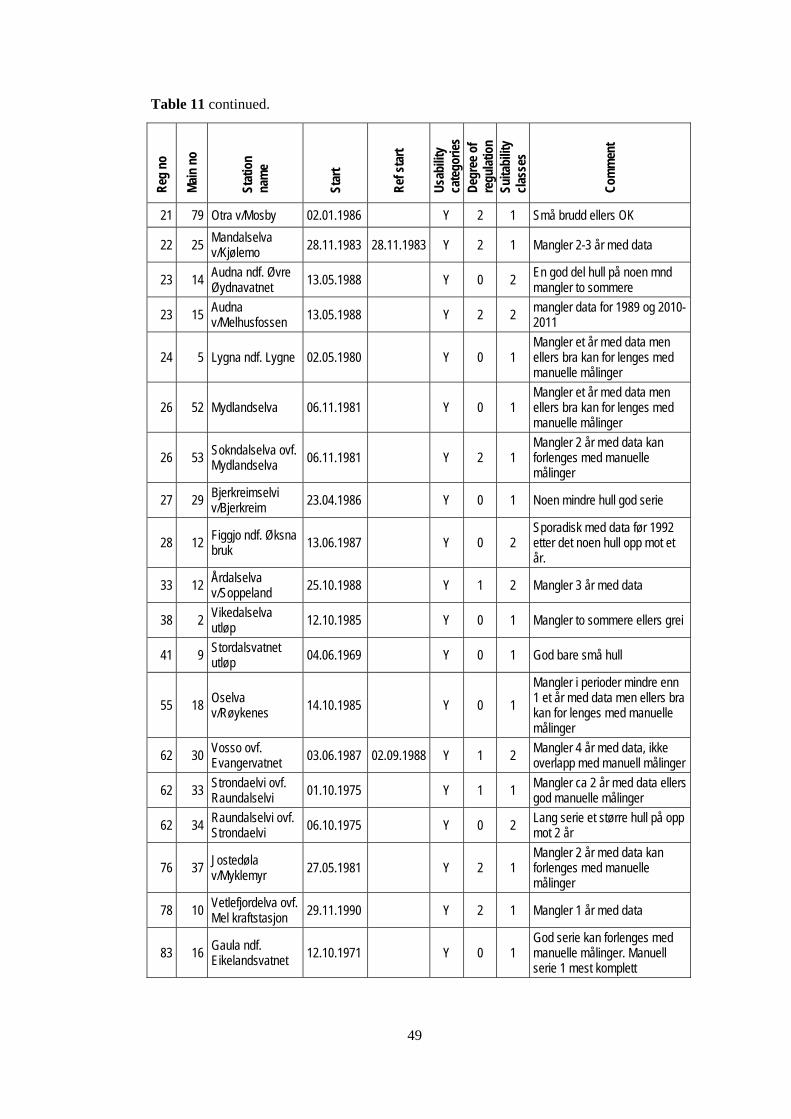
49
Table 11 continued.
Reg
no
Mai
n no
Stat
ion
nam
e
Star
t
Ref
sta
rt
Usa
bilit
y ca
tego
ries
Deg
ree
of
regu
latio
n Su
itabi
lity
clas
ses
Com
men
t
21 79 Otra v/Mosby 02.01.1986
Y 2 1 Små brudd ellers OK
22 25 Mandalselva v/Kjølemo 28.11.1983 28.11.1983 Y 2 1 Mangler 2-3 år med data
23 14 Audna ndf. Øvre Øydnavatnet
13.05.1988
Y 0 2 En god del hull på noen mnd mangler to sommere
23 15 Audna v/Melhusfossen 13.05.1988 Y 2 2
mangler data for 1989 og 2010-2011
24 5 Lygna ndf. Lygne 02.05.1980 Y 0 1 Mangler et år med data men ellers bra kan for lenges med manuelle målinger
26 52 Mydlandselva 06.11.1981
Y 0 1 Mangler et år med data men ellers bra kan for lenges med manuelle målinger
26 53 Sokndalselva ovf. Mydlandselva
06.11.1981
Y 2 1 Mangler 2 år med data kan forlenges med manuelle målinger
27 29 Bjerkreimselvi v/Bjerkreim
23.04.1986
Y 0 1 Noen mindre hull god serie
28 12 Figgjo ndf. Øksna bruk
13.06.1987
Y 0 2 Sporadisk med data før 1992 etter det noen hull opp mot et år.
33 12 Årdalselva v/Soppeland
25.10.1988
Y 1 2 Mangler 3 år med data
38 2 Vikedalselva utløp
12.10.1985
Y 0 1 Mangler to sommere ellers grei
41 9 Stordalsvatnet utløp
04.06.1969
Y 0 1 God bare små hull
55 18 Oselva v/Røykenes
14.10.1985
Y 0 1
Mangler i perioder mindre enn 1 et år med data men ellers bra kan for lenges med manuelle målinger
62 30 Vosso ovf. Evangervatnet 03.06.1987 02.09.1988 Y 1 2
Mangler 4 år med data, ikke overlapp med manuell målinger
62 33 Strondaelvi ovf. Raundalselvi
01.10.1975
Y 1 1 Mangler ca 2 år med data ellers god manuelle målinger
62 34 Raundalselvi ovf. Strondaelvi 06.10.1975 Y 0 2
Lang serie et større hull på opp mot 2 år
76 37 Jostedøla v/Myklemyr
27.05.1981
Y 2 1 Mangler 2 år med data kan forlenges med manuelle målinger
78 10 Vetlefjordelva ovf. Mel kraftstasjon
29.11.1990
Y 2 1 Mangler 1 år med data
83 16 Gaula ndf. Eikelandsvatnet
12.10.1971
Y 0 1 God serie kan forlenges med manuelle målinger. Manuell serie 1 mest komplett
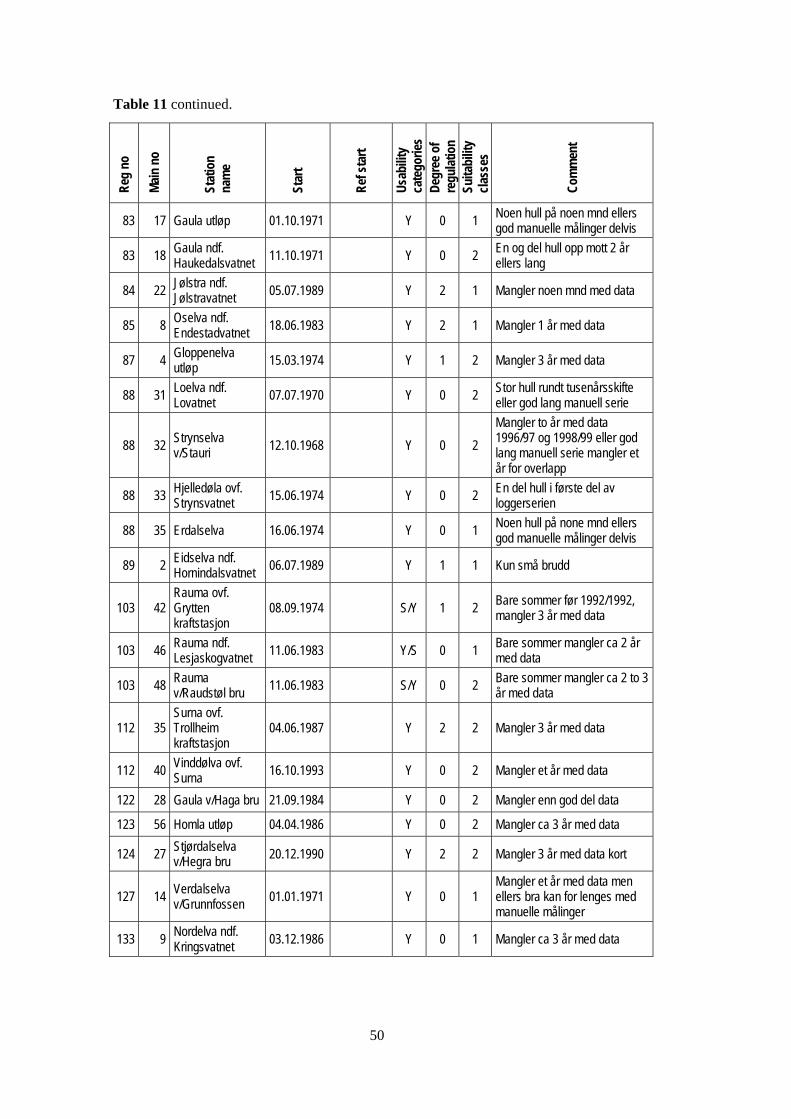
50
Table 11 continued. R
eg n
o
Mai
n no
Stat
ion
nam
e
Star
t
Ref
sta
rt
Usa
bilit
y ca
tego
ries
Deg
ree
of
regu
latio
n Su
itabi
lity
clas
ses
Com
men
t
83 17 Gaula utløp 01.10.1971 Y 0 1 Noen hull på noen mnd ellers god manuelle målinger delvis
83 18 Gaula ndf. Haukedalsvatnet
11.10.1971
Y 0 2 En og del hull opp mott 2 år ellers lang
84 22 Jølstra ndf. Jølstravatnet 05.07.1989 Y 2 1 Mangler noen mnd med data
85 8 Oselva ndf. Endestadvatnet
18.06.1983
Y 2 1 Mangler 1 år med data
87 4 Gloppenelva utløp 15.03.1974 Y 1 2 Mangler 3 år med data
88 31 Loelva ndf. Lovatnet
07.07.1970
Y 0 2 Stor hull rundt tusenårsskifte eller god lang manuell serie
88 32 Strynselva v/Stauri 12.10.1968 Y 0 2
Mangler to år med data 1996/97 og 1998/99 eller god lang manuell serie mangler et år for overlapp
88 33 Hjelledøla ovf. Strynsvatnet
15.06.1974
Y 0 2 En del hull i første del av loggerserien
88 35 Erdalselva 16.06.1974
Y 0 1 Noen hull på none mnd ellers god manuelle målinger delvis
89 2 Eidselva ndf. Hornindalsvatnet
06.07.1989
Y 1 1 Kun små brudd
103 42 Rauma ovf. Grytten kraftstasjon
08.09.1974 S/Y 1 2 Bare sommer før 1992/1992, mangler 3 år med data
103 46 Rauma ndf. Lesjaskogvatnet 11.06.1983 Y/S 0 1
Bare sommer mangler ca 2 år med data
103 48 Rauma v/Raudstøl bru
11.06.1983
S/Y 0 2 Bare sommer mangler ca 2 to 3 år med data
112 35 Surna ovf. Trollheim kraftstasjon
04.06.1987
Y 2 2 Mangler 3 år med data
112 40 Vinddølva ovf. Surna
16.10.1993
Y 0 2 Mangler et år med data
122 28 Gaula v/Haga bru 21.09.1984 Y 0 2 Mangler enn god del data
123 56 Homla utløp 04.04.1986 Y 0 2 Mangler ca 3 år med data
124 27 Stjørdalselva v/Hegra bru 20.12.1990 Y 2 2 Mangler 3 år med data kort
127 14 Verdalselva v/Grunnfossen
01.01.1971
Y 0 1 Mangler et år med data men ellers bra kan for lenges med manuelle målinger
133 9 Nordelva ndf. Kringsvatnet
03.12.1986
Y 0 1 Mangler ca 3 år med data
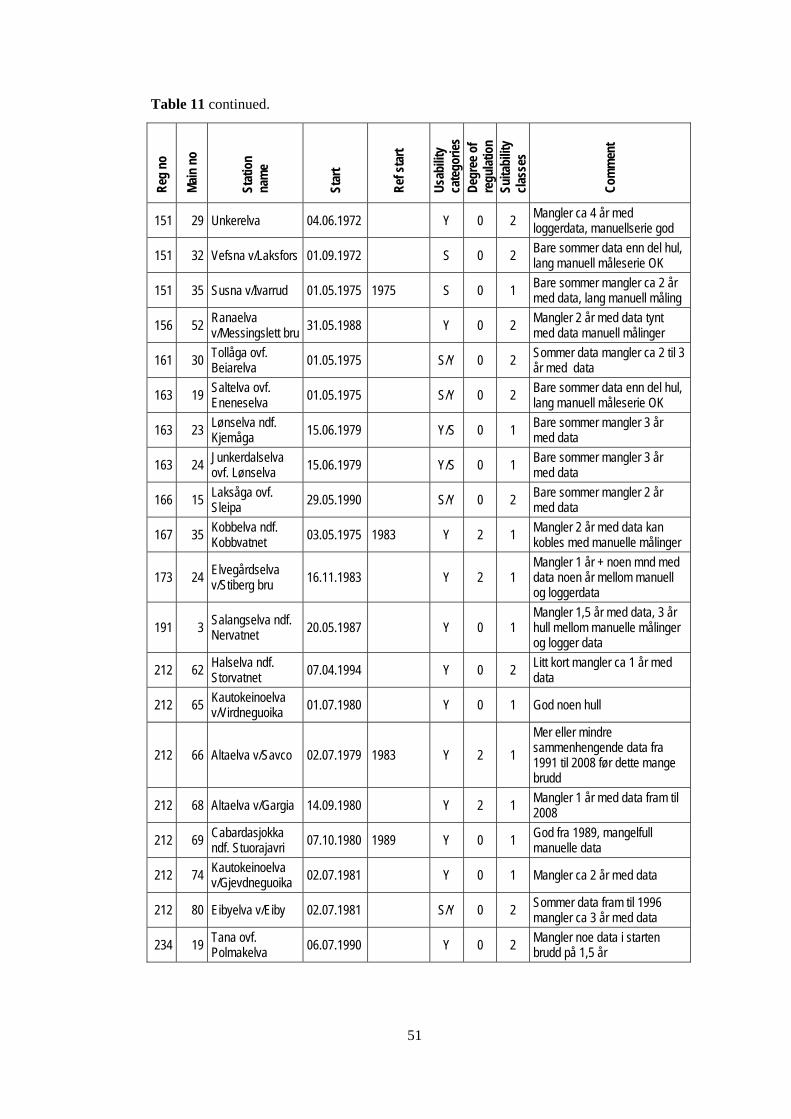
51
Table 11 continued.
Reg
no
Mai
n no
Stat
ion
nam
e
Star
t
Ref
sta
rt
Usa
bilit
y ca
tego
ries
Deg
ree
of
regu
latio
n Su
itabi
lity
clas
ses
Com
men
t
151 29 Unkerelva 04.06.1972 Y 0 2 Mangler ca 4 år med loggerdata, manuellserie god
151 32 Vefsna v/Laksfors 01.09.1972
S 0 2 Bare sommer data enn del hul, lang manuell måleserie OK
151 35 Susna v/Ivarrud 01.05.1975 1975 S 0 1 Bare sommer mangler ca 2 år med data, lang manuell måling
156 52 Ranaelva v/Messingslett bru
31.05.1988
Y 0 2 Mangler 2 år med data tynt med data manuell målinger
161 30 Tollåga ovf. Beiarelva 01.05.1975 S/Y 0 2
Sommer data mangler ca 2 til 3 år med data
163 19 Saltelva ovf. Eneneselva
01.05.1975
S/Y 0 2 Bare sommer data enn del hul, lang manuell måleserie OK
163 23 Lønselva ndf. Kjemåga 15.06.1979 Y/S 0 1
Bare sommer mangler 3 år med data
163 24 Junkerdalselva ovf. Lønselva
15.06.1979
Y/S 0 1 Bare sommer mangler 3 år med data
166 15 Laksåga ovf. Sleipa
29.05.1990
S/Y 0 2 Bare sommer mangler 2 år med data
167 35 Kobbelva ndf. Kobbvatnet
03.05.1975 1983 Y 2 1 Mangler 2 år med data kan kobles med manuelle målinger
173 24 Elvegårdselva v/Stiberg bru
16.11.1983
Y 2 1 Mangler 1 år + noen mnd med data noen år mellom manuell og loggerdata
191 3 Salangselva ndf. Nervatnet 20.05.1987 Y 0 1
Mangler 1,5 år med data, 3 år hull mellom manuelle målinger og logger data
212 62 Halselva ndf. Storvatnet
07.04.1994
Y 0 2 Litt kort mangler ca 1 år med data
212 65 Kautokeinoelva v/Virdneguoika
01.07.1980
Y 0 1 God noen hull
212 66 Altaelva v/Savco 02.07.1979 1983 Y 2 1
Mer eller mindre sammenhengende data fra 1991 til 2008 før dette mange brudd
212 68 Altaelva v/Gargia 14.09.1980 Y 2 1 Mangler 1 år med data fram til 2008
212 69 Cabardasjokka ndf. Stuorajavri
07.10.1980 1989 Y 0 1 God fra 1989, mangelfull manuelle data
212 74 Kautokeinoelva v/Gjevdneguoika 02.07.1981 Y 0 1 Mangler ca 2 år med data
212 80 Eibyelva v/Eiby 02.07.1981
S/Y 0 2 Sommer data fram til 1996 mangler ca 3 år med data
234 19 Tana ovf. Polmakelva 06.07.1990 Y 0 2
Mangler noe data i starten brudd på 1,5 år
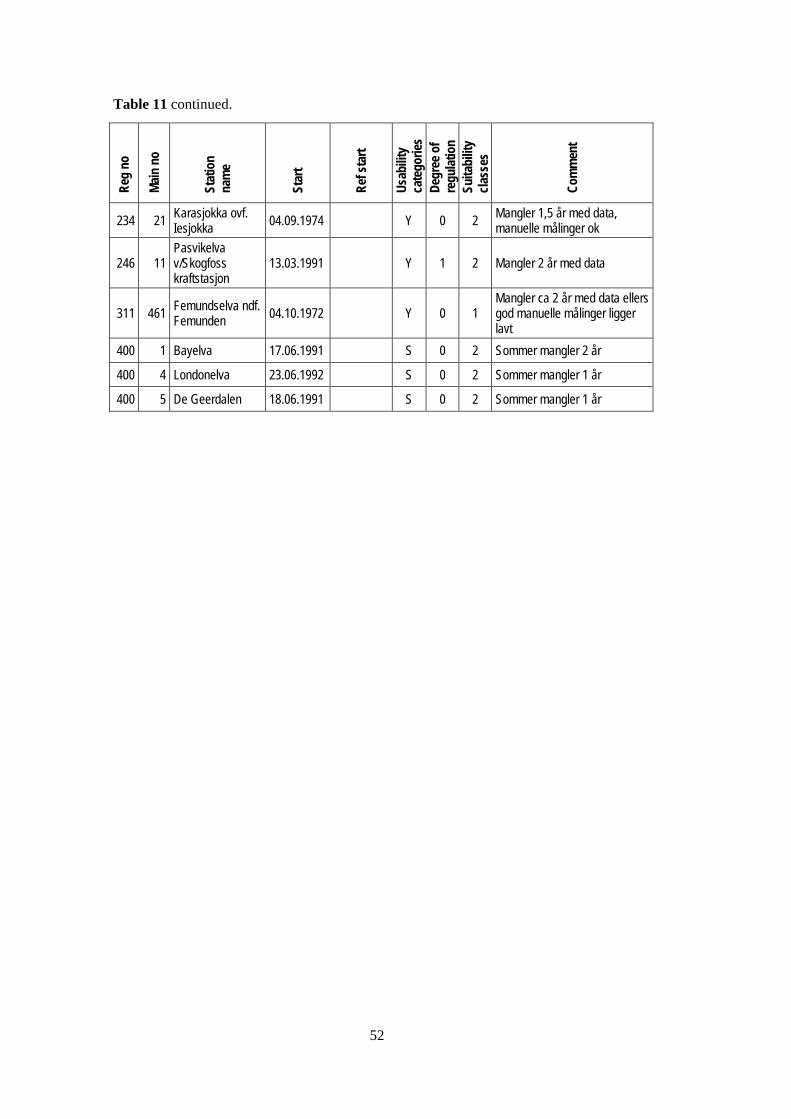
52
Table 11 continued. R
eg n
o
Mai
n no
Stat
ion
nam
e
Star
t
Ref
sta
rt
Usa
bilit
y ca
tego
ries
Deg
ree
of
regu
latio
n Su
itabi
lity
clas
ses
Com
men
t
234 21 Karasjokka ovf. Iesjokka 04.09.1974 Y 0 2
Mangler 1,5 år med data, manuelle målinger ok
246 11 Pasvikelva v/Skogfoss kraftstasjon
13.03.1991 Y 1 2 Mangler 2 år med data
311 461 Femundselva ndf. Femunden
04.10.1972
Y 0 1 Mangler ca 2 år med data ellers god manuelle målinger ligger lavt
400 1 Bayelva 17.06.1991
S 0 2 Sommer mangler 2 år
400 4 Londonelva 23.06.1992
S 0 2 Sommer mangler 1 år
400 5 De Geerdalen 18.06.1991
S 0 2 Sommer mangler 1 år
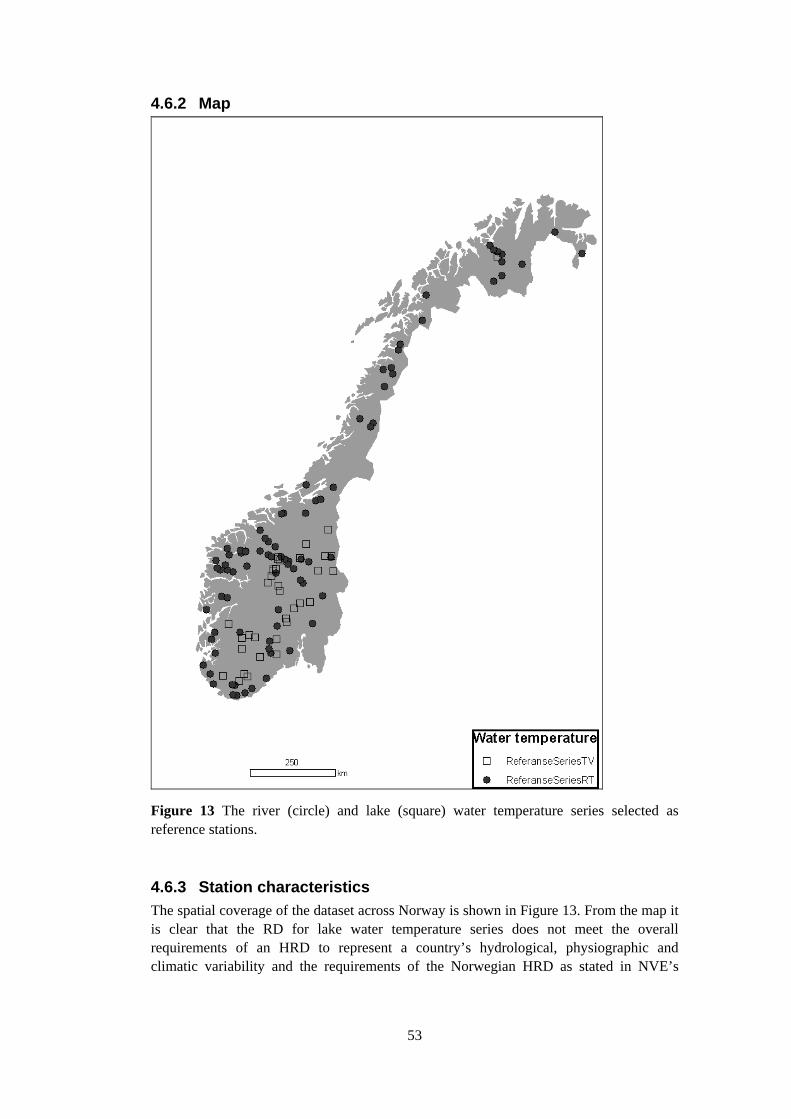
53
4.6.2 Map
Figure 13 The river (circle) and lake (square) water temperature series selected as reference stations.
4.6.3 Station characteristics
The spatial coverage of the dataset across Norway is shown in Figure 13. From the map it is clear that the RD for lake water temperature series does not meet the overall requirements of an HRD to represent a country’s hydrological, physiographic and climatic variability and the requirements of the Norwegian HRD as stated in NVE’s
54
Strategy for climate change adaption (NVE, 2010). Most of the stations are situated in southern Norway.
The RD for river water temperature is less biased covering a larger part of Norway, but there are regions with few data series. It would be beneficial to have more stations in Nord Trøndelag, Troms and along the coast, but no or few, and then only short term, records exist in these regions.
5 Further work The Hydrological Reference dataset for Norway can be used to study climate variability and change. The list of stations is found in this report (Chapter 4 and Appendix 1) and on www.nve.no. The data records can be retrieved from Hydra II or ordered from NVE. There is potential for further improvement of the dataset, since it is important that the quality of the selected series is maintained and the stations continue to meet the requirements of the HRD. Possibilities for improving and requirements for maintaining the HRD are discussed below:
5.1 Improving the streamflow RD Long data series are of special importance in climate change studies due to multi-year and decadal variability, e.g. in large-scale climate patterns such as NAO or ENSO. When currently only part of a series is recommended for use, it would be valuable to improve and extend the series back in time where possible.
There is potential for correcting parts of a record, so that the complete data record meets the HRD requirements. For example, series from catchments with constant water transfer from a fixed area during part of the observation period could be homogenized, and inhomogenities caused by incorrect reference heights or rating curves could be corrected, although these tasks may require substantial work.
There is a need for a better and more systematic approach to the identification and correction of poor quality data. Possible improvements could be made by, for example, using recent software to check the quality of a rating curve for an earlier period. An up-to-date homogeneity assessment of all selected series could also be considered. Regular updates of the metadata according to identification and correction of errors is important.
Information about data quality should be collated in one place, for example, linked to the station and data series comments in the NVE software (Finut, Dagut). Comments currently only available in reports or together with the rating-curve quality assessment should also be included.
Limited data quality comments in a stations metadata could give the impression that data quality is very good, whereas the real reason may be that information is unknown or undocumented. This suggests that including comments about good quality data could also be beneficial.
55
To increase objectivity of the data quality evaluation, criteria need to be established for when specific comments are to be used. A standard list of factors that may influence data quality could be identified, including for example, regulation, profile stability and observations of land use changes in the catchment. Also, the introduction of some “standard formulations”, describing different data issues could be considered. For example, a percentage regulation could be defined for the comment “little regulation”. More easily available and understandable metadata would facilitate choosing appropriate series for a particular study and possibly improve the quality of a study.
5.2 Improving the soil moisture RD Site calibration of soil water measured by the PR2 Profile Probe is the first step necessary for further improvement of the data-series. Site calibration requires the direct measurement of soil water content (gravimetric method) on at least two separate occasions, one dry and one wet. This is therefore a labor-intensive and costly task. Further evaluation of the existing data-series, including model simulations, could also aid selection of the most representative sites. In addition, the soil moisture dataset would profit considerably from pumping well tests as described for the groundwater RD (Section 5.3).
5.3 Improving the groundwater RD Automatically recorded groundwater levels are validated against manual measurements of the groundwater level up to 12 times a year. However, for most stations manual measurements are only performed once or twice a year. As a minimum, performing quarterly manual measurements for all stations would enable deviations to be detected more quickly and therefore considerably increase data quality. Routines for regularly removing mud in the groundwater pipe should also be established.
Pumping well tests can provide a better description and understanding of hydrogeological characteristics and offer the possibility of detecting and correcting deviations. The test provides information about effective porosity and hydraulic conductivity which can be used to check measurement levels against model simulations of groundwater level and soil moisture content, thereby also improving the soil moisture dataset.
5.4 Improving the snow RD The HPC-data have undergone a preliminary quality control (see unpublished note by Tuomo Saloranta, 2012), but a final quality control is planned for spring 2013. This final quality control will be better documented, include some previously hidden data, and will result in the uploading of the final data set onto the HYDRA II data base (HYKVAL archive).
The two main challenges concerning the future of HRD stations for SWE (HPC-data) are:
56
to ensure measurements taken by hydropower companies are continued on an annual basis. This could be achieved either by: (i) encouraging the hydropower companies to continue taking measurements as is required in their hydropower concessions, and following-up to check this is undertaken; or, (ii) NVE taking over measurement. In either case, it is preferable to continue taking measurements in the same way, using the same method in order to avoid inhomogeneities in the series.
to identify stations in northern Norway, with more than 10-15 years of data, which could be included in the HRD. Presently, no stations from mid- or northern Norway passed the HRD selection criteria.
An unpublished note by Heidi Stranden (NVE) suggests a partly overlapping, alternative set of approximately 10 climate reference stations of HPC-data, where some additional factors (not considered here), such as the location and easy access to the stations, are taken into account. This note also details risks to the continued recording of SWE data. It can thus provide useful information regarding, for example, on which stations to focus measurement efforts in the future.
5.5 Improving the glacier RD Where needed, the mass-balance and length-change reference glacier datasets should be homogenised. The length-change record for Briksdalsbreen has been compared with maps and photos (Kjøllmoen et al., 2006) and has resulted in an updated and homogenised data record.
Information regarding both data quality and homogeneity issues should be well documented and stored in NVE’s Hydra II database.
5.6 Improving the lake and river ice RD Surface based observations have provided much of the information regarding lake and river ice response to climate (Magnuson, et al, 2000; AMAP, 2011). The declining state of our network in recent years has led to serious geographical and temporal gaps in several regions of Norway. Consideration should therefore be given to the reactivation of some of the longest series in order to improve the geographical distribution.
5.7 Improving the river and lake temperature RD It is preferable to have longer records of river and lake temperature. It should therefore be checked whether existing series could be further improved in order to decrease the amount of missing data. One possibility is to install extra loggers to duplicate measurements.
57
5.8 Maintaining the Hydrological Reference Dataset To maintain the Hydrological Reference Dataset, the data series need to be regularly updated and new data must meet the HRD criteria. Adequate metadata need to be continuously collected and stored, with routines and standards for regular updates of the HRD set up. For instance, catchment alterations may require that the station needs to be deleted from the HRD.
Whitfield et al. (2012) suggest reference datasets are reviewed annually, to keep the data, data quality and metadata up to date, with a more general review performed on a decadal basis. In the more general review, major changes (such as basin development) should be investigated and the effectiveness of the dataset assessed. It has to be decided whether a general HRD update every ten years as suggested by Whitfield et al. is sufficient in Norway and for NVE, or whether it should be routinely undertaken on a more frequent basis. In the general review of the HRD, the inclusion of stations which have reached 20 years of data should be considered, and the spatial coverage and the representativeness of the HRD with respect to hydrological and geophysical variability in Norway should be assessed.
In addition to the annual and general updates, identified quality issues should be followed up. For example, analyses involving HRD time series may reveal inhomogeneities or trends, and it should be investigated whether these are natural, artificial or caused by measurement errors. Appropriate action must be taken, e.g. correction of data, update of metadata or even deletion of the series from the HRD. Each time a new rating-curve is established for only part of a series, homogeneity checks of the complete streamflow record should take place.
A good way of storing, disseminating and maintaining the HRD (including the list of stations, data and metadata) needs to be established and followed up by NVE.
Acknowledgements We would like to thank all the field hydrologists at NVE, who helped in obtaining more metadata on the streamflow stations and their history, as well as Lars-Evan Pettersson and Lars Roald at NVE whose extensive knowledge on the regional climate history and different streamflow series helped identifying reason of observed changes.
58
References AMAP (2011) Snow, water, ice and permafrost in the Arctic (SWIPA).Oslo: Arctic
Monitoring and Assessment Programme (AMAP). www.amap.no
Andreassen, L.M., H. Elvehøy, B. Kjøllmoen, R.V. Engeset and N. Haakensen. (2005) Glacier mass balance and length variations in Norway. Annals of Glaciology, 42, 317–325, doi: 10.3189/172756405781812826
Andreassen, L.M., B. Kjøllmoen, A. Rasmussen, K. Melvold and Ø. Nordli. (2012a) Langfjordjøkelen, a rapidly shrinking glacier in northern Norway. Journal of Glaciology, 58 (209), 581–593, DOI: 10.3189/2012JoG11J014
Andreassen, L.M., S.H. Winsvold (eds.), F. Paul and J.E. Hausberg. (2012b) Inventory of Norwegian glaciers. NVE Rapport 38:2012
Astrup, M. (2000) Homogenitetstest av hydrologiske data. (In Norwegian: Homogeneity testing of hydrological data) NVE Rapport 7:2000
Beldring, S., T. Engen-Skaugen, E. Førland, L.A. Roald (2008) Climate change impacts on hydrological processes in Norway based on two methods for transferring regional climate model results to meteorological station sites. Tellus 60A, 439–450, doi: 10.1111/j.1600-0870.2008.00306.x
Braithwaite (2002) Glacier mass balance: the first 50 years of international monitoring. Progress in Physical Geography, 26 (1), 76–95, doi: 10.1191/0309133302pp326ra
Bryn, A. (2008) Recent forest limit changes in south-east Norway: Effects of climate change or regrowth after abandoned utilisation? Norwegian Journal of Geography, 62(4), 251–270, doi: 10.1080/00291950802517551
Dyrrdal, A.V, T. Saloranta, T. Skaugen and H.B. Stranden (2013) Changes in snow depth in Norway during the period 1961-2010. Hydrology Research, 44 (1), 169–179, doi:10.2166/nh.2012.064
Elsberg D.H., W.D. Harrison, K.A. Echelmeyer and R.M. Krimmel (2001) Quantifying the effects of climate and surface change on glacier mass balance. Journal of Glaciology, 47(159), 649–658, doi: 10.3189/172756501781831783
Hanssen-Bauer, I., H. Drange, E.J. Førland, L.A. Roald, K.Y. Børsheim, H. Hisdal, D. Lawrence, A. Nesje, S. Sandven, A. Sorteberg, S. Sundby, K. Vasskog and B. Ådlandsvik (2009) Klima i Norge 2100 (In Norwegain: Climate in Norway in 2100) Bakgrunnsmateriale til NOU Klimatilpassing. Norsk klimasenter, September 2009
Hisdal, H., K. Stahl, L.M. Tallaksen, and S. Demuth (2001) Have droughts in Europe become more severe or frequent? International Journal of Climatology, 21, 317-333, doi: 10.1002:joc.619
Kjøllmoen, B. and H.C. Olsen (2002) Langfjordjøkelen i Vest-Finnmark, Glasiohydologiske undersøkelser, NVE Dokument 4. Kjøllmoen, B. (Ed.), L.M. Andreassen, R.V. Engeset, H. Elvehøy, M. Jackson and R.H. Giesen, (2006) Glaciological investigations in Norway in 2005. NVE Report 2:2006
Kjøllmoen, B. (ed.), L.M. Andreassen, H. Elvehøy, M. Jackson and R.H. Giesen (2011) Glaciological investigations in Norway in 2010. NVE Report 3:1010
Kleivane, I. (2006) Vassføringsstasjonar på Vestlandet. NVE Rapport 17:2006
Lawrence, D. and H. Hisdal (2011) Hydrological projections for floods in Norway under a future climate. NVE Report 2011:5
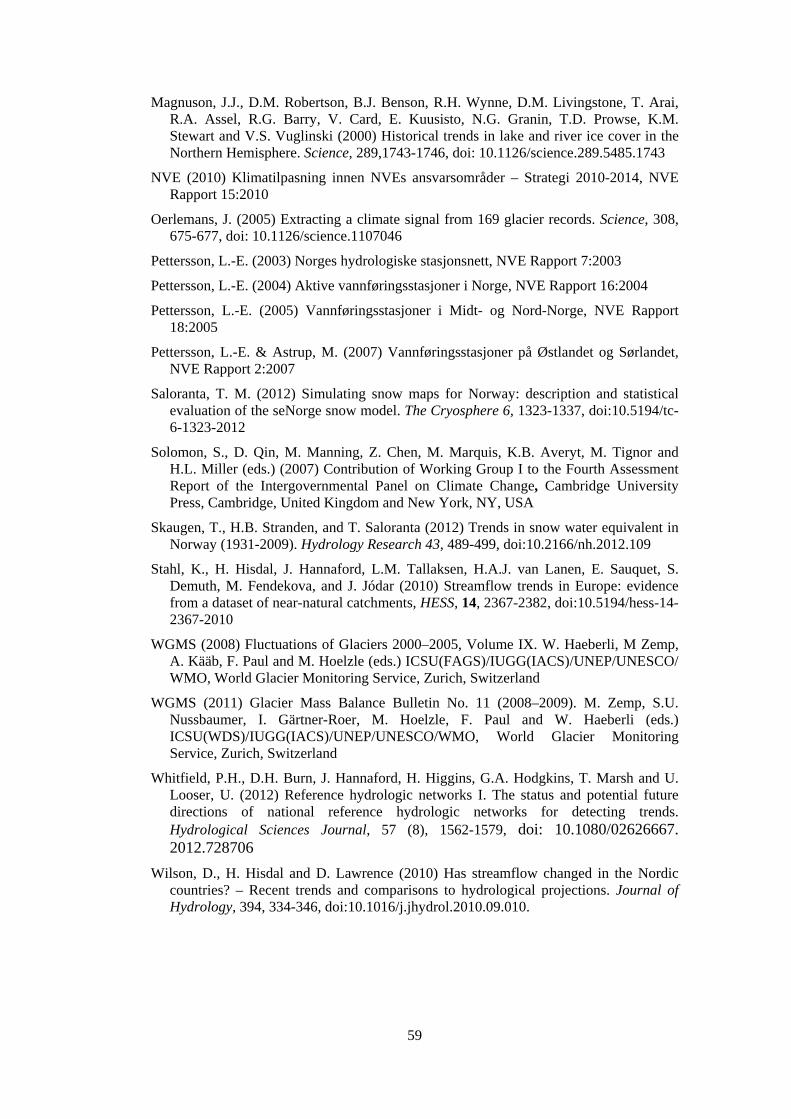
59
Magnuson, J.J., D.M. Robertson, B.J. Benson, R.H. Wynne, D.M. Livingstone, T. Arai, R.A. Assel, R.G. Barry, V. Card, E. Kuusisto, N.G. Granin, T.D. Prowse, K.M. Stewart and V.S. Vuglinski (2000) Historical trends in lake and river ice cover in the Northern Hemisphere. Science, 289,1743-1746, doi: 10.1126/science.289.5485.1743
NVE (2010) Klimatilpasning innen NVEs ansvarsområder – Strategi 2010-2014, NVE Rapport 15:2010
Oerlemans, J. (2005) Extracting a climate signal from 169 glacier records. Science, 308, 675-677, doi: 10.1126/science.1107046
Pettersson, L.-E. (2003) Norges hydrologiske stasjonsnett, NVE Rapport 7:2003
Pettersson, L.-E. (2004) Aktive vannføringsstasjoner i Norge, NVE Rapport 16:2004
Pettersson, L.-E. (2005) Vannføringsstasjoner i Midt- og Nord-Norge, NVE Rapport 18:2005
Pettersson, L.-E. & Astrup, M. (2007) Vannføringsstasjoner på Østlandet og Sørlandet, NVE Rapport 2:2007
Saloranta, T. M. (2012) Simulating snow maps for Norway: description and statistical evaluation of the seNorge snow model. The Cryosphere 6, 1323-1337, doi:10.5194/tc-6-1323-2012
Solomon, S., D. Qin, M. Manning, Z. Chen, M. Marquis, K.B. Averyt, M. Tignor and H.L. Miller (eds.) (2007) Contribution of Working Group I to the Fourth Assessment Report of the Intergovernmental Panel on Climate Change, Cambridge University Press, Cambridge, United Kingdom and New York, NY, USA
Skaugen, T., H.B. Stranden, and T. Saloranta (2012) Trends in snow water equivalent in Norway (1931-2009). Hydrology Research 43, 489-499, doi:10.2166/nh.2012.109
Stahl, K., H. Hisdal, J. Hannaford, L.M. Tallaksen, H.A.J. van Lanen, E. Sauquet, S. Demuth, M. Fendekova, and J. Jódar (2010) Streamflow trends in Europe: evidence from a dataset of near-natural catchments, HESS, 14, 2367-2382, doi:10.5194/hess-14-2367-2010
WGMS (2008) Fluctuations of Glaciers 2000–2005, Volume IX. W. Haeberli, M Zemp, A. Kääb, F. Paul and M. Hoelzle (eds.) ICSU(FAGS)/IUGG(IACS)/UNEP/UNESCO/ WMO, World Glacier Monitoring Service, Zurich, Switzerland
WGMS (2011) Glacier Mass Balance Bulletin No. 11 (2008–2009). M. Zemp, S.U. Nussbaumer, I. Gärtner-Roer, M. Hoelzle, F. Paul and W. Haeberli (eds.) ICSU(WDS)/IUGG(IACS)/UNEP/UNESCO/WMO, World Glacier Monitoring Service, Zurich, Switzerland
Whitfield, P.H., D.H. Burn, J. Hannaford, H. Higgins, G.A. Hodgkins, T. Marsh and U. Looser, U. (2012) Reference hydrologic networks I. The status and potential future directions of national reference hydrologic networks for detecting trends. Hydrological Sciences Journal, 57 (8), 1562-1579, doi: 10.1080/02626667. 2012.728706
Wilson, D., H. Hisdal and D. Lawrence (2010) Has streamflow changed in the Nordic countries? – Recent trends and comparisons to hydrological projections. Journal of Hydrology, 394, 334-346, doi:10.1016/j.jhydrol.2010.09.010.
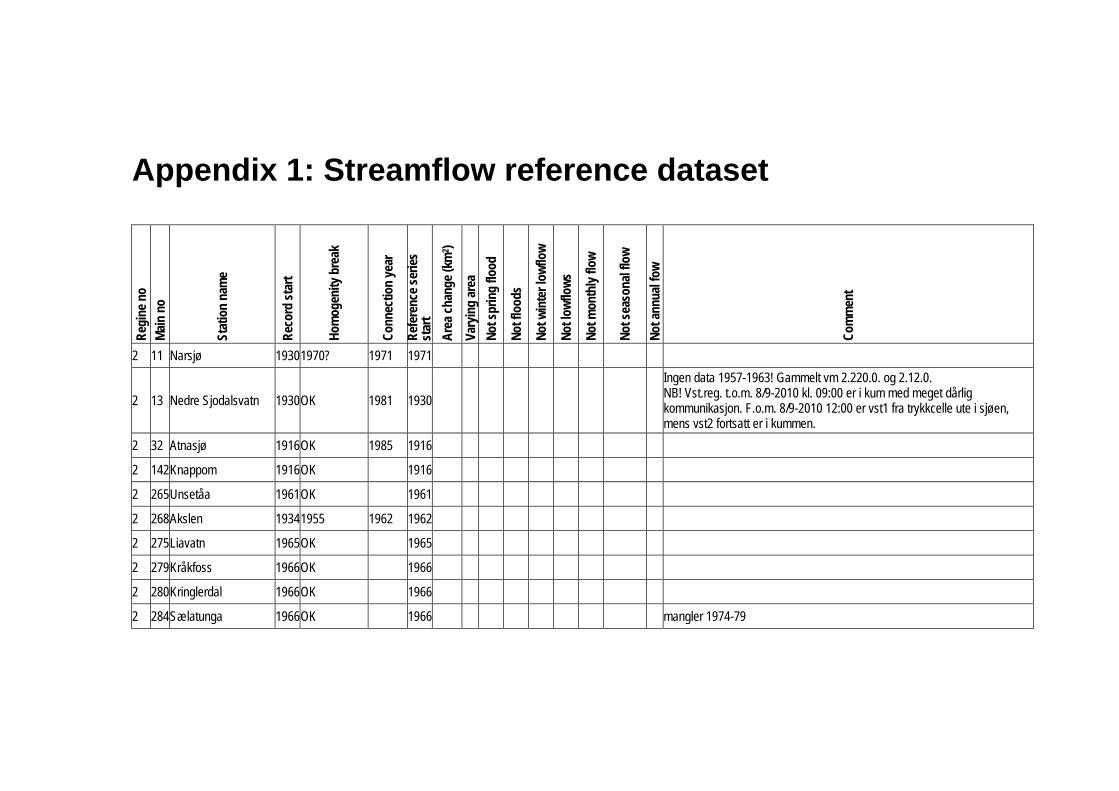
Appendix 1: Streamflow reference dataset
Reg
ine
no
Mai
n no
Stat
ion
nam
e
Rec
ord
star
t
Hom
ogen
ity b
reak
Con
nect
ion
year
Ref
eren
ce s
erie
s st
art
Are
a ch
ange
(km
2 )
Vary
ing
area
Not
spr
ing
flood
Not
floo
ds
Not
win
ter l
owflo
w
Not
low
flow
s
Not
mon
thly
flow
Not
sea
sona
l flo
w
Not
ann
ual f
ow
Com
men
t
2 11 Narsjø 19301970? 1971 1971
2 13 Nedre Sjodalsvatn 1930OK 1981 1930
Ingen data 1957-1963! Gammelt vm 2.220.0. og 2.12.0. NB! Vst.reg. t.o.m. 8/9-2010 kl. 09:00 er i kum med meget dårlig kommunikasjon. F.o.m. 8/9-2010 12:00 er vst1 fra trykkcelle ute i sjøen, mens vst2 fortsatt er i kummen.
2 32 Atnasjø 1916OK 1985 1916
2 142Knappom 1916OK 1916
2 265Unsetåa 1961OK 1961
2 268Akslen 19341955 1962 1962
2 275Liavatn 1965OK 1965
2 279Kråkfoss 1966OK 1966
2 280Kringlerdal 1966OK 1966
2 284Sælatunga 1966OK 1966 mangler 1974-79
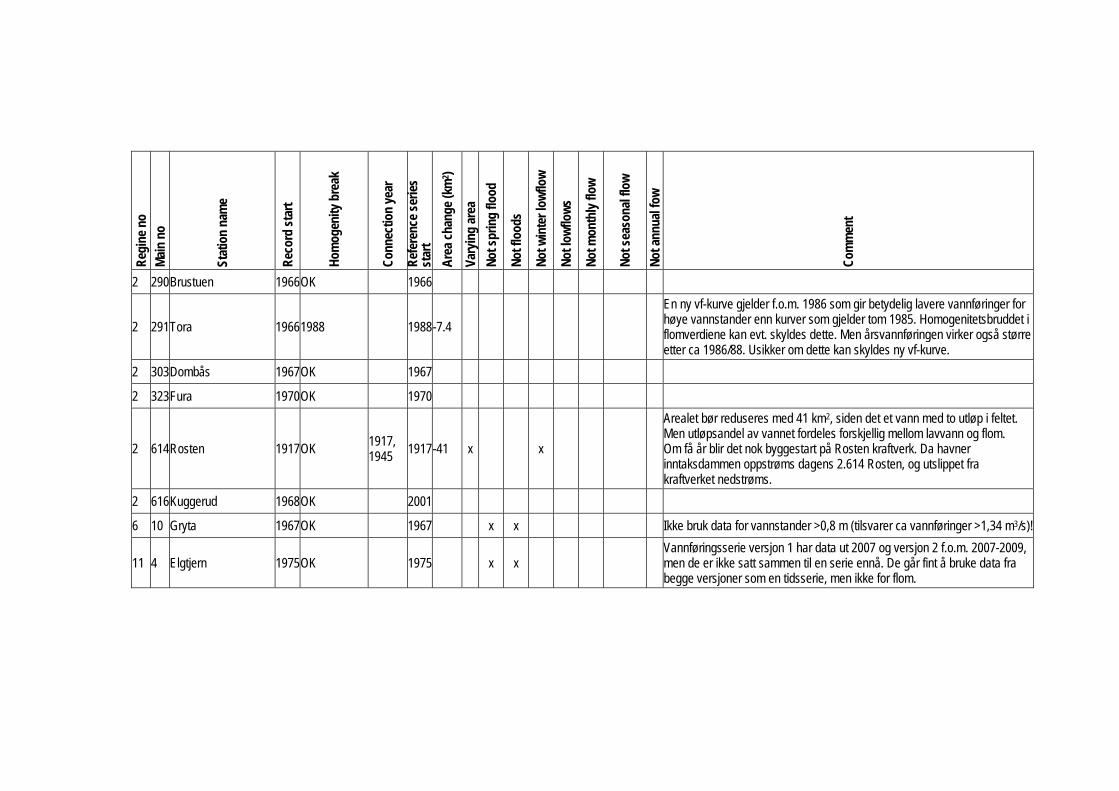
Reg
ine
no
Mai
n no
Stat
ion
nam
e
Rec
ord
star
t
Hom
ogen
ity b
reak
Con
nect
ion
year
Ref
eren
ce s
erie
s st
art
Are
a ch
ange
(km
2 )
Vary
ing
area
Not
spr
ing
flood
Not
floo
ds
Not
win
ter l
owflo
w
Not
low
flow
s
Not
mon
thly
flow
Not
sea
sona
l flo
w
Not
ann
ual f
ow
Com
men
t
2 290Brustuen 1966OK 1966
2 291Tora 19661988 1988-7.4
En ny vf-kurve gjelder f.o.m. 1986 som gir betydelig lavere vannføringer for høye vannstander enn kurver som gjelder tom 1985. Homogenitetsbruddet i flomverdiene kan evt. skyldes dette. Men årsvannføringen virker også større etter ca 1986/88. Usikker om dette kan skyldes ny vf-kurve.
2 303Dombås 1967OK 1967
2 323Fura 1970OK 1970
2 614Rosten 1917OK 1917, 1945
1917-41 x
x
Arealet bør reduseres med 41 km2, siden det et vann med to utløp i feltet. Men utløpsandel av vannet fordeles forskjellig mellom lavvann og flom. Om få år blir det nok byggestart på Rosten kraftverk. Da havner inntaksdammen oppstrøms dagens 2.614 Rosten, og utslippet fra kraftverket nedstrøms.
2 616Kuggerud 1968OK 2001
6 10 Gryta 1967OK 1967
x x
Ikke bruk data for vannstander >0,8 m (tilsvarer ca vannføringer >1,34 m3/s)!
11 4 Elgtjern 1975OK 1975 x x Vannføringsserie versjon 1 har data ut 2007 og versjon 2 f.o.m. 2007-2009, men de er ikke satt sammen til en serie ennå. De går fint å bruke data fra begge versjoner som en tidsserie, men ikke for flom.
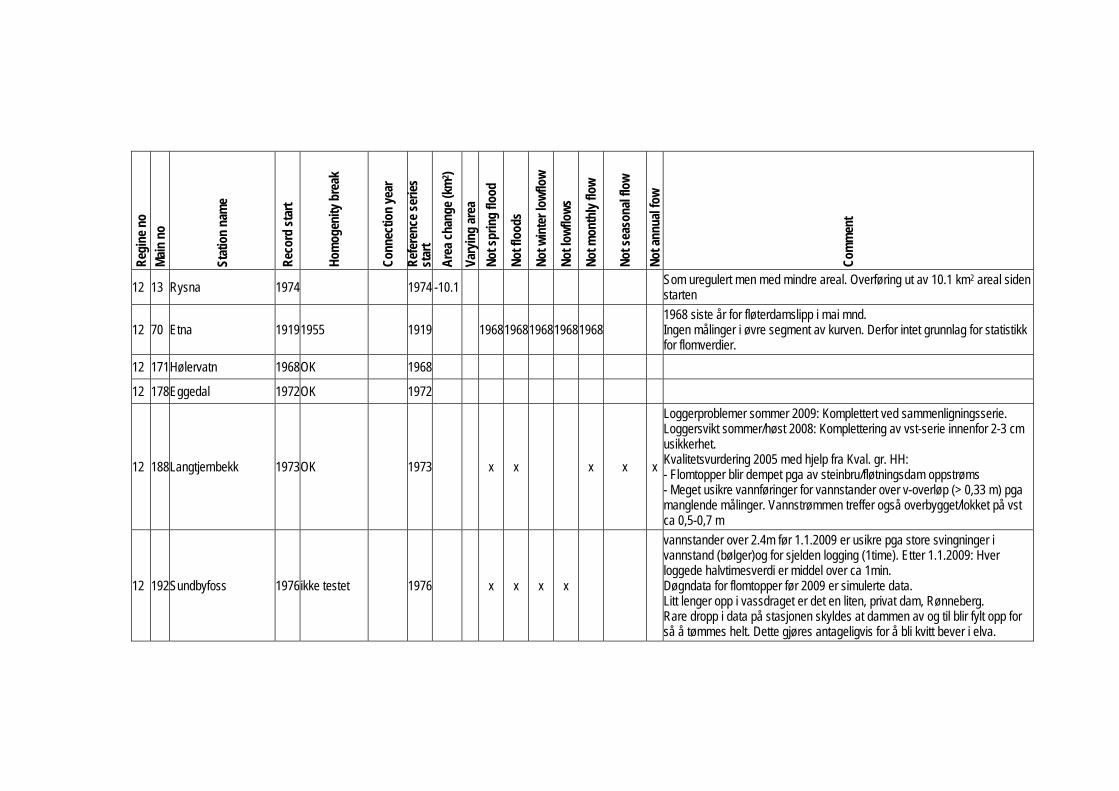
Reg
ine
no
Mai
n no
Stat
ion
nam
e
Rec
ord
star
t
Hom
ogen
ity b
reak
Con
nect
ion
year
Ref
eren
ce s
erie
s st
art
Are
a ch
ange
(km
2 )
Vary
ing
area
Not
spr
ing
flood
Not
floo
ds
Not
win
ter l
owflo
w
Not
low
flow
s
Not
mon
thly
flow
Not
sea
sona
l flo
w
Not
ann
ual f
ow
Com
men
t
12 13 Rysna 1974 1974 -10.1 Som uregulert men med mindre areal. Overføring ut av 10.1 km2 areal siden starten
12 70 Etna 19191955 1919
19681968196819681968
1968 siste år for fløterdamslipp i mai mnd. Ingen målinger i øvre segment av kurven. Derfor intet grunnlag for statistikk for flomverdier.
12 171Hølervatn 1968OK 1968
12 178Eggedal 1972OK 1972
12 188Langtjernbekk 1973OK 1973
x x
x x x
Loggerproblemer sommer 2009: Komplettert ved sammenligningsserie. Loggersvikt sommer/høst 2008: Komplettering av vst-serie innenfor 2-3 cm usikkerhet. Kvalitetsvurdering 2005 med hjelp fra Kval. gr. HH: - Flomtopper blir dempet pga av steinbru/fløtningsdam oppstrøms - Meget usikre vannføringer for vannstander over v-overløp (> 0,33 m) pga manglende målinger. Vannstrømmen treffer også overbygget/lokket på vst ca 0,5-0,7 m
12 192Sundbyfoss 1976ikke testet 1976 x x x x
vannstander over 2.4m før 1.1.2009 er usikre pga store svingninger i vannstand (bølger)og for sjelden logging (1time). Etter 1.1.2009: Hver loggede halvtimesverdi er middel over ca 1min. Døgndata for flomtopper før 2009 er simulerte data. Litt lenger opp i vassdraget er det en liten, privat dam, Rønneberg. Rare dropp i data på stasjonen skyldes at dammen av og til blir fylt opp for så å tømmes helt. Dette gjøres antageligvis for å bli kvitt bever i elva.
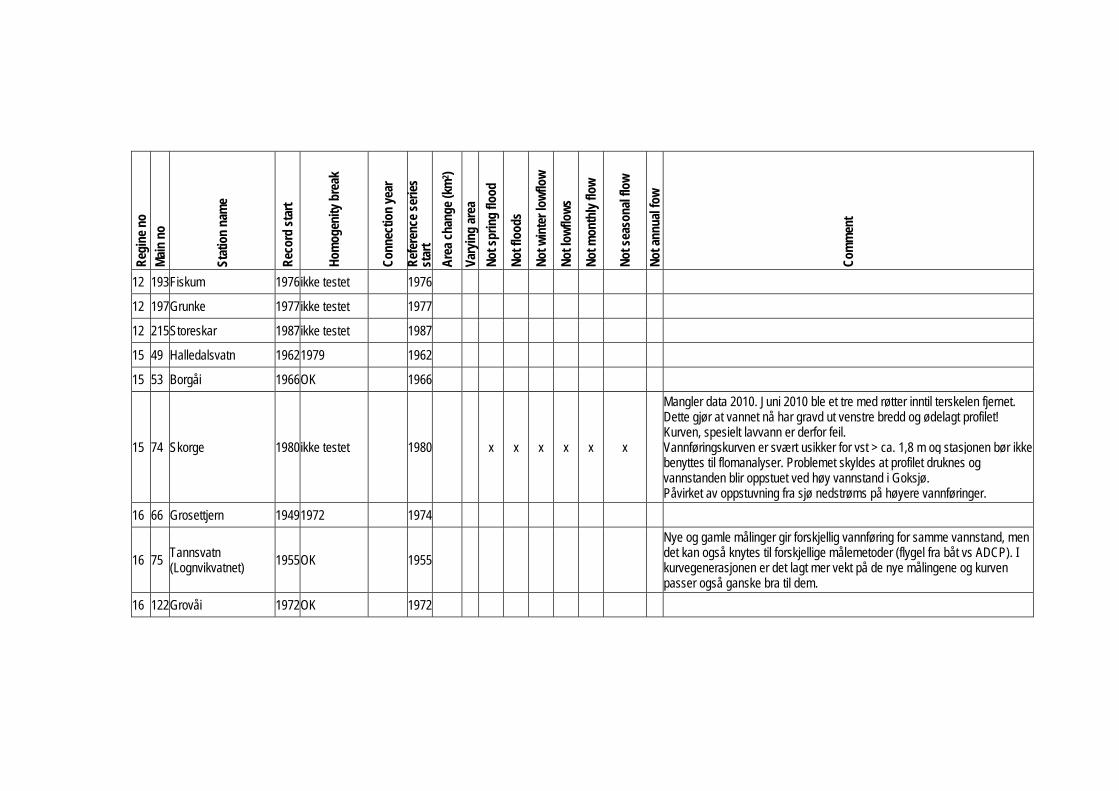
Reg
ine
no
Mai
n no
Stat
ion
nam
e
Rec
ord
star
t
Hom
ogen
ity b
reak
Con
nect
ion
year
Ref
eren
ce s
erie
s st
art
Are
a ch
ange
(km
2 )
Vary
ing
area
Not
spr
ing
flood
Not
floo
ds
Not
win
ter l
owflo
w
Not
low
flow
s
Not
mon
thly
flow
Not
sea
sona
l flo
w
Not
ann
ual f
ow
Com
men
t
12 193Fiskum 1976ikke testet 1976
12 197Grunke 1977ikke testet 1977
12 215Storeskar 1987ikke testet 1987
15 49 Halledalsvatn 19621979 1962
15 53 Borgåi 1966OK 1966
15 74 Skorge 1980ikke testet 1980
x x x x x x
Mangler data 2010. Juni 2010 ble et tre med røtter inntil terskelen fjernet. Dette gjør at vannet nå har gravd ut venstre bredd og ødelagt profilet! Kurven, spesielt lavvann er derfor feil. Vannføringskurven er svært usikker for vst > ca. 1,8 m og stasjonen bør ikke benyttes til flomanalyser. Problemet skyldes at profilet druknes og vannstanden blir oppstuet ved høy vannstand i Goksjø. Påvirket av oppstuvning fra sjø nedstrøms på høyere vannføringer.
16 66 Grosettjern 19491972 1974
16 75 Tannsvatn (Lognvikvatnet) 1955OK 1955
Nye og gamle målinger gir forskjellig vannføring for samme vannstand, men det kan også knytes til forskjellige målemetoder (flygel fra båt vs ADCP). I kurvegenerasjonen er det lagt mer vekt på de nye målingene og kurven passer også ganske bra til dem.
16 122Grovåi 1972OK 1972
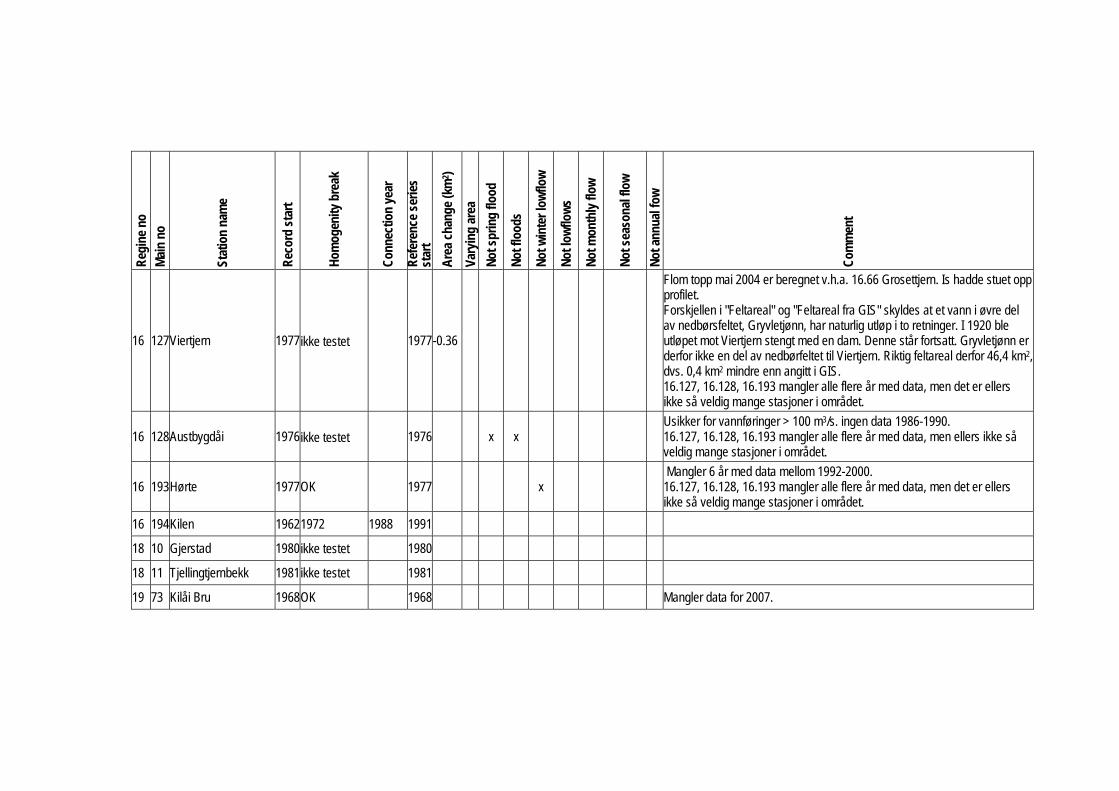
Reg
ine
no
Mai
n no
Stat
ion
nam
e
Rec
ord
star
t
Hom
ogen
ity b
reak
Con
nect
ion
year
Ref
eren
ce s
erie
s st
art
Are
a ch
ange
(km
2 )
Vary
ing
area
Not
spr
ing
flood
Not
floo
ds
Not
win
ter l
owflo
w
Not
low
flow
s
Not
mon
thly
flow
Not
sea
sona
l flo
w
Not
ann
ual f
ow
Com
men
t
16 127Viertjern 1977ikke testet 1977-0.36
Flom topp mai 2004 er beregnet v.h.a. 16.66 Grosettjern. Is hadde stuet opp profilet. Forskjellen i "Feltareal" og "Feltareal fra GIS" skyldes at et vann i øvre del av nedbørsfeltet, Gryvletjønn, har naturlig utløp i to retninger. I 1920 ble utløpet mot Viertjern stengt med en dam. Denne står fortsatt. Gryvletjønn er derfor ikke en del av nedbørfeltet til Viertjern. Riktig feltareal derfor 46,4 km2, dvs. 0,4 km2 mindre enn angitt i GIS. 16.127, 16.128, 16.193 mangler alle flere år med data, men det er ellers ikke så veldig mange stasjoner i området.
16 128Austbygdåi 1976ikke testet 1976 x x Usikker for vannføringer > 100 m3/s. ingen data 1986-1990. 16.127, 16.128, 16.193 mangler alle flere år med data, men ellers ikke så veldig mange stasjoner i området.
16 193Hørte 1977OK 1977
x
Mangler 6 år med data mellom 1992-2000. 16.127, 16.128, 16.193 mangler alle flere år med data, men det er ellers ikke så veldig mange stasjoner i området.
16 194Kilen 19621972 1988 1991
18 10 Gjerstad 1980ikke testet 1980
18 11 Tjellingtjernbekk 1981ikke testet 1981
19 73 Kilåi Bru 1968OK 1968 Mangler data for 2007.
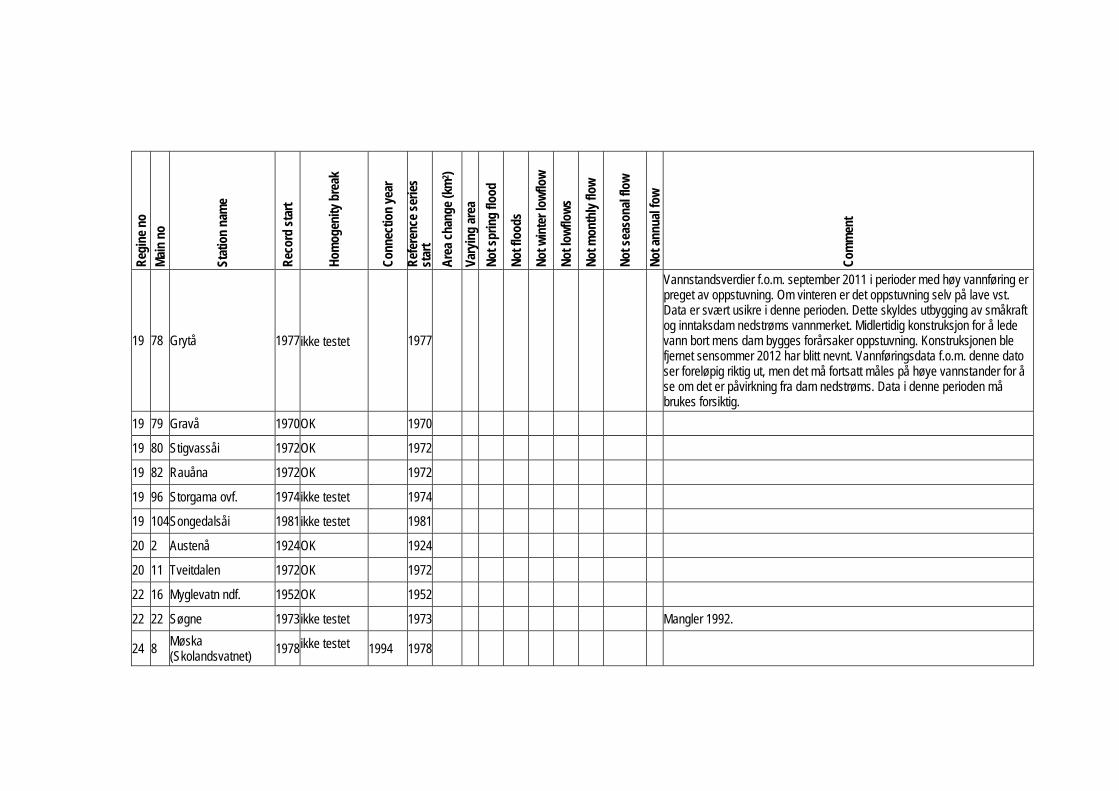
Reg
ine
no
Mai
n no
Stat
ion
nam
e
Rec
ord
star
t
Hom
ogen
ity b
reak
Con
nect
ion
year
Ref
eren
ce s
erie
s st
art
Are
a ch
ange
(km
2 )
Vary
ing
area
Not
spr
ing
flood
Not
floo
ds
Not
win
ter l
owflo
w
Not
low
flow
s
Not
mon
thly
flow
Not
sea
sona
l flo
w
Not
ann
ual f
ow
Com
men
t
19 78 Grytå 1977ikke testet 1977
Vannstandsverdier f.o.m. september 2011 i perioder med høy vannføring er preget av oppstuvning. Om vinteren er det oppstuvning selv på lave vst. Data er svært usikre i denne perioden. Dette skyldes utbygging av småkraft og inntaksdam nedstrøms vannmerket. Midlertidig konstruksjon for å lede vann bort mens dam bygges forårsaker oppstuvning. Konstruksjonen ble fjernet sensommer 2012 har blitt nevnt. Vannføringsdata f.o.m. denne dato ser foreløpig riktig ut, men det må fortsatt måles på høye vannstander for å se om det er påvirkning fra dam nedstrøms. Data i denne perioden må brukes forsiktig.
19 79 Gravå 1970OK 1970
19 80 Stigvassåi 1972OK 1972
19 82 Rauåna 1972OK 1972
19 96 Storgama ovf. 1974ikke testet 1974
19 104Songedalsåi 1981ikke testet 1981
20 2 Austenå 1924OK 1924
20 11 Tveitdalen 1972OK 1972
22 16 Myglevatn ndf. 1952OK 1952
22 22 Søgne 1973ikke testet 1973 Mangler 1992.
24 8 Møska (Skolandsvatnet)
1978ikke testet 1994 1978
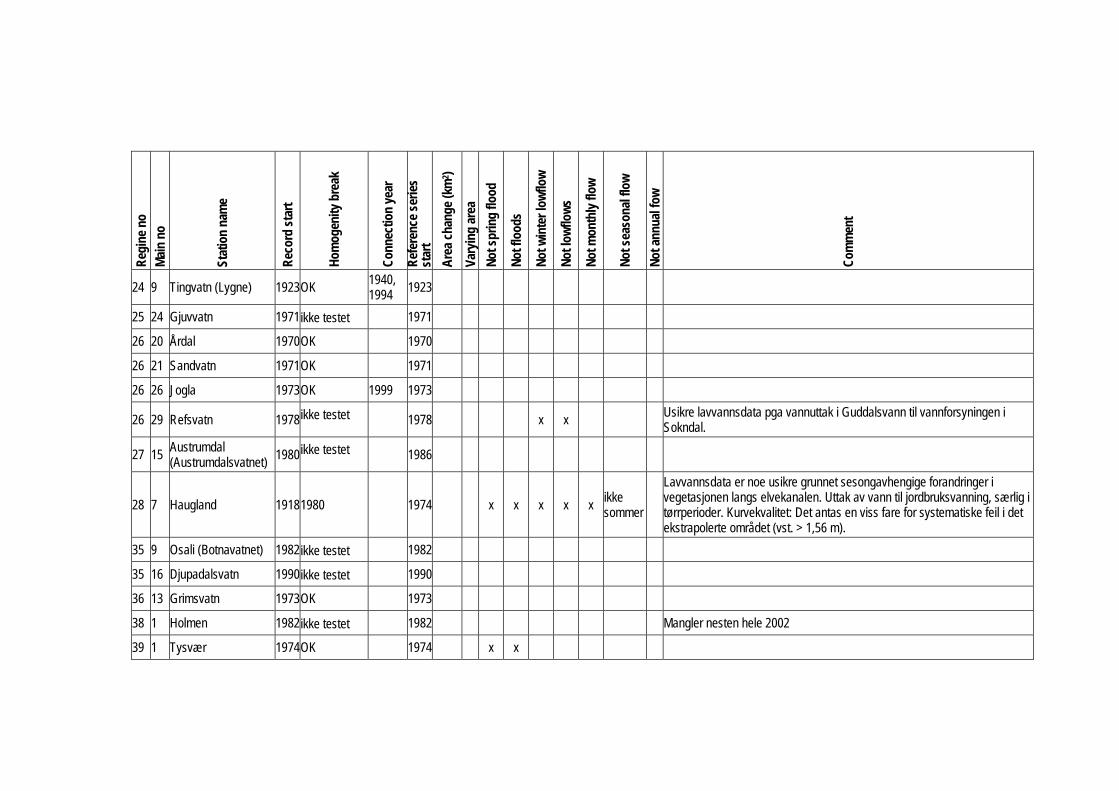
Reg
ine
no
Mai
n no
Stat
ion
nam
e
Rec
ord
star
t
Hom
ogen
ity b
reak
Con
nect
ion
year
Ref
eren
ce s
erie
s st
art
Are
a ch
ange
(km
2 )
Vary
ing
area
Not
spr
ing
flood
Not
floo
ds
Not
win
ter l
owflo
w
Not
low
flow
s
Not
mon
thly
flow
Not
sea
sona
l flo
w
Not
ann
ual f
ow
Com
men
t
24 9 Tingvatn (Lygne) 1923OK 1940, 1994 1923
25 24 Gjuvvatn 1971ikke testet 1971
26 20 Årdal 1970OK 1970
26 21 Sandvatn 1971OK 1971
26 26 Jogla 1973OK 1999 1973
26 29 Refsvatn 1978ikke testet 1978 x x Usikre lavvannsdata pga vannuttak i Guddalsvann til vannforsyningen i Sokndal.
27 15 Austrumdal (Austrumdalsvatnet)
1980ikke testet 1986
28 7 Haugland 19181980 1974 x x x x x ikke sommer
Lavvannsdata er noe usikre grunnet sesongavhengige forandringer i vegetasjonen langs elvekanalen. Uttak av vann til jordbruksvanning, særlig i tørrperioder. Kurvekvalitet: Det antas en viss fare for systematiske feil i det ekstrapolerte området (vst. > 1,56 m).
35 9 Osali (Botnavatnet) 1982ikke testet 1982
35 16 Djupadalsvatn 1990ikke testet 1990
36 13 Grimsvatn 1973OK 1973
38 1 Holmen 1982ikke testet 1982
Mangler nesten hele 2002
39 1 Tysvær 1974OK 1974
x x
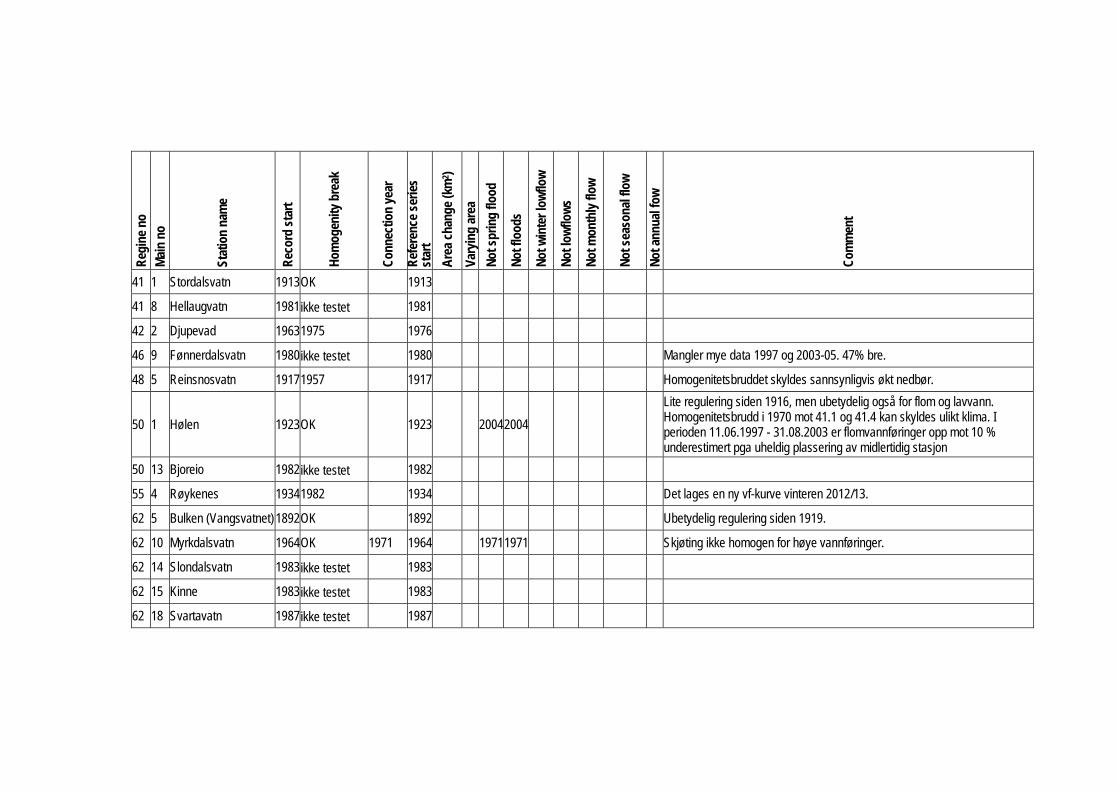
Reg
ine
no
Mai
n no
Stat
ion
nam
e
Rec
ord
star
t
Hom
ogen
ity b
reak
Con
nect
ion
year
Ref
eren
ce s
erie
s st
art
Are
a ch
ange
(km
2 )
Vary
ing
area
Not
spr
ing
flood
Not
floo
ds
Not
win
ter l
owflo
w
Not
low
flow
s
Not
mon
thly
flow
Not
sea
sona
l flo
w
Not
ann
ual f
ow
Com
men
t
41 1 Stordalsvatn 1913OK 1913
41 8 Hellaugvatn 1981ikke testet 1981
42 2 Djupevad 19631975 1976
46 9 Fønnerdalsvatn 1980ikke testet 1980 Mangler mye data 1997 og 2003-05. 47% bre.
48 5 Reinsnosvatn 19171957 1917 Homogenitetsbruddet skyldes sannsynligvis økt nedbør.
50 1 Hølen 1923OK 1923 20042004
Lite regulering siden 1916, men ubetydelig også for flom og lavvann. Homogenitetsbrudd i 1970 mot 41.1 og 41.4 kan skyldes ulikt klima. I perioden 11.06.1997 - 31.08.2003 er flomvannføringer opp mot 10 % underestimert pga uheldig plassering av midlertidig stasjon
50 13 Bjoreio 1982ikke testet 1982
55 4 Røykenes 19341982 1934 Det lages en ny vf-kurve vinteren 2012/13.
62 5 Bulken (Vangsvatnet) 1892OK 1892 Ubetydelig regulering siden 1919.
62 10 Myrkdalsvatn 1964OK 1971 1964 19711971 Skjøting ikke homogen for høye vannføringer.
62 14 Slondalsvatn 1983ikke testet 1983
62 15 Kinne 1983ikke testet 1983
62 18 Svartavatn 1987ikke testet 1987

Reg
ine
no
Mai
n no
Stat
ion
nam
e
Rec
ord
star
t
Hom
ogen
ity b
reak
Con
nect
ion
year
Ref
eren
ce s
erie
s st
art
Are
a ch
ange
(km
2 )
Vary
ing
area
Not
spr
ing
flood
Not
floo
ds
Not
win
ter l
owflo
w
Not
low
flow
s
Not
mon
thly
flow
Not
sea
sona
l flo
w
Not
ann
ual f
ow
Com
men
t
72 5 Brekke bru 1939OK 1941 Det lages en ny vf-kurve vinteren 2012/13.
73 27 Sula 1991ikke testet 1991 kontinuerlig f.o.m. mai 1991
74 16 Langedalen 1972OK 1972
75 22 Gilja 1963OK 1963
75 23 Krokenelv 1965OK 1965
75 28 Feigumfoss 1972OK 1972
76 5 Nigardsbrevatn 1962OK 1962 20022002 Det lages en ny vf-kurve vinteren 2012/13. Fram til ny kurve er laget kan serien kun brukes for flomstudier f.o.m. 2002. 75% bre
77 3 Sogndalsvatn 1962OK 1962
78 8 Bøyumselv 19651982? 1982 1983 Årsvannføringen i 1986 og 1987 var veldig lav, men sammenlikning med P og T fra seNorge, antyder at det kan skyldes år med lite nedbør og lave temperaturer om sommeren og derfor lite smelting fra breen. 43% bre.
79 3 Nessedalselv 1983ikke testet 1983
80 4 Ullebøelv 19271970? 1927
81 1 Hersvikvatn (Hagevatnet)
1934OK 1934
82 4 Nautsundvatn 19081973? 1983 1908
x x
Det lages en ny vf-kurve vinteren 2012/13.
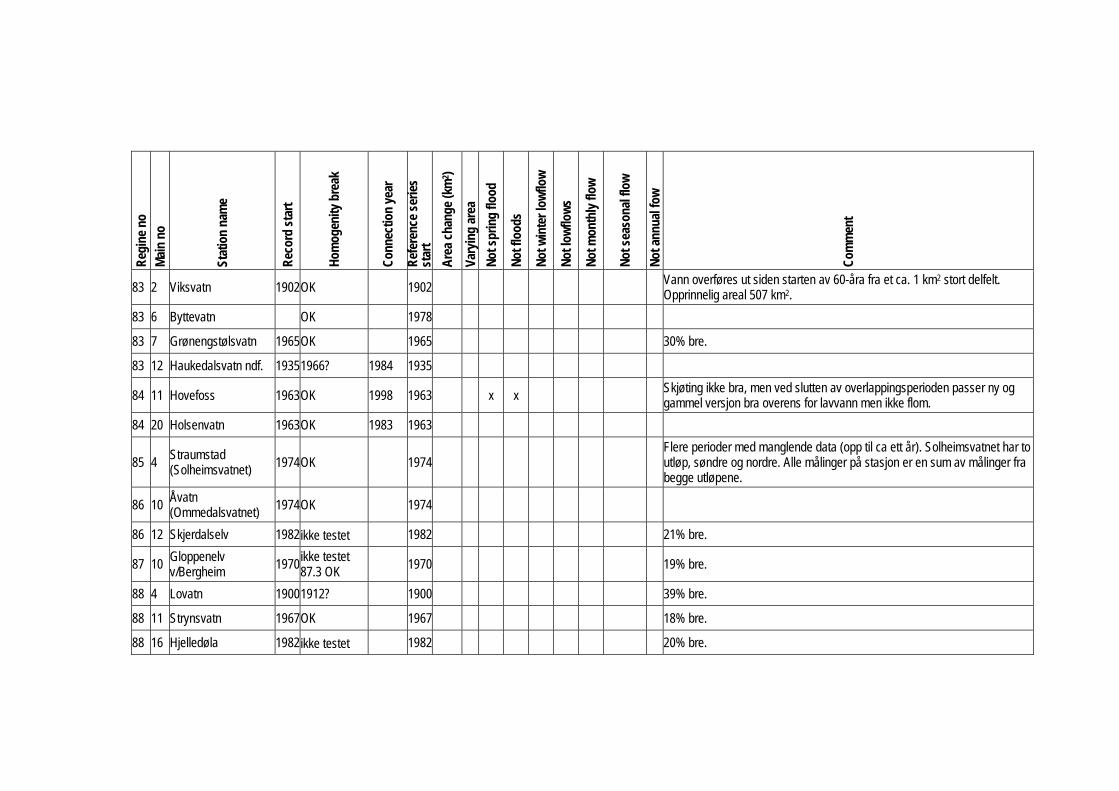
Reg
ine
no
Mai
n no
Stat
ion
nam
e
Rec
ord
star
t
Hom
ogen
ity b
reak
Con
nect
ion
year
Ref
eren
ce s
erie
s st
art
Are
a ch
ange
(km
2 )
Vary
ing
area
Not
spr
ing
flood
Not
floo
ds
Not
win
ter l
owflo
w
Not
low
flow
s
Not
mon
thly
flow
Not
sea
sona
l flo
w
Not
ann
ual f
ow
Com
men
t
83 2 Viksvatn 1902OK 1902 Vann overføres ut siden starten av 60-åra fra et ca. 1 km2 stort delfelt. Opprinnelig areal 507 km2.
83 6 Byttevatn OK 1978
83 7 Grønengstølsvatn 1965OK 1965 30% bre.
83 12 Haukedalsvatn ndf. 19351966? 1984 1935
84 11 Hovefoss 1963OK 1998 1963 x x Skjøting ikke bra, men ved slutten av overlappingsperioden passer ny og gammel versjon bra overens for lavvann men ikke flom.
84 20 Holsenvatn 1963OK 1983 1963
85 4 Straumstad (Solheimsvatnet) 1974OK 1974
Flere perioder med manglende data (opp til ca ett år). Solheimsvatnet har to utløp, søndre og nordre. Alle målinger på stasjon er en sum av målinger fra begge utløpene.
86 10 Åvatn (Ommedalsvatnet) 1974OK 1974
86 12 Skjerdalselv 1982ikke testet 1982 21% bre.
87 10 Gloppenelv v/Bergheim
1970ikke testet 87.3 OK
1970 19% bre.
88 4 Lovatn 19001912? 1900 39% bre.
88 11 Strynsvatn 1967OK 1967 18% bre.
88 16 Hjelledøla 1982ikke testet 1982 20% bre.
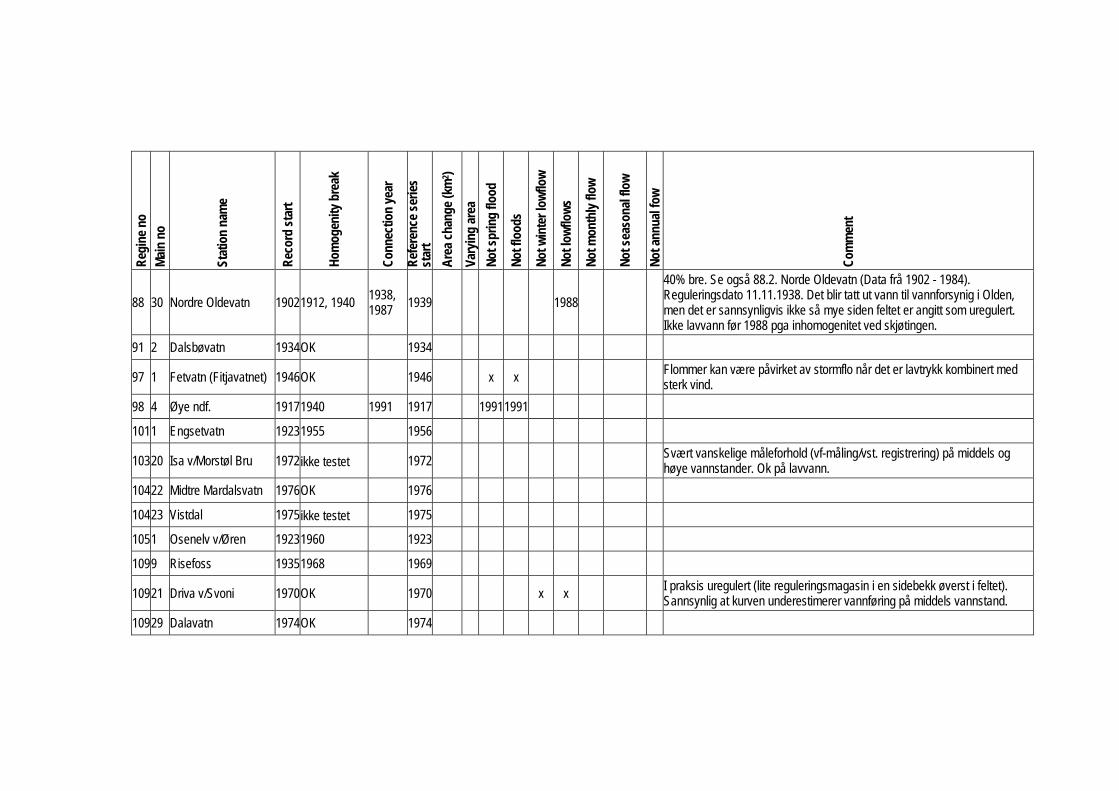
Reg
ine
no
Mai
n no
Stat
ion
nam
e
Rec
ord
star
t
Hom
ogen
ity b
reak
Con
nect
ion
year
Ref
eren
ce s
erie
s st
art
Are
a ch
ange
(km
2 )
Vary
ing
area
Not
spr
ing
flood
Not
floo
ds
Not
win
ter l
owflo
w
Not
low
flow
s
Not
mon
thly
flow
Not
sea
sona
l flo
w
Not
ann
ual f
ow
Com
men
t
88 30 Nordre Oldevatn 19021912, 1940 1938, 1987
1939 1988
40% bre. Se også 88.2. Norde Oldevatn (Data frå 1902 - 1984). Reguleringsdato 11.11.1938. Det blir tatt ut vann til vannforsynig i Olden, men det er sannsynligvis ikke så mye siden feltet er angitt som uregulert. Ikke lavvann før 1988 pga inhomogenitet ved skjøtingen.
91 2 Dalsbøvatn 1934OK 1934
97 1 Fetvatn (Fitjavatnet) 1946OK 1946 x x Flommer kan være påvirket av stormflo når det er lavtrykk kombinert med sterk vind.
98 4 Øye ndf. 19171940 1991 1917
19911991
1011 Engsetvatn 19231955 1956
10320 Isa v/Morstøl Bru 1972ikke testet 1972 Svært vanskelige måleforhold (vf-måling/vst. registrering) på middels og høye vannstander. Ok på lavvann.
10422 Midtre Mardalsvatn 1976OK 1976
10423 Vistdal 1975ikke testet 1975
1051 Osenelv v/Øren 19231960 1923
1099 Risefoss 19351968 1969
10921 Driva v/Svoni 1970OK 1970 x x I praksis uregulert (lite reguleringsmagasin i en sidebekk øverst i feltet). Sannsynlig at kurven underestimerer vannføring på middels vannstand.
10929 Dalavatn 1974OK 1974
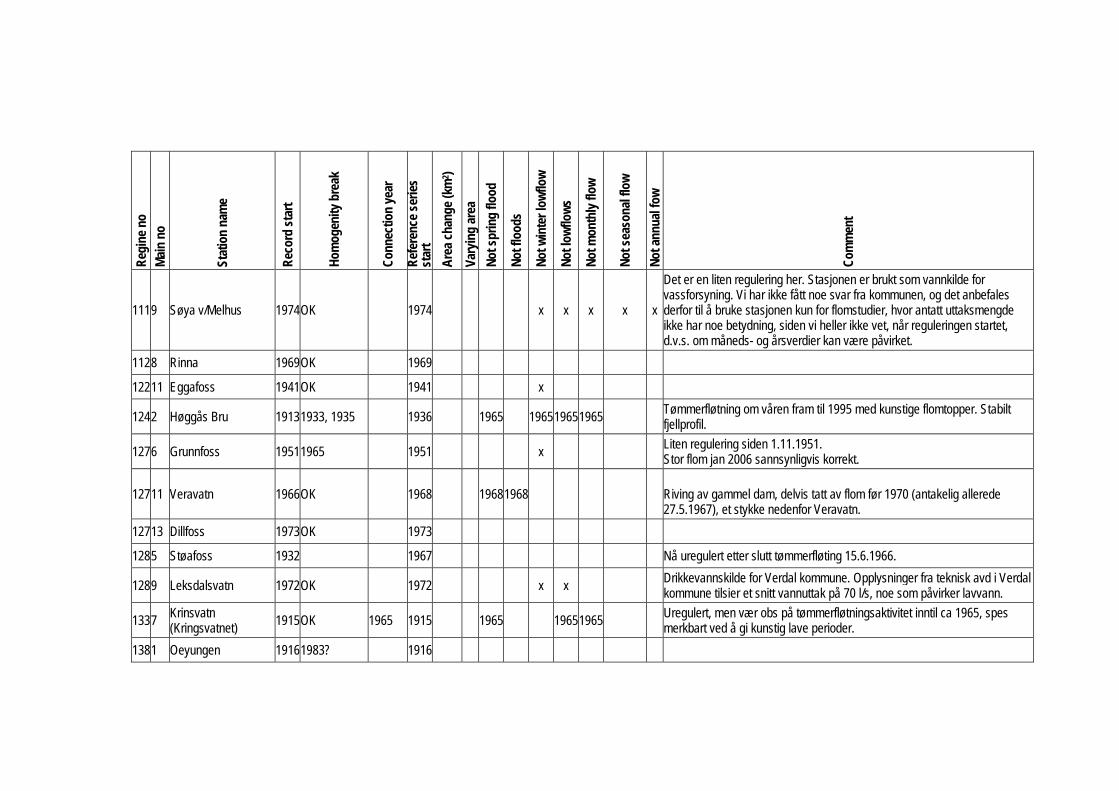
Reg
ine
no
Mai
n no
Stat
ion
nam
e
Rec
ord
star
t
Hom
ogen
ity b
reak
Con
nect
ion
year
Ref
eren
ce s
erie
s st
art
Are
a ch
ange
(km
2 )
Vary
ing
area
Not
spr
ing
flood
Not
floo
ds
Not
win
ter l
owflo
w
Not
low
flow
s
Not
mon
thly
flow
Not
sea
sona
l flo
w
Not
ann
ual f
ow
Com
men
t
1119 Søya v/Melhus 1974OK 1974 x x x x x
Det er en liten regulering her. Stasjonen er brukt som vannkilde for vassforsyning. Vi har ikke fått noe svar fra kommunen, og det anbefales derfor til å bruke stasjonen kun for flomstudier, hvor antatt uttaksmengde ikke har noe betydning, siden vi heller ikke vet, når reguleringen startet, d.v.s. om måneds- og årsverdier kan være påvirket.
1128 Rinna 1969OK 1969
12211 Eggafoss 1941OK 1941
x
1242 Høggås Bru 19131933, 1935 1936 1965 196519651965 Tømmerfløtning om våren fram til 1995 med kunstige flomtopper. Stabilt fjellprofil.
1276 Grunnfoss 19511965 1951
x
Liten regulering siden 1.11.1951. Stor flom jan 2006 sannsynligvis korrekt.
12711 Veravatn 1966OK 1968 19681968
Riving av gammel dam, delvis tatt av flom før 1970 (antakelig allerede 27.5.1967), et stykke nedenfor Veravatn.
12713 Dillfoss 1973OK 1973
1285 Støafoss 1932 1967
Nå uregulert etter slutt tømmerfløting 15.6.1966.
1289 Leksdalsvatn 1972OK 1972
x x
Drikkevannskilde for Verdal kommune. Opplysninger fra teknisk avd i Verdal kommune tilsier et snitt vannuttak på 70 l/s, noe som påvirker lavvann.
1337 Krinsvatn (Kringsvatnet)
1915OK 1965 1915 1965 19651965 Uregulert, men vær obs på tømmerfløtningsaktivitet inntil ca 1965, spes merkbart ved å gi kunstig lave perioder.
1381 Oeyungen 19161983? 1916
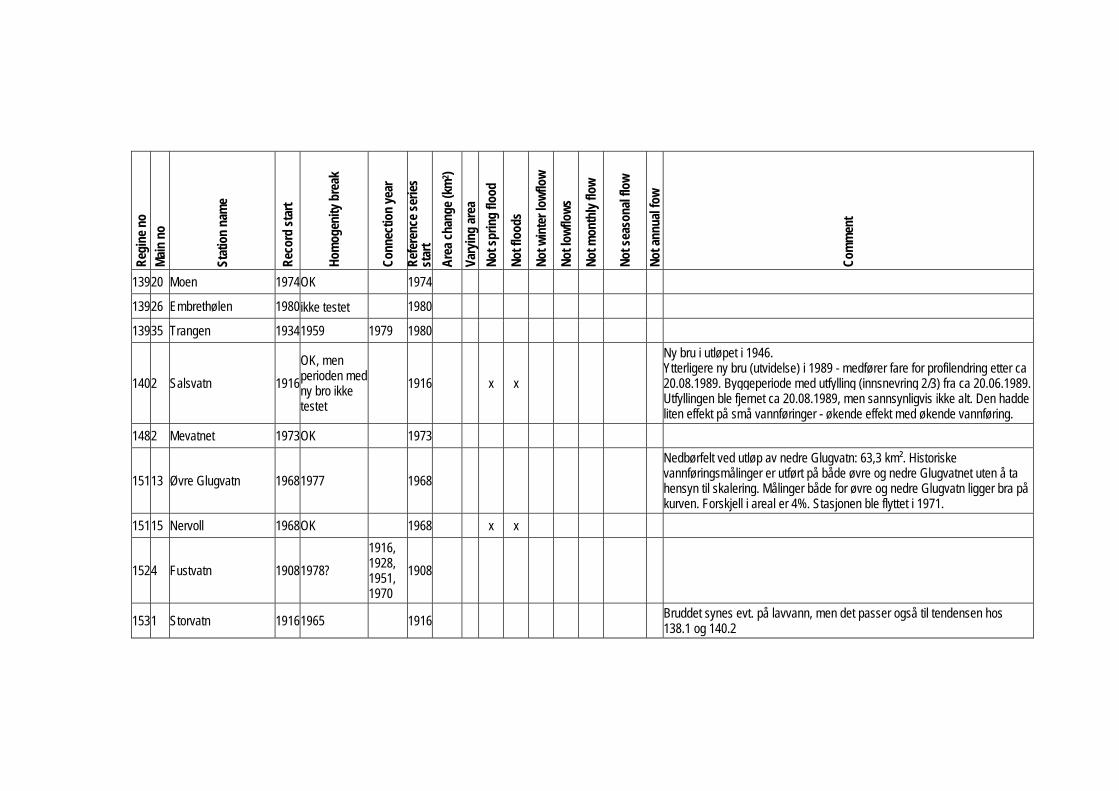
Reg
ine
no
Mai
n no
Stat
ion
nam
e
Rec
ord
star
t
Hom
ogen
ity b
reak
Con
nect
ion
year
Ref
eren
ce s
erie
s st
art
Are
a ch
ange
(km
2 )
Vary
ing
area
Not
spr
ing
flood
Not
floo
ds
Not
win
ter l
owflo
w
Not
low
flow
s
Not
mon
thly
flow
Not
sea
sona
l flo
w
Not
ann
ual f
ow
Com
men
t
13920 Moen 1974OK 1974
13926 Embrethølen 1980ikke testet 1980
13935 Trangen 19341959 1979 1980
1402 Salsvatn 1916
OK, men perioden med ny bro ikke testet
1916
x x
Ny bru i utløpet i 1946. Ytterligere ny bru (utvidelse) i 1989 - medfører fare for profilendring etter ca 20.08.1989. Byggeperiode med utfylling (innsnevring 2/3) fra ca 20.06.1989. Utfyllingen ble fjernet ca 20.08.1989, men sannsynligvis ikke alt. Den hadde liten effekt på små vannføringer - økende effekt med økende vannføring.
1482 Mevatnet 1973OK 1973
15113 Øvre Glugvatn 19681977 1968
Nedbørfelt ved utløp av nedre Glugvatn: 63,3 km². Historiske vannføringsmålinger er utført på både øvre og nedre Glugvatnet uten å ta hensyn til skalering. Målinger både for øvre og nedre Glugvatn ligger bra på kurven. Forskjell i areal er 4%. Stasjonen ble flyttet i 1971.
15115 Nervoll 1968OK 1968
x x
1524 Fustvatn 19081978?
1916, 1928, 1951, 1970
1908
1531 Storvatn 19161965 1916 Bruddet synes evt. på lavvann, men det passer også til tendensen hos 138.1 og 140.2
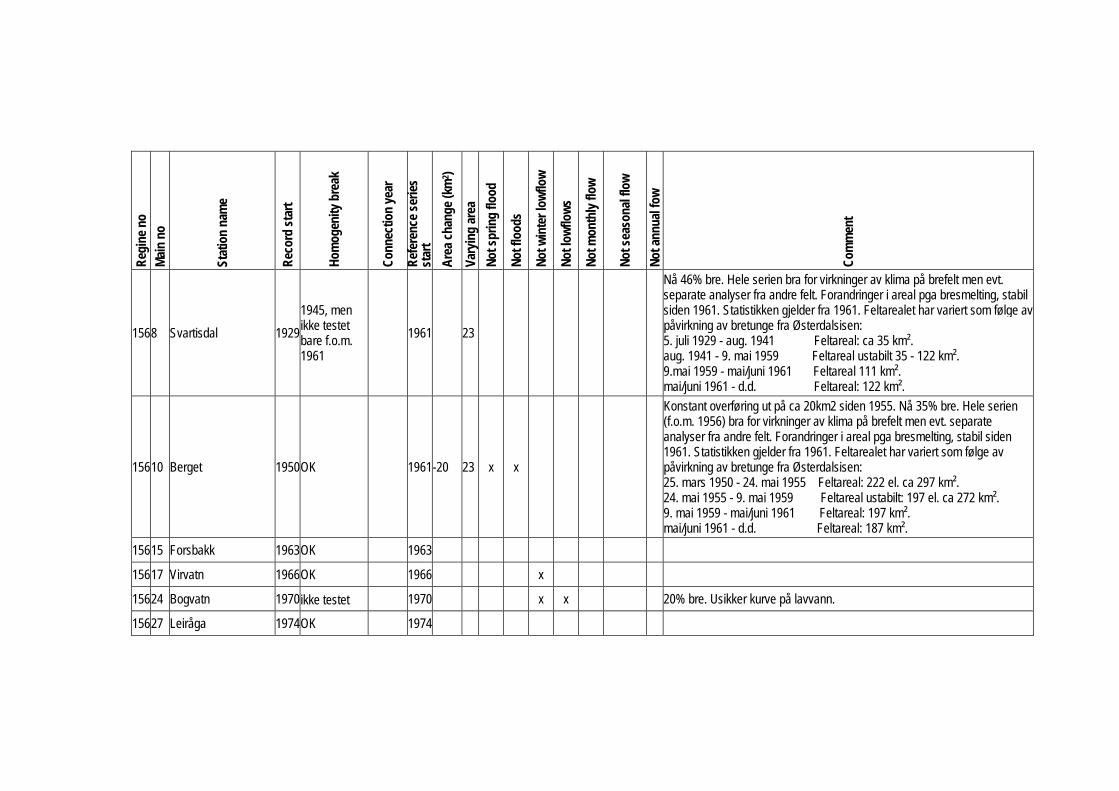
Reg
ine
no
Mai
n no
Stat
ion
nam
e
Rec
ord
star
t
Hom
ogen
ity b
reak
Con
nect
ion
year
Ref
eren
ce s
erie
s st
art
Are
a ch
ange
(km
2 )
Vary
ing
area
Not
spr
ing
flood
Not
floo
ds
Not
win
ter l
owflo
w
Not
low
flow
s
Not
mon
thly
flow
Not
sea
sona
l flo
w
Not
ann
ual f
ow
Com
men
t
1568 Svartisdal 1929
1945, men ikke testet bare f.o.m. 1961
1961 23
Nå 46% bre. Hele serien bra for virkninger av klima på brefelt men evt. separate analyser fra andre felt. Forandringer i areal pga bresmelting, stabil siden 1961. Statistikken gjelder fra 1961. Feltarealet har variert som følge av påvirkning av bretunge fra Østerdalsisen: 5. juli 1929 - aug. 1941 Feltareal: ca 35 km². aug. 1941 - 9. mai 1959 Feltareal ustabilt 35 - 122 km². 9.mai 1959 - mai/juni 1961 Feltareal 111 km². mai/juni 1961 - d.d. Feltareal: 122 km².
15610 Berget 1950OK 1961-20 23 x x
Konstant overføring ut på ca 20km2 siden 1955. Nå 35% bre. Hele serien (f.o.m. 1956) bra for virkninger av klima på brefelt men evt. separate analyser fra andre felt. Forandringer i areal pga bresmelting, stabil siden 1961. Statistikken gjelder fra 1961. Feltarealet har variert som følge av påvirkning av bretunge fra Østerdalsisen: 25. mars 1950 - 24. mai 1955 Feltareal: 222 el. ca 297 km². 24. mai 1955 - 9. mai 1959 Feltareal ustabilt: 197 el. ca 272 km². 9. mai 1959 - mai/juni 1961 Feltareal: 197 km². mai/juni 1961 - d.d. Feltareal: 187 km².
15615 Forsbakk 1963OK 1963
15617 Virvatn 1966OK 1966
x
15624 Bogvatn 1970ikke testet 1970 x x 20% bre. Usikker kurve på lavvann.
15627 Leiråga 1974OK 1974
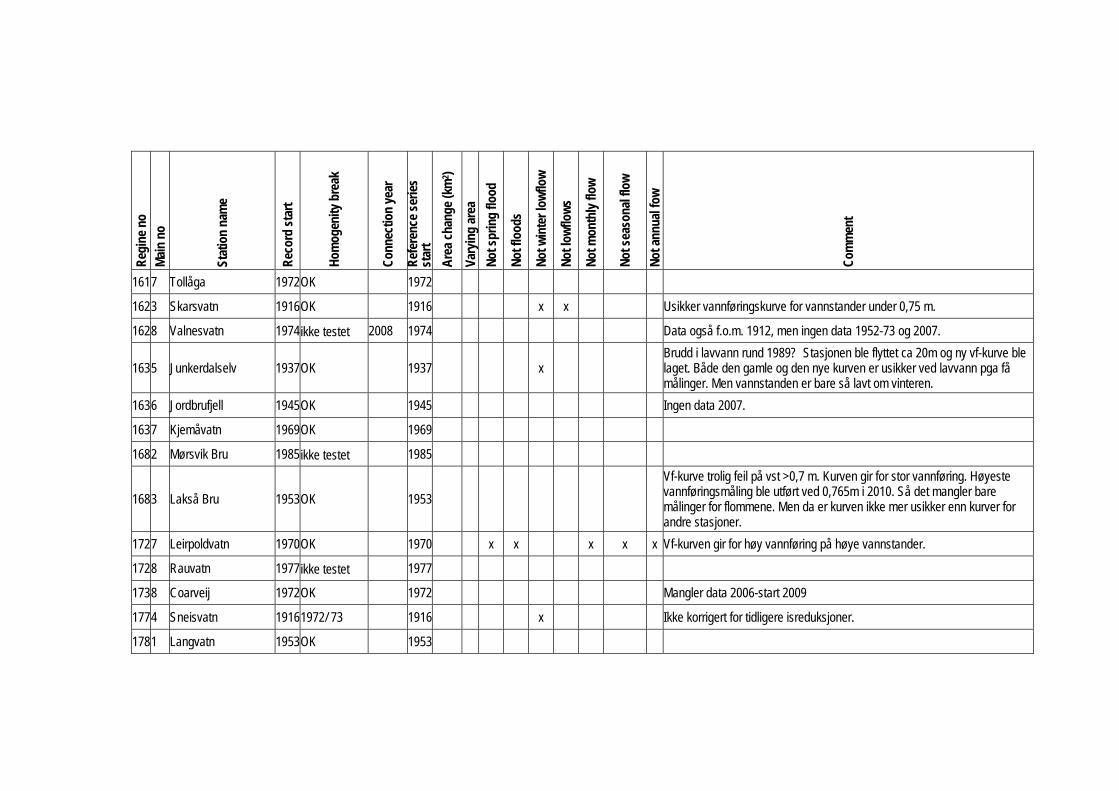
Reg
ine
no
Mai
n no
Stat
ion
nam
e
Rec
ord
star
t
Hom
ogen
ity b
reak
Con
nect
ion
year
Ref
eren
ce s
erie
s st
art
Are
a ch
ange
(km
2 )
Vary
ing
area
Not
spr
ing
flood
Not
floo
ds
Not
win
ter l
owflo
w
Not
low
flow
s
Not
mon
thly
flow
Not
sea
sona
l flo
w
Not
ann
ual f
ow
Com
men
t
1617 Tollåga 1972OK 1972
1623 Skarsvatn 1916OK 1916 x x Usikker vannføringskurve for vannstander under 0,75 m.
1628 Valnesvatn 1974ikke testet 2008 1974 Data også f.o.m. 1912, men ingen data 1952-73 og 2007.
1635 Junkerdalselv 1937OK 1937
x
Brudd i lavvann rund 1989? Stasjonen ble flyttet ca 20m og ny vf-kurve ble laget. Både den gamle og den nye kurven er usikker ved lavvann pga få målinger. Men vannstanden er bare så lavt om vinteren.
1636 Jordbrufjell 1945OK 1945
Ingen data 2007.
1637 Kjemåvatn 1969OK 1969
1682 Mørsvik Bru 1985ikke testet 1985
1683 Lakså Bru 1953OK 1953
Vf-kurve trolig feil på vst >0,7 m. Kurven gir for stor vannføring. Høyeste vannføringsmåling ble utført ved 0,765m i 2010. Så det mangler bare målinger for flommene. Men da er kurven ikke mer usikker enn kurver for andre stasjoner.
1727 Leirpoldvatn 1970OK 1970 x x x x x Vf-kurven gir for høy vannføring på høye vannstander.
1728 Rauvatn 1977ikke testet 1977
1738 Coarveij 1972OK 1972
Mangler data 2006-start 2009
1774 Sneisvatn 19161972/ 73 1916
x
Ikke korrigert for tidligere isreduksjoner.
1781 Langvatn 1953OK 1953
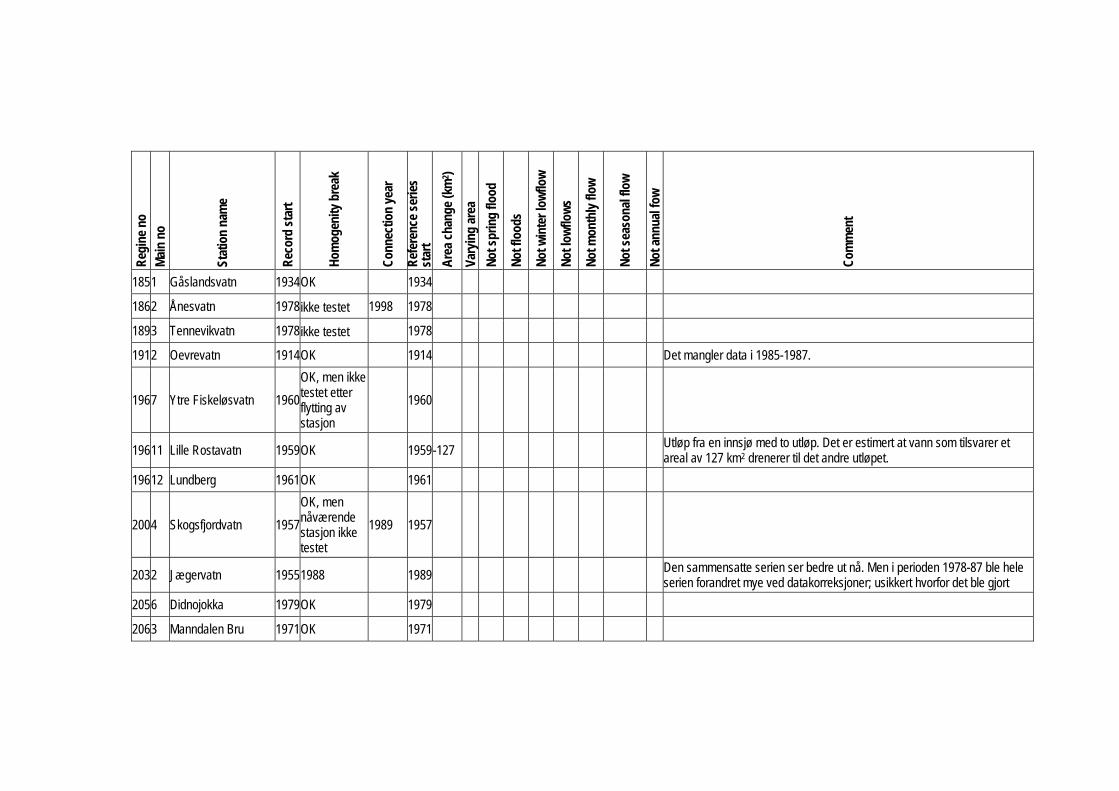
Reg
ine
no
Mai
n no
Stat
ion
nam
e
Rec
ord
star
t
Hom
ogen
ity b
reak
Con
nect
ion
year
Ref
eren
ce s
erie
s st
art
Are
a ch
ange
(km
2 )
Vary
ing
area
Not
spr
ing
flood
Not
floo
ds
Not
win
ter l
owflo
w
Not
low
flow
s
Not
mon
thly
flow
Not
sea
sona
l flo
w
Not
ann
ual f
ow
Com
men
t
1851 Gåslandsvatn 1934OK 1934
1862 Ånesvatn 1978ikke testet 1998 1978
1893 Tennevikvatn 1978ikke testet 1978
1912 Oevrevatn 1914OK 1914 Det mangler data i 1985-1987.
1967 Ytre Fiskeløsvatn 1960
OK, men ikke testet etter flytting av stasjon
1960
19611 Lille Rostavatn 1959OK 1959-127 Utløp fra en innsjø med to utløp. Det er estimert at vann som tilsvarer et areal av 127 km2 drenerer til det andre utløpet.
19612 Lundberg 1961OK 1961
2004 Skogsfjordvatn 1957
OK, men nåværende stasjon ikke testet
1989 1957
2032 Jægervatn 19551988 1989 Den sammensatte serien ser bedre ut nå. Men i perioden 1978-87 ble hele serien forandret mye ved datakorreksjoner; usikkert hvorfor det ble gjort
2056 Didnojokka 1979OK 1979
2063 Manndalen Bru 1971OK 1971
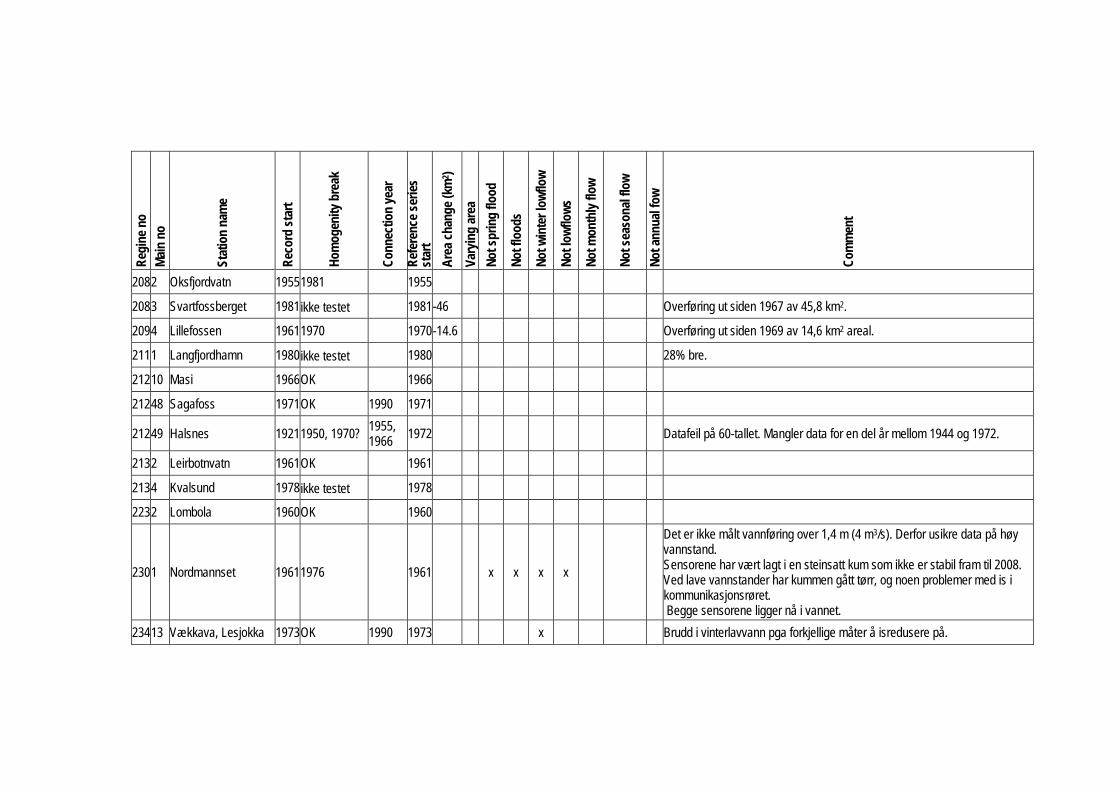
Reg
ine
no
Mai
n no
Stat
ion
nam
e
Rec
ord
star
t
Hom
ogen
ity b
reak
Con
nect
ion
year
Ref
eren
ce s
erie
s st
art
Are
a ch
ange
(km
2 )
Vary
ing
area
Not
spr
ing
flood
Not
floo
ds
Not
win
ter l
owflo
w
Not
low
flow
s
Not
mon
thly
flow
Not
sea
sona
l flo
w
Not
ann
ual f
ow
Com
men
t
2082 Oksfjordvatn 19551981 1955
2083 Svartfossberget 1981ikke testet 1981-46 Overføring ut siden 1967 av 45,8 km2.
2094 Lillefossen 19611970 1970-14.6 Overføring ut siden 1969 av 14,6 km2 areal.
2111 Langfjordhamn 1980ikke testet 1980 28% bre.
21210 Masi 1966OK 1966
21248 Sagafoss 1971OK 1990 1971
21249 Halsnes 19211950, 1970? 1955, 1966 1972 Datafeil på 60-tallet. Mangler data for en del år mellom 1944 og 1972.
2132 Leirbotnvatn 1961OK 1961
2134 Kvalsund 1978ikke testet 1978
2232 Lombola 1960OK 1960
2301 Nordmannset 19611976 1961 x x x x
Det er ikke målt vannføring over 1,4 m (4 m3/s). Derfor usikre data på høy vannstand. Sensorene har vært lagt i en steinsatt kum som ikke er stabil fram til 2008. Ved lave vannstander har kummen gått tørr, og noen problemer med is i kommunikasjonsrøret. Begge sensorene ligger nå i vannet.
23413 Vækkava, Lesjokka 1973OK 1990 1973
x
Brudd i vinterlavvann pga forkjellige måter å isredusere på.
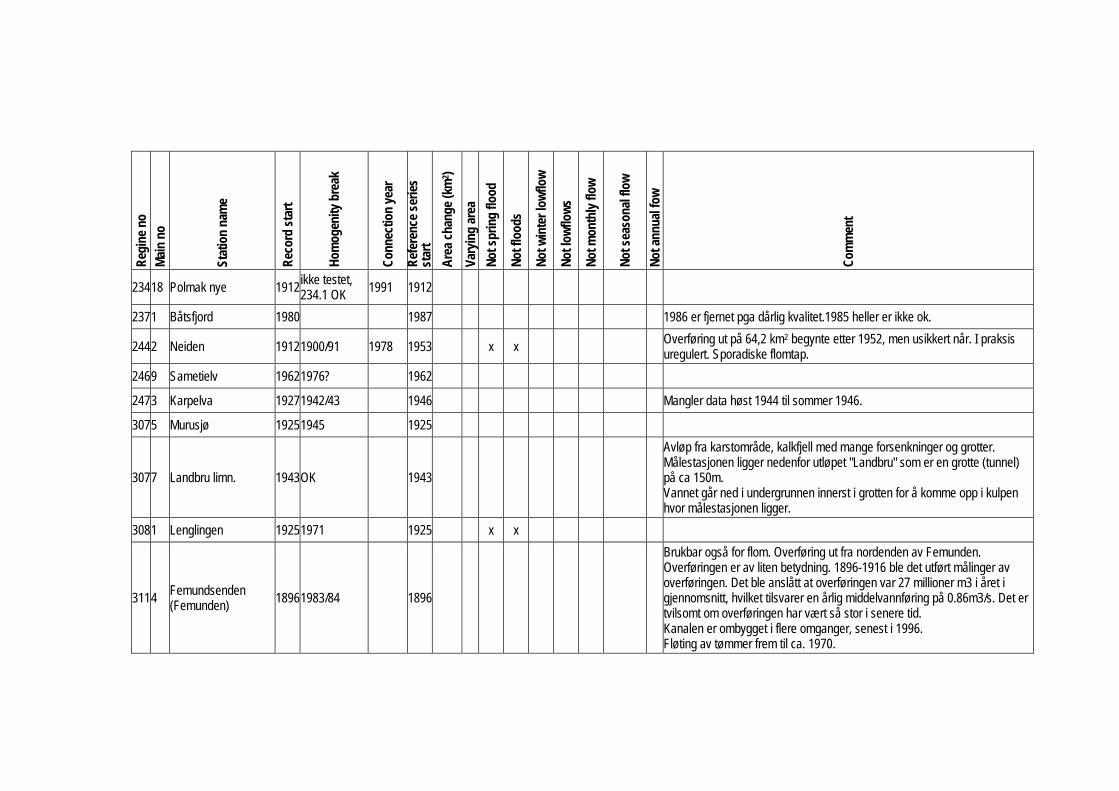
Reg
ine
no
Mai
n no
Stat
ion
nam
e
Rec
ord
star
t
Hom
ogen
ity b
reak
Con
nect
ion
year
Ref
eren
ce s
erie
s st
art
Are
a ch
ange
(km
2 )
Vary
ing
area
Not
spr
ing
flood
Not
floo
ds
Not
win
ter l
owflo
w
Not
low
flow
s
Not
mon
thly
flow
Not
sea
sona
l flo
w
Not
ann
ual f
ow
Com
men
t
23418 Polmak nye 1912ikke testet, 234.1 OK 1991 1912
2371 Båtsfjord 1980 1987 1986 er fjernet pga dårlig kvalitet.1985 heller er ikke ok.
2442 Neiden 19121900/91 1978 1953
x x
Overføring ut på 64,2 km2 begynte etter 1952, men usikkert når. I praksis uregulert. Sporadiske flomtap.
2469 Sametielv 19621976? 1962
2473 Karpelva 19271942/43 1946 Mangler data høst 1944 til sommer 1946.
3075 Murusjø 19251945 1925
3077 Landbru limn. 1943OK 1943
Avløp fra karstområde, kalkfjell med mange forsenkninger og grotter. Målestasjonen ligger nedenfor utløpet "Landbru" som er en grotte (tunnel) på ca 150m. Vannet går ned i undergrunnen innerst i grotten for å komme opp i kulpen hvor målestasjonen ligger.
3081 Lenglingen 19251971 1925
x x
3114 Femundsenden (Femunden)
18961983/84 1896
Brukbar også for flom. Overføring ut fra nordenden av Femunden. Overføringen er av liten betydning. 1896-1916 ble det utført målinger av overføringen. Det ble anslått at overføringen var 27 millioner m3 i året i gjennomsnitt, hvilket tilsvarer en årlig middelvannføring på 0.86m3/s. Det er tvilsomt om overføringen har vært så stor i senere tid. Kanalen er ombygget i flere omganger, senest i 1996. Fløting av tømmer frem til ca. 1970.

Reg
ine
no
Mai
n no
Stat
ion
nam
e
Rec
ord
star
t
Hom
ogen
ity b
reak
Con
nect
ion
year
Ref
eren
ce s
erie
s st
art
Are
a ch
ange
(km
2 )
Vary
ing
area
Not
spr
ing
flood
Not
floo
ds
Not
win
ter l
owflo
w
Not
low
flow
s
Not
mon
thly
flow
Not
sea
sona
l flo
w
Not
ann
ual f
ow
Com
men
t
3116 Nybergsund OK 1973, 2000
Overføringen ut i hele perioden, men ubetydelig også for lavvann. 1896-1916 i middel 0,86 m2/s, sannsynligvis mindre etterpå.
311460Engeren 1911
OK for stasjoner i samme vassdrag. Ellers evt. 1933, 58, 69?
1941 Magasinering f.o.m. 1941, men ubetydelig.
31310 Magnor 19121958, 1980 1969, 1972, 1981
1980
x
Påvirket av "Glommas bifurkasjon ved Kongsvinger" (NVE-rapport 1-2001) ved Q > middleflom.

Denne serien utgis av Norges vassdrags- og energidirektorat (NVE)
Utgitt i Rapportserien i 2013Nr. 1 Roller i det nasjonale arbeidet med håndtering av naturfarer for tre samarbeidende direktorat
Nr. 2 Norwegian Hydrological Reference Dataset for Climate Change Studies. Anne K. Fleig (Ed.)


Norges vassdrags- og energidirektorat
Middelthunsgate 29Postboks 5091 Majorstuen0301 Oslo
Telefon: 09575 Internett: www.nve.no