Embed Size (px)
Citation preview


2
Note 1 : The financials of ABNL are consolidated financials prepared as per Ind-AS for FY16 & FY17 unless otherwise specified
Note 2 : The financial figures in this presentation have been rounded off to the nearest ` 1 Crore
Note 3 : 1 USD = INR 65
Glossary
CY – Current Year
FY – Financial Year (April-March)
PY – Corresponding period in Previous Year
PQ – Previous Quarter
Q1– April-June
Q2– July-September
Q3 – October - December
Q4 – January - March
YTD – Year to date
LAS – Loan against Shares
NIM – Net Interest Margin
DPD – Days past due
CAB – Corporate Agents and Brokers
RMS – Revenue Market Share
ROACE – Return on Avg. Operating Capital Employed based on EBIT
VLR – Visitor Location Register
VAS – Value Added Services
TPA – Tons per annum
AAUM – Quarterly Average Assets under Management
FYP – First Year Premium Income
PPI – Prepaid Payment Instrument
Banca - Bancassurance
Key Highlights 3 – 8
Business-wise Performance 9 – 26
Financials and other Annexure 27 – 44
3
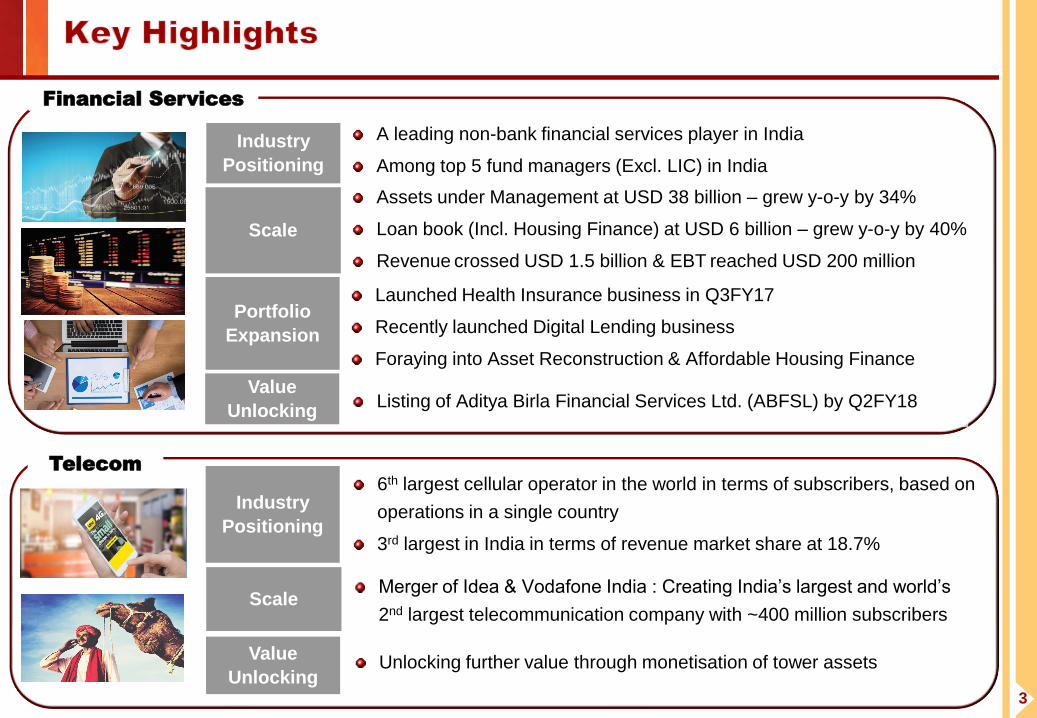
Financial Services
Industry
Positioning
A leading non-bank financial services player in India
Among top 5 fund managers (Excl. LIC) in India
Scale
Assets under Management at USD 38 billion – grew y-o-y by 34%
Loan book (Incl. Housing Finance) at USD 6 billion – grew y-o-y by 40%
Revenue crossed USD 1.5 billion & EBT reached USD 200 million
Portfolio
Expansion
Launched Health Insurance business in Q3FY17
Recently launched Digital Lending business
Foraying into Asset Reconstruction & Affordable Housing Finance
Value
Unlocking Listing of Aditya Birla Financial Services Ltd. (ABFSL) by Q2FY18
Telecom
Industry
Positioning
6th largest cellular operator in the world in terms of subscribers, based on
operations in a single country
3rd largest in India in terms of revenue market share at 18.7%
Scale Merger of Idea & Vodafone India : Creating India’s largest and world’s
2nd largest telecommunication company with ~400 million subscribers
Value
Unlocking Unlocking further value through monetisation of tower assets
4
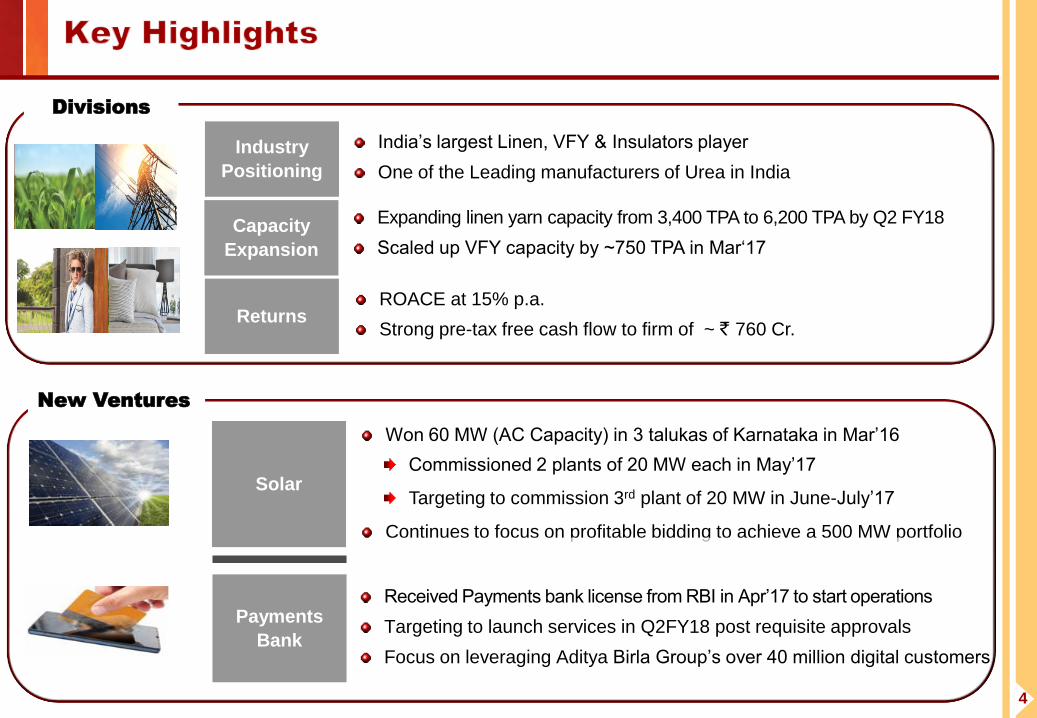
Divisions
New Ventures
Industry
Positioning
India’s largest Linen, VFY & Insulators player
One of the Leading manufacturers of Urea in India
Capacity
Expansion
Expanding linen yarn capacity from 3,400 TPA to 6,200 TPA by Q2 FY18
Scaled up VFY capacity by ~750 TPA in Mar‘17
Returns ROACE at 15% p.a.
Strong pre-tax free cash flow to firm of ~ ` 760 Cr.
Solar
Won 60 MW (AC Capacity) in 3 talukas of Karnataka in Mar’16
Commissioned 2 plants of 20 MW each in May’17
Targeting to commission 3rd plant of 20 MW in June-July’17
Continues to focus on profitable bidding to achieve a 500 MW portfolio
Payments
Bank
Received Payments bank license from RBI in Apr’17 to start operations
Targeting to launch services in Q2FY18 post requisite approvals
Focus on leveraging Aditya Birla Group’s over 40 million digital customers
5
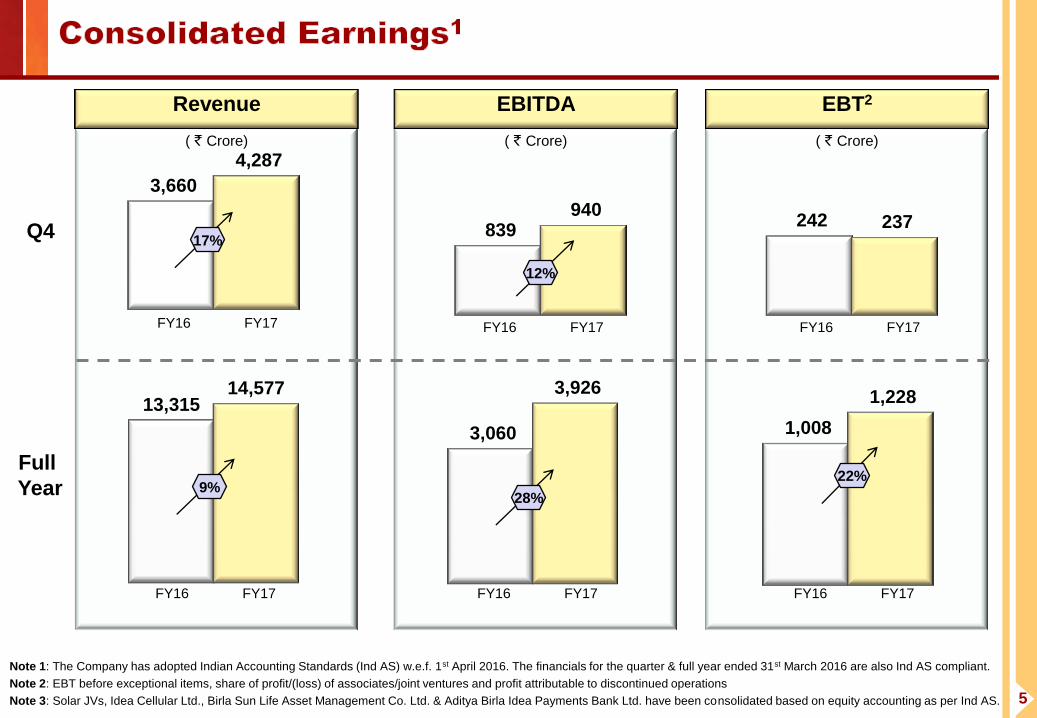
Note 1: The Company has adopted Indian Accounting Standards (Ind AS) w.e.f. 1st April 2016. The financials for the quarter & full year ended 31st March 2016 are also Ind AS compliant.
Note 2: EBT before exceptional items, share of profit/(loss) of associates/joint ventures and profit attributable to discontinued operations
Note 3: Solar JVs, Idea Cellular Ltd., Birla Sun Life Asset Management Co. Ltd. & Aditya Birla Idea Payments Bank Ltd. have been consolidated based on equity accounting as per Ind AS.
Revenue
( ` Crore)
3,660
4,287
FY16 FY17
17%
13,315
14,577
9%
EBITDA
( ` Crore)
839 940
12%
3,060
3,926
28%
EBT2
( ` Crore)
242 237
1,008
1,228
Q4
Full
Year
FY16 FY17 FY16 FY17
FY16 FY17 FY16 FY17 FY16 FY17
22%
6
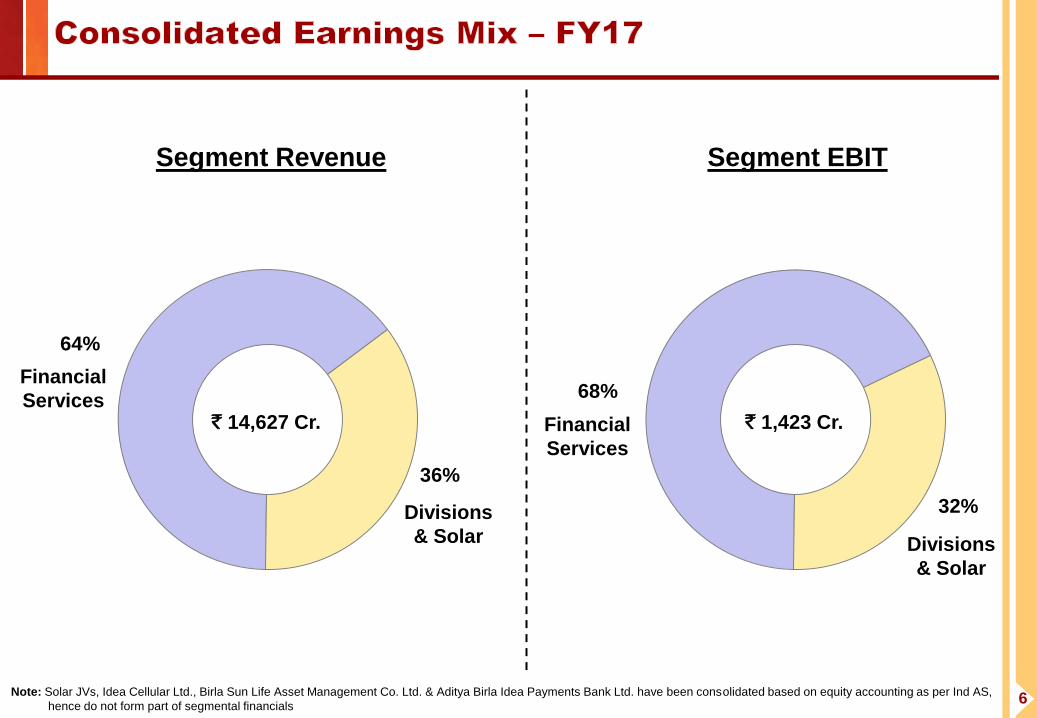
64%
36%
Financial
Services
Divisions
& Solar
Segment Revenue
` 14,627 Cr.
68%
32%
Financial
Services
Divisions
& Solar
Segment EBIT
` 1,423 Cr.
Note: Solar JVs, Idea Cellular Ltd., Birla Sun Life Asset Management Co. Ltd. & Aditya Birla Idea Payments Bank Ltd. have been consolidated based on equity accounting as per Ind AS,
hence do not form part of segmental financials
7
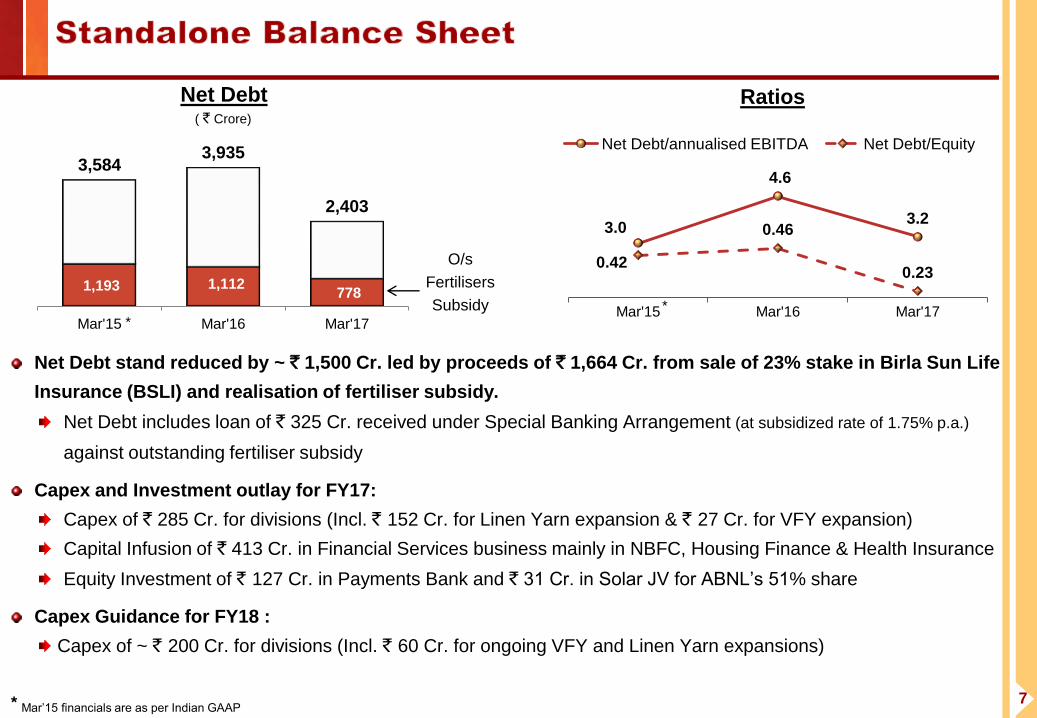
Net Debt stand reduced by ~ ` 1,500 Cr. led by proceeds of ` 1,664 Cr. from sale of 23% stake in Birla Sun Life
Insurance (BSLI) and realisation of fertiliser subsidy.
Net Debt includes loan of ` 325 Cr. received under Special Banking Arrangement (at subsidized rate of 1.75% p.a.)
against outstanding fertiliser subsidy
Capex and Investment outlay for FY17:
Capex of ` 285 Cr. for divisions (Incl. ` 152 Cr. for Linen Yarn expansion & ` 27 Cr. for VFY expansion)
Capital Infusion of ` 413 Cr. in Financial Services business mainly in NBFC, Housing Finance & Health Insurance
Equity Investment of ` 127 Cr. in Payments Bank and ` 31 Cr. in Solar JV for ABNL’s 51% share
Capex Guidance for FY18 :
Capex of ~ ` 200 Cr. for divisions (Incl. ` 60 Cr. for ongoing VFY and Linen Yarn expansions)
Ratios
1,193 1,112 778
3,584 3,935
2,403
Mar'15 Mar'16 Mar'17
Net Debt ( ` Crore)
O/s
Fertilisers
Subsidy
3.0
4.6
3.2
0.42
0.46
0.23
Mar'15 Mar'16 Mar'17
Net Debt/annualised EBITDA Net Debt/Equity
* Mar’15 financials are as per Indian GAAP
* *
8
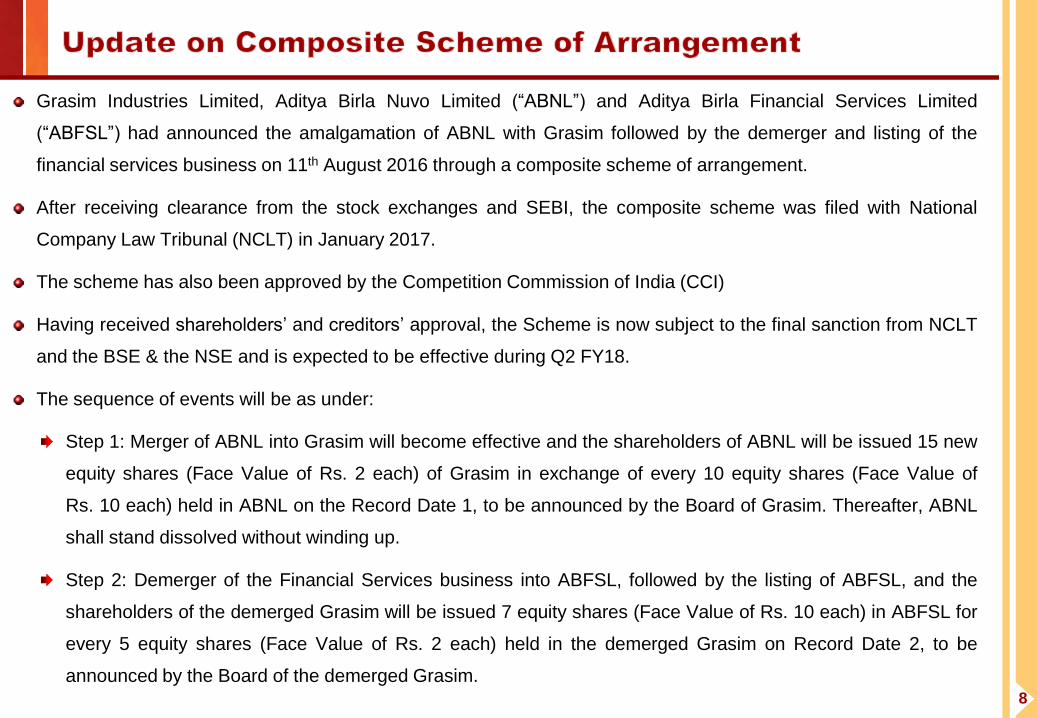
Grasim Industries Limited, Aditya Birla Nuvo Limited (“ABNL”) and Aditya Birla Financial Services Limited
(“ABFSL”) had announced the amalgamation of ABNL with Grasim followed by the demerger and listing of the
financial services business on 11th August 2016 through a composite scheme of arrangement.
After receiving clearance from the stock exchanges and SEBI, the composite scheme was filed with National
Company Law Tribunal (NCLT) in January 2017.
The scheme has also been approved by the Competition Commission of India (CCI)
Having received shareholders’ and creditors’ approval, the Scheme is now subject to the final sanction from NCLT
and the BSE & the NSE and is expected to be effective during Q2 FY18.
The sequence of events will be as under:
Step 1: Merger of ABNL into Grasim will become effective and the shareholders of ABNL will be issued 15 new
equity shares (Face Value of Rs. 2 each) of Grasim in exchange of every 10 equity shares (Face Value of
Rs. 10 each) held in ABNL on the Record Date 1, to be announced by the Board of Grasim. Thereafter, ABNL
shall stand dissolved without winding up.
Step 2: Demerger of the Financial Services business into ABFSL, followed by the listing of ABFSL, and the
shareholders of the demerged Grasim will be issued 7 equity shares (Face Value of Rs. 10 each) in ABFSL for
every 5 equity shares (Face Value of Rs. 2 each) held in the demerged Grasim on Record Date 2, to be
announced by the Board of the demerged Grasim.
9
Performance highlights : FY 2016-17
10
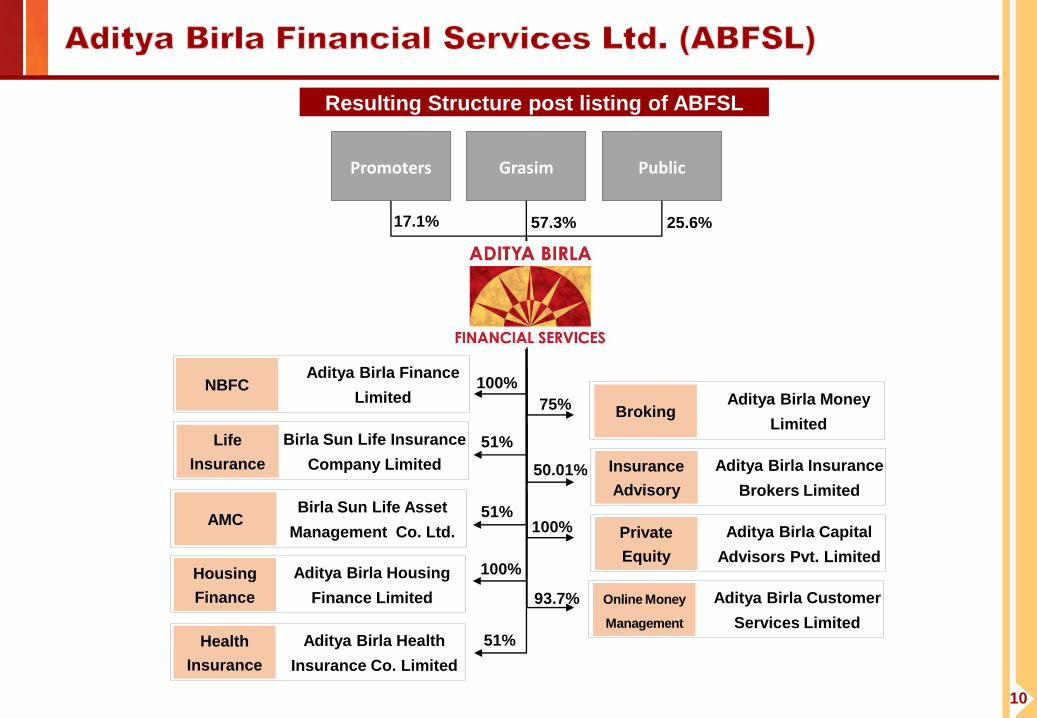
Public Promoters Grasim
17.1% 57.3% 25.6%
100%
51%
51%
51%
100%
Resulting Structure post listing of ABFSL
NBFC Aditya Birla Finance
Limited
Life
Insurance
Birla Sun Life Insurance
Company Limited
AMC Birla Sun Life Asset
Management Co. Ltd.
Housing
Finance
Aditya Birla Housing
Finance Limited
Health
Insurance
Aditya Birla Health
Insurance Co. Limited
Broking Aditya Birla Money
Limited
75%
Insurance
Advisory
Aditya Birla Insurance
Brokers Limited
50.01%
Private
Equity
Aditya Birla Capital
Advisors Pvt. Limited
100%
Online Money
Management
Aditya Birla Customer
Services Limited
93.7%
11
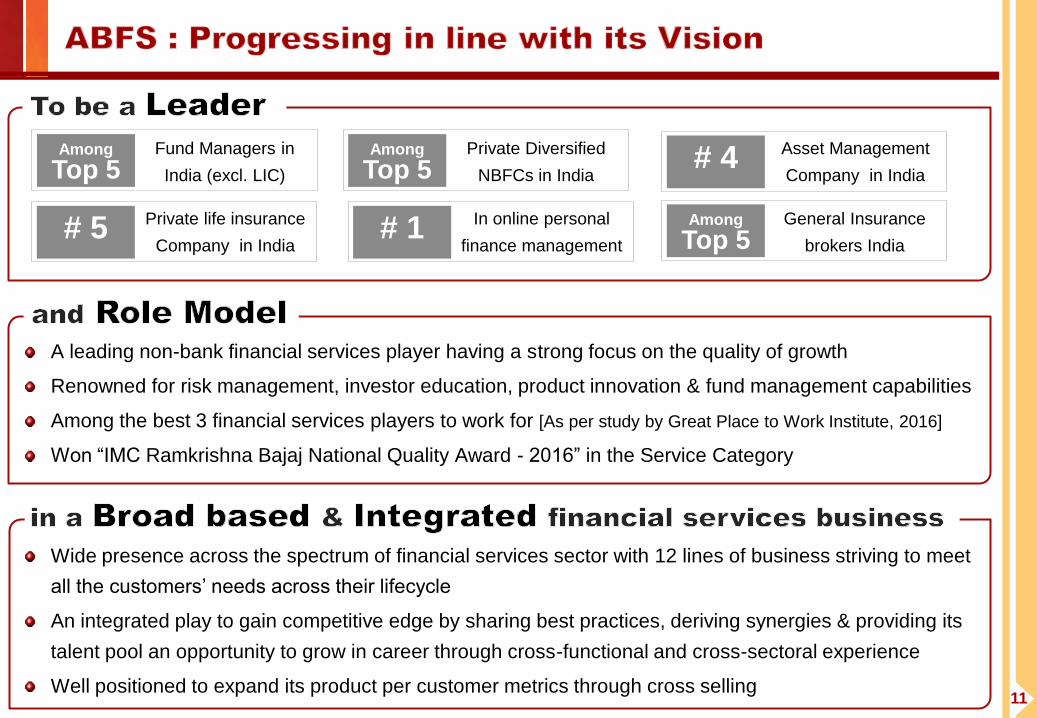
Among
Top 5 Fund Managers in
India (excl. LIC)
# 5 Private life insurance
Company in India
# 4 Asset Management
Company in India
Among
Top 5 Private Diversified
NBFCs in India
Among
Top 5 General Insurance
brokers India # 1 In online personal
finance management
A leading non-bank financial services player having a strong focus on the quality of growth
Renowned for risk management, investor education, product innovation & fund management capabilities
Among the best 3 financial services players to work for [As per study by Great Place to Work Institute, 2016]
Won “IMC Ramkrishna Bajaj National Quality Award - 2016” in the Service Category
Wide presence across the spectrum of financial services sector with 12 lines of business striving to meet
all the customers’ needs across their lifecycle
An integrated play to gain competitive edge by sharing best practices, deriving synergies & providing its
talent pool an opportunity to grow in career through cross-functional and cross-sectoral experience
Well positioned to expand its product per customer metrics through cross selling

12
EBT reaches USD 200 million Revenue crosses USD 1.5 billion
Lending Book reaches USD 6 billion
(incl. Housing Finance)
AUM1 reaches USD 38 billion
86,709
184,617 246,759
Mar'12 Mar'16 Mar'17
CAGR 23%
1Includes AUM of Life Insurance, Health Insurance, Private Equity & quarterly AAUM of Asset Management businesses
(` Crore)
3,624
27,728
38,839
FY12 FY16 FY17
CAGR 61%
600 906
1,220
FY12 FY16 FY17 *
* FY12 financials are as per Indian GAAP
*
6,542 8,420
10,341
FY12 FY16 FY17
13
Broadening and deepening of the portfolio to meet all the customers’ needs across their lifecycle
Launched Health Insurance business operations in Nov’16
Within 3 months of launch, Digital Lending segment has built a loan book ` 70 Cr.
Foraying into new business segments
Asset Reconstruction Company
Affordable Housing Finance
Corporate Action
ABNL has transferred its 51% stake in BSLI to ABFSL in Mar’17, post receipt of the requisite approvals
Listing of ABFSL, targeted in Q2FY18, will unlock value for the shareholders
14
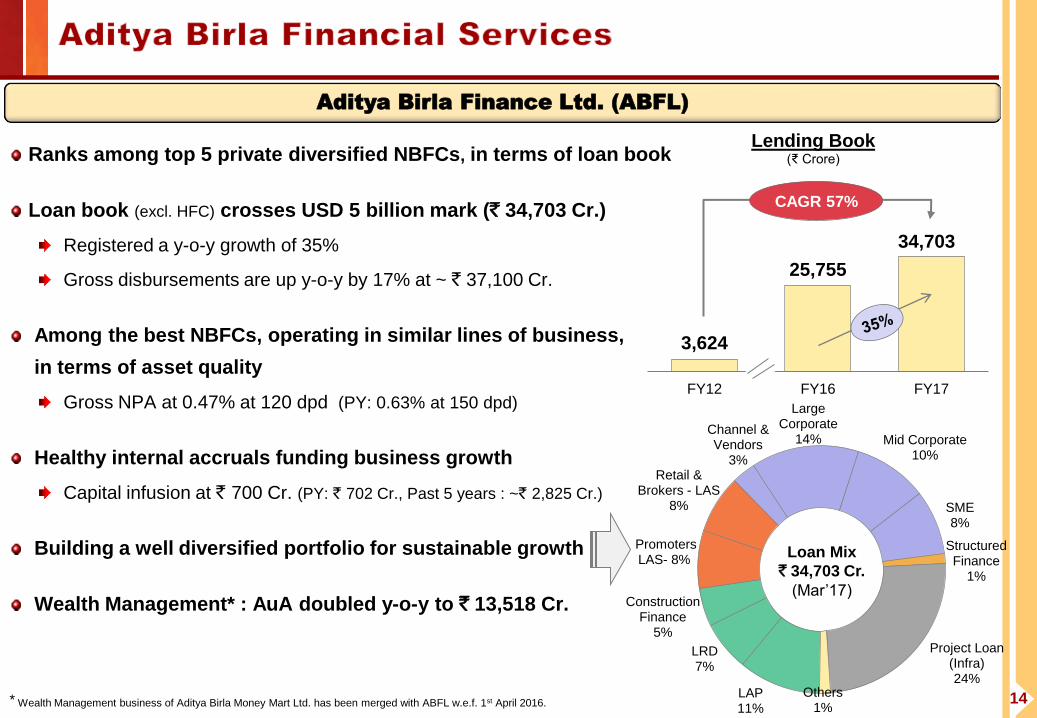
Ranks among top 5 private diversified NBFCs, in terms of loan book
Loan book (excl. HFC) crosses USD 5 billion mark (` 34,703 Cr.)
Registered a y-o-y growth of 35%
Gross disbursements are up y-o-y by 17% at ~ ` 37,100 Cr.
Among the best NBFCs, operating in similar lines of business,
in terms of asset quality
Gross NPA at 0.47% at 120 dpd (PY: 0.63% at 150 dpd)
Healthy internal accruals funding business growth
Capital infusion at ` 700 Cr. (PY: ` 702 Cr., Past 5 years : ~` 2,825 Cr.)
Building a well diversified portfolio for sustainable growth
Wealth Management* : AuA doubled y-o-y to ` 13,518 Cr.
Aditya Birla Finance Ltd. (ABFL)
LAP 11%
LRD 7%
Construction Finance
5%
Promoters LAS- 8%
Retail & Brokers - LAS
8%
Channel & Vendors
3%
Large Corporate
14% Mid Corporate 10%
SME 8%
Structured Finance
1%
Project Loan (Infra) 24%
Others 1%
Loan Mix
` 34,703 Cr.
(Mar’17)
3,624
25,755
34,703
FY12 FY16 FY17
Lending Book (₹ Crore)
CAGR 57%
* Wealth Management business of Aditya Birla Money Mart Ltd. has been merged with ABFL w.e.f. 1st April 2016.
15
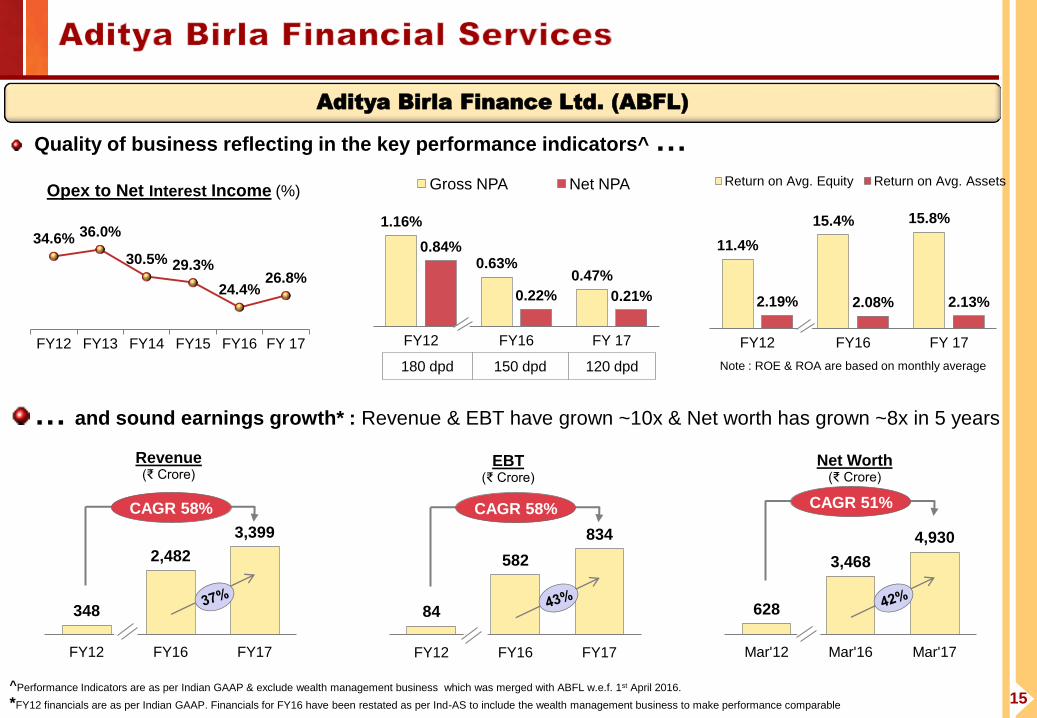
Quality of business reflecting in the key performance indicators^ …
… and sound earnings growth* : Revenue & EBT have grown ~10x & Net worth has grown ~8x in 5 years
Aditya Birla Finance Ltd. (ABFL)
Opex to Net Interest Income (%)
34.6% 36.0%
30.5% 29.3%
24.4% 26.8%
FY12 FY13 FY14 FY15 FY16 FY 17
11.4%
15.4% 15.8%
2.19% 2.08% 2.13%
FY12 FY16 FY 17
Return on Avg. Equity Return on Avg. Assets
1.16%
0.63% 0.47%
0.84%
0.22% 0.21%
FY12 FY16 FY 17
Gross NPA Net NPA
180 dpd 150 dpd 120 dpd
348
2,482
3,399
FY12 FY16 FY17
Revenue (₹ Crore)
CAGR 58%
84
582
834
FY12 FY16 FY17
EBT (₹ Crore)
CAGR 58%
628
3,468
4,930
Mar'12 Mar'16 Mar'17
Net Worth (₹ Crore)
CAGR 51%
*FY12 financials are as per Indian GAAP. Financials for FY16 have been restated as per Ind-AS to include the wealth management business to make performance comparable
Note : ROE & ROA are based on monthly average
^Performance Indicators are as per Indian GAAP & exclude wealth management business which was merged with ABFL w.e.f. 1st April 2016.
16
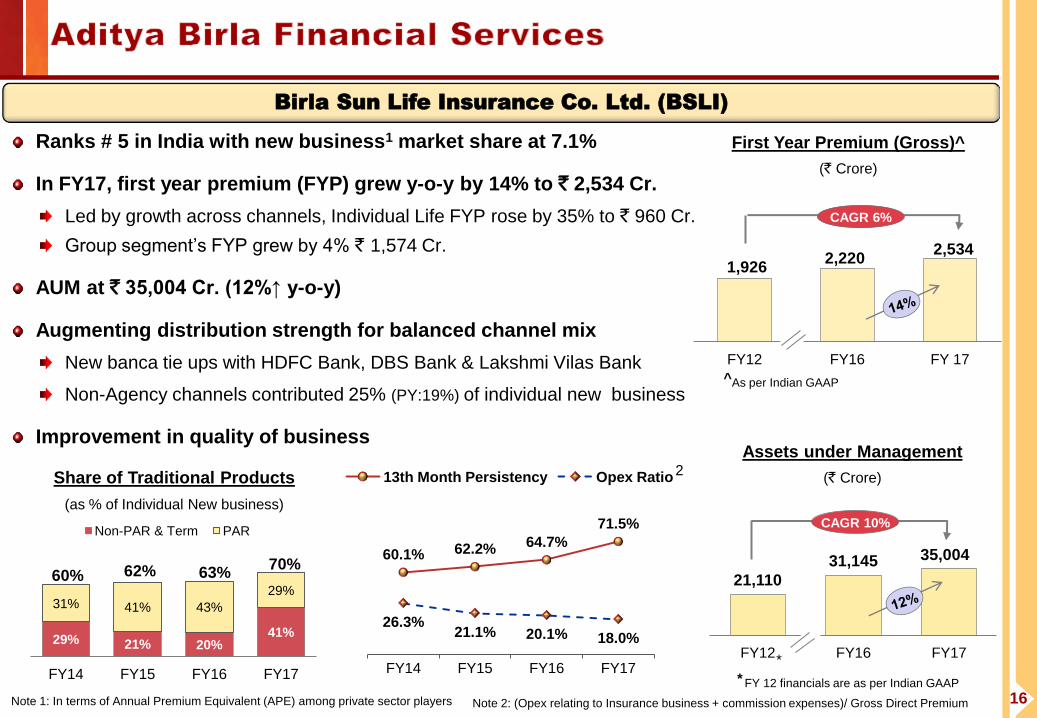
Birla Sun Life Insurance Co. Ltd. (BSLI)
Ranks # 5 in India with new business1 market share at 7.1%
In FY17, first year premium (FYP) grew y-o-y by 14% to ` 2,534 Cr.
Led by growth across channels, Individual Life FYP rose by 35% to ` 960 Cr.
Group segment’s FYP grew by 4% ` 1,574 Cr.
AUM at ` 35,004 Cr. (12%↑ y-o-y)
Augmenting distribution strength for balanced channel mix
New banca tie ups with HDFC Bank, DBS Bank & Lakshmi Vilas Bank
Non-Agency channels contributed 25% (PY:19%) of individual new business
Improvement in quality of business
Note 1: In terms of Annual Premium Equivalent (APE) among private sector players Note 2: (Opex relating to Insurance business + commission expenses)/ Gross Direct Premium
1,926 2,220
2,534
FY12 FY16 FY 17
CAGR 6%
First Year Premium (Gross)^
(` Crore)
60.1% 62.2% 64.7%
71.5%
26.3% 21.1% 20.1% 18.0%
FY14 FY15 FY16 FY17
13th Month Persistency Opex Ratio
29% 21% 20% 41%
31% 41% 43%
29%
FY14 FY15 FY16 FY17
Non-PAR & Term PAR
60% 62% 63% 70%
Share of Traditional Products
(as % of Individual New business)
2
* FY 12 financials are as per Indian GAAP
21,110
31,145 35,004
FY12 FY16 FY17
CAGR 10%
Assets under Management
(` Crore)
*
^As per Indian GAAP
17
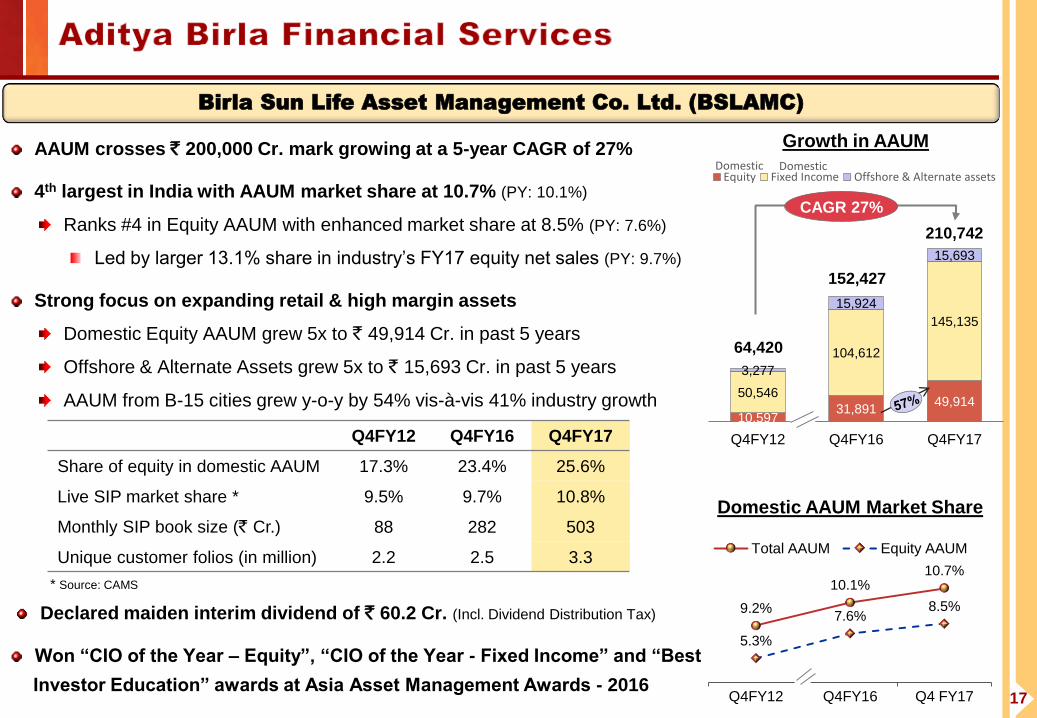
AAUM crosses ` 200,000 Cr. mark growing at a 5-year CAGR of 27%
4th largest in India with AAUM market share at 10.7% (PY: 10.1%)
Ranks #4 in Equity AAUM with enhanced market share at 8.5% (PY: 7.6%)
Led by larger 13.1% share in industry’s FY17 equity net sales (PY: 9.7%)
Strong focus on expanding retail & high margin assets
Domestic Equity AAUM grew 5x to ` 49,914 Cr. in past 5 years
Offshore & Alternate Assets grew 5x to ` 15,693 Cr. in past 5 years
AAUM from B-15 cities grew y-o-y by 54% vis-à-vis 41% industry growth
Declared maiden interim dividend of ` 60.2 Cr. (Incl. Dividend Distribution Tax)
Won “CIO of the Year – Equity”, “CIO of the Year - Fixed Income” and “Best
Investor Education” awards at Asia Asset Management Awards - 2016
Birla Sun Life Asset Management Co. Ltd. (BSLAMC)
Q4FY12 Q4FY16 Q4FY17
Share of equity in domestic AAUM 17.3% 23.4% 25.6%
Live SIP market share * 9.5% 9.7% 10.8%
Monthly SIP book size (` Cr.) 88 282 503
Unique customer folios (in million) 2.2 2.5 3.3
10,597 31,891
49,914 50,546
104,612
145,135
3,277
15,924
15,693
Q4FY12 Q4FY16 Q4FY17
Growth in AAUM
Equity Fixed Income Offshore & Alternate assets
CAGR 27%
Domestic Domestic
64,420
152,427
210,742
9.2%
10.1% 10.7%
5.3%
7.6% 8.5%
Q4FY12 Q4FY16 Q4 FY17
Total AAUM Equity AAUM
Domestic AAUM Market Share
* Source: CAMS
18
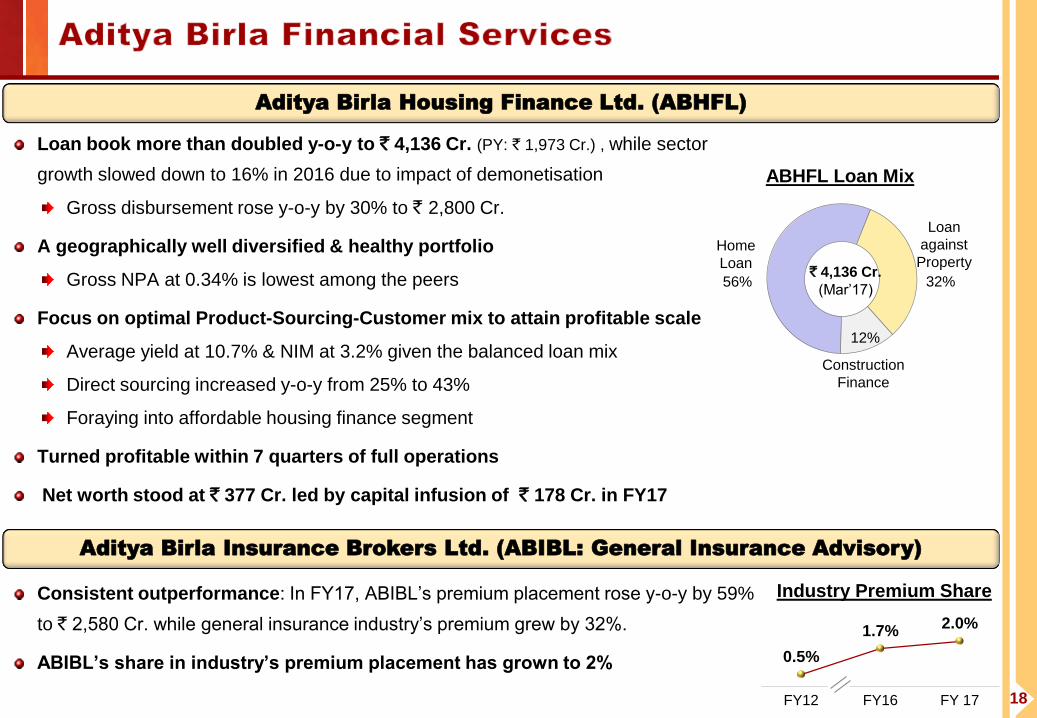
Loan book more than doubled y-o-y to ` 4,136 Cr. (PY: ` 1,973 Cr.) , while sector
growth slowed down to 16% in 2016 due to impact of demonetisation
Gross disbursement rose y-o-y by 30% to ` 2,800 Cr.
A geographically well diversified & healthy portfolio
Gross NPA at 0.34% is lowest among the peers
Focus on optimal Product-Sourcing-Customer mix to attain profitable scale
Average yield at 10.7% & NIM at 3.2% given the balanced loan mix
Direct sourcing increased y-o-y from 25% to 43%
Foraying into affordable housing finance segment
Turned profitable within 7 quarters of full operations
Net worth stood at ` 377 Cr. led by capital infusion of ` 178 Cr. in FY17
Consistent outperformance: In FY17, ABIBL’s premium placement rose y-o-y by 59%
to ` 2,580 Cr. while general insurance industry’s premium grew by 32%.
ABIBL’s share in industry’s premium placement has grown to 2%
56% 32%
12%
Construction
Finance
Loan
against
Property Home
Loan
ABHFL Loan Mix
` 4,136 Cr.
(Mar’17)
Aditya Birla Housing Finance Ltd. (ABHFL)
Aditya Birla Insurance Brokers Ltd. (ABIBL: General Insurance Advisory)
0.5%
1.7% 2.0%
FY12 FY16 FY 17
Industry Premium Share
19
Commenced operations with a differentiated business model in Nov’16
Gross Premium at ` 54 Cr. covering > 2 lacs lives across Group & Retail segments
Won ‘New Insurance product of the year’ by ‘World Health and Wellness Congress’.
Received ‘Best Digital Integrated Campaign’ and ‘Best Digital Marketing Campaign’
awards at ‘BBC Knowledge National Digital Marketing Awards’ and ‘Abby Bronze’
for ‘The Movekars’ campaign in 2017
Multi channel distribution model activated within 3 months of launch
Tied up with 4 Banks - HDFC Bank, DCB, Ratnakar Bank & Deutsche Bank
Empanelled ~1,800 direct selling agents & over 180 brokers
Tied up with 1,600+ hospitals in 120 cities
Launched Mobile App ‘Activ Health’ for customers
Aditya Birla Health Insurance Co. Ltd. (ABHICL)
Aditya Birla Private Equity (ABPE)
Managing two funds with AUM at ` 1,179 Cr. (gross) and ` 785 Cr. (net after distributions)
Sector agnostic growth Funds, invested in 18 companies
Commenced Exits across both funds: 6 full exits and 5 partial exits. The Multiple of Cost (MOC) ranges are:
MOC over 3x 2 exits MOC 2x-3x 4 exits MOC 1.5x-2x 2 exits
20
In FY17, revenue grew from ` 119 Cr. to ` 125 Cr.
Earning before tax increased from ` 0.3 Cr. to ` 5 Cr.
Digital initiatives to build a “Technology Driven Advisory Platform”
Industry’s first end-to-end Aadhar based paperless e-KYC platform launched for account opening & on-boarding
New advanced web trading platform with few industry first and unique features went live in Jan’17 end
Mobile trading app “Mobile Invest” gaining significant traction
Enjoying trust of over 3.7 million registered users who are managing over ` 200 billion through MyUniverse
Transformed into a multi-product transaction platform with analytics based integrated cross-sell capabilities
Offering a range of financial products viz., Mutual Funds, Personal Loans, Housing Finance, Education Loans,
Life Insurance, Health Insurance, Equity and Credit Cards
Revenue grew from ` 5 Cr. to ` 12 Cr.
Aditya Birla Money Ltd. (ABML : Broking)
MyUniverse : Online Personal Finance Management
21
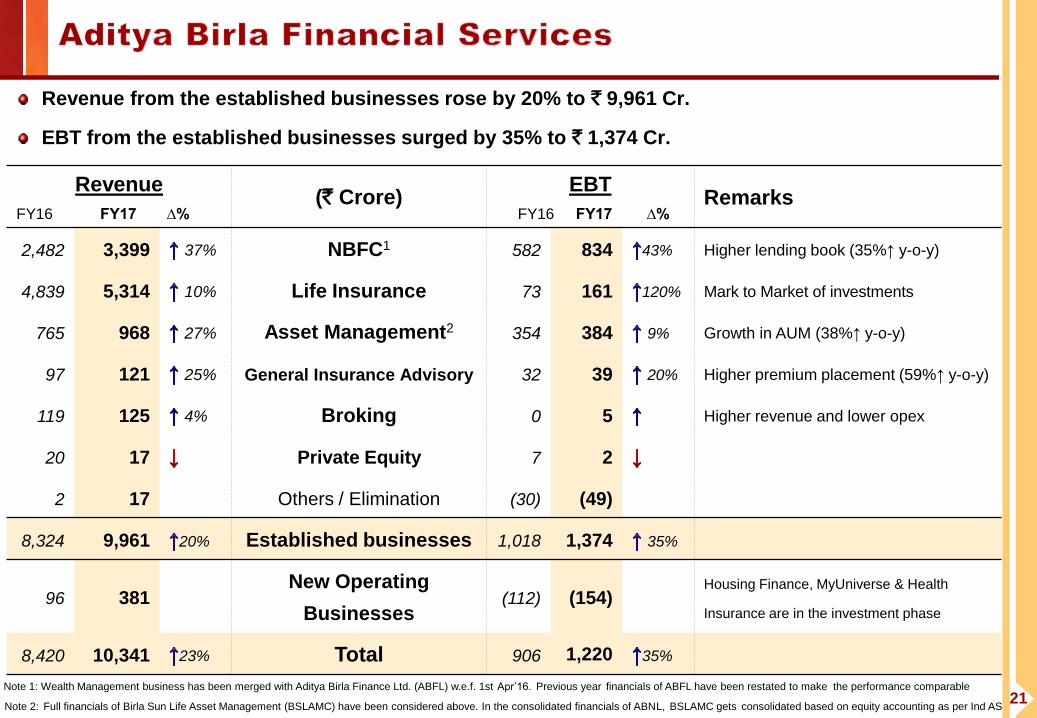
Revenue from the established businesses rose by 20% to ` 9,961 Cr.
EBT from the established businesses surged by 35% to ` 1,374 Cr.
Note 2: Full financials of Birla Sun Life Asset Management (BSLAMC) have been considered above. In the consolidated financials of ABNL, BSLAMC gets consolidated based on equity accounting as per Ind AS
Revenue
FY16 FY17 ∆% (` Crore)
EBT FY16 FY17 ∆%
Remarks
2,482 3,399 37% NBFC1 582 834 43% Higher lending book (35%↑ y-o-y)
4,839 5,314 10% Life Insurance 73 161 120% Mark to Market of investments
765 968 27% Asset Management2 354 384 9% Growth in AUM (38%↑ y-o-y)
97 121 25% General Insurance Advisory 32 39 20% Higher premium placement (59%↑ y-o-y)
119 125 4% Broking 0 5 Higher revenue and lower opex
20 17 Private Equity 7 2
2 17 Others / Elimination (30) (49)
8,324 9,961 20% Established businesses 1,018 1,374 35%
96 381 New Operating
Businesses (112) (154)
Housing Finance, MyUniverse & Health
Insurance are in the investment phase
8,420 10,341 23% Total 906 1,220 35%
Note 1: Wealth Management business has been merged with Aditya Birla Finance Ltd. (ABFL) w.e.f. 1st Apr’16. Previous year financials of ABFL have been restated to make the performance comparable
22
Performance highlights : FY 2016-17
23
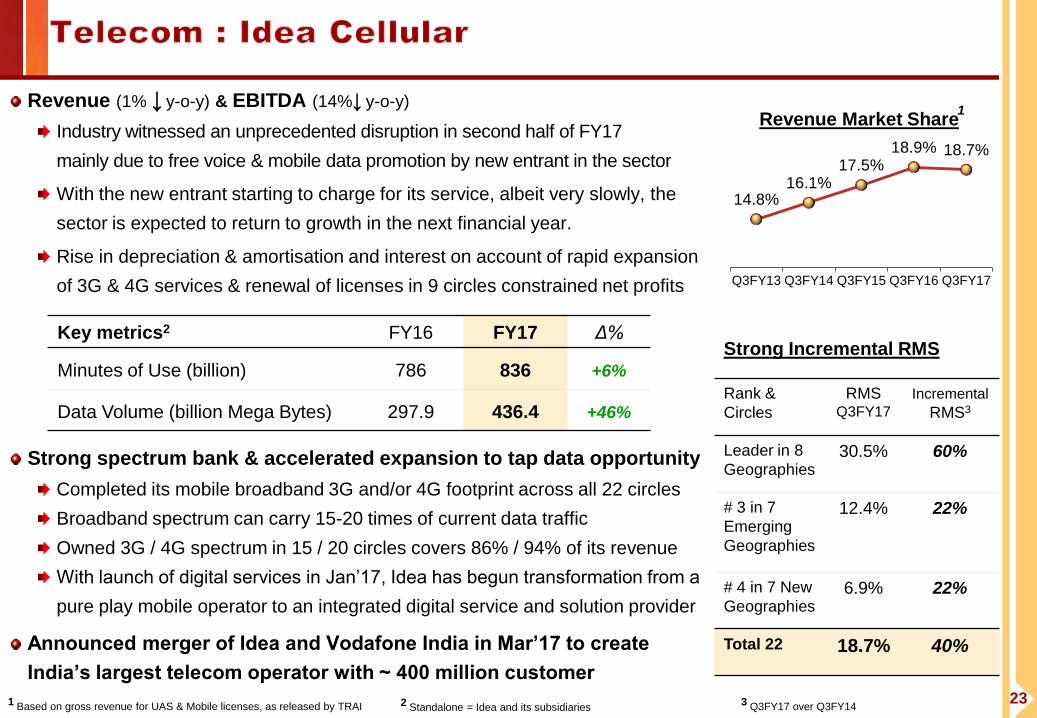
Revenue (1% ↓ y-o-y) & EBITDA (14%↓ y-o-y)
Industry witnessed an unprecedented disruption in second half of FY17
mainly due to free voice & mobile data promotion by new entrant in the sector
With the new entrant starting to charge for its service, albeit very slowly, the
sector is expected to return to growth in the next financial year.
Rise in depreciation & amortisation and interest on account of rapid expansion
of 3G & 4G services & renewal of licenses in 9 circles constrained net profits
Strong spectrum bank & accelerated expansion to tap data opportunity
Completed its mobile broadband 3G and/or 4G footprint across all 22 circles
Broadband spectrum can carry 15-20 times of current data traffic
Owned 3G / 4G spectrum in 15 / 20 circles covers 86% / 94% of its revenue
With launch of digital services in Jan’17, Idea has begun transformation from a
pure play mobile operator to an integrated digital service and solution provider
Announced merger of Idea and Vodafone India in Mar’17 to create
India’s largest telecom operator with ~ 400 million customer
Key metrics2 FY16 FY17 Δ%
Minutes of Use (billion) 786 836 +6%
Data Volume (billion Mega Bytes) 297.9 436.4 +46%
1 Based on gross revenue for UAS & Mobile licenses, as released by TRAI 2 Standalone = Idea and its subsidiaries 3 Q3FY17 over Q3FY14
14.8% 16.1%
17.5% 18.9% 18.7%
Q3FY13 Q3FY14 Q3FY15 Q3FY16 Q3FY17
Revenue Market Share 1
Strong Incremental RMS
Rank &
Circles
RMS Q3FY17
Incremental
RMS3
Leader in 8
Geographies 30.5% 60%
# 3 in 7
Emerging
Geographies
12.4% 22%
# 4 in 7 New
Geographies 6.9% 22%
Total 22 18.7% 40%

24
Performance highlights : FY 2016-17
25
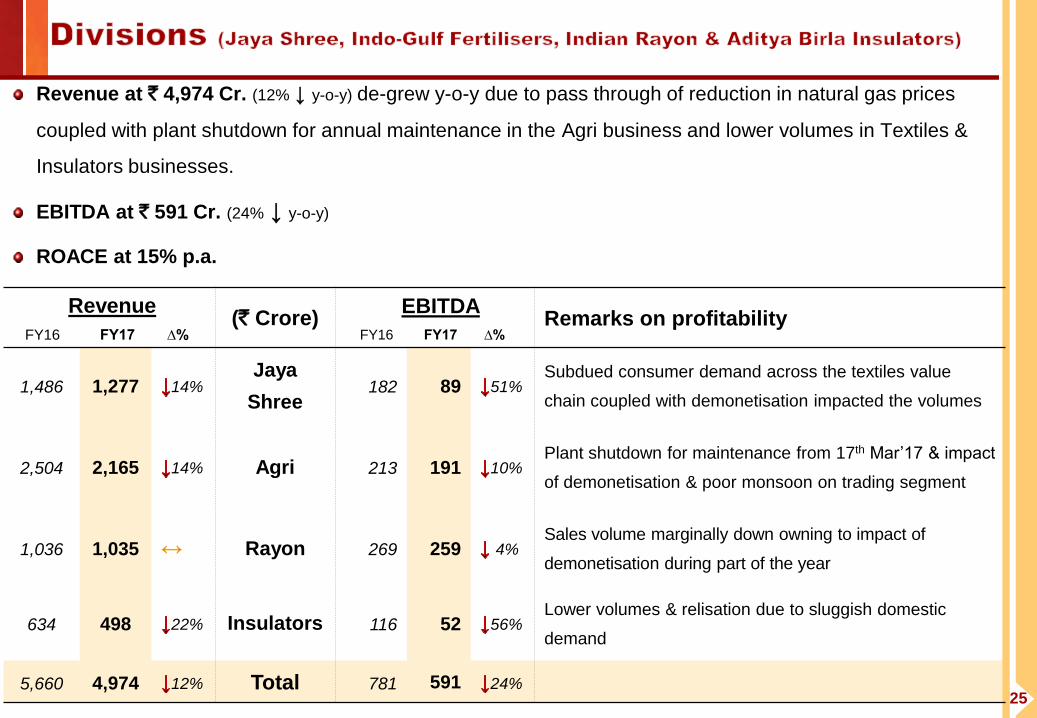
Revenue at ` 4,974 Cr. (12% ↓ y-o-y) de-grew y-o-y due to pass through of reduction in natural gas prices
coupled with plant shutdown for annual maintenance in the Agri business and lower volumes in Textiles &
Insulators businesses.
EBITDA at ` 591 Cr. (24% ↓ y-o-y)
ROACE at 15% p.a.
Revenue
FY16 FY17 ∆% (` Crore)
EBITDA FY16 FY17 ∆%
Remarks on profitability
1,486 1,277 14% Jaya
Shree 182 89 51%
Subdued consumer demand across the textiles value
chain coupled with demonetisation impacted the volumes
2,504 2,165 14% Agri 213 191 10% Plant shutdown for maintenance from 17th Mar’17 & impact
of demonetisation & poor monsoon on trading segment
1,036 1,035 Rayon 269 259 4% Sales volume marginally down owning to impact of
demonetisation during part of the year
634 498 22% Insulators 116 52 56% Lower volumes & relisation due to sluggish domestic
demand
5,660 4,974 12% Total 781 591 24%
26
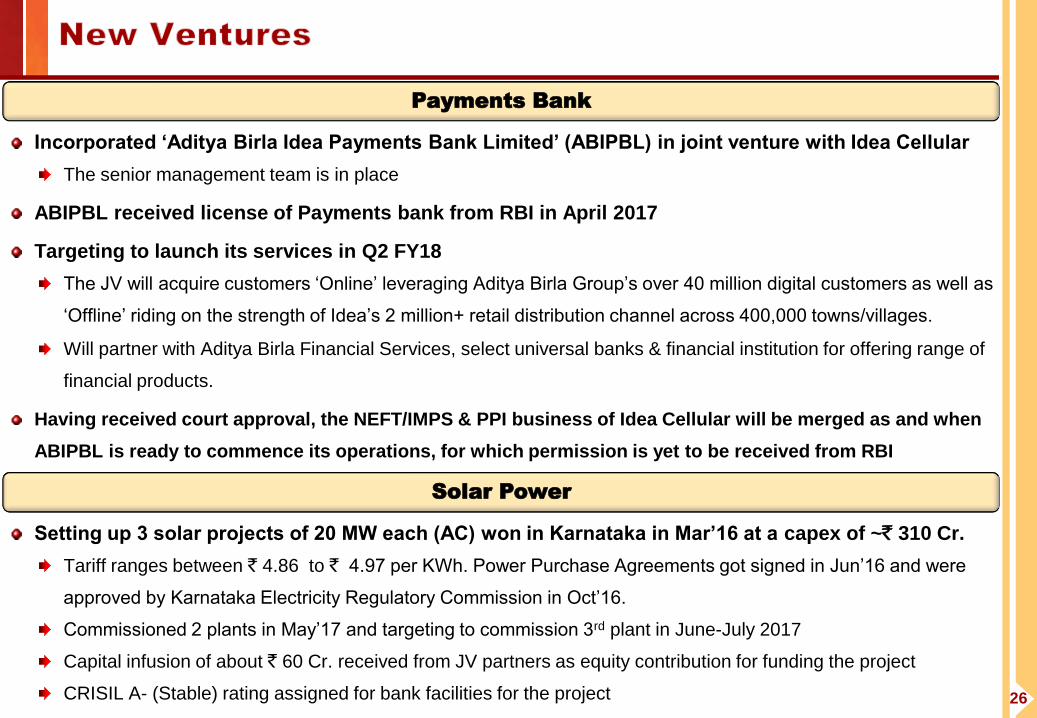
Payments Bank
Incorporated ‘Aditya Birla Idea Payments Bank Limited’ (ABIPBL) in joint venture with Idea Cellular
The senior management team is in place
ABIPBL received license of Payments bank from RBI in April 2017
Targeting to launch its services in Q2 FY18
The JV will acquire customers ‘Online’ leveraging Aditya Birla Group’s over 40 million digital customers as well as
‘Offline’ riding on the strength of Idea’s 2 million+ retail distribution channel across 400,000 towns/villages.
Will partner with Aditya Birla Financial Services, select universal banks & financial institution for offering range of
financial products.
Having received court approval, the NEFT/IMPS & PPI business of Idea Cellular will be merged as and when
ABIPBL is ready to commence its operations, for which permission is yet to be received from RBI
Setting up 3 solar projects of 20 MW each (AC) won in Karnataka in Mar’16 at a capex of ~` 310 Cr.
Tariff ranges between ` 4.86 to ` 4.97 per KWh. Power Purchase Agreements got signed in Jun’16 and were
approved by Karnataka Electricity Regulatory Commission in Oct’16.
Commissioned 2 plants in May’17 and targeting to commission 3rd plant in June-July 2017
Capital infusion of about ` 60 Cr. received from JV partners as equity contribution for funding the project
CRISIL A- (Stable) rating assigned for bank facilities for the project
Solar Power
27
28
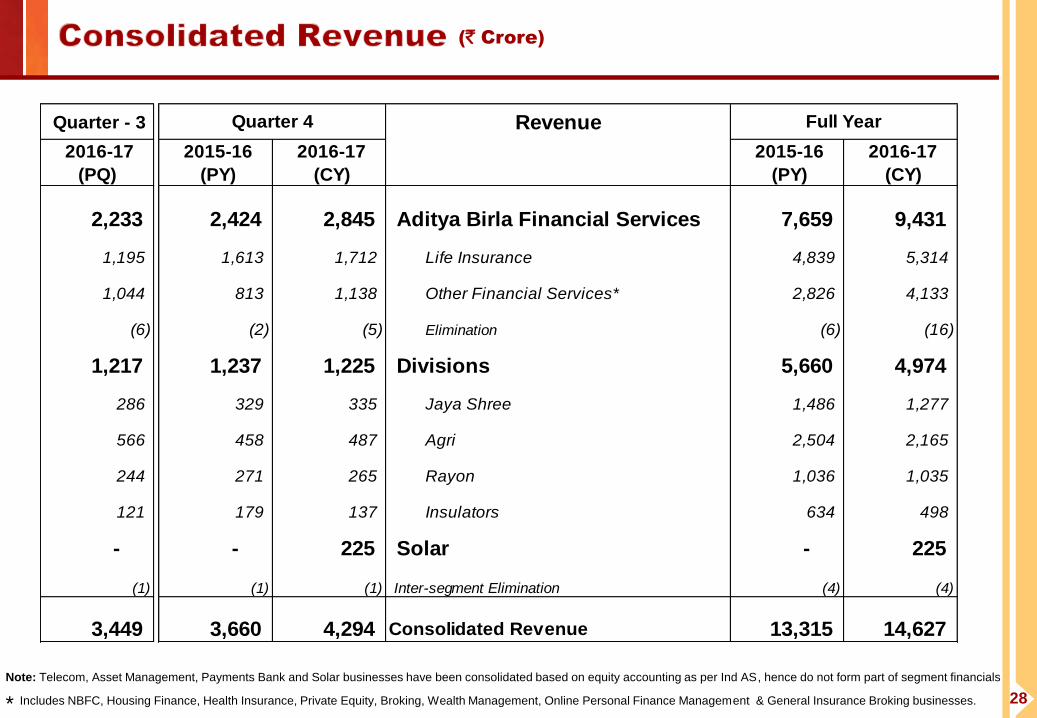
(` Crore)
Note: Telecom, Asset Management, Payments Bank and Solar businesses have been consolidated based on equity accounting as per Ind AS, hence do not form part of segment financials
* Includes NBFC, Housing Finance, Health Insurance, Private Equity, Broking, Wealth Management, Online Personal Finance Management & General Insurance Broking businesses.
Quarter - 3 Revenue
2016-17
(PQ)
2015-16
(PY)
2016-17
(CY)
2015-16
(PY)
2016-17
(CY)
2,233 2,424 2,845 Aditya Birla Financial Services 7,659 9,431
1,195 1,613 1,712 Life Insurance 4,839 5,314
1,044 813 1,138 Other Financial Services* 2,826 4,133
(6) (2) (5) Elimination (6) (16)
1,217 1,237 1,225 Divisions 5,660 4,974
286 329 335 Jaya Shree 1,486 1,277
566 458 487 Agri 2,504 2,165
244 271 265 Rayon 1,036 1,035
121 179 137 Insulators 634 498
- - 225 Solar - 225
(1) (1) (1) Inter-segment Elimination (4) (4)
3,449 3,660 4,294 Consolidated Revenue 13,315 14,627
Quarter 4 Full Year

29
Note: Telecom, Asset Management, Payments Bank and Solar businesses have been consolidated based on equity accounting as per Ind AS, hence do not form part of segment financials
* Includes NBFC, Housing Finance, Health Insurance, Private Equity, Broking, Wealth Management, Online Personal Finance Management , General Insurance Broking businesses.
Interest cost of NBFC business, being an operating expense is deducted from Segment EBIT.
(` Crore)
Quarter - 3 EBIT
2016-17
(PQ)
2015-16
(PY)
2016-17
(CY)
2015-16
(PY)
2016-17
(CY)
231 155 229 Aditya Birla Financial Services 589 963
5 28 80 Life Insurance 73 161
227 126 150 Other Financial Services* 516 802
93 146 46 Divisions 654 450
1 38 4 Jaya Shree 151 56
41 14 1 Agri 178 154
43 67 45 Rayon 226 210
7 27 (4) Insulators 99 29
- - 10 Solar - 10
325 301 286 Segment EBIT 1,243 1,423
Quarter 4 Full Year
30
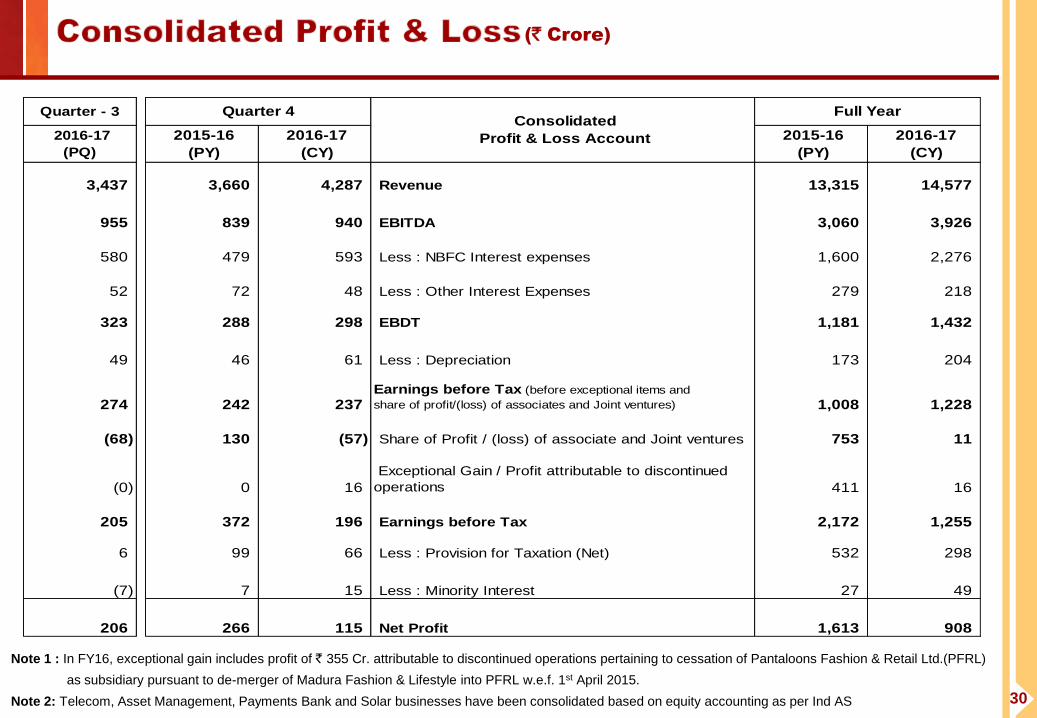
Note 1 : In FY16, exceptional gain includes profit of ` 355 Cr. attributable to discontinued operations pertaining to cessation of Pantaloons Fashion & Retail Ltd.(PFRL)
as subsidiary pursuant to de-merger of Madura Fashion & Lifestyle into PFRL w.e.f. 1st April 2015.
Note 2: Telecom, Asset Management, Payments Bank and Solar businesses have been consolidated based on equity accounting as per Ind AS
(` Crore)
Quarter - 3
2016-17
(PQ)
2015-16
(PY)
2016-17
(CY)
2015-16
(PY)
2016-17
(CY)
3,437 3,660 4,287 Revenue 13,315 14,577
955 839 940 EBITDA 3,060 3,926
580 479 593 Less : NBFC Interest expenses 1,600 2,276
52 72 48 Less : Other Interest Expenses 279 218
323 288 298 EBDT 1,181 1,432
49 46 61 Less : Depreciation 173 204
274 242 237 Earnings before Tax (before exceptional items and
share of profit/(loss) of associates and Joint ventures) 1,008 1,228
(68) 130 (57) Share of Profit / (loss) of associate and Joint ventures 753 11
(0) 0 16
Exceptional Gain / Profit attributable to discontinued
operations 411 16
205 372 196 Earnings before Tax 2,172 1,255
6 99 66 Less : Provision for Taxation (Net) 532 298
(7) 7 15 Less : Minority Interest 27 49
206 266 115 Net Profit 1,613 908
Quarter 4 Full Year Consolidated
Profit & Loss Account
31
(` Crore)
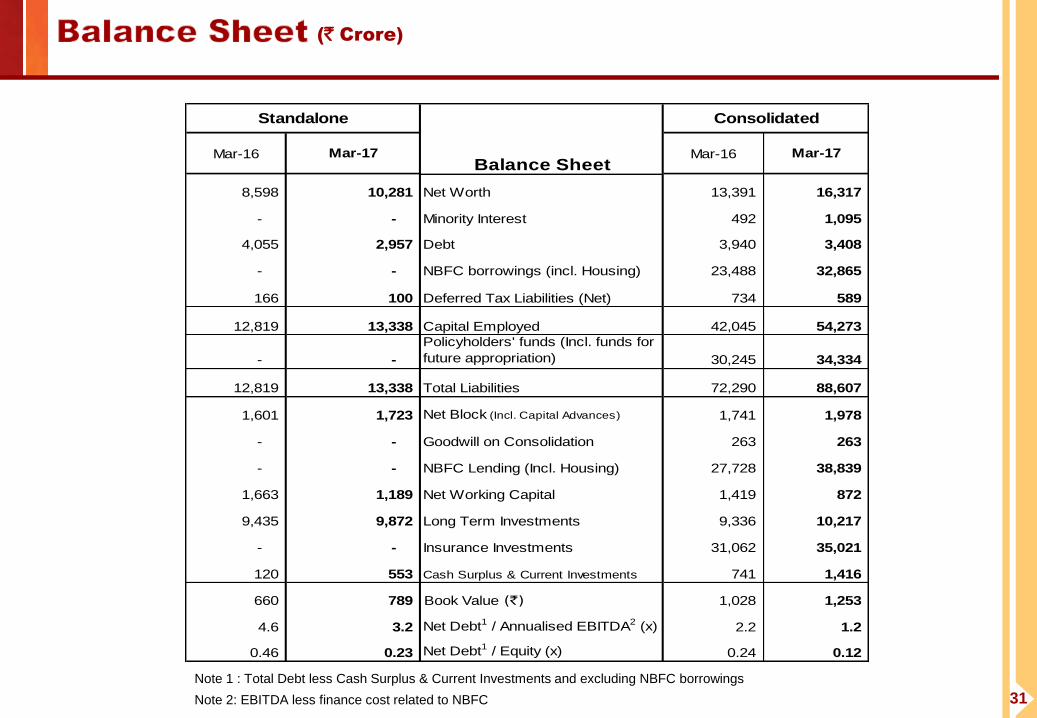
Note 1 : Total Debt less Cash Surplus & Current Investments and excluding NBFC borrowings
Note 2: EBITDA less finance cost related to NBFC
8,598 10,281 Net Worth 13,391 16,317
- - Minority Interest 492 1,095
4,055 2,957 Debt 3,940 3,408
- - NBFC borrowings (incl. Housing) 23,488 32,865
166 100 Deferred Tax Liabilities (Net) 734 589
12,819 13,338 Capital Employed 42,045 54,273
- -
Policyholders' funds (Incl. funds for
future appropriation) 30,245 34,334
12,819 13,338 Total Liabilities 72,290 88,607
1,601 1,723 Net Block (Incl. Capital Advances) 1,741 1,978
- - Goodwill on Consolidation 263 263
- - NBFC Lending (Incl. Housing) 27,728 38,839
1,663 1,189 Net Working Capital 1,419 872
9,435 9,872 Long Term Investments 9,336 10,217
- - Insurance Investments 31,062 35,021
120 553 Cash Surplus & Current Investments 741 1,416
660 789 Book Value (`) 1,028 1,253
4.6 3.2 Net Debt1 / Annualised EBITDA2 (x) 2.2 1.2
0.46 0.23 Net Debt1 / Equity (x) 0.24 0.12
Mar-17Balance Sheet
Mar-16 Mar-17 Mar-16
Standalone Consolidated
32
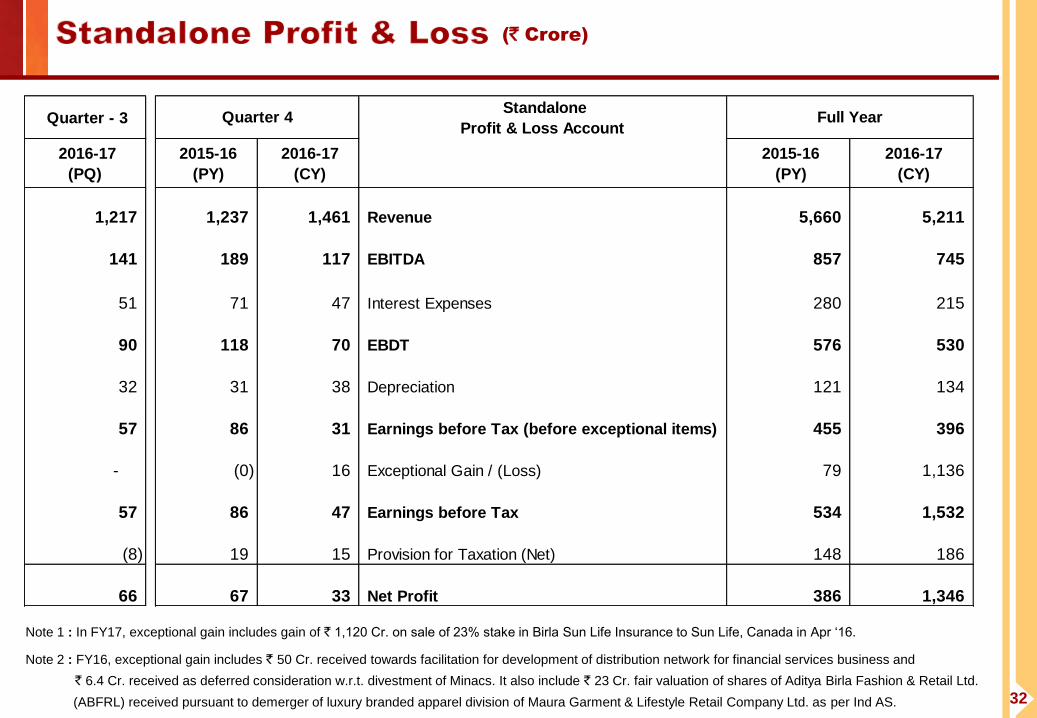
Note 1 : In FY17, exceptional gain includes gain of ` 1,120 Cr. on sale of 23% stake in Birla Sun Life Insurance to Sun Life, Canada in Apr ‘16.
(` Crore)
Note 2 : FY16, exceptional gain includes ` 50 Cr. received towards facilitation for development of distribution network for financial services business and
` 6.4 Cr. received as deferred consideration w.r.t. divestment of Minacs. It also include ` 23 Cr. fair valuation of shares of Aditya Birla Fashion & Retail Ltd.
(ABFRL) received pursuant to demerger of luxury branded apparel division of Maura Garment & Lifestyle Retail Company Ltd. as per Ind AS.
Quarter - 3 Standalone
Profit & Loss Account
2016-17
(PQ)
2015-16
(PY)
2016-17
(CY)
2015-16
(PY)
2016-17
(CY)
1,217 1,237 1,461 Revenue 5,660 5,211
141 189 117 EBITDA 857 745
51 71 47 Interest Expenses 280 215
90 118 70 EBDT 576 530
32 31 38 Depreciation 121 134
57 86 31 Earnings before Tax (before exceptional items) 455 396
- (0) 16 Exceptional Gain / (Loss) 79 1,136
57 86 47 Earnings before Tax 534 1,532
(8) 19 15 Provision for Taxation (Net) 148 186
66 67 33 Net Profit 386 1,346
Full YearQuarter 4

33
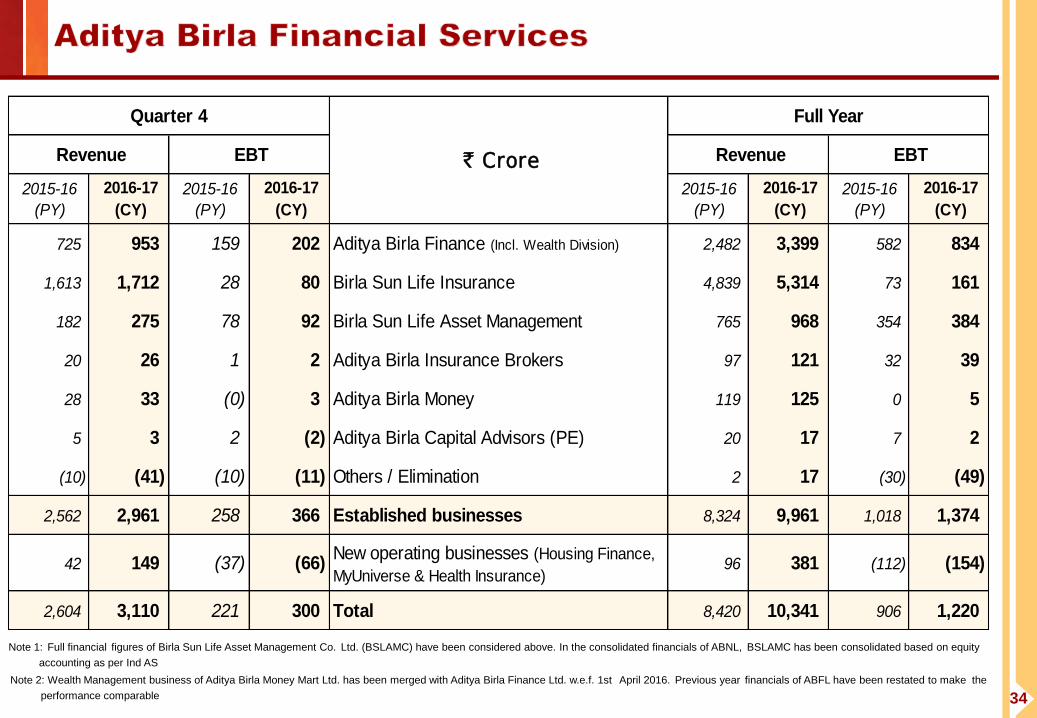
34
Note 1: Full financial figures of Birla Sun Life Asset Management Co. Ltd. (BSLAMC) have been considered above. In the consolidated financials of ABNL, BSLAMC has been consolidated based on equity
accounting as per Ind AS
Note 2: Wealth Management business of Aditya Birla Money Mart Ltd. has been merged with Aditya Birla Finance Ltd. w.e.f. 1st April 2016. Previous year financials of ABFL have been restated to make the
performance comparable
2015-16
(PY)
2016-17
(CY)
2015-16
(PY)
2016-17
(CY)
2015-16
(PY)
2016-17
(CY)
2015-16
(PY)
2016-17
(CY)
725 953 159 202 Aditya Birla Finance (Incl. Wealth Division) 2,482 3,399 582 834
1,613 1,712 28 80 Birla Sun Life Insurance 4,839 5,314 73 161
182 275 78 92 Birla Sun Life Asset Management 765 968 354 384
20 26 1 2 Aditya Birla Insurance Brokers 97 121 32 39
28 33 (0) 3 Aditya Birla Money 119 125 0 5
5 3 2 (2) Aditya Birla Capital Advisors (PE) 20 17 7 2
(10) (41) (10) (11) Others / Elimination 2 17 (30) (49)
2,562 2,961 258 366 Established businesses 8,324 9,961 1,018 1,374
42 149 (37) (66) New operating businesses (Housing Finance,
MyUniverse & Health Insurance)96 381 (112) (154)
2,604 3,110 221 300 Total 8,420 10,341 906 1,220
EBT
Quarter 4 Full Year
Revenue Revenue ` Crore EBT
35
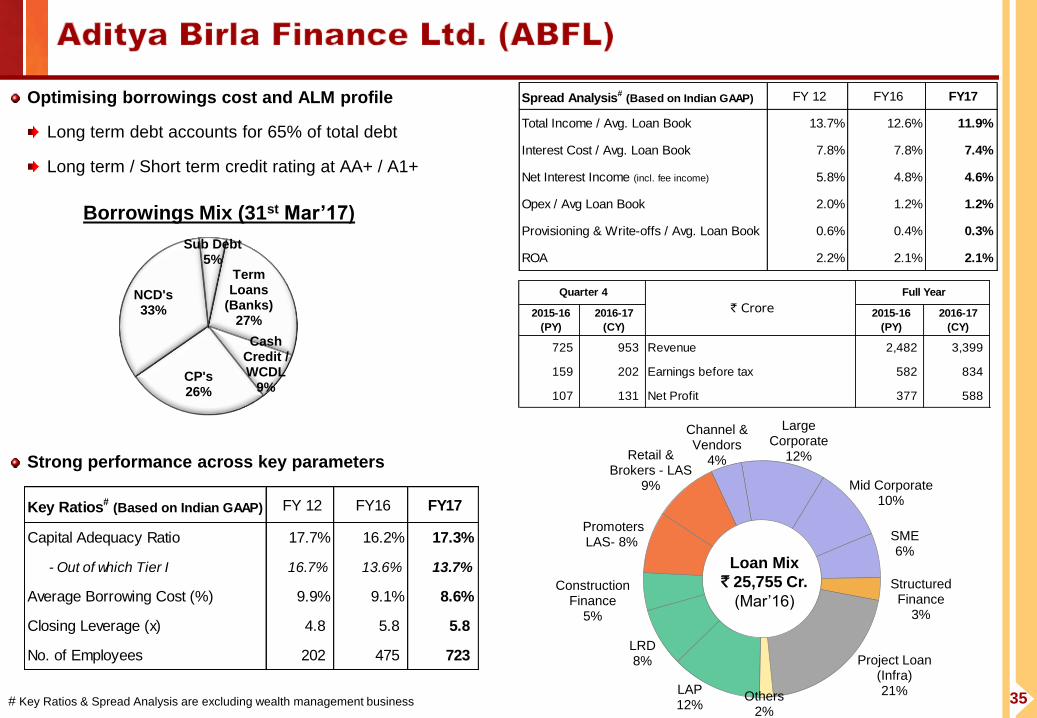
Optimising borrowings cost and ALM profile
Long term debt accounts for 65% of total debt
Long term / Short term credit rating at AA+ / A1+
Strong performance across key parameters
Term Loans
(Banks) 27%
Cash Credit / WCDL
9% CP's 26%
NCD's 33%
Sub Debt 5%
Borrowings Mix (31st Mar’17)
# Key Ratios & Spread Analysis are excluding wealth management business
Spread Analysis# (Based on Indian GAAP) FY 12 FY16 FY17
Total Income / Avg. Loan Book 13.7% 12.6% 11.9%
Interest Cost / Avg. Loan Book 7.8% 7.8% 7.4%
Net Interest Income (incl. fee income) 5.8% 4.8% 4.6%
Opex / Avg Loan Book 2.0% 1.2% 1.2%
Provisioning & Write-offs / Avg. Loan Book 0.6% 0.4% 0.3%
ROA 2.2% 2.1% 2.1%
Key Ratios# (Based on Indian GAAP) FY 12 FY16 FY17
Capital Adequacy Ratio 17.7% 16.2% 17.3%
- Out of which Tier I 16.7% 13.6% 13.7%
Average Borrowing Cost (%) 9.9% 9.1% 8.6%
Closing Leverage (x) 4.8 5.8 5.8
No. of Employees 202 475 723
2015-16
(PY)
2016-17
(CY)
2015-16
(PY)
2016-17
(CY)
725 953 Revenue 2,482 3,399
159 202 Earnings before tax 582 834
107 131 Net Profit 377 588
Full Year
` Crore
Quarter 4
LAP 12%
LRD 8%
Construction Finance
5%
Promoters LAS- 8%
Retail & Brokers - LAS
9%
Channel & Vendors
4%
Large Corporate
12%
Mid Corporate 10%
SME 6%
Structured Finance
3%
Project Loan (Infra) 21% Others
2%
Loan Mix
` 25,755 Cr.
(Mar’16)
36
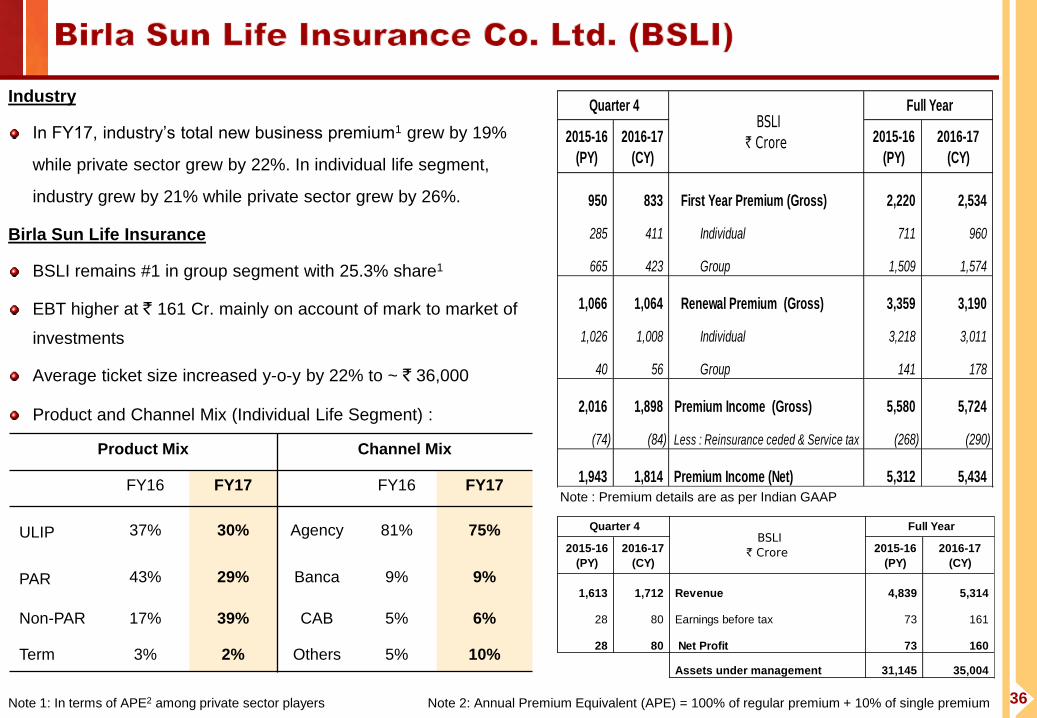
Industry
In FY17, industry’s total new business premium1 grew by 19%
while private sector grew by 22%. In individual life segment,
industry grew by 21% while private sector grew by 26%.
Birla Sun Life Insurance
BSLI remains #1 in group segment with 25.3% share1
EBT higher at ` 161 Cr. mainly on account of mark to market of
investments
Average ticket size increased y-o-y by 22% to ~ ` 36,000
Product and Channel Mix (Individual Life Segment) :
Note 1: In terms of APE2 among private sector players Note 2: Annual Premium Equivalent (APE) = 100% of regular premium + 10% of single premium
Product Mix Channel Mix
FY16 FY17 FY16 FY17
ULIP 37% 30% Agency 81% 75%
PAR 43% 29% Banca 9% 9%
Non-PAR 17% 39% CAB 5% 6%
Term 3% 2% Others 5% 10%
Note : Premium details are as per Indian GAAP
2015-16
(PY)
2016-17
(CY)
2015-16
(PY)
2016-17
(CY)
950 833 First Year Premium (Gross) 2,220 2,534
285 411 Individual 711 960
665 423 Group 1,509 1,574
1,066 1,064 Renewal Premium (Gross) 3,359 3,190
1,026 1,008 Individual 3,218 3,011
40 56 Group 141 178
2,016 1,898 Premium Income (Gross) 5,580 5,724
(74) (84) Less : Reinsurance ceded & Service tax (268) (290)
1,943 1,814 Premium Income (Net) 5,312 5,434
Full Year BSLI
` Crore
Quarter 4
2015-16
(PY)
2016-17
(CY)
2015-16
(PY)
2016-17
(CY)
1,613 1,712 Revenue 4,839 5,314
28 80 Earnings before tax 73 161
28 80 Net Profit 73 160
Assets under management 31,145 35,004
Full Year BSLI
` Crore
Quarter 4
37
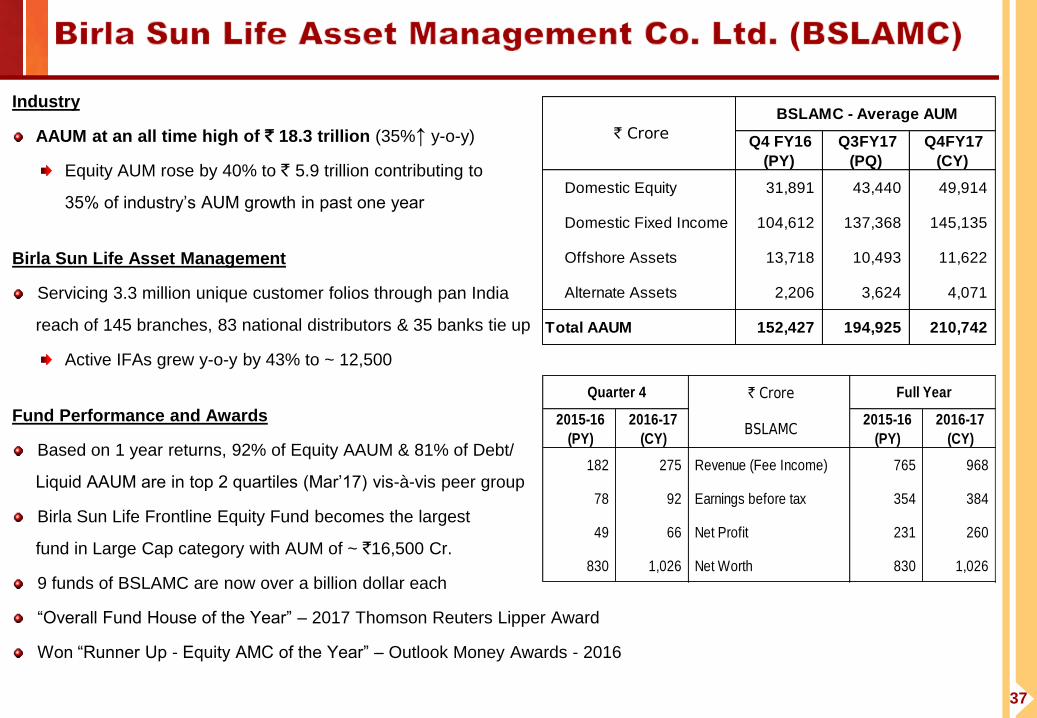
Industry
AAUM at an all time high of ` 18.3 trillion (35%↑ y-o-y)
Equity AUM rose by 40% to ` 5.9 trillion contributing to
35% of industry’s AUM growth in past one year
Birla Sun Life Asset Management
Servicing 3.3 million unique customer folios through pan India
reach of 145 branches, 83 national distributors & 35 banks tie up
Active IFAs grew y-o-y by 43% to ~ 12,500
Fund Performance and Awards
Based on 1 year returns, 92% of Equity AAUM & 81% of Debt/
Liquid AAUM are in top 2 quartiles (Mar’17) vis-à-vis peer group
Birla Sun Life Frontline Equity Fund becomes the largest
fund in Large Cap category with AUM of ~ `16,500 Cr.
9 funds of BSLAMC are now over a billion dollar each
“Overall Fund House of the Year” – 2017 Thomson Reuters Lipper Award
Won “Runner Up - Equity AMC of the Year” – Outlook Money Awards - 2016
Q4 FY16
(PY)
Q3FY17
(PQ)
Q4FY17
(CY)
Domestic Equity 31,891 43,440 49,914
Domestic Fixed Income 104,612 137,368 145,135
Offshore Assets 13,718 10,493 11,622
Alternate Assets 2,206 3,624 4,071
Total AAUM 152,427 194,925 210,742
` Crore
BSLAMC - Average AUM
` Crore
2015-16
(PY)
2016-17
(CY) BSLAMC
2015-16
(PY)
2016-17
(CY)
182 275 Revenue (Fee Income) 765 968
78 92 Earnings before tax 354 384
49 66 Net Profit 231 260
830 1,026 Net Worth 830 1,026
Quarter 4 Full Year
Revenues
38
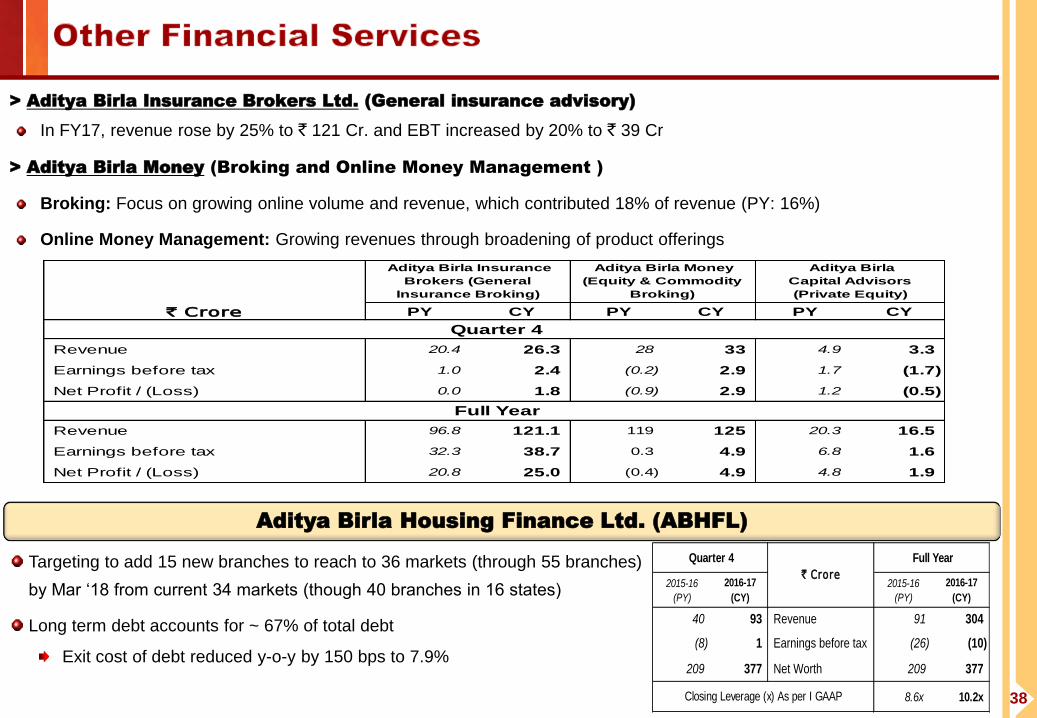
> Aditya Birla Insurance Brokers Ltd. (General insurance advisory)
In FY17, revenue rose by 25% to ` 121 Cr. and EBT increased by 20% to ` 39 Cr
> Aditya Birla Money (Broking and Online Money Management )
Broking: Focus on growing online volume and revenue, which contributed 18% of revenue (PY: 16%)
Online Money Management: Growing revenues through broadening of product offerings
Aditya Birla Housing Finance Ltd. (ABHFL)
Targeting to add 15 new branches to reach to 36 markets (through 55 branches)
by Mar ‘18 from current 34 markets (though 40 branches in 16 states)
Long term debt accounts for ~ 67% of total debt
Exit cost of debt reduced y-o-y by 150 bps to 7.9%
PY CY PY CY PY CY
Revenue 20.4 26.3 28 33 4.9 3.3
Earnings before tax 1.0 2.4 (0.2) 2.9 1.7 (1.7)
Net Profit / (Loss) 0.0 1.8 (0.9) 2.9 1.2 (0.5)
Revenue 96.8 121.1 119 125 20.3 16.5
Earnings before tax 32.3 38.7 0.3 4.9 6.8 1.6
Net Profit / (Loss) 20.8 25.0 (0.4) 4.9 4.8 1.9
Aditya Birla Money
(Equity & Commodity
Broking)
` Crore
Full Year
Quarter 4
Aditya Birla
Capital Advisors
(Private Equity)
Aditya Birla Insurance
Brokers (General
Insurance Broking)
2015-16
(PY)
2016-17
(CY)
2015-16
(PY)
2016-17
(CY)
40 93 Revenue 91 304
(8) 1 Earnings before tax (26) (10)
209 377 Net Worth 209 377
8.6x 10.2x
Full Year
` Crore
Closing Leverage (x) As per I GAAP
Quarter 4
39
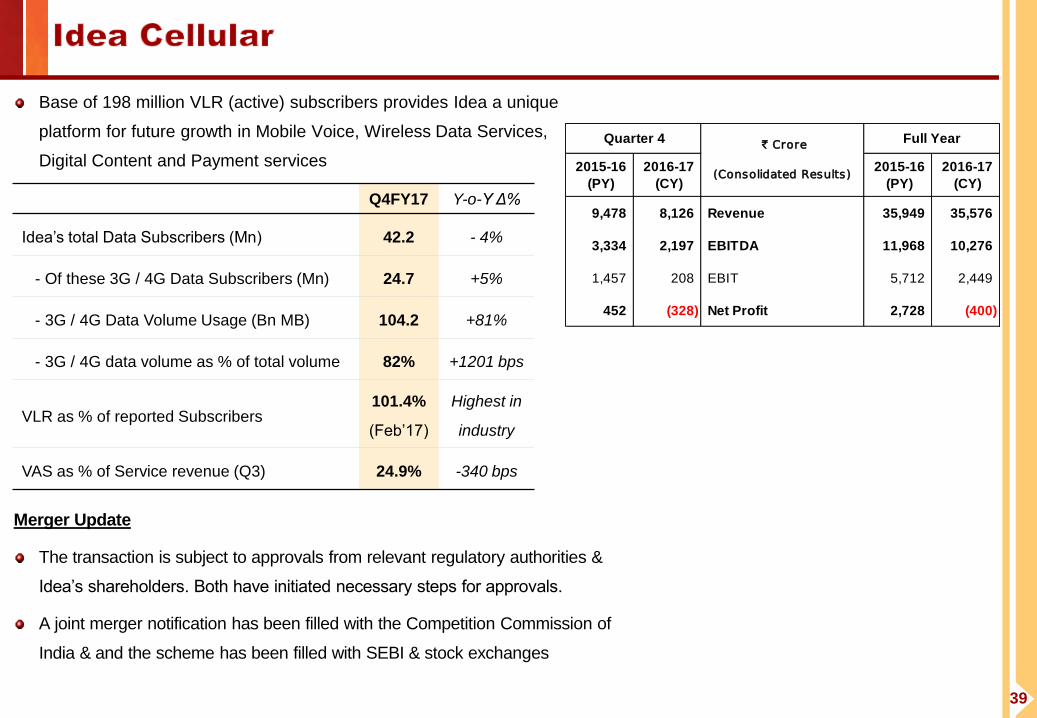
Base of 198 million VLR (active) subscribers provides Idea a unique
platform for future growth in Mobile Voice, Wireless Data Services,
Digital Content and Payment services
Merger Update
The transaction is subject to approvals from relevant regulatory authorities &
Idea’s shareholders. Both have initiated necessary steps for approvals.
A joint merger notification has been filled with the Competition Commission of
India & and the scheme has been filled with SEBI & stock exchanges
Q4FY17 Y-o-Y Δ%
Idea’s total Data Subscribers (Mn) 42.2 - 4%
- Of these 3G / 4G Data Subscribers (Mn) 24.7 +5%
- 3G / 4G Data Volume Usage (Bn MB) 104.2 +81%
- 3G / 4G data volume as % of total volume 82% +1201 bps
VLR as % of reported Subscribers 101.4%
(Feb’17)
Highest in
industry
VAS as % of Service revenue (Q3) 24.9% -340 bps
2015-16
(PY)
2016-17
(CY)
2015-16
(PY)
2016-17
(CY)
9,478 8,126 Revenue 35,949 35,576
3,334 2,197 EBITDA 11,968 10,276
1,457 208 EBIT 5,712 2,449
452 (328) Net Profit 2,728 (400)
` Crore
(Consolidated Results)
Quarter 4 Full Year
40
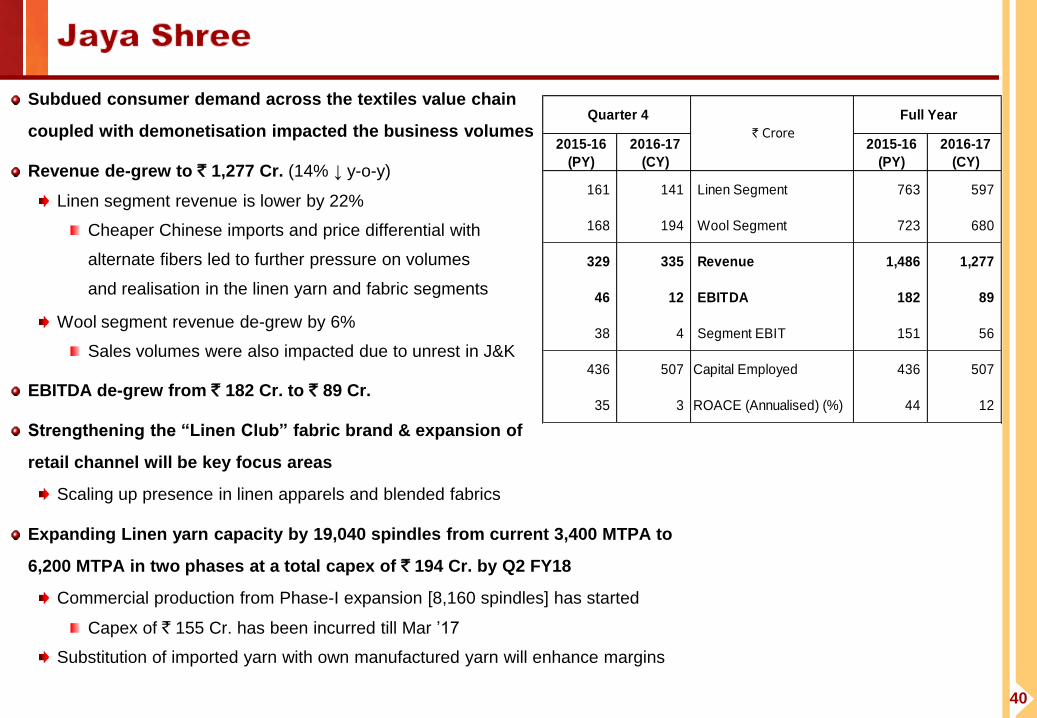
Subdued consumer demand across the textiles value chain
coupled with demonetisation impacted the business volumes
Revenue de-grew to ` 1,277 Cr. (14% ↓ y-o-y)
Linen segment revenue is lower by 22%
Cheaper Chinese imports and price differential with
alternate fibers led to further pressure on volumes
and realisation in the linen yarn and fabric segments
Wool segment revenue de-grew by 6%
Sales volumes were also impacted due to unrest in J&K
EBITDA de-grew from ` 182 Cr. to ` 89 Cr.
Strengthening the “Linen Club” fabric brand & expansion of
retail channel will be key focus areas
Scaling up presence in linen apparels and blended fabrics
Expanding Linen yarn capacity by 19,040 spindles from current 3,400 MTPA to
6,200 MTPA in two phases at a total capex of ` 194 Cr. by Q2 FY18
Commercial production from Phase-I expansion [8,160 spindles] has started
Capex of ` 155 Cr. has been incurred till Mar ’17
Substitution of imported yarn with own manufactured yarn will enhance margins
2015-16
(PY)
2016-17
(CY)
2015-16
(PY)
2016-17
(CY)
161 141 Linen Segment 763 597
168 194 Wool Segment 723 680
329 335 Revenue 1,486 1,277
46 12 EBITDA 182 89
38 4 Segment EBIT 151 56
436 507 Capital Employed 436 507
35 3 ROACE (Annualised) (%) 44 12
` Crore
Quarter 4 Full Year
41
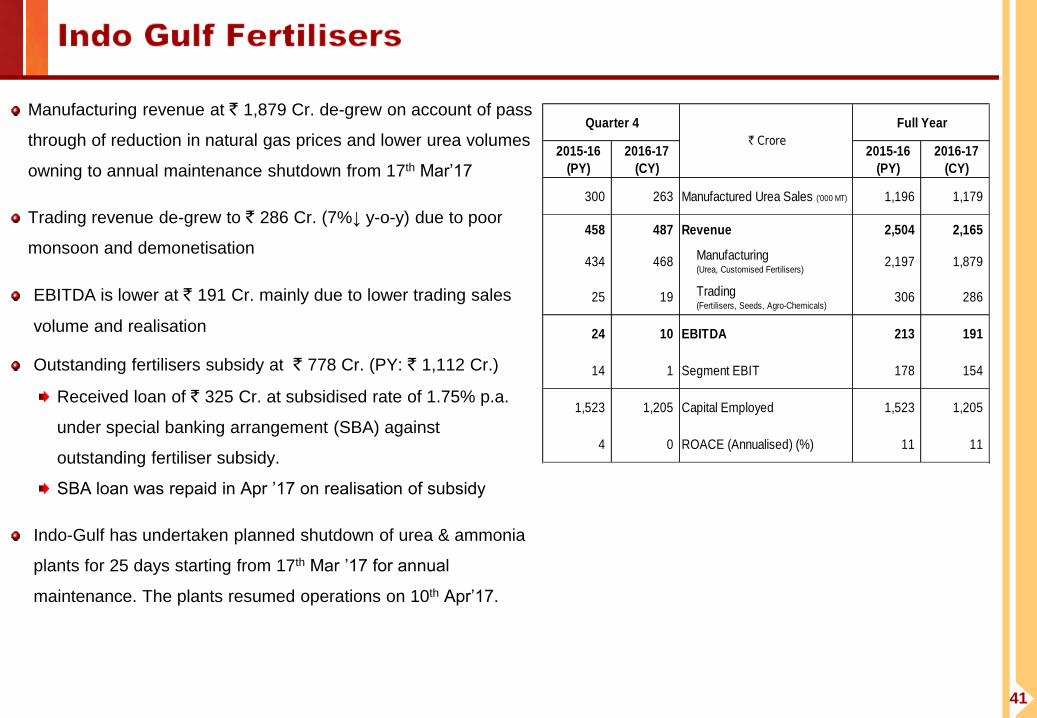
Manufacturing revenue at ` 1,879 Cr. de-grew on account of pass
through of reduction in natural gas prices and lower urea volumes
owning to annual maintenance shutdown from 17th Mar’17
Trading revenue de-grew to ` 286 Cr. (7%↓ y-o-y) due to poor
monsoon and demonetisation
EBITDA is lower at ` 191 Cr. mainly due to lower trading sales
volume and realisation
Outstanding fertilisers subsidy at ` 778 Cr. (PY: ` 1,112 Cr.)
Received loan of ` 325 Cr. at subsidised rate of 1.75% p.a.
• under special banking arrangement (SBA) against
• outstanding fertiliser subsidy.
SBA loan was repaid in Apr ’17 on realisation of subsidy
Indo-Gulf has undertaken planned shutdown of urea & ammonia
plants for 25 days starting from 17th Mar ’17 for annual
maintenance. The plants resumed operations on 10th Apr’17.
2015-16
(PY)
2016-17
(CY)
2015-16
(PY)
2016-17
(CY)
300 263 Manufactured Urea Sales ('000 MT) 1,196 1,179
458 487 Revenue 2,504 2,165
434 468 Manufacturing(Urea, Customised Fertilisers)
2,197 1,879
25 19 Trading (Fertilisers, Seeds, Agro-Chemicals)
306 286
24 10 EBITDA 213 191
14 1 Segment EBIT 178 154
1,523 1,205 Capital Employed 1,523 1,205
4 0 ROACE (Annualised) (%) 11 11
Full Year
` Crore
Quarter 4

42
Sales volume in both VFY & Caustic Soda segments
were marginally down due to impact of demonetisation
during part of the year
Revenue remained flat at ` 1,035 Cr.
VFY segment revenue at ` 826 Cr.
Lower sales volume partly offset by higher
realization driven by improved product mix
Chemicals segment revenue at ` 208 Cr. led by
higher caustic soda realisation
EBITDA marginally de-grew to ` 259 Cr.
Lower sales volumes partly offset by higher
realisation in both the segments
VFY Capacity expansion
Added ~750 TPA at a capex of ` 48 Cr. (Incurred ` 27 Cr. till Mar’17).
Commercial production has started from Mar ’17
ROACE stands at 30% p.a.
Note 1 : Including captive consumption and inter unit sale
2015-16
(PY)
2016-17
(CY)
2015-16
(PY)
2016-17
(CY) VFY
5,171 4,897 Manufactured VFY Sales Volumes (MT) 20,412 19,833
213 212 Revenue (VFY & allied chemicals) ( ` Cr.) 826 826
Chemicals
21,211 19,369 Caustic Soda Sales Volume (MT)1 83,014 79,137
58 54 Revenue ( ` Cr.) 210 208
271 265 Total Revenue 1,036 1,035
79 59 EBITDA 269 259
67 45 Segment EBIT 226 210
720 706 Capital Employed 720 706
37 25 ROACE (Annualised) (%) 31 30
Full Year
` Crore
Quarter 4
43
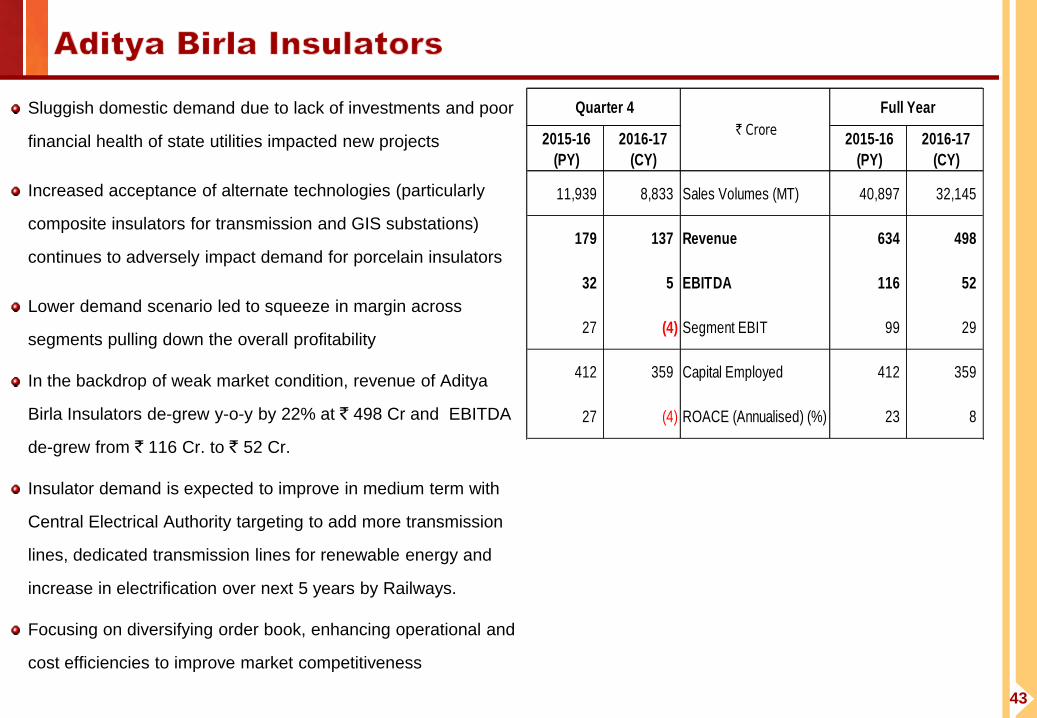
Sluggish domestic demand due to lack of investments and poor
financial health of state utilities impacted new projects
Increased acceptance of alternate technologies (particularly
composite insulators for transmission and GIS substations)
continues to adversely impact demand for porcelain insulators
Lower demand scenario led to squeeze in margin across
segments pulling down the overall profitability
In the backdrop of weak market condition, revenue of Aditya
Birla Insulators de-grew y-o-y by 22% at ` 498 Cr and EBITDA
de-grew from ` 116 Cr. to ` 52 Cr.
Insulator demand is expected to improve in medium term with
Central Electrical Authority targeting to add more transmission
lines, dedicated transmission lines for renewable energy and
increase in electrification over next 5 years by Railways.
Focusing on diversifying order book, enhancing operational and
cost efficiencies to improve market competitiveness
2015-16
(PY)
2016-17
(CY)
2015-16
(PY)
2016-17
(CY)
11,939 8,833 Sales Volumes (MT) 40,897 32,145
179 137 Revenue 634 498
32 5 EBITDA 116 52
27 (4) Segment EBIT 99 29
412 359 Capital Employed 412 359
27 (4) ROACE (Annualised) (%) 23 8
Full Year Quarter 4
` Crore
44
Certain statements made in this presentation may not be based on historical information or facts and may be “forward looking statements” including, but not
limited to, those relating to general business plans & strategy of Aditya Birla Nuvo Limited ("ABNL"), its future outlook & growth prospects, future
developments in its businesses, its competitive & regulatory environment and management's current views & assumptions which may not remain constant
due to risks and uncertainties. Actual results may differ materially from these forward-looking statements due to a number of factors, including future
changes or developments in ABNL's business, its competitive environment, its ability to implement its strategies and initiatives and respond to technological
changes and political, economic, regulatory and social conditions in the countries in which ABNL conducts business. Important factors that could make a
difference to ABNL’s operations include global and Indian demand supply conditions, finished goods prices, feed stock availability and prices, cyclical
demand and pricing in ABNL’s principal markets, changes in Government regulations, tax regimes, competitors actions, economic developments within India
and the countries within which ABNL conducts business and other factors such as litigation and labour negotiations.
This presentation does not constitute a prospectus, offering circular or offering memorandum or an offer to acquire any shares and should not be considered
as a recommendation that any investor should subscribe for or purchase any of ABNL's shares. Neither this presentation nor any other documentation or
information (or any part thereof) delivered or supplied under or in relation to the shares shall be deemed to constitute an offer of or an invitation by or on
behalf of ABNL.
ABNL, as such, makes no representation or warranty, express or implied, as to, and does not accept any responsibility or liability with respect to, the
fairness, accuracy, completeness or correctness of any information or opinions contained herein. The information contained in this presentation, unless
otherwise specified is only current as of the date of this presentation. ABNL assumes no responsibility to publicly amend, modify or revise any forward
looking statements on the basis of any subsequent developments, information or events or otherwise. Unless otherwise stated in this document, the
information contained herein is based on management information and estimates. The information contained herein is subject to change without notice and
past performance is not indicative of future results. ABNL may alter, modify or otherwise change in any manner the content of this presentation, without
obligation to notify any person of such revision or changes. This presentation may not be copied and disseminated in any manner.
INFORMATION PRESENTED HERE IS NOT AN OFFER FOR SALE OF ANY EQUITY SHARES OR ANY OTHER SECURITY OF ABNL
This presentation is not for publication or distribution, directly or indirectly, in or into the United States, Canada or Japan. These
materials are not an offer of securities for sale in or into the United States, Canada or Japan.
Copyright © 2017 Aditya Birla Nuvo Ltd.