Embed Size (px)
Citation preview
1262 VOLUME 18W E A T H E R A N D F O R E C A S T I N G
q 2003 American Meteorological Society
NOTES AND CORRESPONDENCE
Characteristics of Vertical Wind Profiles near Supercells Obtained from the RapidUpdate Cycle
PAUL MARKOWSKI, CHRISTINA HANNON, JEFF FRAME, ELISE LANCASTER, AND ALBERT PIETRYCHA*
Department of Meteorology, The Pennsylvania State University, University Park, Pennsylvania
ROGER EDWARDS AND RICHARD L. THOMPSON
Storm Prediction Center, Norman, Oklahoma
26 November 2002 and 18 March 2003
ABSTRACT
Over 400 vertical wind profiles in close proximity to nontornadic and tornadic supercell thunderstorms areexamined. The profiles were obtained from the Rapid Update Cycle (RUC) model/analysis system. Ground-relative wind speeds throughout the lower and middle troposphere are larger, on average, in tornadic supercellenvironments than in nontornadic supercell environments. The average vertical profiles of storm-relative windspeed, vertical wind shear, hodograph curvature, crosswise and streamwise vorticity, and storm-relative helicityare generally similar above 1 km in the tornadic and nontornadic supercell environments, with differences thatare either not statistically significant or not what most would regard as meteorologically significant. On the otherhand, considerable differences are found in these average vertical profiles within 1 km of the ground, withenvironments associated with significantly tornadic supercells (those producing tornadoes of at least F2 intensity)having substantially larger low-level vertical wind shear, streamwise vorticity, and storm-relative helicity com-pared to environments associated with nontornadic supercells and weakly tornadic supercells (those producingF0 or F1 tornadoes). These findings may partly explain the extraordinary difficulty in discriminating betweentornadic and nontornadic supercell environments in a forecasting setting, given the low temporal and spatialfrequency of wind observations in the lowest 1 km. It is believed that it would be a worthwhile investment toaugment low-level wind profiling capabilities, in addition to taking a closer look at the dynamical sensitivitiesof supercell storms to near-surface wind shear by way of high-resolution numerical simulations.
1. Introduction
Distinguishing tornadic supercell environments fromthose associated with nontornadic supercells is amongthe most daunting challenges currently facing severestorms forecasters. A number of early studies attemptedto define the environments capable of supporting tor-nado-producing thunderstorms, many of which were un-doubtedly supercell thunderstorms (e.g., Darkow 1968,1969; Maddox 1976; Darkow and McCann 1977). Thiswork was followed by studies that investigated differ-ences between the environments that support weak ver-
* Current affiliation: National Weather Service, Amarillo, Texas.
Corresponding author address: Dr. Paul Markowski, 503 WalkerBldg., University Park, PA 16802.E-mail: [email protected]
sus strong tornadoes (e.g., Davies-Jones et al. 1990;Davies and Johns 1993; Johns et al. 1993) and, perhapsmore importantly, tornadic versus nontornadic super-cells (e.g., Rasmussen and Wilhelmson 1983; Brooks etal. 1994a; Davies 1998, 2002; Rasmussen and Blan-chard 1998; Markowski et al. 1998; Thompson 1998;Edwards and Thompson 2000; Thompson and Edwards2000; Brooks and Craven 2002; Craven et al. 2002).The sheer abundance of studies cited above in just thelast few years is a testament to the considerable attentiongiven to the problem of discriminating between tornadicand nontornadic supercell environments.
In this note we present the results of a study of char-acteristics of tornadic and nontornadic supercell hodo-graphs derived from 40-km Rapid Update Cycle (RUC;Benjamin et al. 2002) analyses.1 One motivation for this
1 A companion paper in this issue by Thompson et al. (2003) ex-amines aspects of the thermodynamic profiles.
DECEMBER 2003 1263N O T E S A N D C O R R E S P O N D E N C E
FIG. 1. Diagram of a hodograph [u(z), y(z)] depicting the stormmotion vector c, storm-relative wind vector v 2 c, vertical wind shearvector dv/dz, environmental horizontal vorticity vector v, and therelationships between v 2 c and c, and dv/dz and f. The vectorsp(z) 5 (cosc, sinc) and q(z) 5 (2sinc, cosc) are unit vectors paralleland normal to the left of the storm-relative wind, respectively, andc(z) describes the orientation of the storm-relative wind. Adaptedfrom Davies-Jones (1984).
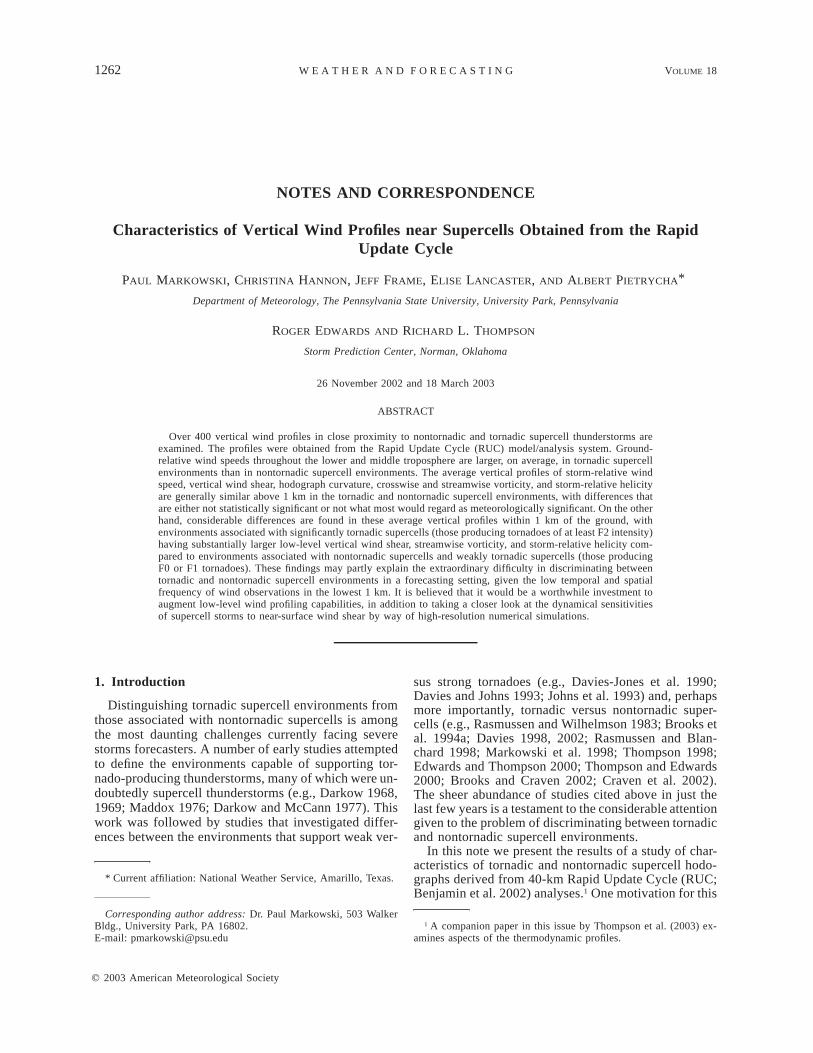
FIG. 2. (left) Mean vertical profiles of zonal wind speed, u. Height above ground level is in km on theordinate, and abscissa units are m s21. Solid profiles are associated with ST environments, dashed profilesare associated with WT environments, and dotted profiles are associated with NT environments. Light grayshading denotes layers in which the mean ST value differs from the NT value at the 95% significance level.Dark gray shading denotes layers in which the mean ST value differs from the NT and WT values at the95% significance level. (right) Std dev profiles for the parameters displayed on the left. Units are the sameas on the left, as are the lines used to denote supercell type.
study is the relatively recent availability and widespreaduse of hourly conditions from analysis systems that ini-tialize numerical weather prediction models (e.g., theRUC, which has been used herein). Although analysesare sensitive to the accuracy of short-term forecastsmade by a numerical model, there are some advantagesto using model analysis data. The primary advantage isthe superior temporal and spatial resolution comparedto that of the upper-air observing network. Furthermore,storm-scale modifications of the model vertical windprofiles by the supercells (Brooks et al. 1994a; Weismanet al. 1998) are expected to be less significant in anoperational model that does not explicitly resolve con-vection.2 Thus, the troublesome issue of defining whatconstitutes a suitable ‘‘proximity’’ sounding (Brooks etal. 1994a) is somewhat circumvented. The availabilityof thermodynamic and wind profile information at alarge number of grid points and times also facilitatesthe assembly of a large number of cases in far less timethan if only observed soundings within relatively closeproximity to an event were acceptable. The fact that alarge sample can be acquired within only a few years(versus decades to obtain a sample of observed prox-imity soundings having similar size) has the additional
2 None of the soundings in the dataset were obtained at grid pointsat which the RUC convective parameterization was activated.
1264 VOLUME 18W E A T H E R A N D F O R E C A S T I N G
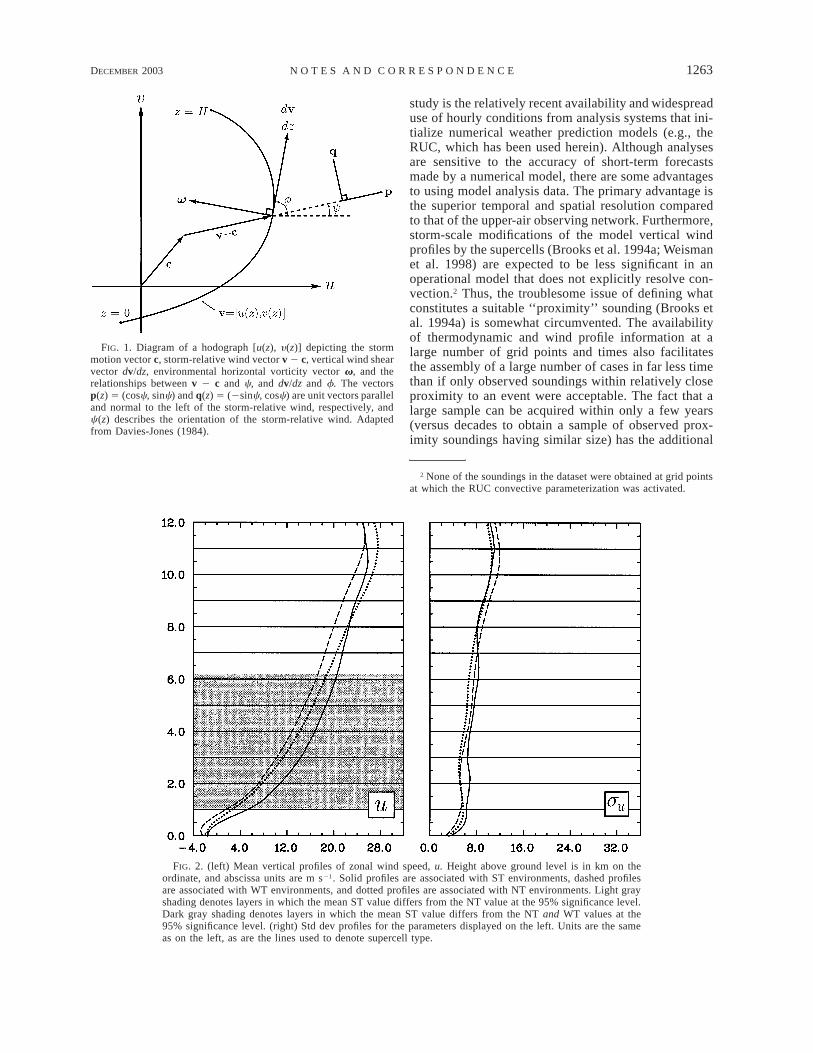
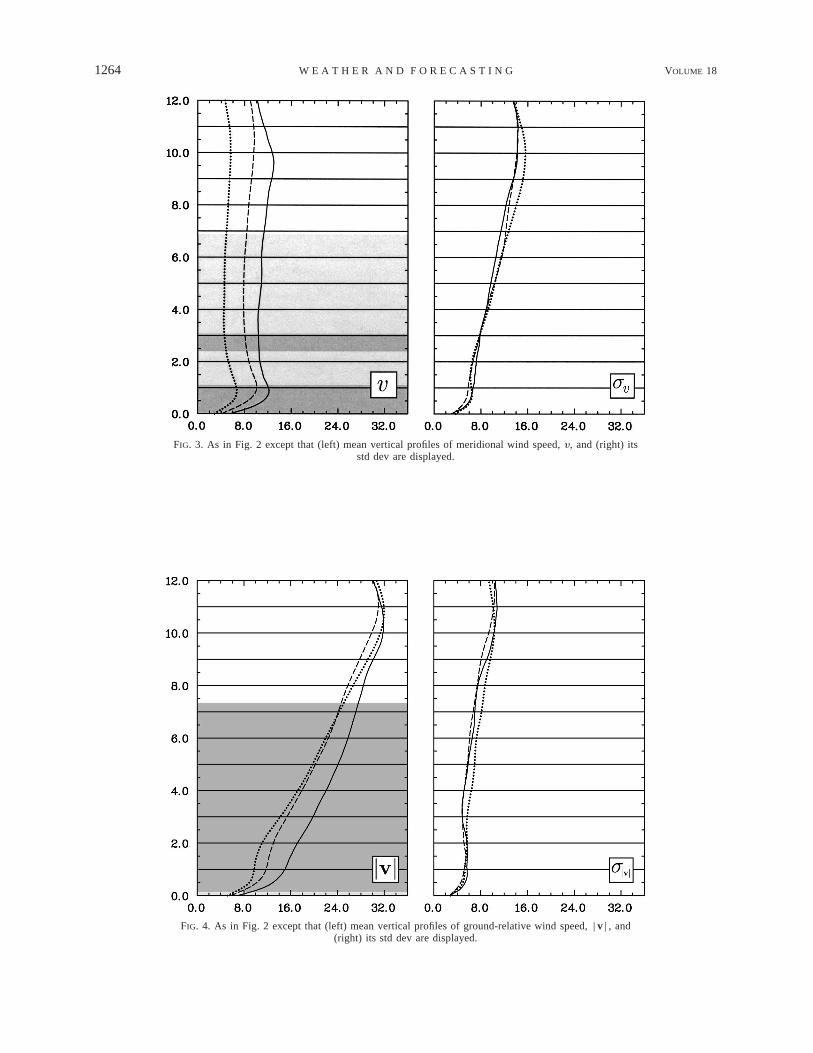
FIG. 3. As in Fig. 2 except that (left) mean vertical profiles of meridional wind speed, y, and (right) itsstd dev are displayed.
FIG. 4. As in Fig. 2 except that (left) mean vertical profiles of ground-relative wind speed, | v | , and(right) its std dev are displayed.
DECEMBER 2003 1265N O T E S A N D C O R R E S P O N D E N C E
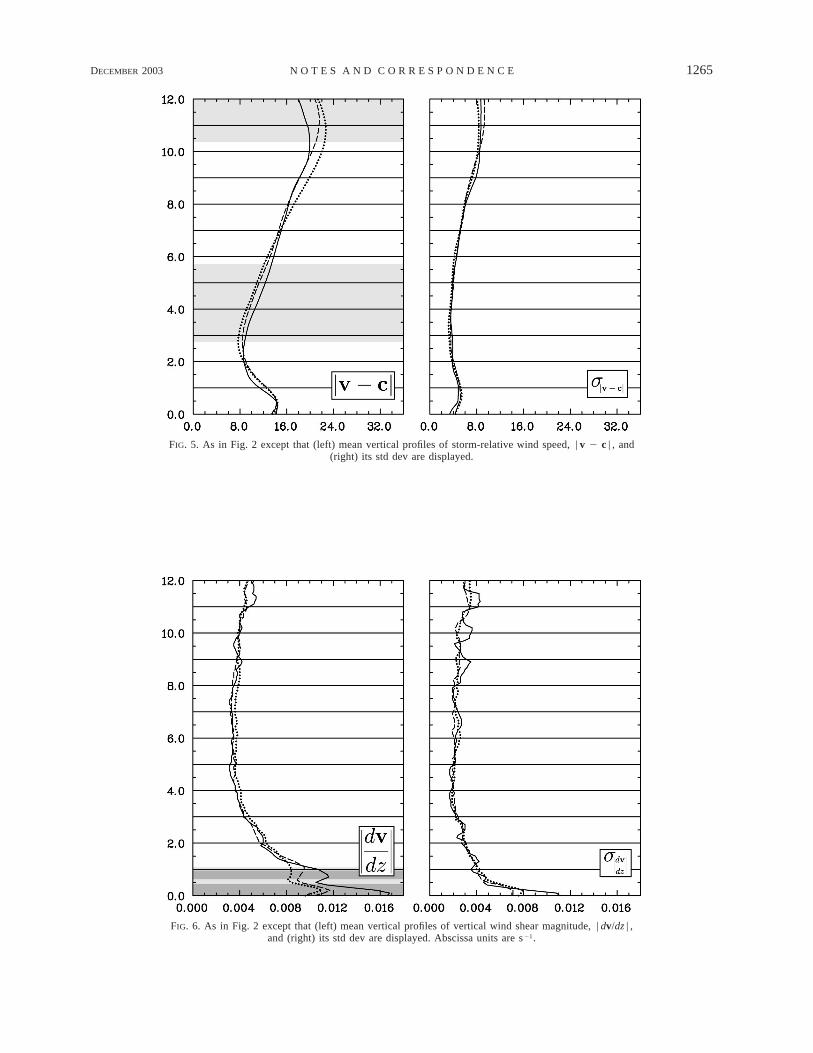
FIG. 5. As in Fig. 2 except that (left) mean vertical profiles of storm-relative wind speed, | v 2 c | , and(right) its std dev are displayed.
FIG. 6. As in Fig. 2 except that (left) mean vertical profiles of vertical wind shear magnitude, | dv/dz | ,and (right) its std dev are displayed. Abscissa units are s21.
1266 VOLUME 18W E A T H E R A N D F O R E C A S T I N G
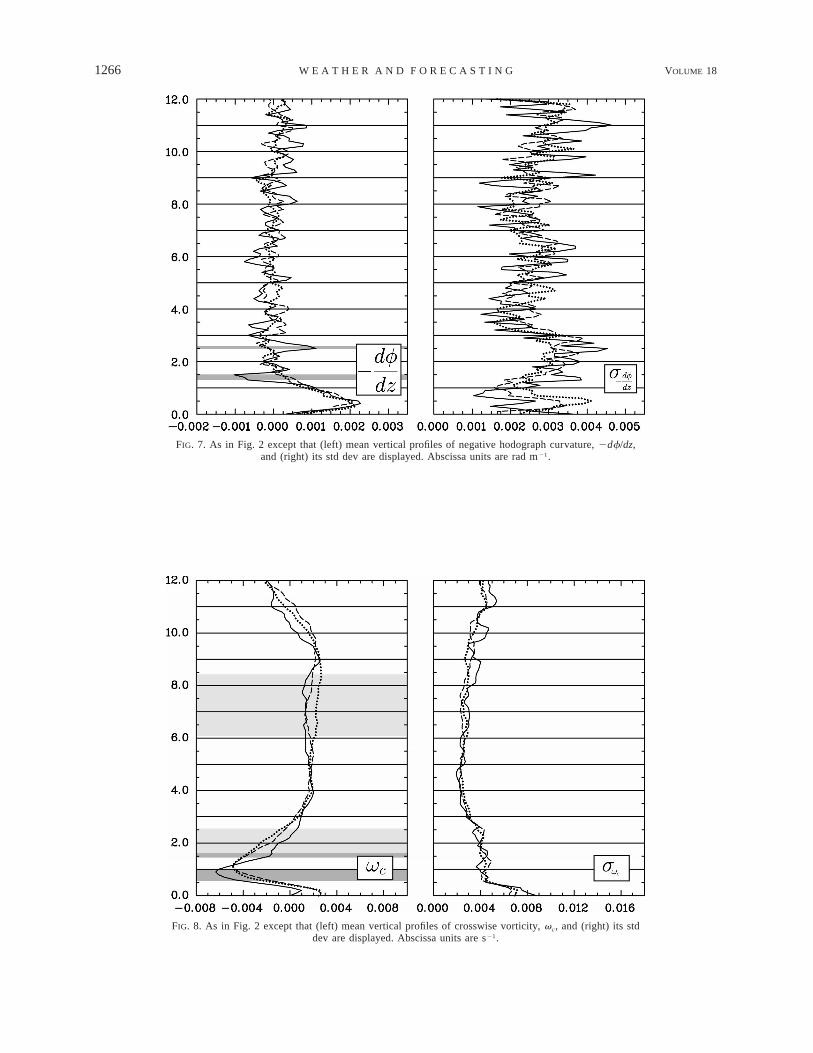
FIG. 7. As in Fig. 2 except that (left) mean vertical profiles of negative hodograph curvature, 2df/dz,and (right) its std dev are displayed. Abscissa units are rad m21.
FIG. 8. As in Fig. 2 except that (left) mean vertical profiles of crosswise vorticity, vc, and (right) its stddev are displayed. Abscissa units are s21.
DECEMBER 2003 1267N O T E S A N D C O R R E S P O N D E N C E
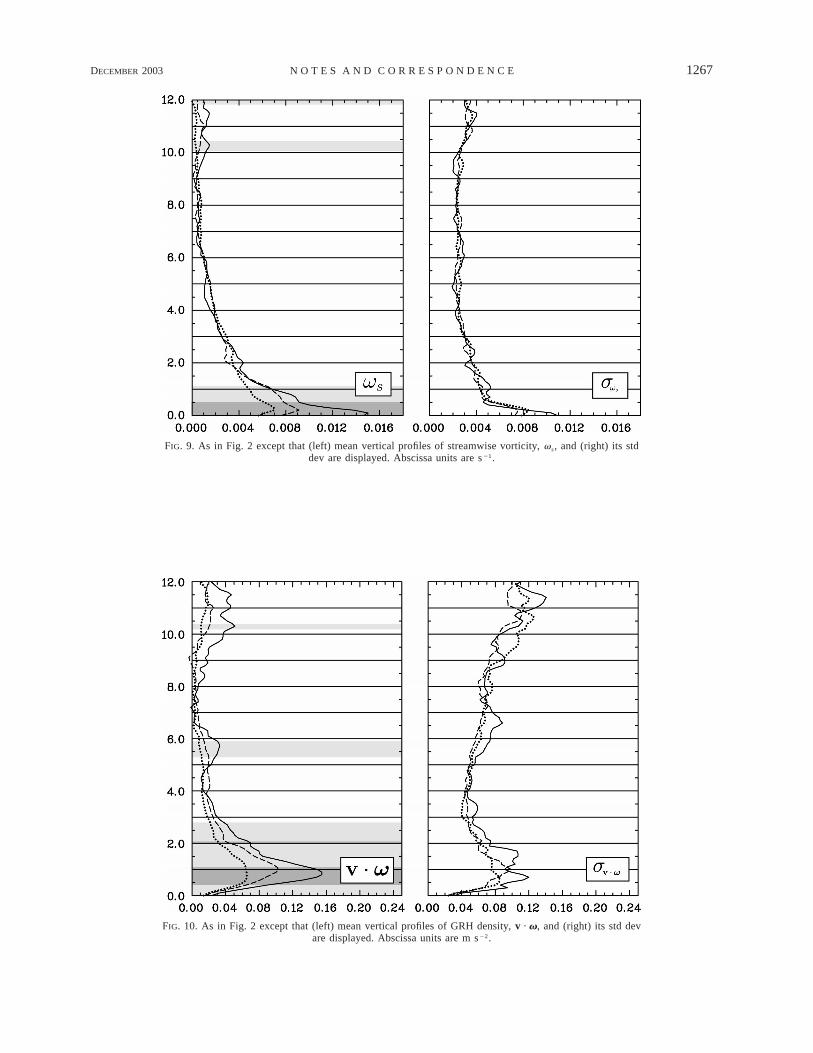
FIG. 9. As in Fig. 2 except that (left) mean vertical profiles of streamwise vorticity, vs, and (right) its stddev are displayed. Abscissa units are s21.
FIG. 10. As in Fig. 2 except that (left) mean vertical profiles of GRH density, v · v, and (right) its std devare displayed. Abscissa units are m s22.
1268 VOLUME 18W E A T H E R A N D F O R E C A S T I N G
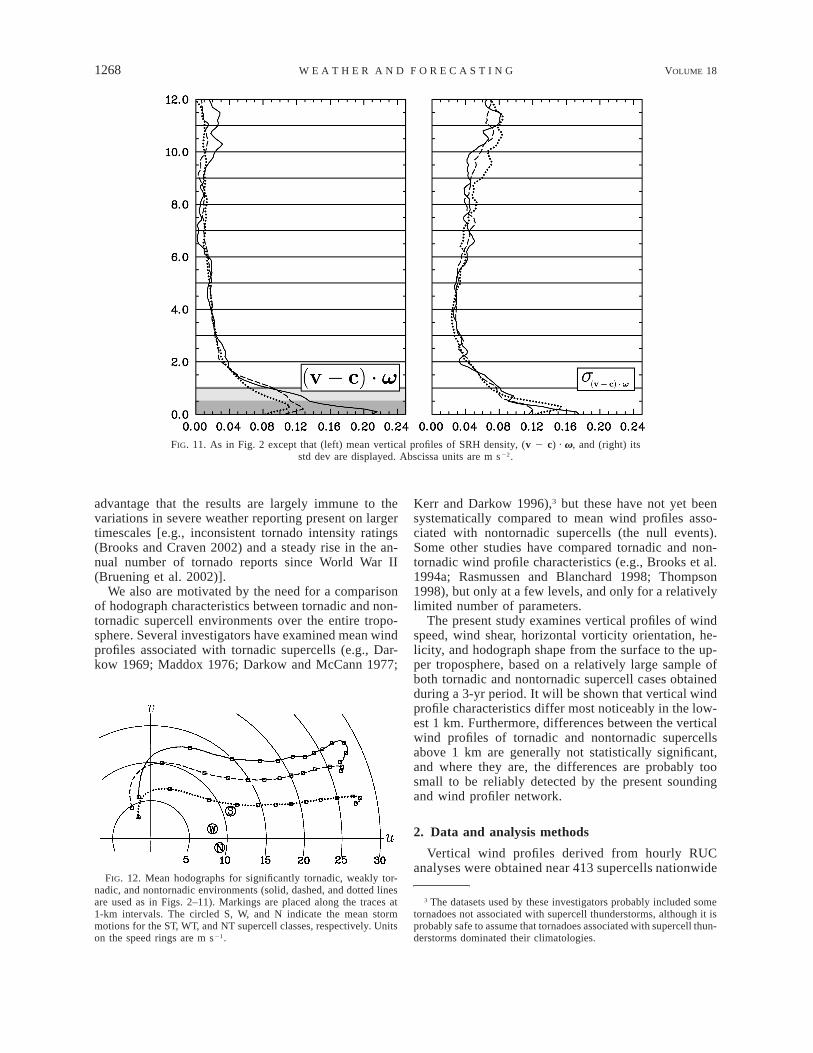
FIG. 11. As in Fig. 2 except that (left) mean vertical profiles of SRH density, (v 2 c) · v, and (right) itsstd dev are displayed. Abscissa units are m s22.
FIG. 12. Mean hodographs for significantly tornadic, weakly tor-nadic, and nontornadic environments (solid, dashed, and dotted linesare used as in Figs. 2–11). Markings are placed along the traces at1-km intervals. The circled S, W, and N indicate the mean stormmotions for the ST, WT, and NT supercell classes, respectively. Unitson the speed rings are m s21.
advantage that the results are largely immune to thevariations in severe weather reporting present on largertimescales [e.g., inconsistent tornado intensity ratings(Brooks and Craven 2002) and a steady rise in the an-nual number of tornado reports since World War II(Bruening et al. 2002)].
We also are motivated by the need for a comparisonof hodograph characteristics between tornadic and non-tornadic supercell environments over the entire tropo-sphere. Several investigators have examined mean windprofiles associated with tornadic supercells (e.g., Dar-kow 1969; Maddox 1976; Darkow and McCann 1977;
Kerr and Darkow 1996),3 but these have not yet beensystematically compared to mean wind profiles asso-ciated with nontornadic supercells (the null events).Some other studies have compared tornadic and non-tornadic wind profile characteristics (e.g., Brooks et al.1994a; Rasmussen and Blanchard 1998; Thompson1998), but only at a few levels, and only for a relativelylimited number of parameters.
The present study examines vertical profiles of windspeed, wind shear, horizontal vorticity orientation, he-licity, and hodograph shape from the surface to the up-per troposphere, based on a relatively large sample ofboth tornadic and nontornadic supercell cases obtainedduring a 3-yr period. It will be shown that vertical windprofile characteristics differ most noticeably in the low-est 1 km. Furthermore, differences between the verticalwind profiles of tornadic and nontornadic supercellsabove 1 km are generally not statistically significant,and where they are, the differences are probably toosmall to be reliably detected by the present soundingand wind profiler network.
2. Data and analysis methods
Vertical wind profiles derived from hourly RUCanalyses were obtained near 413 supercells nationwide
3 The datasets used by these investigators probably included sometornadoes not associated with supercell thunderstorms, although it isprobably safe to assume that tornadoes associated with supercell thun-derstorms dominated their climatologies.
DECEMBER 2003 1269N O T E S A N D C O R R E S P O N D E N C E
from 1999 to 2001 (Thompson et al. 2003). Supercellswere defined as storms displaying one or more char-acteristic radar reflectivity structures [e.g., hook ech-oes, inflow notches (Lemon 1977)] and azimuthal windshear4 exceeding 2 3 1023 s21 for at least 30 min.Wind profiles were interpolated to the location of thesurface observing station nearest to the event at thehour nearest to the event.5 All soundings were within30 min and 40 km of the supercells. Attempts weremade to exclude supercells processing potentiallybuoyant air from above the boundary layer (‘‘elevatedsupercells’’) by requiring that model proximity sound-ings have surface-based convective available potentialenergy (CAPE). Additional details about how sound-ings were chosen for each supercell event are describedby Thompson et al. (2003).
Only right-moving (cyclonically rotating) supercellswere included in the analysis. Supercells were classifiedas nontornadic (NT; 215 cases), ‘‘weakly tornadic’’(WT; associated with F0–F1 tornadoes; 144 cases), and‘‘significantly tornadic’’ (ST; associated with F2–F5 tor-nadoes; 54 cases). For each class of supercells, verticalprofiles of mean and standard deviation values for anumber of parameters related to environmental windspeed and wind shear were computed. No smoothingwas applied to the vertical wind profiles, nor to theprofiles of derived parameters. Vertical derivatives wereestimated using second-order, centered finite differenc-es, except at the ground. All variable definitions areconsistent with those used by Davies-Jones (1984).Their relationship to the hodograph can be viewed inFig. 1.
Figures 2 and 3 contain profiles of the zonal (u) andmeridional (y) wind components for each of the threesupercell classes. Figures 4–7 contain profiles ofground-relative wind speed | v | , storm-relative windspeed | v 2 c | , vertical wind shear magnitude | dv/dz | ,and negative hodograph curvature 2df/dz (positive val-ues indicate clockwise turning of the shear vector, dv/dz), respectively, where v(z) 5 [u(z), y(z)] is the en-vironmental horizontal wind vector, c is the observedstorm motion, and f(z) describes the orientation of thewind shear.
The vertical wind shear can be decomposed into‘‘speed shear’’ and ‘‘directional shear’’ in the referenceframe of the storm, following Davies-Jones (1984):
dv d |v 2 c| dc5 p 1 |v 2 c| q, (1)
dz dz dz
where p(z) 5 (cosc, sinc) and q(z) 5 (2sinc, cosc)
4 This shear criterion is similar to that used by the National SevereStorms Laboratory’s Mesocyclone Detection Algorithm (Stumpf etal. 1998).
5 Although interpolation was not required for the study, the vagariesof the software used to archive the model soundings facilitated thecollection of profiles that had been bilinearly interpolated to a surfaceobserving station.
are unit vectors parallel and normal to the left of thestorm-relative wind, respectively, and c(z) describes theorientation of the storm-relative wind (Fig. 1). Neglect-ing horizontal vertical velocity gradients, the environ-mental horizontal vorticity is v(z) 5 (2dy/dz, du/dz),which gives
dc d |v 2 c|v 5 2|v 2 c| p 1 q. (2)
dz dz
The components of v in the directions of p and q oftenare referred to as the streamwise vorticity (vs) and cross-wise vorticity (vc) components, respectively, where itis implied that these components apply to the storm-relative reference frame.
Figures 8–11 contain profiles of crosswise vorticityvc (5d | v 2 c | /dz), streamwise vorticity vs (52 | v 2c | dc/dz), ground-relative helicity (GRH) density v · v,and storm-relative helicity (SRH) density (v 2 c) · v,respectively. The GRH (SRH) density is the integrandof GRH (SRH); thus, the area to the left of the v · v[(v 2 c) · v] profiles represents GRH (SRH), and thev · v[(v 2 c) · v] profiles provide information aboutthe vertical distribution of GRH (SRH).6
Two-sample t tests were conducted to obtain a mea-sure of the robustness of the differences between themean vertical profiles of the various parameters. Lightgray shading in Figs. 2–11 denotes layers in which themean ST value differs from the NT value at the 95%significance level. Dark gray shading denotes layers inwhich the mean ST value differs from the NT and WTvalue at the 95% significance level.
Mean hodographs were constructed for each of thethree classes of supercells (Fig. 12), using the data dis-played in Figs. 2 and 3. No transformations of the ho-dographs were performed prior to averaging, as has beendone in some past studies (e.g., Darkow and McCann1977; Kerr and Darkow 1996). Other calculations werecompleted (not shown) in which, prior to averaging thehodographs, the 0–6-km mean wind was removed, fol-lowed by a rotation of the hodograph so that the bulkRichardson number shear vector (the vector differencebetween the mean winds in the 0–500-m and 0–6-kmlayers) was oriented from west to east. These results didnot differ significantly from those presented herein,largely due to the large-scale vertical wind shear beingapproximately westerly in the majority of supercell en-vironments.
3. Results
In this section, some of the interesting differencesand similarities among the ST, WT, and NT supercellclasses are summarized.
Ground-relative wind speeds are larger in ST envi-
6 The GRH associated with the geostrophic wind is proportionalto temperature advection.
1270 VOLUME 18W E A T H E R A N D F O R E C A S T I N G
ronments than in WT and NT environments. On average,speeds in ST environments are 5 (4) m s21 larger thanspeeds in NT (WT) environments (Fig. 4). These dif-ferences are considerably larger and more statisticallyrobust in the lower to middle troposphere than the storm-relative wind speed differences, to be discussed below.We speculate that the larger ground-relative winds maygive rise to larger low-level vertical wind shear due tofriction near the ground (simulations conducted with afree-slip lower boundary yield identical results as thehodograph is translated with respect to the origin). Orperhaps larger ground-relative wind speeds imply stron-ger larger-scale dynamical forcing, and something aboutthis type of atmosphere (yet undiscovered) is favorablefor ST supercells. Strong tornadoes have long been as-sociated with anomalously fast low-level and upper-lev-el jets and large surface pressure gradients (Johns andDoswell 1992). Furthermore, we find it interesting thatthe y wind component is decidely larger in ST envi-ronments (Fig. 3) compared to WT and especially NTenvironments, on average. This may imply that ST en-vironments tend to be associated with more amplifiedsynoptic-scale (short wave) troughs compared to NT andWT environments, which also is consistent with theaforementioned observation that strong tornadoes havelong been associated with relatively strong synoptic-scale dynamics.
Storm-relative wind speeds are similar through thelower to middle troposphere in ST, WT, and NT envi-ronments. Storm-relative wind speed differences were,2 m s21 below approximately 10 km, above whichstorm-relative wind speeds were 2–4 m s21 weaker inST environments compared to NT environments (Fig.5). Although the storm-relative wind differences be-tween NT and ST environments are statistically signif-icant in the 2.7–5.7-km layer and above 10.4 km, it isbelieved that the differences are not what could betermed meteorologically significant; that is, differencesare less than what could be expected to be detectedobservationally in a real-time setting (storm motion es-timates alone probably are associated with .2 m s21
velocity uncertainty, given the range of motions typi-cally obtained depending on whether the echo centroid,mesocyclone, or bounded weak-echo region is tracked).Thompson (1998) found, using Eta Model analyses, thatsurface storm-relative wind speeds were similar (within;2 m s21), on average, in nontornadic and tornadicsupercell environments, consistent with the results ob-tained herein. However, he also found that the storm-relative wind speeds were similar at 250 mb, and at 500mb, more significant differences (;4 m s21) betweennontornadic and tornadic supercell environments wereobtained. These middle- to upper-tropospheric differ-ences, compared to the present study, might be recon-ciled by noting the smaller sample used by Thompson(1998), as well as the relatively large standard deviationsof 500- and 250-mb storm-relative wind speeds (.4 and.8 m s21, respectively) in tornadic and nontornadic
environments. On the other hand, the simulation find-ings of Brooks et al. (1994b) are more difficult to rec-oncile with the midlevel storm-relative flow similaritiesobtained herein (Fig. 5), if one assumes that the like-lihood of a tornado being produced by a supercell gen-erally increases with the intensity of mesocyclone ro-tation near the surface. Brooks et al. found that thestrength of midlevel storm-relative winds (which theyaltered by modifying the midlevel vertical wind shear)had a substantial influence on the distribution of pre-cipitation within supercells, the development of low-level temperature gradients, and ultimately the produc-tion of rotation near the surface. Based on their findings,one might have expected that more significant differ-ences in midlevel storm-relative wind speeds wouldhave been obtained among the ST, WT, and NT supercellclasses.
Vertical wind shear magnitude, streamwise vorticity,and SRH density (and therefore its integral SRH) in STenvironments are significantly larger than in WT andNT environments in the lowest 1 km. The differencesare largest at the surface, and in the lowest 500 m, theseparameters are twice as large in ST environments thanin both WT and NT environments (Figs. 6, 9, and 11).Above 1 km, these parameters generally are not signif-icantly different. These results are consistent with theMarkowski et al. (1998) findings of substantially largerSRH in the lowest 1 km in tornadic versus nontornadicsupercell environments. We note, however, that althoughthe 0–1-km SRH contains the differences, the 0–3-kmSRH (Davies-Jones et al. 1990) does not mask them;that is, the SRH in the 1–3-km layer is similar in allsupercell environments.7 McCaul and Weisman (2001)also arrived at a similar conclusion regarding the im-portance of the vertical wind shear near the surface.Furthermore, GRH density (and therefore its integralGRH) is substantially larger in ST cases compared toWT and NT cases in roughly the 500–1500-m layer(Fig. 10), perhaps implying stronger warm advection inST environments (this depends on the degree of ageo-strophy in ST versus WT/NT environments). These dif-ferences, along with the differences in | dv/dz | in thelowest 1 km, are perhaps especially noteworthy becausethey are insensitive to storm motion.
No robust differences in hodograph curvature existamong the three supercell classes. Statistically signifi-cant differences (which are arguably meteorologicallyinsignificant, especially upon viewing Fig. 12) betweenST and NT curvature exist only in a couple of shallowlayers (both are ,300 m deep) (Fig. 7). Note that 2df/dz has particularly large standard deviations reflectingthe fact that it is related to a second derivative of thevertical wind profile and hence is error prone.
The differences between WT and NT environments
7 One of the reasons Davies-Jones et al. (1990) chose the 0–3-kmlayer for SRH calculations was the scarcity of low-level data pointsfrom wind profilers and soundings.
DECEMBER 2003 1271N O T E S A N D C O R R E S P O N D E N C E
typically are quite small and generally are not statis-tically significant. For example, | dv/dz | differences be-tween NT and WT supercells are not statistically sig-nificant at any level. (Significance levels between NTand WT supercells are not indicated with shading inFigs. 4–11, in order to make the figures more readable.)This perhaps is not terribly surprising; even on stormscales observed during recent field experiments usingmobile in situ sensors and radar, many kinematic traitsof WT and NT supercells have been virtually indistin-guishable (e.g., Blanchard and Straka 1998; Trapp 1999;Wakimoto and Cai 2000; Markowski et al. 2002). Inlayers in which statistically significant differences inhodograph parameters are observed between WT andNT environments, the differences between the WT andNT profiles usually are smaller than the differences be-tween ST and WT profiles.
The shapes of the mean hodographs are virtually in-distinguishable above 1 km. The most obvious hodo-graph differences (Fig. 12) are the locations with respectto the origin (a manifestation of the | v | differences)and the length of the hodograph below 1 km, whichleads to the | dv/dz | , vs, and (v 2 c) · v differencesnoted above. The storm motions with respect to thehodographs only differ slightly, with the differences al-most entirely due to the hodograph differences below 1km [i.e., if one uses a Galilean invariant empirical stormmotion predictor, such as the Rasmussen and Blanchard(1998) or Bunkers et al. (2000) techniques, the stormmotions are equally well anticipated for all three meanhodographs for most practical purposes].
4. Final remarks
In summary, ST environments are associated withlarger ground-relative wind speeds in the lower and mid-dle troposphere, vertical wind shear in the lowest 1 km,and streamwise vorticity and SRH in the lowest 1 kmcompared to WT and NT environments, on average.Vertical wind profiles associated with ST, WT, and NTenvironments, on average, are relatively similar in termsof storm-relative wind speeds in the lower and middletroposphere, hodograph curvature at most levels, andcrosswise vorticity at most levels.
The reader should be cautioned that there is consid-erable variability in the vertical profiles of the hodo-graph parameters. Standard deviations of many of theparameters are nearly as large as the parameters them-selves.
Some remaining questions to ponder include the fol-lowing:
• To what extent, if any, is the finding of vertical windshear and streamwise vorticity differences in the low-est 1 km between ST and NT/WT environments dueto the interaction of ST storms with low-level baro-clinic boundaries?
• Could there be any relationship between the observed
wind profile differences and rear-flank downdraft ther-modynamic properties, which recently have beenfound to differ between tornadic and nontornadic su-percells?
• When wind profile characteristics such as those in-vestigated herein are combined with thermodynamicprofile characteristics, how much improvement can begained in our ability to distinguish between supercelltypes? Which combinations of parameters are best?
• Should storm-relative wind speeds continue to be as-sessed in an operational setting to discriminate be-tween tornadic and nontornadic supercells?8
Given the wind profile similarities above 1 km, thereis little wonder why operationally discriminating be-tween tornadic and nontornadic environments has beenso difficult. It is believed that it may be worthwhile todevelop new technologies capable of better samplingthe vertical wind profile in the lowest 500–1000 m, andwith much improved horizontal resolution compared tothe current wind profiler demonstration network. Wealso believe it would be worthwhile for future numericalsimulation studies to concentrate on the effects of ho-dograph differences in this layer, perhaps in a mannersimilar to that of Wicker (1996), with a realistic inclu-sion of surface drag. The majority of past parameterspace studies probably did not have adequate verticalresolution near the ground (two to three grid points inthe lowest kilometer) to explore the sensitivity of stormsto near-ground wind profile changes.
Acknowledgments. We are thankful for commentsprovided by Mr. Steve Weiss, Mr. Barry Schwartz, Mr.Matt Bunkers, Dr. Brain Klimowski, Dr. Bob Davies-Jones, Dr. Erik Rasmussen, Dr. Jerry Straka, Dr. YvetteRichardson, and an anonymous reviewer.
REFERENCES
Benjamin, S. G., and Coauthors, 2002: RUC20—The 20 km versionof the Rapid Update Cycle. NWS Tech. Procedures Bull. 490,30 pp.
Blanchard, D. O., and J. M. Straka, 1998: Some possible mechanismsfor tornadogenesis failure in a supercell. Preprints, 19th Conf.on Severe Local Storms, Minneapolis, MN, Amer. Meteor. Soc.,116–119.
Brooks, H. E., and J. P. Craven, 2002: A database of proximity sound-ings for significant severe thunderstorms, 1957–1993. Preprints,21st Conf. on Severe Local Storms, San Antonio, TX, Amer.Meteor. Soc., 639–642.
——, C. A. Doswell III, and J. Cooper, 1994a: On the environmentsof tornadic and nontornadic mesocyclones. Wea. Forecasting,9, 606–618.
——, ——, and R. B. Wilhelmson, 1994b: The role of midtropo-spheric winds in the evolution and maintenance of low-levelmesocyclones. Mon. Wea. Rev., 122, 126–136.
Bruening, S. L., M. P. Kay, and H. E. Brooks, 2002: A new perspective
8 Clearly we do not advocate neglecting low-level storm-relativewind velocities, because low-level streamwise vorticity and SRH aresensitive to storm-relative wind direction changes with height.
1272 VOLUME 18W E A T H E R A N D F O R E C A S T I N G
on the climatology of tornadoes in the United States. Preprints,16th Conf. on Probability and Statistics, Orlando, FL, Amer.Meteor. Soc., J96–J103.
Bunkers, M. J., B. A. Klimowski, J. W. Zeitler, R. L. Thompson, andM. L. Weisman, 2000: Predicting supercell motion using a newhodograph technique. Wea. Forecasting, 15, 61–79.
Craven, J. P., H. E. Brooks, and J. A. Hart, 2002: Baseline climatologyof sounding derived parameters associated with deep, moist con-vection. Preprints, 21st Conf. on Severe Local Storms, San An-tonio, TX, Amer. Meteor. Soc., 643–646.
Darkow, G. L., 1968: The total energy environment of severe storms.J. Appl. Meteor., 7, 199–205.
——, 1969: An analysis of over sixty tornado proximity soundings.Preprints, Sixth Conf. on Severe Local Storms, Chicago, IL,Amer. Meteor. Soc., 218–221.
——, and D. W. McCann, 1977: Relative environmental winds for121 tornado bearing storms. Preprints, 10th Conf. on SevereLocal Storms, Omaha, NE, Amer. Meteor. Soc., 413–417.
Davies, J. M., 1998: On BRN shear and CAPE associated with tor-nadic environments. Preprints, 19th Conf. on Severe LocalStorms, Minneapolis, MN, Amer. Meteor. Soc., 599–602.
——, 2002: On low-level thermodynamic parameters associated withtornadic and nontornadic supercells. Preprints, 21st Conf. onSevere Local Storms, San Antonio, TX, Amer. Meteor. Soc., 603–606.
——, and R. H. Johns, 1993: Some wind and instability parametersassociated with strong and violent tornadoes. Part I: Wind shearand helicity. The Tornado: Its Structure, Dynamics, Prediction,and Hazards, Geophys. Monogr., No. 79, Amer. Geophys.Union, 573–582.
Davies-Jones, R. P., 1984: Streamwise vorticity: The origin of updraftrotation in supercell storms. J. Atmos. Sci., 41, 2991–3006.
——, D. Burgess, and M. Foster, 1990: Test of helicity as a tornadoforecast parameter. Preprints, 16th Conf. on Severe Local Storms.Kananaskis Park, AB, Canada, Amer. Meteor. Soc., 588–592.
Edwards, R., and R. L. Thompson, 2000: RUC-2 supercell proximitysoundings. Part II: An independent assessment of supercell fore-cast parameters. Preprints, 20th Conf. on Severe Local Storms,Orlando, FL, Amer. Meteor. Soc., 435–438.
Johns, R. H., and C. A. Doswell III, 1992: Severe local storms fore-casting. Wea. Forecasting, 7, 588–612.
——, J. M. Davies, and P. W. Leftwich, 1993: Some wind and in-stability parameters associated with strong and violent tornadoes.Part II: Variations in the combinations of wind and instabilityparameters. The Tornado: Its Structure, Dynamics, Prediction,and Hazards, Geophys. Monogr., No. 79, Amer. Geophys.Union, 583–590.
Kerr, B. W., and G. L. Darkow, 1996: Storm-relative winds and he-licity in the tornadic thunderstorm environment. Wea. Fore-casting, 11, 489–505.
Lemon, L. R., 1977: New severe thunderstorm radar identificationtechniques and warning criteria: A preliminary report. NOAATech. Memo. NWS NSSFC-1, 60 pp. [NTIS PB-273049.]
Maddox, R. A., 1976: An evaluation of tornado proximity wind andstability data. Mon. Wea. Rev., 104, 133–142.
Markowski, P. M., J. M. Straka, and E. N. Rasmussen, 1998: A pre-liminary investigation of the importance of helicity ‘location’ inthe hodograph. Preprints, 19th Conf. on Severe Local Storms,Minneapolis, MN, Amer. Meteor. Soc., 230–233.
——, ——, and ——, 2002: Direct surface thermodynamic mea-surements within the rear-flank downdrafts of nontornadic andtornadic supercells. Mon. Wea. Rev., 130, 1692–1721.
McCaul, E. W., and M. L. Weisman, 2001: The sensitivity of sim-ulated supercell structure and intensity to variations in the shapesof environmental buoyancy and shear profiles. Mon. Wea. Rev.,129, 664–687.
Rasmussen, E. N., and R. B. Wilhelmson, 1983: Relationships be-tween storm characteristics and 1200 GMT hodographs, low-level shear, and stability. Preprints, 13th Conf. on Severe LocalStorms, Tulsa, OK, Amer. Meteor. Soc., J5–J8.
——, and D. O. Blanchard, 1998: A baseline climatology of sound-ing-derived supercell and tornado forecast parameters. Wea.Forecasting, 13, 1148–1164.
Stumpf, G. J., A. Witt, E. D. Mitchell, P. L. Spencer, J. T. Johnson,M. D. Eilts, K. W. Thomas, and D. W. Burgess, 1998: The Na-tional Severe Storms Laboratory Mesocyclone Detection Al-gorithm for the WSR-88D. Wea. Forecasting, 13, 304–326.
Thompson, R. L., 1998: Eta Model storm-relative winds associatedwith tornadic and nontornadic supercells. Wea. Forecasting, 13,125–137.
——, and R. Edwards, 2000: RUC-2 supercell proximity soundings.Part I: An examination of storm-relative winds normalized tosupercell depth. Preprints, 20th Conf. on Severe Local Storms,Orlando, FL, Amer. Meteor. Soc., 431–434.
——, ——, J. A. Hart, K. L. Elmore, and P. Markowski, 2003: Closeproximity soundings within supercell environments obtainedfrom the Rapid Update Cycle. Wea. Forecasting, 18, 1243–1261.
Trapp, R. J., 1999: Observations of nontornadic low-level mesocy-clones and attendant tornadogenesis failure during VORTEX.Mon. Wea. Rev., 127, 1693–1705.
Wakimoto, R. M., and H. Cai, 2000: Analysis of a nontornadic stormduring VORTEX 95. Mon. Wea. Rev., 128, 565–592.
Weisman, M. L., M. S. Gilmore, and L. J. Wicker, 1998: The impactof convective storms on their local environment: What is anappropriate ambient sounding? Preprints, 19th Conf. on SevereLocal Storms, Minneapolis, MN, Amer. Meteor. Soc., 238–241.
Wicker, L. J., 1996: The role of near surface wind shear on low-levelmesocyclone generation and tornadoes. Preprints, 18th Conf. onSevere Local Storms, San Francisco, CA, Amer. Meteor. Soc.,115–119.