Embed Size (px)
Citation preview
NOTES AND REFERENCES J. The classic books on baseband-pulse transmission are Lucky, Salz, and Weldon (1968) and
Sunde (1969) . For detailed treatment of different aspects of the subject, see Gitlin, Hayes, and Weinstein (1992), Proakis (2001), and Benedetto, Biglieri, and Castellani (1987).
2. For review material on the matched filter and its properties, see the papers by Turin (1960, 1976). 3. The requirements for 100 Mbps transmjssion for internet applications are described in the stan
dards: IEEE Std. 802.3 - 2005, Part 3; and ANSI X3.263 (1995).
PROBLEMS
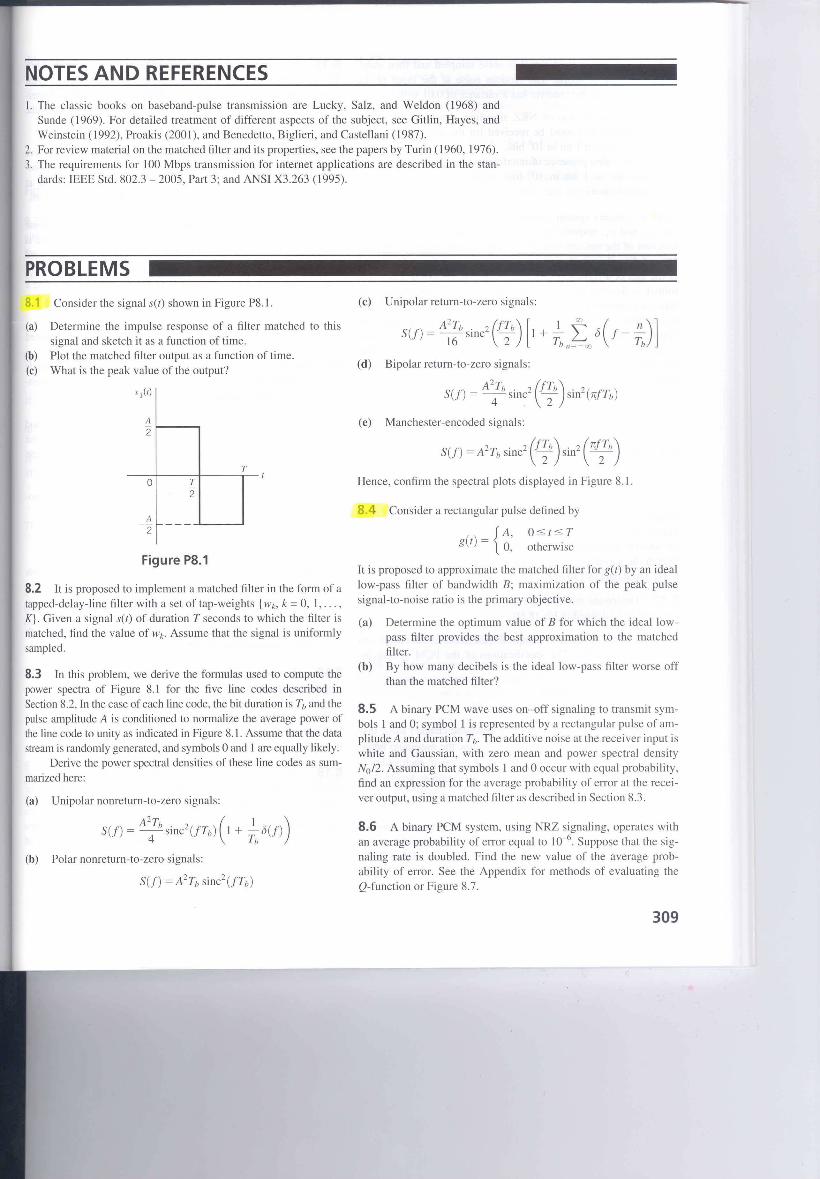
8.1 Consider the signal set) shown in Figure P8.1.
(a) Determine the impulse response of a fi lter matched to this signal and sketch it as a function of time.
(b) Plot the matched filter output as a function of time. (c) What is the peak value of the output?
A 2f-----.
o T
2
T
A - 2 r-----L.--...J
Figure P8.1
8.2 It is proposed to implement a matched filter in the form of a tapped-delay-line filter with a set of tap-weights (Wb k = 0, 1, . .. , K). Given a signal set) of duration T seconds to which the filter is matched, find the value of Wk . Assume that the signal is uniformly sampled.
8.3 In this problem, we derive the formulas used to compute the power spectra of Figure 8.1 for the five line codes desclibed in Section 8.2, [n the case of each ljne code, the bit duration is Tb and the pulse amplitude A is conditioned to normalize the average power of the line code to unity as indicated in Figure 8.1. Assume that the data stream is randomly generated, and symbols 0 and I are equally likely.
Derive the power spectral densities of these line codes as sumIl1lliized here:
(a) Unipolar nonreturn-to-zero signals:
S(f) = A2Tb sinc2(fTb) (1 + ~b(f)) 4 Tb
(b) Polar nonreturn-to-zero signals:
S(f) = A2Tb sinc2 (fTb)
(c) Unipolar return-to-zero signals:
S(f) = A2T" sinc2 (ITb) [1 + ~ t b (I - ~)]
16 2 Tbll=- ro T"
(d) Bipolar return-to-zero signals:
A2Tb . 2 (ITb) . 2 S(f) = --slnc - sm (nITb) 4 . 2
(e) Manchester-encoded signals:
2 . 2 (ITb) . 2 (nITb) S(f) = A Tb smc 2 Slll - 2-
Hence, confirm the spectral plots displayed in Figure 8.1.
8.4 Consider a rectangular pulse defined by
g(t) = { ~: O ~ f ~ T
otherwise
It is proposed to approximate the matched filter for get) by an ideal low-pass filter of bandwidth B; maximization of the peak pulse signal-to-noise ratio is the primary objective.
(a) Determine the optimum value of B for which the ideal lowpass filter provides the best approximation to the matched filter.
(b) By how many decibels is the ideal low-pass filter worse off than the matched filter?
8.5 A binary PCM wave uses on-off signaling to transmit symbols 1 and 0; symbol 1 is represented by a rectangular pulse of amplitude A and duration Tb. The additive noise at the receiver input is white and Gaussian, with zero mean and power spectral density No/2 . Assuming that symbols I and 0 occur with equal probability, find an expression for the average probability of elTor at the receiver output, using a matched filter as described in Section 8.3.
8.6 A binary PCM system, using NRZ signaling, operates with an average probability of elTor equal to 10-6
. Suppose that the signaling rate is doubled. Find the new value of the average probability of elTor. See the Appendix for methods of evaluating the Q-function or Figure 8.7 .
309
8.7 A continuous-time signal is noise sampled and then transmitted as a PCM signal. The random noise at the input of the decision device in the receiver has a variance of 0.0 I volts2
(a) Assuming the use of NRZ signal ing, determine the pulse amplitude that must be received for the average error rate not to exceed I bit in 108 bits.
(b) If the added presence of interference causes the error rate to increase to I bit in 106 bits, what is the variance of the i n,erference?
8.8 In a binary system, symbols 0 and I have a priori probabilities Po and Ph respectively. The cond itional probability density function of the random variable Y (with sample value y) obtained by sampling the matched filter output in the receiver of Figure 8.5 at the end of a signaling interval, given that ymbol 0 was transmitted, is denoted by fy(yIO). Similarly,fy(yl!) denotes the conditional probability density function of Y, given that symbol I was transmitted. Let }, denote the threshold used in the receiver, so that if the sample value y exceeds }" the receiver decides in favor of symbol I; otherwise, it decides in favor of symbol O. Show that the optimum threshold }'op" for which the average probability of error is a minimum, is given by the solution of
fyVop,l!) Po
jy(Aoptl O) PI
8.9 The overall pulse shape pet) of a baseband binary PAM system is defined by
p(t) = sinc (;J where Tb is the bit duration of the input binary data. The amplitude levels at the pulse modulator output are + 1 or - I, depending on whether the binary symbol at the input is I or 0, respectively. Sketch the waveform at the output of the receive filter in response to the input data OOLIOIOOL
8.10 Determine the inverse Fourier transform of the frequency function P(f) defined in Eq. (8.60).
8.11 An analog signal is sampled, quantized, and encoded into a binary PCM wave. The specifications of the PCM system include the following:
Sampl ing rate = 8 kHz Number of representation levels = 64
The PCM wave is transmitted over a baseband channel using dis
crete pulse-amplitude modulation. Determine the minimum band
width required for transmitting the PCM wave if each pulse is
allowed to take on the following number of amplitude leveLs: 2,4,
or 8.
8.12 Consider a baseband binary PAM system that is designed to have a raised-cosine spectrum P(f). The resulting pulse p(t) is defined in Eq . (8.62). How would this pulse be modified if the system was designed to have a linear phase response?
310
8.13 A computer puts out binary data at the rate of 56 kb/s. The computer output is transmitted using a baseband binary PAM system that is designed to have a raised-cosine spectrum. Determine the transmission bandwidth required for each of the following roll-off factors: CJ. = 0.25, 0.5 , 0,75 , J .0.
8.14 Repeat Problem 8.13, given that each set of three successive binary digits in the computer output are coded into one of eight possible amplitude levels, and the resulting signal is transmitted using an eight-level PAM system designed to have a raised-cosine spectrum.
8.15 An analog signaL is sampled, quantized, and encoded into a binary PCM wave. The number of representation levels used is 128. A synchronizing puLse is added at the end of each code word representing a sample of the analog signal. The resuLting PCM wave is transmitted over a channel of bandwidth L2 kHz using a quaternary PAM system with raised-cosine spectrum. The roll-off factor is unity.
(a) Find the rate (b/s) at which information is transmitted through the channel.
(b) Find the rate at which the analog signal is sampled. What is the maximum possible value for the highest frequency component of the analog signal?
8.16 A binary PAM wave is to be transmitted over a baseband channel with an absolute maximum bandwidth of 75 kHz. The bit duration is 10 )1S . Find a raised-cosine spectrum that satisfies these requirements.
8.17 A digital communication system uses the one-sided exponentiaL for the pulse shape to transmit data
p (t ) = { ~xp( -fIT:) t < O t ? 0
(a) What is the worst case intersymbol interference with this pulse shape if r = T where T is the symbol period?
(b) If a 20 percent reduction of the eye opening due to intersymbol interference is tolerable what is the optimum value of , ?
What is the difference in 3-dB bandwidth of the signal with this r compared to r = T?
8.18 The combination of the transmitter and channel produces a pulse with its amplitude spectrum defined by
H(f) = exp( -lfIT)
Determine the spectrum of the ideal receive filter that wouLd eliminate intersymbol interference.
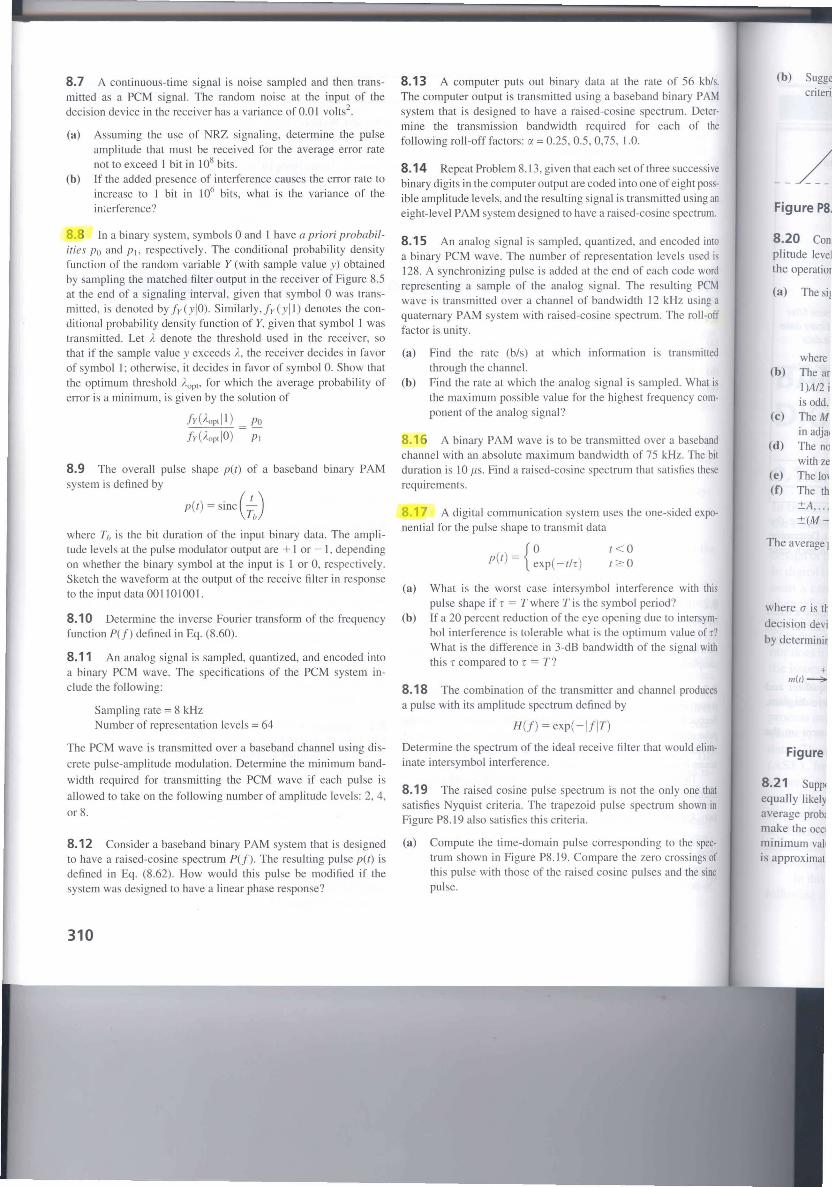
8.19 The raised cosine pulse spectrum is not the only one that satisfies Nyquist criteria. The trapezoid puLse spectrum shown in Figure P8.19 also satisfies this criteria.
(a) Compute the time-domain pulse corresponding to the spectrum shown in Figure P8.19. Compare the zero crossings of this pulse with those of the raised cosine pulses and the sine pulse.
(b) Sugge criteri,
Figure P8.
8.20 Con plitude level the operatior
(a) The sil
where (b) The an
1)A/2 i is odd.
(c) TheM in adjal
(d) The no with ze
(e) The 101 (f) The th
:tA , ... :t(M -
The average I
where (J is t/'
decision de vi
by determinir
+ m(I)~
Figure
8.21 SUpPi equally likely average prob: make the OCCI
minimum vall is approximat
(b) Suggest another pulse spectrum that satisfies Nyquist's criterion.
PIjJ I I
I
- - - - - - - - - - _I - - - _ _ _ _ _ _ _ _ _ _ J - w 0 \V
Figure P8.19
8.20 Consider a baseband M-ary system using M discrete amplitude levels. The receiver model is as shown in Figure P8.20; the operation of which is governed by the following assumptions:
(a) The signal component in the received wave is
m(t) = L all sinc (!.- -n) II T
where liTis the signaling rate in bauds. (b) The amplitude levels are {III = ±AI2, ±3A12, .. . , ±(M -
I)Al2 if M is even, and all = 0, ±A, ... , ±(M - I)AI2 if M is odd.
(c) The M levels are equiprobable, and the symbols transmitted in adjacent time slots are stat isticall y independent.
(d) The noise w(t) at the receiver input is white and Gaussian with zero mean and power spectral density No/2.
(e) The low-pass filter is ideal with bandwidth 8 = 1/2T. (f) The threshold levels used in the decision device are O.
±A, .. . , ±(M - 3)Al2 if M is even, and ±AI2, ±3A12, . .. , ±(M - 3)A12 if M is odd.
The average probabi I ity of symbol error in this system is defined by
where (J is the standard deviation of the noise at the input of the
decision device. Demonstrate the validity of this general formula
by determining P e for the following three cases: M = 2, 3,4.
lII(r)
lI"(r)
Figure P8.20
Low-pass filter
Decisiondevice
Threshold
Output
8.21 Suppose that in a baseband M-ary PAM system with M equally likely amplitude levels, as described in Problem 8.20, the average probability of symbol error Pe is less than 10- 6 so as to make the occulTence of decoding errors negligible. Show that the minimum value of received signal-to-noise ratio in such a system is approximately given by
(SNR)R,mil1 ~ 7.8(M2 - I )
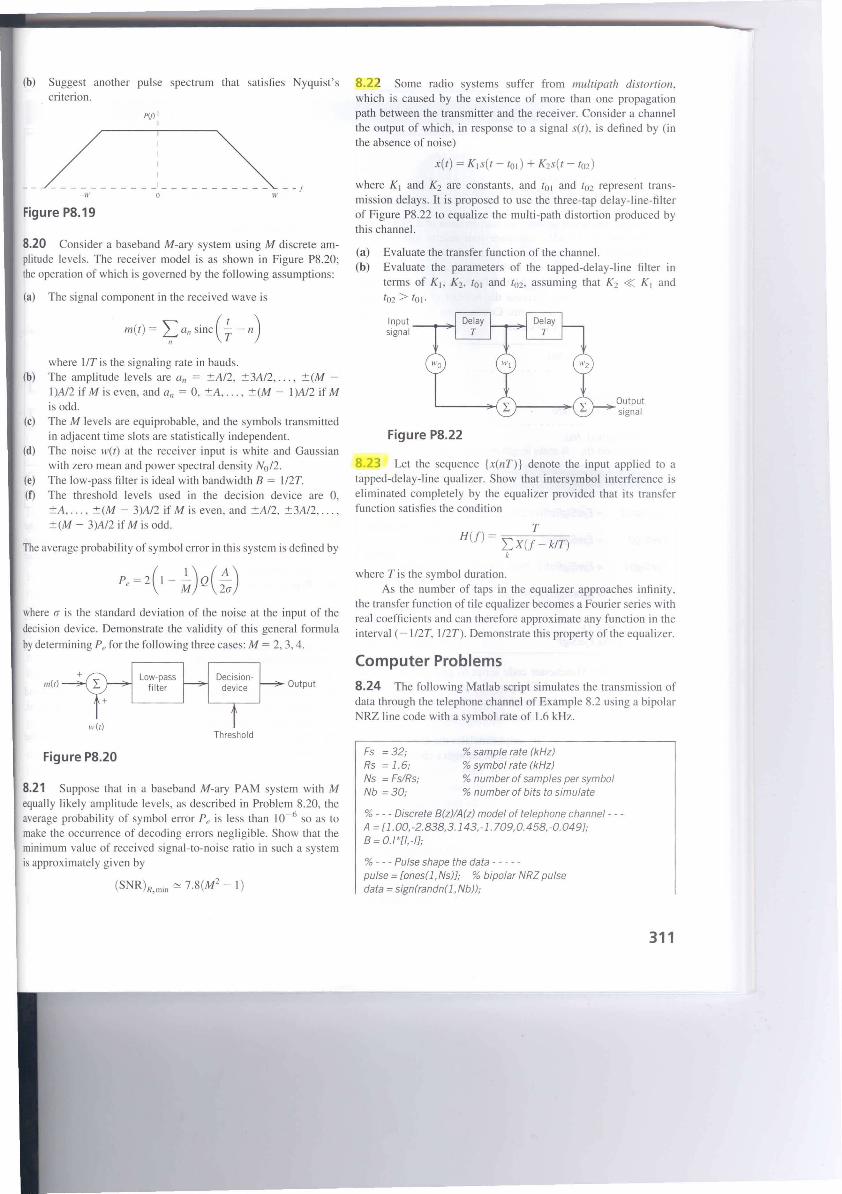
8.22 Some radio systems suffer from mu/tipath distortion. which is caused by the existence of more than one propagation path between the transmitter and the receiver. Consider a channel the output of which, in response to a signal S(I), is defined by (in the absence of noise)
x(t) = KIs(t - 101 ) + K2S(1 - 102 )
where KI and K2 are constants, and tal and t02 represent transmission delays. It is proposed to use the three-tap delay-line-filter of Figure P8.22 to equalize the multi-path distortion produced by this channel.
(a) Evaluate the transfer function of the channel. (b) Evaluate the parameters of the tapped-delay-line filter 111
terms of Ki> K2 , 101 and 102, assuming that Kl « KI and
102> 101'
Input signal -"""""""
Figure P8.22
Output signal
8.23 Let the sequence {x(nT)} denote the input applied to a tapped-delay-line qualizer. Show that intersymbol interference is eliminated completely by the equalizer provided that its transfer function satisfies the condition
T H(J) = I:X(J - kiT)
k
where T is the symbol duration. As the number of taps in the equalizer approaches infinity,
the transfer function of tile equalizer becomes a Fourier series with real coefficients and can therefore approximate any function in the interval (- 1/2T, J 12T). Demonstrate this property of the equalizer.
Computer Problems
8.24 The following Matlab script simulates the transmission of data through the telephone channel of Example 8.2 using a bipolar NRZ line code with a symbol rate of J.6 kHz.
Fs =32; Rs = 1.6; Ns = FS/Rs; Nb =30;
% sample rate (kHz) % symbol rate (kHz) % number of samples per symbol % number of bits to simulate
% - - - Discrete B(z)IA(z) model of telephone channel - - -A = [1.00,-2.838,3.143,-1.709,0.458,-0.049); B = O.l *[I,-/};
% - - - Pulse shape the data - - - - -pulse = [ones(1,Ns)); % bipolar NRZ pulse data = sign(randn(1, Nb));
311
Sig = pulse' * data; Sig = Sig(:);
% - - - Pass signal through the channel - - - -RxSig = filter(B,A, Sig);
% - - - Plot results - - - - - - - - - - - - - - - - - - - - - - - -plot(real(RxSig)) hold on, plot(Sig, 'r') . hold off xtabel ('Time samples'), ylabel('Amplitude')
(a) Modify the script to simulate transmission of a Manchester line code at 1.6 kHz. Compare your resu lts with those of Example 8.2. Increase the data rate to 3.2 kHz and repeat.
(b) Process the channel output with a fi lter matched to the pul se shape. Use the fo llowing Mat lab function to plot the eye dia
gram of the signal. Increase the number of bits simul ated when plott ing eye di agrams. Comment on the eye opening
for the 1.6 and 3.2 kHz cases.
function b = ploteye(s,Ns); % -- -- - - -- - --- - - - - -- - - - - - -- - - -- -- -- ------% Inputs % s - real signal % Ns - oversample rate % - - -- - - - - -- - - - - - - -- - - - - - - - - - -- - - - - - - ----f = mod{/ength(s), Ns); 5 = real(s{/:end-f)); % make length multiple of Ns
%- - - extract individual symbol periods from signal - - -EyeSigRef = reshape(s, Ns, length(s)INs); % one
symbol per column EyeSigm1 = EyeSigRef(Nsl2;Ns, 1 :end-2); % last half
of preceding symbol EyeSigO = EyeSigRef(: ,2;end-l}; % current
EyeSigp1
EyeSig
symbol = EyeSigRef( 1: Nsl2, 3:end), % first half of
following symbol = [EyeSigm1; EyeSigO; EyeSigp1l; % tack
together for curve
L = size(EyeSig, 1);
plot([O: L -1 ]INs, EyeSig) % plot multiple curves
(c) Modify the Manchester code script to produce an M-ary line code with M = 4. Compare the eye opening with M = 4
for the 1.6 and 3.2 kHz symbol rates. Comment on the drawbacks of transmitting data at the higher rate .
8.25 The following Matlab script simulates the transmission of a pulse having a raised cosine spectrum through a channel with an
impu lse response given by
312
h(t) = {~xp(-tlr) 1<0 12:0
T Rs
= 1; = lIT;
% symbol period % symbol rate
Ns Fs
= 16; = Rs"Ns;
% number of samples per symbol % sample rate (kHz)
Nb alpha
=3000; = 1.0;
% number of bits to simulate % rolloff of raised cosine
% - - - Discrete model of telephone channel - - -t = [0: lIFs: 5*Tl; h = exp(-t I (TI2)) I Fs; % impulse response scaled for
% sample rate
% - - - Pulse shape the data - - - - -pulse = firrcos(5*Ns, Rs12, Rs *alpha, Fs); % 100
data = sign (randn(1 , Nb)); Udata = [1; zeros(Fs-1, 1)] * data; Udata = Udata(:); Sig = filter (pulse, 1, Udata); Sig = Sig( (/ength(pulse)-l}12: end);
% - - - Pass signal through the channel - - - -RxSig = filter(h, 1, Sig);
% raised cosine filter % random binary data % upsample data %11
% pulse shape data % remove filter % delay
% - - - Plot results - - - - - - - - - - - - - - - - - - - - -plot(real(RxSig)) hold on, plot(Sig, 'r'), hold off xlabel('Time samples'), ylabel('Amplitude')
(a) For T = TI2 where T is the symbol period, simulate the
transmission for rolloff factors a: = 0.5 and 1.0. Determine the amount by which the eye opening closes in each case
and comment. (b) Repeat (a) for the case T = T.
8.26 For part (a) of the Problem with rJ. = 0.5 , compute a fixed
tapped equalizer using the techn ique described in Section 8.8. (The set of linear equations Cw = b may be solved in Matlab
using the statement w = inv(C) b.)
(a) Compute the coefficients of a 3-tap T-spaced equalizer and apply it to the simulation output and plot the eye diagram.
Quantify the improvement in the eye opening. (b) Repeat part (a) for a 5-tap equalizer and comment on the
tradeoffs of using a 3- versus 5-tap equalizer.
-
BAr DIG
9.1 IN
In baseban the form 01
a low-pass design of~ In digital b onto a can channel of so as to mil This does I
nor does it the issues t
The CI
link in a 10 process rna quency, or data. Thus. (ASK), fre viewed as modulation they both t nonlineariti reason that for band-pa
In this following is