Embed Size (px)
Citation preview

Notes on Selected Papers in International Macroeconomics
Mikkel Plagborg-Møller∗
Harvard [email protected]
February 22, 2014
DISCLAIMER:
These notes were written in preparation for a second-year PhD exam.They are only meant as rough summaries and can’t substitute foractually reading the papers. I would be very happy to correct anyerrors and misinterpretations as well as entirely removing referencesto papers. Please see the appendix for a list of abbreviations.
Contents
1 Real Business Cycles in Open Economies 41.1 Aguiar and Gopinath (2007): “Emerging Market Business Cycles” . . . . . . . . . . 41.2 Backus, Kehoe and Kydland (1992): “International Real Business Cycles” . . . . . . 5
2 International Risk Sharing and Co-Movements 62.1 Coeurdacier and Rey (2011): “Home bias in open economy macroeconomics” . . . . 62.2 Corsetti, Dedola and Leduc (2008): “International Risk Sharing and the Transmis-
sion of Productivity Shocks” . . . . . . . . . . . . . . . . . . . . . . . . . . . . . . . . 72.3 Heathcote and Perri (2009): “The international diversification puzzle is not as bad
as you think” . . . . . . . . . . . . . . . . . . . . . . . . . . . . . . . . . . . . . . . . 82.4 Kehoe and Perri (2002): “International business cycles with endogenous incomplete
markets” . . . . . . . . . . . . . . . . . . . . . . . . . . . . . . . . . . . . . . . . . . . 10
3 Global Imbalances 103.1 Caballero, Farhi and Gourinchas (2008): “An Equilibrium Model of ‘Global Imbal-
ances’ and Low Interest Rates” . . . . . . . . . . . . . . . . . . . . . . . . . . . . . . 103.2 Mendoza, Quadrini and Rıos-Rull (2009): “Financial Integration, Financial Devel-
opment, and Global Imbalances” . . . . . . . . . . . . . . . . . . . . . . . . . . . . . 12
∗I thank Gita Gopinath for helpful explanations and for devising the reading list. I am solely responsible for anyerrors.
1
4 Valuation Effects 144.1 Curcuru, Dvorak and Warnock (2008): “Cross-Border Return Differentials” . . . . . 144.2 Gourinchas and Rey (2007): “International Financial Adjustment” . . . . . . . . . . 15
5 Financial Crises, International Recessions 165.1 Mendoza (2010): “Sudden Stops, Financial Crises, and Leverage” . . . . . . . . . . . 165.2 Neumeyer and Perri (2005): “Business Cycles in Open Economics: The Role of
Interest Rates” . . . . . . . . . . . . . . . . . . . . . . . . . . . . . . . . . . . . . . . 185.3 Perri and Quadrini (2011): “International Recessions” . . . . . . . . . . . . . . . . . 19
6 Capital Controls 216.1 Bianchi (2011): “Overborrowing and Systemic Externalities in the Business Cycle” . 216.2 Korinek (2011): “The New Economics of Prudential Capital Controls: A Research
Agenda” . . . . . . . . . . . . . . . . . . . . . . . . . . . . . . . . . . . . . . . . . . . 22
7 Sovereign Debt, Debt Crises 247.1 Aguiar and Gopinath (2006): “Defaultable debt, interest rates and the current account” 247.2 Broner, Martin and Ventura (2010): “Sovereign Risk and Secondary Markets” . . . . 277.3 Bulow and Rogoff (1989): “Sovereign Debt: Is to Forgive to Forget?” . . . . . . . . . 297.4 Calvo (1988): “Servicing the Public Debt: The Role of Expectations” . . . . . . . . 307.5 Cole and Kehoe (2000): “Self-Fulfilling Debt Crises” . . . . . . . . . . . . . . . . . . 317.6 Eaton and Gersovitz (1981): “Debt with Potential Repudiation” . . . . . . . . . . . 337.7 Reinhart and Rogoff (2011): “From Financial Crisis to Debt Crash” . . . . . . . . . 347.8 Yue (2010): “Sovereign default and debt renegotiation” . . . . . . . . . . . . . . . . 35
8 Real Exchange Rates and Purchasing Power Parity 378.1 Alessandria, Kaboski and Midrigan (2010): “Inventories, Lumpy Trade and Large
Devaluations” . . . . . . . . . . . . . . . . . . . . . . . . . . . . . . . . . . . . . . . . 378.2 Burstein, Eichenbaum and Rebelo (2005): “Large Devaluations and the Real Ex-
change Rate” . . . . . . . . . . . . . . . . . . . . . . . . . . . . . . . . . . . . . . . . 408.3 Carvalho and Nechio (2011): “Aggregation and the PPP Puzzle in a Sticky-Price
Model” . . . . . . . . . . . . . . . . . . . . . . . . . . . . . . . . . . . . . . . . . . . 428.4 Engel (1999): “Accounting for U.S. Real Exchange Rate Changes” . . . . . . . . . . 458.5 Gopinath, Gourinchas, Hsieh and Li (2009): “Estimating the Border Effect: Some
New Evidence” . . . . . . . . . . . . . . . . . . . . . . . . . . . . . . . . . . . . . . . 478.6 Imbs, Mumtaz, Ravn and Rey (2005): “PPP Strikes Back: Aggregation and the
Real Exchange Rate” . . . . . . . . . . . . . . . . . . . . . . . . . . . . . . . . . . . . 50
9 LCP vs PCP 519.1 Atkeson and Burstein (2008): “Pricing-to-Market, Trade Costs, and International
Relative Prices” . . . . . . . . . . . . . . . . . . . . . . . . . . . . . . . . . . . . . . . 519.2 Gopinath and Itskhoki (2010): “Frequency of Price Adjustment and Pass-Through” 549.3 Gopinath, Itskhoki and Rigobon (2010): “Currency Choice and Exchange Rate Pass-
Through” . . . . . . . . . . . . . . . . . . . . . . . . . . . . . . . . . . . . . . . . . . 579.4 Gopinath and Rigobon (2008): “Sticky Borders” . . . . . . . . . . . . . . . . . . . . 60
2

10 Open Economy Models with Nominal Rigidity 6210.1 Chari, Kehoe and McGrattan (2002): “Can Sticky Price Models Generate Volatile
and Persistent Real Exchange Rates?” . . . . . . . . . . . . . . . . . . . . . . . . . . 6210.2 Devereux and Engel (2003): “Monetary Policy in the Open Economy Revisited:
Price Setting and Exchange-Rate Flexibility” . . . . . . . . . . . . . . . . . . . . . . 6510.3 Engel (2011): “Currency Misalignments and Optimal Monetary Policy: A Reexam-
ination” . . . . . . . . . . . . . . . . . . . . . . . . . . . . . . . . . . . . . . . . . . . 6810.4 Farhi, Gopinath and Itskhoki (2011): “Fiscal Devaluations” . . . . . . . . . . . . . . 7010.5 Galı and Monacelli (2005): “Monetary Policy and Exchange Rate Volatility in a
Small Open Economy” . . . . . . . . . . . . . . . . . . . . . . . . . . . . . . . . . . . 75
11 Currency Unions 7811.1 Chari and Kehoe (2007): “On the need for fiscal constraints in a monetary union” . 7811.2 Galı and Monacelli (2008): “Optimal monetary and fiscal policy in a currency union” 8011.3 Mundell (1961): “A Theory of Optimum Currency Areas” . . . . . . . . . . . . . . . 8311.4 Santos Silva and Tenreyro (2010): “Currency Unions in Prospect and Retrospect” . 84
12 Exchange Rate Disconnect 8612.1 Bachetta and van Wincoop (2006): “Can Information Heterogeneity Explain the
Exchange Rate Determination Puzzle?” . . . . . . . . . . . . . . . . . . . . . . . . . 8612.2 Engel, Mark and West (2008): “Exchange Rate Models Are Not as Bad as You Think” 8812.3 Engel and West (2005): “Exchange Rates and Fundamentals” . . . . . . . . . . . . . 9012.4 Rogoff (2008): “Comment on ‘Exchange Rate Models Are Not as Bad as You Think’” 93
13 Forward Premium, Time-Varying Risk 9313.1 Alvarez, Atkeson and Kehoe (2009): “Time-Varying Risk, Interest Rates, and Ex-
change Rates in General Equilibrium . . . . . . . . . . . . . . . . . . . . . . . . . . . 9313.2 Bachetta and van Wincoop (2010): “Infrequent Portfolio Decisions: A Solution to
the Forward Discount Puzzle” . . . . . . . . . . . . . . . . . . . . . . . . . . . . . . . 9513.3 Brunnermeier, Nagel and Pedersen (2009): “Carry Trades and Currency Crashes” . 9513.4 Burnside (2009): “Comment on ‘Carry Trades and Currency Crashes’” . . . . . . . . 9613.5 Burnside (2011): “Carry Trades and Risk” . . . . . . . . . . . . . . . . . . . . . . . . 9713.6 Engel (2011): “The Real Exchange Rate, Real Interest Rates, and the Risk Premium” 9713.7 Farhi, Fraiberger, Gabaix, Ranciere and Verdelhan (2009): “Crash Risk in Currency
Markets” . . . . . . . . . . . . . . . . . . . . . . . . . . . . . . . . . . . . . . . . . . 9913.8 Lustig and Verdelhan (2007): “The Cross Section of Foreign Currency Risk Premia
and Consumption Growth Risk” . . . . . . . . . . . . . . . . . . . . . . . . . . . . . 99
A Appendix: Abbreviations 101
3
1 Real Business Cycles in Open Economies
1.1 Aguiar and Gopinath (2007): “Emerging Market Business Cycles”
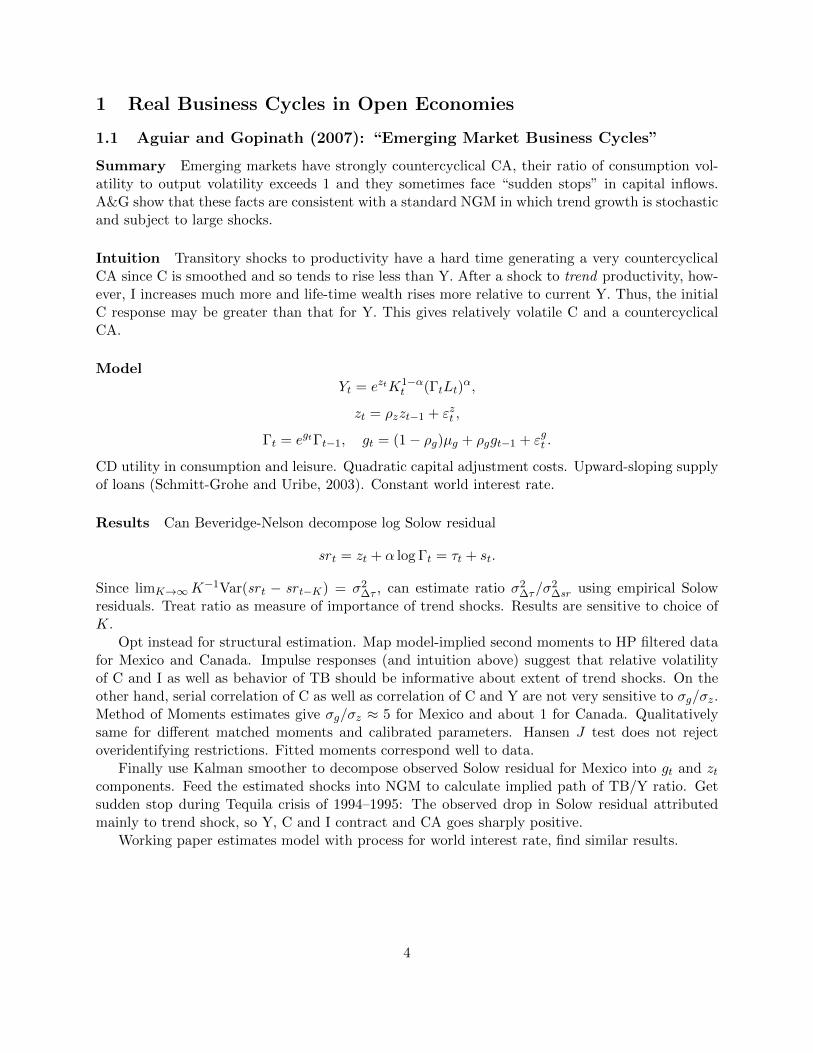
Summary Emerging markets have strongly countercyclical CA, their ratio of consumption vol-atility to output volatility exceeds 1 and they sometimes face “sudden stops” in capital inflows.A&G show that these facts are consistent with a standard NGM in which trend growth is stochasticand subject to large shocks.
Intuition Transitory shocks to productivity have a hard time generating a very countercyclicalCA since C is smoothed and so tends to rise less than Y. After a shock to trend productivity, how-ever, I increases much more and life-time wealth rises more relative to current Y. Thus, the initialC response may be greater than that for Y. This gives relatively volatile C and a countercyclicalCA.
ModelYt = eztK1−α
t (ΓtLt)α,
zt = ρzzt−1 + εzt ,
Γt = egtΓt−1, gt = (1− ρg)µg + ρggt−1 + εgt .
CD utility in consumption and leisure. Quadratic capital adjustment costs. Upward-sloping supplyof loans (Schmitt-Grohe and Uribe, 2003). Constant world interest rate.
Results Can Beveridge-Nelson decompose log Solow residual
sr t = zt + α log Γt = τt + st.
Since limK→∞K−1Var(sr t − sr t−K) = σ2
∆τ , can estimate ratio σ2∆τ/σ
2∆sr using empirical Solow
residuals. Treat ratio as measure of importance of trend shocks. Results are sensitive to choice ofK.
Opt instead for structural estimation. Map model-implied second moments to HP filtered datafor Mexico and Canada. Impulse responses (and intuition above) suggest that relative volatilityof C and I as well as behavior of TB should be informative about extent of trend shocks. On theother hand, serial correlation of C as well as correlation of C and Y are not very sensitive to σg/σz.Method of Moments estimates give σg/σz ≈ 5 for Mexico and about 1 for Canada. Qualitativelysame for different matched moments and calibrated parameters. Hansen J test does not rejectoveridentifying restrictions. Fitted moments correspond well to data.
Finally use Kalman smoother to decompose observed Solow residual for Mexico into gt and ztcomponents. Feed the estimated shocks into NGM to calculate implied path of TB/Y ratio. Getsudden stop during Tequila crisis of 1994–1995: The observed drop in Solow residual attributedmainly to trend shock, so Y, C and I contract and CA goes sharply positive.
Working paper estimates model with process for world interest rate, find similar results.
4

1.2 Backus, Kehoe and Kydland (1992): “International Real Business Cycles”
Summary One of the original attempts to fit an OE RBC model. Two countries. Completemarkets. Allow correlation of technology shocks and spill-over. Get comovement puzzle: Cross-country correlations of Y and I strongly positive in data but shouldn’t be in theory. C morecorrelated in theory than in data. I and TB way too volatile in theory relative to data.
Intuition Complete markets provide risk sharing so consumption should be highly correlatedacross countries (MUs are equated but different responses of labor make the C-correlation lessthan 1). Output and investment should be allocated to the most productive country. Theory thuspredicts that the Y-correlation lies between 0 and the C-correlation. But this isn’t the case fordeveloped countries.
Model Two countries, one good, complete markets. Utility U(c, l) = [cµ(1 − l)1−µ]γ/γ.1 CDproduction function F (k, l) = λkθl1−θ.2 Capital accumulation kit+1 = (1 − δ)kit + it.
3 Technology
process λt = (λht , λft )′ follows VAR
λt+1 = Aλt + εt+1.
May be contemporaneous correlation of shocks. Off-diagonal elements of A: spillover effect. Dueto market completeness, can solve planner’s problem
ψE∞∑t=0
βtU(cht , lht ) + (1− ψ)E
∞∑t=0
βtU(cft , lft )
subject to previous constraints as well as aggregate resource constraint∑i
(cit + it) =∑i
F (kit, lit).
Let ψ = 1/2. Planner equates MU. If γ = 0 (log utility), C is equalized across countries. Otherwise,labor effort dilutes cross-correlation of C a bit.
Results Most parameters calibrated as in Kydland and Prescott (1982). Estimate bivariatetechnology VAR using empirical Solow residuals from U.S. and EU. Impose symmetry for simplicity.Spillover coefficient 0.088, correlation of innovations 0.258. Linearize model and compare simulatedmoments to HP filtered data. Get relative volatility of C slightly less than in data, way too volatileI and TB. TB acyclical in model (countercyclical in data). S and I are weakly positively correlatedin model (inconclusive in data). Cross-country correlation for C much larger than for Y, in contrastto data. Impulse responses show that this is due to efficient resource reallocation and risk sharing.
Try out different modeling choices. Correlation of S and I sensitive to choice of A. Raising riskaversion (lowering γ) dampens volatility slightly and lowers cross-country correlation of C, but notby much. Time-to-build influences volatility of investment a lot.
Try adding trading frictions, e.g., transport costs, in the form of a quadratic cost of net exports inresource constraint. Reduces variability of TB a lot but slightly increases cross-country correlation
1More generally, they allow disutility of labor to depend on lags of leisure.2More generally, allow for inventories.3More generally, allow for time-to-build of more than 1 period.
5

of C. Large effect of small transport costs seems to be due to small welfare gain of internationaltrade.
Try getting rid of all trade and risk-sharing, so that only difference from complete autarky iscorrelation of technology shocks. Gives results remarkably close to model with trading frictions:Due to spillovers, after positive shock to Home, Foreign consumer knows he will be richer in futureand so consumes now and invests later.
Kehoe and Perri (2002): If bonds are only financial instrument, still get comovement puzzle.Bond Euler equation is
Uc(cit, 1− lit)pt = βEt[Uc(c
it+1, 1− lit+1)],
where pt is time-t price of ZCB that pays off at t+ 1. Yields
Uc(cht , 1− lht )
Et[Uc(cht+1, 1− lht+1)]=
Uc(cft , 1− l
ft )
Et[Uc(cft+1, 1− l
ft+1)]
,
so tight link between MU is broken compared to complete markets. But quantitatively impact isvery small. Due to shocks being purely transitory, the reduced insurance of bonds doesn’t hinderrisk sharing much.
2 International Risk Sharing and Co-Movements
2.1 Coeurdacier and Rey (2011): “Home bias in open economy macroeco-nomics”
Summary Literature review of explanations for home bias in international portfolio holdings.Develop approximation to optimal steady state portfolio in a model with equities, non-tradablelabor income risk and RER (purchasing power of income) risk. Expand model to include investmentand trade in bonds.
Model Two countries, two goods. CRRA utility (coefficient σ), separable in consumption andleisure. Consumption preferences are biased in favor of home good. Show that markets are “locallycomplete:” For a certain choice of zero-order portfolio, the Backus-Smith condition can be madeto hold up to first order. The zero-order portfolio satisfies
S =1
2−A(1− α)
Cov(wtlt, dt)
Var(dt)+B
(1− 1
σ
)Cov(RERt, dt)
Var(dt),
where hats denote Home variables relative to Foreign. The above is a partial equilibrium rela-tion: to achieve local completeness of markets in the basic model’s general equilibrium, the twocovariances must be restricted. The first term above is the baseline Lucas (1982) diversificationterm. The second term represents hedging of nontradable labor income. The third term representsRER hedging: If σ > 1, households want to insure against RER appreciation that causes fall inpurchasing power (due to home bias in preferences); if σ < 1, would rather have equity payoutwhen consumption bundle is relatively cheap so as to buy more stuff. For log investor (Heathcoteand Perri, 2009), RER hedging term drops out.
In general equilibrium, the RER hedging term is proportional to (1 − 1/σ)/(λ − 1), where λis approximately equal to the elasticity of substitution between Home and Foreign goods. For
6

λ = 1, increases in Y are perfectly offset by ToT, so equities are perfect substitutes and portfoliois indeterminate (Cole and Obstfeld, 1991). For λ > 1, price responses are small, so dt increaseswith yt. For λ < 1, price responses are large (e.g., a bad Home productivity shock causes alarge appreciation of the ToT, thus increasing Home’s relative equity returns and leading to anappreciation of the RER), so local dividends provide a hedge against RER risk.
The authors extend the model to allow for trade in two bonds that pay off each country’sconsumption bundle. Also add (home biased) investment. Add shocks to disutility of labor so as tomake the portfolio position determinate. Get equity share expression similar to the above, but nowall second moments are conditional on bond returns. Intuitively, nominal bonds provide a perfecthedge (in this model) against RER movements, so they are used to hedge RER risk in equilibrium.That only leaves the conditional labor income risk, which unambiguously generates home bias(keeping relative prices fixed, a shock that raises I also raises domestic labor compensation due tohome bias in I, while lowering dividend payout). In the data, the unconditional moments fail togenerate home bias according to the formula above but the conditional moments do go the rightway. Hence, the presence of bonds partially resolves the puzzle.
The authors show empirically that the time series and cross-country characteristics for homebias in bonds and bank loans are similar to those for equities.
Other papers discussed Van Wincoop and Warnock (2008) find that the empirical correlationbetween excees equity returns and the RER is low, and most of the movements in RER are drivenby the NER, which can be hedged in forward markets.
Baxter and Jermann (1997) found that labor and capital returns are highly correlated but thishas been challenged by other papers.
Sections 5 and 6 review literature on trade costs and informational frictions.
2.2 Corsetti, Dedola and Leduc (2008): “International Risk Sharing and theTransmission of Productivity Shocks”
Summary The Backus-Smith condition under complete markets implies that C in Home shouldbe high when it is relatively cheap, i.e., relative C should increase when the RER depreciates.The correlation goes the other way in the data. In bonds-only economies, the Backus-Smith resultholds in ex ante expectation, but under two different scenarios (both with strong wealth effects ofshocks) the ex post correlation could have the other sign: (1) if the price elasticity of tradablesis low, or (2) if shocks are very persistent, the output response is hump-shaped and the priceelasticity of tradables is high. In both cases, relative price movements are in fact counterproductivefor cross-country insurance.
Model First illustrate intuition in endowment economy. Two countries, two goods. Home biasin the C CES aggregator with elasticity of substitution ω.
• Under complete markets, an exogenous rise in domestic output unambiguously causes theToT to depreciate to facilitate risk sharing.
• Under financial autarky (and more generally it turns out), the response of Home’s consump-tion of the Home good to a ToT appreciation depends on the relative magnitudes of thesubstitution effect (higher relative price) and income effect (higher wealth = value of endow-ment). The substitution effect dominates iff. ω > 1. Income and substitution effects go
7

the same way for Foreign’s consumption of the Home good. Assume now that ω is low. Allthe above implies that when Home’s Y is shocked upwards, the ToT must appreciate, since adepreciation would cause too large of a negative income effect for Home to make total demandfor Home’s good match the higher supply.
• With international trade in bonds, and when ω is high, a positive shock to Home’s Y en-dowment is met with a muted long-run depreciation in the ToT, since prices don’t need toadjust much to clear markets. The wealth effect for Home is thus substantial, generating ashort-run C boom. Due to home bias, if the output profile is hump-shaped (as it will be ina bond economy with investment), there is excess demand for Home’s tradable good in theshort-run, causing the ToT to appreciate on impact.
After laying out the basic intuition, the authors calibrate a full-fledged model with production.The two countries each produce a tradable and a non-tradable good. To get deviations from PPP,assume that distribution of tradable good requires η units of non-tradable good. This gives wedgebetween producer and consumer prices, and so LOP holds at wholesale but not consumer level. Aninternational bond is traded, and there’s I with partial depreciation. Tradable and non-tradabletechnology shocks for both countries follow VAR.
Results Calibration is fairly standard, but focus is on the elasticity ω. Have two calibra-tion/estimation strategies. First is to use moment matching between model and data; gives ωbelow 1/2. Second is to draw on empirical trade literature, where ω ≈ 4.
When ω is set to the low estimate, the Backus-Smith correlation produced by the model isindeed negative, although not as much as in the data. Technology spillovers and the bonds-onlynegative transmission mechanism (whereby Foreign’s wealth effect is negative and so raises laborabroad) generate positive co-movement in Y, I and N.
When ω is high, it is found that highly persistent TFP shocks are necessary to resolve theBackus-Smith puzzle. In this case, the model has a moderately negative correlation. Output ishump-shaped due to endogenous capital accumulation. Due to high ω, international prices aremuch less volatile than in the data.
2.3 Heathcote and Perri (2009): “The international diversification puzzle is notas bad as you think”
Summary Extend Backus, Kehoe and Kydland (1992) to a model in which the only assets tradedare equities in Home and Foreign firms. Make assumptions so that asset markets are endogenouslycomplete, but an incentive emerges for investors to hedge their non-tradable labor income risk.Investment breaks the tight link between labor income and equity dividends so that domesticequity is a good hedge, leading to portfolio home bias. Derive closed-form expression for optimalportfolios.
Model Two countries, two non-traded final goods produced with two traded intermediate goods(domestic and foreign). Log utility, separable in leisure. The final good aggregator is CD, meaningunitary elasticity of substitution between Home and Foreign intermediate goods. CD productionfunction implies constant labor share. Households invest in domestic and/or foreign equity, receivedividends each period equal to value of production minus labor compensation and investment. Final
8

good preferences are home biased, and I is carried out with domestic final good, making I homebiased as well.
Theoretical results Proposition 1 shows that full risk-sharing obtains in equilibrium, and thisis achieved with constant portfolio shares. Intuitively, if full risk-sharing across time and statesis possible with some portfolio, then there’s no incentive to actively retrade. Full risk-sharing ispossible, since one can derive two linear relationships between relative Y, I and C: one from thebudget constraint, and one from market clearing and the constant expenditure shares on Home andForeign intermediate goods implied by CD. For a unique choice of the portfolio share, it is thenpossible to satisfy these two linear equations together with the Backus-Smith condition (the latteris also linear due to log utility).
The optimal portfolio share depends on the covariance of (relative) labor income with equitydividends. A persistent positive productivity shock to Home raises Home’s relative labor income.(In principle, the rise in I could crowd out labor income if the investment good were very expensive,but due to unitary EoS, the RER depreciates moderately and the crowding out doesn’t happen.) Ithas three effects on Home’s relative dividend: Y is increased (positive), ToT depreciate (negative)and I increases (negative). Under the maintained assumptions, the two latter effects dominate.Hence, Home’s equity is a good hedge for non-tradable labor income risk.
Comparative statics: As the trade share increases, portfolio home bias decreases, since theinvestment good is comprised of a more equal mix of the two intermediate goods, leading to largerToT depreciation following a positive TFP shock (need larger price adjustment to clear market fordomestic goods), i.e., larger offsetting price effects, less variable relative labor income and thus lessdemand for a hedge. As labor’s share increases, portfolio home bias increases, since non-tradedincome risk is greater so the demand for a hedge rises.
Cole and Obstfeld (1991) have similar model but with full depreciation and transitory produc-tivity shocks. These assumptions make I a constant proportion of Y. In Heathcote and Perri’smodel, however, persistent productivity shocks generate surges in I, breaking the link betweenHome and Foreign dividends, so that the optimal portfolio isn’t indeterminate.
Baxter and Jermann (1997) develop a model with a single consumption good and production.Due to CD production function and no investment, labor and dividend income in a country areperfectly correlated, so investors should aggressively short domestic equity, leading to stark negativehome bias. Heathcote and Perri argue that the single-good and no-investment assumptions arecrucial here.
Using numerical methods, the authors carry out a sensitivity analysis. They relax the assump-tions of logarithmic utility and CD consumption aggregator. Home bias still obtains for a widerange of parameterizations. However, if the elasticity of substitution is very high, Home equityreturns exceed Foreign following a positive Home TFP shock, which kills home bias.
Empirical results Using a cross section of OECD data, the authors show that diversificationincreases in trade openness, as predicted. Country size and GDP per capita do not offer additionalpredictive power. The “general equilibrium channel” that connects trade openness to the covarianceof earnings and dividends holds in the data. So does the “partial equilibrium channel” that connectssaid covariance to diversification (although the relationship is not as steep as predicted). Changesin trade share over time predict changes in diversification.
9

2.4 Kehoe and Perri (2002): “International business cycles with endogenousincomplete markets”
Summary To get cross-country correlations of consumption to be lower than those for output aswell as positive co-movement of employment and investment, need more than just assume bond-only credit markets. Can get the right kind of co-movement by assuming that contracts must beenforceable by the threat of exclusion from future trade. Such contracts severely limit risk sharing.
Model Two countries, one good, production only uses domestic labor, country-specific technologyshocks. For the economy with enforcement constraints, require that the social planner’s solutionat every point in time gives both countries a larger continuation utility than the value of financialautarky.
The enforcement constraint involves future consumption and employment and so the problemseems to not be stationary. However, the authors show that the Lagrangian for the social planner’sproblem with enforcement constraints can be written in a form where essentially the discount factoris a function of past Lagrange multipliers. It is then shown that the problem is stationary when thestate space is augmented by the relative value (for the two countries) of the generalized discountfactor.
Also consider a complete markets economy and a bonds-only economy.
Results Choosing CD utility and production and standard parameter values, they solve thevarious models using a clever value function iteration algorithm. The complete markets and bondeconomies give similar results for co-movement, a la Backus, Kehoe and Kydland (1992). Theenforcement economy, however, gets about the same cross-country correlation for C and Y, while Iand N have positive cross-correlation like in the data. TB remains procyclical, unlike in the data.The volatility of TB and I is also drastically reduced even without resorting to adjustment costs.
Intuitively, a positive TFP shock to Home raises its value of autarky, so planner must restrict in-vestment flows to satisfy enforcement constraint. In fact, capital is built up in Foreign to discourageHome from reverting to autarky (leads to procyclical TB). The planner must promise persistentlyhigh C for Home relative to Foreign, at least until the TFP shock decays.
3 Global Imbalances
3.1 Caballero, Farhi and Gourinchas (2008): “An Equilibrium Model of ‘GlobalImbalances’ and Low Interest Rates”
Summary The recent couple of decades have seen the U.S.’s current account deficit explode,the real interest rate decline and the foreign portfolio holdings of U.S. assets increase. This canbe explained by a negative shock to the pledgeability of assets in the rest of the world, since thisreduces asset supply, causing the interest rate to drop and the U.S. CA to turn negative, even inthe long run.
Model Time is continuous. Infinitesimal agents die and are born at rate θ. When they enter,they are endowed with (1−δ)Xt units of output (in total, not each). They consume all their savingswhen they die. The only savings vehicle is a tree with dividend rate δXt. Let Vt be its price. Then
10

its return is
rt =VtVt
+δXt
Vt.
By the assumptions, the total stock of savings Wt evolves according to
Wt = −θWt + (1− δ)Xt + rtWt.
In equilibrium, the supply and demand for savings are equal: Vt = Wt. Output is exogenous andgrows at rate g. The above conditions can be combined to yield
raut = g + δθ.
Note that δ can be interpreted as the fraction of output that is pledgeable, i.e., can be capitalizedin traded form today. Assuming a constant interest rate, we have
Vt = δ
∫ ∞t
e−r(s−t)Xsds = δPV t,
Wt = W0e(r−θ)t + (1− δ)
∫ t
0e(r−θ)(t−s)Xsds,
so the supply of assets is increasing in δ while the demand is decreasing (with more availableassets for capitalization, the non-financial part of output is reduced). If θ = 0, a Ricardian-typeequivalence holds: Any change in δ has offsetting effects on supply and demand for assets. If θ > 0,asset demand has a component that is determined by entering and exiting agents. Consequently, δaffects the total resources perceived by agents (as in Blanchard’s OLG model). Higher g increasesexpected capital gains and thus the return. Given a non-Ricardian model θ > 0, the higher δ, thehigher is savings supply relative to demand, so the asset price is lower and the return is higher.
DefineTB t = Xt − θWt, CAt = Wt − Vt.
Note that θWt is consumption at time t. Can get explicit formulas for Vt (Gordon growth model)and Wt for given world interest rate r, as t→∞. Gives long-run Metzler diagram.
The main intuitions from the model come in the two-country case where δi may differ. Assumert is the same across countries. Equations for each country are as above. The implied equilibriuminterest rate is
rt = g + (δU − xR(δU − δR))θ,
where xR is R’s share of world output. U denotes the U.S., R the rest of the world.Consider a symmetric initial position. Suppose that R’s pledgeability drops permanently. The
interest rate drops by the equation above. V U/V R then increases. If there is home bias in portfoliochoice, relative savings WU/WR will also increase. As R’s savings are below the steady statebalanced growth path, its savings increase at a rate faster than g, and many of these funds flow toU since capitalization in R has decreased. Hence, U runs a CA deficit and U ’s share in R’s portfolioincreases. The CA remains in deficit even asymptotically since R’s supply and demand curves haveshifted, cf. Metzler diagram (Figure 3). Intuitively, R’s saving need grows exogenously with output.It is also clear that the larger R is compared to U , the larger must the above-mentioned CA deficitbe. The authors formalize this intuition by allowing for different growth rates of output.
11

The authors note that part of their story could also have been told using an decline in θR, i.e.,exogenous increase in savings (the “global savings glut” story). The only substantial difference isthat R’s asset price would rise rather than fall on impact, which is counterfactual for the 1990s.
The model is extended in three directions.
• Suppose new agents have an option to plant a certain number of trees at an investment cost.If δR drops, cost of investment may outweigh the gain in R, leading to an investment slump.This shifts out the demand schedule in the Metzler diagram further, exacerbating U ’s CAdeficit and further lowering the interest rate.
• Suppose R residents can sell their trees to U residents at an exogenously given price (FDI) andthat U residents can capitalize the dividend from the purchased trees at the rate δU . Thenthere are gains from trade. U residents earn intermediation rents, which may be thought ofas nontraditional exports. The consequence is that after a negative shock to δR, the supplyof U -like assets increases which eventually offsets the shock. The intermediation rents financea permanent trade deficit.
• The authors finally extend the model to have multiple goods. Consumers have CES prefer-ences with home bias. After a drop in δR, U residents are richer than R residents, so due tohome bias the relative demand for U goods increases, causing an appreciation of U ’s RER.
3.2 Mendoza, Quadrini and Rıos-Rull (2009): “Financial Integration, FinancialDevelopment, and Global Imbalances”
Summary Countries differ in their financial development. Less financially developed countriesmay be more restricted by enforcement constraints that prevent them from diverting funds. Thisrestricts the menu of contingent assets available to them (in the limit only non-contingent tradeis possible) and thus risk sharing capabilities, depressing the interest rate due to precautionarysaving. When a less financially developed country integrates with a more developed one, theformer’s demand for riskless bonds causes the developed country to maintain a large negativeposition in riskless assets accompanied with a positive position in risky, productive assets (thesecan be more efficiently insured by the developed country).
Motivation There is a high degree of heterogeneity in financial markets development. The declinein the U.S.’s NFA position started as the financial globalization process got underway in the 1980sand saw the U.S. take positive net positions in risky assets (portfolio equity and FDI) accompaniedwith a very large negative position in riskless assets.
Model In the simple version, there are two countries i = 1, 2 each with measure 1 of agents.No aggregate uncertainty but agents face idiosyncratic endowment wt and investment zt shocks.Utility is concave with positive third derivative. Each country is endowed with one productive,non-tradable asset with price P it . Each agent in the country can use this asset to produce with aone-period lag. Individual production function is yt+1 = zt+1k
νt (DRS due to managerial input).
The individual state st = (wt, zt) evolves according to transition probabilities g(st, st+1). Agentscan trade contingent Arrow securities b(st+1) with price qit(st, st+1) = g(st, st+1)/(1+rt). Net worthis
a(st+1) = wt+1 + ktPit+1 + zt+1k
νt + b(st+1),
12

and the budget constraint is
at = ct + ktPit +
∑st+1
b(st+1)qit(st, st+1).
Number states n = 1, . . . , N , where 1 is the worst. Agents are subject to a limited liability constraint
a(sn) ≥ 0
and an enforcement constraint
a(sn)− a(s1) ≥ (1− φi)[(wn + znkνt )− (w1 + z1k
νt )],
where φi is the fraction of diverted income that is lost when lying about the state being n = 1.Key assumption: φi is determined by country of residence.
Consider a situation with only endowment shocks and autarky. A country with high φ, suchthat the enforcement constraints don’t bind, can perfectly insure idiosyncratic shocks. The returnRt+1(k, z) must also equal 1 + rt. Because this return is decreasing in k, all agents choose k = 1and output is constant over time. The interest rate must then satisfy (1+rt)β = 1 for consumptionnot to outgrow output. A country with φ = 0 can only trade in riskless bonds. Aggregate outputis still constant over time, but individual consumption can’t be insured fully. The Euler equation
U ′(c) = β(1 + rt)E[U ′(c(w′))]
implies β(1 + rt) < 1 for aggregate consumption not to grow.If there are only endowment shocks but financial markets integrate, prices are equalized. By
the same argument as above, all agents hold k = 1. Also, β(1 + rt) < 1 for aggregate consumptionnot to grow. The high-φ agents will then gradually reduce consumption over time until they hitthe limited liability constraint. For this to bind,
∑b(wt+1)q(wt, wt+1) < 0, so the NFA position of
the developed country is negative.With investment shocks only and financial integration, the productive asset earns a risk premium
in the less developed country, since
U ′(c) = βE[U ′(c(z′))Rt+1(k, z′)]
and the riskless bond Euler equation imply
ERt+1 − (1 + rt) = −Cov[Rt+1, U′(c(z′))]
EU ′(c(z′)).
Agents in the low-φ country thus sell some of their productive asset in equilibrium to the high-φ country. We again get β(1 + rt) < 1. High-φ agents again decrease consumption until thelimited liability constraint binds and the NFA position in bonds is negative. The average returnon the developed country’s asset (the productive one) is higher than 1 + rt due to concavity ofthe production function (only expected marginal returns are equalized), and 1 + rt is the expectedreturn on the liabilities.
13

Quantitative results The authors extend the model to allow for cross-country investment, i.e.,agents can distribute their managerial capital across different countries’ productive assets (in theprevious simple model, all managerial capital went into the domestic production technology). Therelative economic size of countries is also allowed to vary. Financial integration is introduced insimulations as an unexpected event.
In a two-country scenario calibrated to the U.S. (φ = 0.35) and rest of the world (φ = 0),the U.S. very gradually builds up a positive net position in productive assets and a large negativeposition in bonds. The interest rate is lower than in U.S. autarky.
There are three possible welfare effects of integration: diversification of investment risk, riskspecialization and changes in asset prices. Since the poorer residents in the rest of the world arehurt substantially by a higher interest rate, not all agents are made better off by the integrationprocess.
The authors show that the model’s assumption that φ is residence based can be relaxed some-what without changing the results much.
Finally, they consider a three-country scenario where countries also differ in the lower boundai on assets in the limited liability constraint. If countries differ in their credit capacity ai, thecountry with the lower ai will tend to generate a negative NFA position. However, differences in acan’t explain differences in portfolio composition of risky assets and bonds. A simulation is carriedout with the U.S. (high φ, low a), other developed countries (high φ, high a) and emerging markets(low φ, high a). The steady state has other developed countries maintaining a positive position inproductive assets but a significantly smaller absolute NFA position than the U.S., like in the data.
4 Valuation Effects
4.1 Curcuru, Dvorak and Warnock (2008): “Cross-Border Return Differen-tials”
Summary The “exhorbitant privilege” of the U.S., i.e., the supposedly large returns differentialon its assets and liabilities, has been mismeasured by most researchers. The oft-quoted BEA datais internally inconsistent as positions are revised frequently but flows are only partially revised.Better data sources indicate that the returns differential is 1%, almost all of which stems from FDIrather than financial investment.
Motivation Gourinchas and Rey (2007, chapter in “G7 Current Account Imbalances,” henceforthGR) found a returns differential of more than 3% per year for the U.S., mostly due to a largedifferential for equities as the U.S.’s net portfolio is skewed towards these.
Theory The return can be constructed as
rt =At −At−1 − FLOW t
At−1+
INC t
At−1.
The first term represents capital gains, the second interest and dividend income. The BEA heavilyrevises positions At when new survey evidence infrequently comes in, but flows are only partiallyrevised as firms find it hard to restate past flows.
14

Results Using an international portfolio data set from Bertaut and Tryon (2007), find essentiallyzero returns differential within each of equity and bond categories. This is consistent with theobservation that U.S. asset returns (primarily equities) in GR are much higher than world stockindex returns, while the liability returns (primarily bonds) are much lower than correspondingindex returns.
The original BEA data give vastly different results than the revised data; average returnsdifferential is only 1%. Almost all of this stems from FDI rather than bonds and equities. Theoriginal data is more in line with market index returns. The authors think the original data is betteras it is at least internally consistent due to capital gains being imputed with the same vintage data.
The cumulative CA deficit is much more negative than the movement in the net internationalinvestment position, suggesting that there should be a high capital gains differential. If this is notthe case, some account in the balance of payments must be mismeasured. The authors contendthat it may be the CA and cite a U.S. Census Bureau study (1998), which found that exports maybe understated by as much as 10%.
While the returns differential is small on average, it varies a lot over time, so the timing ofleverage and returns may combine to give large short-run valuation effects.
4.2 Gourinchas and Rey (2007): “International Financial Adjustment”
Summary The CA can adjust in two ways: the trade channel and the valuation channel. Derivelog-linear approximation to the external budget constraint around a deterministic trend. Use it toderive a relation between net external assets, TB and return differentials. Use Campbell-Shillermethod to quantify effects of the two channels; valuation channel contributes about 25% of shocksto net external assets. Conversely, net external assets predict returns at short horizons, TB at longhorizons and ER at all horizons.
Motivation U.S. has run persistently high CA and TB deficits since late 1980s. Almost allliabilities are denominated in dollars, and 70% of assets are denominated in other currencies. Returndifferentials may mediate part of the future CA adjustment, particularly through ER movements.
Theory Accumulation identity
NAt+1 = Rt+1(NAt + NX t),
where Rt+1 is a weighted average of gross returns on assets and liabilities. Along a balanced growthpath, ratios of X, M, assets and liabilities to wealth should be stationary, but strong upward trendin postwar data. Perhaps due to long-run structural change in financial markets. Assume insteadthat budget constraint holds for a fictitious deterministic economy with same growth rate for allfour quantities. By subtracting stochastic b.c. from deterministic one, get b.c. in deviation fromtrend. Log-linearize this to get
nxat+1 =1
ρnxat + rt+1 + ∆nx t+1,
where cyclical external imbalances nxa linearly combines stationary components of exports, im-ports, assets and liabilities, such that the 1st and 3rd contribute positively and the 2nd and 4thnegatively. Weights depend on trend relationships. Return differential r increases with return on
15

assets and decreases with return on liabilities. If long-run return exceeds trend growth, can shiftforward to get
nxat = −∞∑j=1
ρj(rt+j + ∆nx t+j).
Also holds in expectation; can decompose nxat = nxart + nxa∆nxt .
Empirics Use data on U.S. net and gross foreign asset positions, capital gains and total returnsbetween 1952 and 2004. Filter data with HP filter that filters out very long-run cycles. Argue thatif there is extra information in long-run movements, the exercise is biased against them findingstrong relationships. Construct cyclical external imbalances nxa with time-constant weights.
First exercise uses Campbell-Shiller VAR method to evaluate the above nxa decomposition.The two components are positively correlated: valuation and trade effects are mutually reinforcing.A variance decomposition (splitting the covariance term 50/50),
1 =Cov(nxart ,nxat)
Var(nxat)+
Cov(nxa∆nxt ,nxat)
Var(nxat),
attributes 27% to returns and 64% to TB (9% unaccounted for).The nxa relation also states that cyclical imbalances should predict returns and/or TB. There
is significant forecasting power (in sample) for returns at short horizons and for TB at medium andlong horizons. Returns are driven partially by ER movements. Find that ER can be predicted at allhorizons; argue that this is because ER plays a role in both short-run valuation channel and longer-run trade channel. For the U.S., the ER effect has the same sign on both channels: An appreciationof the dollar causes the return differential to decrease (since U.S. liabilities are denominated indollars and assets in foreign currency) and the TB to deteriorate through expenditure switching.
Also conduct out-of-sample ER forecasting exercise. Find that the cyclical imbalance modelsignificantly outperforms a random walk model in terms of MSE, overturning Meese and Rogoff(1983).
5 Financial Crises, International Recessions
5.1 Mendoza (2010): “Sudden Stops, Financial Crises, and Leverage”
Summary If an SOE is subject to a leverage constraint on its access to working capital financingand one-period loans, Sudden Stops arise (as in the data) when bad shocks hit after a prolongedexpansion that has led to high leverage. Due to precautionary saving, these Sudden Stops are suf-ficiently rare that the leverage constraint doesn’t much affect the long-run business cycle moments.The model has two credit channels: When the collateral constraint binds, the effective cost of bor-rowing rises. Furthermore, the resulting fire sale drives down the price of capital which amplifiesthe initial shock in a Fisherian way.
Motivation In the data, Sudden Stops (i.e., a sudden upward jump in the CA combined witha contraction of Y and C and a fall in asset prices) occur after expansions. They are relativelyinfrequent and asymmetric, in the sense that we do not observe sudden drops in the CA combinedwith booms in Y and C.
16

Model SOE model with a representative self-employed household. To get stationary NFA, prefer-ences are of the Stationary Cardinal Utility kind with endogenous discount factor. Period utility isquasilinear in C and L a la GHH to eliminate the wealth effect on labor supply. Production requiresan imported input νt sold at an exogenous, stochastic world price pt (drives a wedge between TFPand the measured Solow residual). There is an exogenous world interest rate Rt on non-contingentone-period bond loans. Working capital loans pay for a fraction φ of the cost of labor and importedinputs in advance of sales. The budget constraint is then
ct + it = eεAt F (kt, Lt, νt)− ptνt − φ(Rt − 1)(wtLt + ptνt)−R−1
t bt+1 + bt.
There are also adjustment costs to net investment. The economy is subject to the collateralconstraint
R−1t bt+1 − φRt(wtLt + ptνt) ≥ −κqtkt+1,
where qt = ∂it/∂kt+1 is the price of capital. Hence, total within-period debt (both working capitaland bond loans) can’t exceed a fraction of the marked-to-market value of capital.
The FOC for bonds isλt − µt = RtEt[λt+1],
where λt and µt are the nonnegative multipliers on the budget and collateral constraints. Rearrangeto obtain the external financing premium
Rht −Rt =µt
Et[λt+1], Rht :=
λtEt[λt+1]
.
Rht is the effective real interest rate (ratio of MUs). We see that the external financing premiumis positive when the collateral constraint binds. The collateral constraint also positively affectsthe equity premium (the expected excess total return on capital, including dividends and capitalgains), both directly when it binds and indirectly through its effect on the consumption smoothingand thus the covariance of MU and returns. Mendoza derives an iterated-forward expression forqt as a PDV of future dividends (MPK minus MC of investment). Because a potentially bindingcollateral constraint raises the equity premium, it increases discounting and thus lowers the assetprice.
There is also an external financing premium on working capital financing due to µt enteringinto FOCs for labor and the imported input.
Apart from the financing premium, there is a debt-deflation mechanism. When the collateralconstraint binds, agents demand less equity, which lowers qt due to upward-sloping supply of equity(because of adjustment costs). Since the value of capital has declined, the collateral constraint thenbinds even more, leading to further fire sales, etc.
Simulation The model is calibrated to Mexican data and simulated. The three shocks (TFP,interest rate and imported input price) follow a 23-point symmetric Markov process. The workingcapital share is φ = 0.26. Two different values of the leverage constraint parameter κ is attempted,along with a model without the constraint (κ =∞).
Long-run business cycles moments are largely unaffected by the constraint. The constrainedeconomy matches the data better in terms of relative volatility of C and Y, and countercyclicalityof R and TB. Due to precautionary saving, agents go less in debt on average.
17

Mendoza identifies simulated events that look like Sudden Stops. They happen after expansions,like in the data, when the leverage ratio has been driven up. It is found that the constraint greatlyamplifies the response of the key variables relative to an unconstrained economy in the same state.However, there is almost no amplification in non-Sudden-Stop states. Asset prices don’t declineenough in the model relative to the data. Since imported input price shocks contribute to SuddenStops, the decline in the measured Solow residual doesn’t stem entirely from TFP shocks, althoughthe latter are needed to get the right magnitudes.
It is found to be crucial to have working capital in the model, even though it doesn’t do muchdifference in non-Sudden-Stop states. The reason is that capital is predetermined, so the immediatedrop in Y and I after a bad shock must come from the financing premium’s contemporaneous effecton working capital financing.
5.2 Neumeyer and Perri (2005): “Business Cycles in Open Economics: TheRole of Interest Rates”
Summary In the data, real interest rates lead the business cycle in emerging SOEs. Y, H andC are more volatile than in developed SOEs, and TB is more countercyclical. These facts canbe matched by a standard NGM with a real interest rate that is determined by an internationalrate and a country-specific premium. Two important modifications are introduced to the model:Firms have a need for working capital, so labor demand responds to the interest rate, and consumerpreferences are GHH, so labor supply does not respond to the interest rate. The business cyclecharacteristics of the model match the data best if the country-specific interest rate premiumdepends endogenously on its business cycle, as this creates extra amplification.
Model The model is standard NGM with GHH preferences. Firms have to pay a share θ of thewage bill in advance, so they must borrow θwtlt goods at the start of the period at real rate Rt−1.At the end of each period, they can sell their output and pay off the rest of the wage bill plusthe rental rate of capital. Total NFA are thus given by the households’ NFA position bt minus thefirm’s debt θwtlt.
The interest rate is given by Rt = R∗tDt, where R∗ is the international rate and D the country-specific premium due to default risk (the government has a time-varying probability of expropriatingthe interest payments made by domestic firms to foreign lenders). Dt is modeled in one of tworeduced form ways: Either it is driven by exogenous factors (in the calibrations it is given byan AR(1) process) or it is a function of the endogenous business cycle (in the calibrations itis a negatively linear function of expected next-period productivity, as motivated by models ofendogenous default).
The combination of firms’ and households’ FOCs gives
1
1 + θ(Rt − 1)At+1Fl,t+1 = wt+1 = −
ul,t+1
uc,t+1.
Hence, working capital creates a labor wedge, since θ(Rt−1 − 1)wt is the net interest per hour onthe fraction of the wage bill that is paid with borrowed funds. Consider an upward shock to theinterest rate. The labor demand shifts inward after the initial period. For GHH preferences, laborsupply is independent of the interest rate (since it is independent of consumption), so equilibriumlabor (and thus Y) falls. C falls due to both the substitution effect and the substitutability of Cand leisure. Since a higher interest rate induces savings, TB is countercyclical.
18

For C-D preferences, on the other hand, labor supply shifts out with the initial drop in con-sumption (substitution effect), while labor demand doesn’t respond initially due to the interestpayments already being locked in. A boom in H and Y follows on impact. In future periods, labordemand shifts in, so equilibrium H and Y can go either way. Hence, for C-D preferences to fit thefacts, the IES has to be extremely small.
Simulations A calibration is performed to simulate the model, setting θ = 1. It is found thatmovement in Dt is necessary to generate countercyclical interest rates and TB. With exogenouscountry risk, these comovements can attain the right sign but not magnitude. With feedback fromthe business cycle into Dt, however, the main comovements match the data well, although H, Cand TB are too volatile (households are too willing to substitute). Shutting down movements in R∗
only marginally reduces Y volatility. Shutting down feedback from productivity shocks to countryrisk Dt reduces volatility of Y by 27%.
The qualitative conclusions hold even with θ = 0.5. The volatilities are very sensitive to theelasticity of labor supply.
5.3 Perri and Quadrini (2011): “International Recessions”
Summary Two-country model. Firms are subject to a no-default enforcement constraint. Upondefault, a firm’s assets can be sold to other firms (efficient) or turned into consumption goods(inefficient). Multiple self-fulfilling equilibria arise since the liquidation value of capital depends onfirms’ ability to buy up defaulting competitors, which depends on whether they are constrained,which again depends on the liquidation value of capital. Due to risk-sharing across countries,enforcement constraints bind simultaneously in the two countries. Hence, endogenous belief-drivencredit shocks lead to international comovement of real and financial variables.
Motivation During the 2007-2009 crisis, developed countries exhibited a striking degree of co-movement in real and financial variables. The contraction in Y was preceded by a contraction ofcredit. Leading up to the crisis, credit had expanded more rapidly than real variables.
Model Consider first a model without capital accumulation. Two countries, two types of agentsin each: investors, who own firms, and workers. Investors derive income only from firm dividends.Workers are more patient, so firms borrow from workers. Firms face a cashflow mismatch: wage,dividend and current debt payments (net of new issue) are made before the realization of revenue.To cover the mismatch, they contract an intra-period loan
lt = wtht + dt + (bt −R−1t bt+1) = F (ht),
where the last equality follows from the firm’s budget constraint. They can default, leading to anenforcement constraint
ξtk ≥ lt +bt+1
Rt.
Here ξt is the liquidation value of capital. The RHS are the total liabilities of the firm. Thepartial equilibrium implication is that when the constraint tightens, firms must cut back on divi-dends. However, since their owners have concave utility, they only cut back moderately and insteadeffectuate the remaining adjustment by reducing labor demand, leading to a contraction.
19

There is perfect capital mobility, and since investors only derive utility from consumption, theychoose to perfectly diversify their portfolios. There is then a representative international investor,and firms discount profits with the same SDF mt. Let µt be Lagrange multiplier on the domesticfirm’s enforcement constraint. Then the FOC wrt. debt bt+1 is
Et[mt+1] =1− µtRt
.
Since m and R are equalized across countries, so must µ be. This implies international comovementof credit conditions. The labor wedge is then also equalized across countries.
To reduce the number of state variables, domestic workers are assumed to trade Arrow-Debreusecurities with foreign workers (firms or investors can’t participate). This leads to a constantconsumption ratio between workers in the two countries. Due to this along with the fact that thereis a representative international investor, the only state variable is worldwide debt. Also becauseof the constant consumption ratio and same labor demand in the two countries, the wage ratio isequalized, so real variables comove perfectly in the model without capital accumulation.
If shocks to ξt and ξ∗t (foreign liquidation value) were exogenous, debt flows between the twocountries would tend to counteract the real effects of the shocks (in order to smooth dividends).The authors now introduce an endogenous credit shock channel. Suppose a unit of capital caneither be turned into ξ units of consumption, or it can be sold to another firm and transformed into
ξ units of reinstalled capital, ξ < ξ < 1. Non-defaulting firms are only able to buy up defaultingfirms’ assets if they are unconstrained, which depends on the value of ξt. Multiple self-fulfillingequilibria arise. The authors argue that since µt is equalized across countries, so is ξt. Hence, themodel features endogenous international credit shocks.
They extend the model to allow for capital accumulation. To limit the number of state variables,they assume that the C-D production function depends on capital only through the total worldwidestock (positive externalities), and there are CRS in reproducible factors (AK). They can thennormalize all equations so that only worldwide debt and the domestic share of aggregate capitalare state variables.
Simulations They calibrate the model to match the U.S. as country 1 and the other G7 countriesas country 2. For the sunspot process, they assume that in states in which multiple equilibria arepossible, both countries expect ξt = ξ with some constant probability.
A credit expansion is simulated by imposing a long sequence of ξt = ξ draws and then switching
to ξt = ξ going forward (a credit contraction is simulated in the opposite way). Following a creditexpansion, the stock of debt increases. Y and H expand, but only gradually. The response to acredit contraction is much larger at impact. When experimenting with the length of the expansion,the authors find that a prolonged expansion leads to a more severe subsequent reversal.
The model generates large volatility of labor and stock market valuations. If the model issimulated with TFP shocks instead (calibrated using Solow residuals), the volatility is subdued.
Finally, the authors extend the model to try to explain the more severe response of labor in theU.S. relative to Europe. By adding variable labor utilization (to increase fluctuations in measuredlabor productivity) and adjustment costs in hours (to create differential cross-country effects fromrigidities). If the rigidity in hours is different across the two countries, the response of H is muchlarger in the less rigid country, with Y and I not differing much. Consequently, Y/H falls more inthe less rigid country.
20

6 Capital Controls
6.1 Bianchi (2011): “Overborrowing and Systemic Externalities in the BusinessCycle”
Summary Calibrates a standard two-good SOE model with a borrowing constraint. Compareswith the constrained efficient allocation by a social planner who internalizes the effect of borrowingon the value of pledgeable wealth (which depends on the relative price of nontradables). Thedecentralized economy has much more frequent financial crises, and conditional on a crisis, thedownturn is much worse than for the constrained planner, who does more precautionary saving. Theconstrained optimum can be implemented through state-contingent taxes or margin requirementsof moderate size.
Model SO endowment economy with a tradable and nontradable good. Measure 1 of consumers.The consumption aggregator is of CES type. The price of tradables is normalized to 1. Price ofnontradables is pN . Creditors restrict loans such that the value of debt does not exceed a fractionκT of tradable income plus a fraction κN of nontradable income,
bt+1 ≥ −(κNpNt yNt + κT yTt ).
If κN differs from κT , it can be seen as outside creditors having a higher preference for tradablecollateral (e.g., due to nontradable collateral being subject to domestic judicial practices).
The intertemporal FOC for consumption allocation gives
pNt ∝(cTtcNt
)η+1
. (1)
Hence, an equilibrium reduction of cTt due to a binding borrowing constraint generates a fall in theprice of nontradable consumption, which further leads to debt deflation.
The constrained efficient allocation is one in which the social planner performs the credit oper-ations for the economy (i.e., decides the stock of debt), rebates proceeds lump sum and lets privateagents allocate consumption. Due to identical preferences, the wealth distribution doesn’t matter,so the social planner effectively carries out the representative agent’s optimization problem subjectto the additional equation (1), i.e., the planner internalizes the pecuniary externality. The socialplanner’s FOC wrt. tradable consumption is then
λspt =∂ut∂cT
+ µspt Ψt,
where λspt is the multiplier on the budget constraint (shadow value of wealth) and µspt the multiplieron the borrowing constraint. If ∆t denotes the collateral value (RHS of the borrowing constraint),Ψt = (∂∆t/∂p
Nt )(∂pNt /c
Tt ). The second term in the FOC above is not present in the decentralized
economy, i.e., private agents undervalue wealth.The constrained optimum can be implemented in one of two ways.
• By charging a state-contingent tax τt on debt issues at time t, a wedge is introduced into theprivate Euler equation for bonds. The optimal tax is found by comparing FOCs. Appendix Bshows that in a richer model the tax can also be implemented indirectly by regulating reserveor capital requirements for banks that intermediate loans.
21

• The planner can also impose a margin requirement θt such that the credit constraint becomesbt+1 ≥ −(1− θt)(κNpNt yNt +κT yTt ). The socially optimal amount of borrowing bspt is attainedby choosing θt so that the constraint reduces to bt+1 ≥ bspt .
Simulations The model is calibrated to Argentinian data. The endowment process is an ap-proximate AR(1) process for tradable and nontradable output. The intratemporal elasticity ofsubstitution 1/(η+ 1) is set to the upper bound used in the literature, for conservativeness (small-est price movements). The baseline has κN = κT and calibrates the value to match the frequencyof Sudden Stops in cross-country data.
The borrowing policy functions are plotted in Figure 1 as a function of current debt. There arethree main regions: (1) the borrowing constraint binds, (2) the borrowing constraint doesn’t bindbut may possibly bind in the next period (warranting a positive tax in the second-best), and (3) theborrowing constraint can’t bind next period. In the first region, the decentralized policy coincideswith the constrained optimal one, as both are constrained. In the second region, the optimal policytakes on less debt due to precautionary saving. In the third region, the difference is small. Theeconomy spends about 80% of the time in the middle region. As a result, the decentralized economyhas a much larger left tail of bond holdings, although the average debt/GDP ratio is similar.
The average implied tax on debt in the constrained optimum is 5%. It goes to zero in the thirdregion mentioned above, where there is no need to constrain borrowing. Margins are tightened by9% on average.
A crisis is defined as an event in which the borrowing constraint binds and net capital outflowsexceed one standard deviation in the decentralized ergodic distribution. By calibration, the de-centralized crisis probability is 5.5%, while it is only 0.4% for the social planner. The magnitudeof crises is also much larger in the decentralized economy: C drops 60% more, the CA/Y ratioincreases (unlike for the social planner) and the RER depreciates way more. The decentralizedeconomy is more volatile, and unlike in the social planner economy, the CA is strongly counter-cyclical. However, the welfare gain from internalizing the pecuniary externality is tiny, measuredas the constant percentage increase in consumption necessary to compensate for the presence of theexternality. This is because the externality has no supply-side effects and risk is only aggregate.
The author also shows that an optimal simple time-invariant tax of 3.6% achieves 62% of thewelfare gains of the optimal state-contingent tax. However, a fixed margin constraint hurts welfaresince it further tightens the constraint in bad times.
6.2 Korinek (2011): “The New Economics of Prudential Capital Controls: AResearch Agenda”
Summary The paper outlines the main messages of recent research into the effects of prudentialcapital controls on the macroeconomy through regulation of pecuniary externalities. A simple two-period model is used to illustrate financial amplification and Pareto suboptimality arising from abalance sheet externality. The central result is that when the borrowing constraint binds, the socialvalue of liquidity exceeds the private value. From this insight one can derive that the unregulatedeconomy features overborrowing, excessive risk-taking and excessive use of short-term debt. Theauthor argues that these conclusions call for the use of prudential capital controls in practical policyconsiderations.
Intuition The debt-deflation feedback loop has three components.
22

1. Falling prices. The exchange rate may depreciate due to expenditure switching, reductionin money demand, interest rate reductions, lower tax revenues leading to greater need forseignorage, etc. Asset prices fall either if the constraint reduces the value of future payoffsrelative to today’s or if agents have to cut back on investment and adjustment is costly(q-theory).
2. Balance sheet effects. As prices fall, the value of collateral declines, reducing agents’ accessto credit.
3. Falling aggregate demand. When access to credit tightens, agents are forced to cut backconsumption.
The total effect is that capital flows become procyclical, i.e., credit tightens exactly when it isneeded the most.
Model SO endowment economy, two periods, two goods. In the second period, only the tradablegood exists. Utility
U = log c1 + cT,2, c1 = (cT,1)σ(cN,1)1−σ.
Endowments are normalized to yT,1 = σ, yN,1 = 1 − σ. World gross interest rate is 1. Therepresentative consumer inherits a tradable debt of d0, such that the first-period liquidity is m =yT,1−d0. The consumer chooses first-period debt d1 subject to budget constraints and the financialconstraint
d1 ≤ κ(yT,1 + pyN,1).
The intratemporal FOC gives
p =cT,1σ,
where p is the relative price of nontradables.If d0 ≤ κ, the equilibrium has d1 = d0, cT,1 = yT,1 = σ and p = 1. The derivative of the value
function with respect to liquidity is ∂V/∂m = 1.If, however, d0 > κ, the financial constraint binds. The level of borrowing is determined by
the constraint, and ∂V/∂m = σ/cT,1 > 1. Intuitively, higher liquid wealth relaxes the borrowingconstraint, leading to higher tradable consumption, which leads to higher p, which further relaxesthe borrowing constraint, etc.
The author discusses the nature of the pecuniary externality. With incomplete markets, sinceratios of marginal utilities are not equalized, a Pareto improvement can be effectuated by changingresources relative to the private optimum (at a second-order cost) and incurring first-order gains byredistributing to agents with higher marginal valuations. This is shown in the model by evaluatingthe derivative of aggregate welfare with respect to liquidity m. Since the social planner internalizesthe indirect effect of m on p, we get ∂V sp/∂m > ∂V/∂m when the constraint binds. “A healthybalance sheet is a public good.”
The above result is used to illustrate three pernicious effects of pecuniary externalities.
• Overborrowing. Suppose the representative consumer also makes a choice in period 0 of howmuch initial debt d0 to take on. Only tradable consumption is available in period 0, and the
23

endowment is 0 so all consumption comes through borrowing. The utility function is changedto U = log(cσT,0) + log c1 + cT,2. The FOC is
σ
d0=∂V (yT,1 − d0)
∂m,
where V is the starting-in-period-1 value function from above. Since V is concave, the aboveresult gives that when the first-period constraint binds, the social planner chooses a smaller d0
than in the decentralized outcome. The planner smooths aggregate consumption more since heinternalizes the full effect of liquidity on later borrowing capability. The second-best allocationcan be implemented by imposing a tax τ on debt inflows d0. This multiplies the LHS aboveby (1− τ). Alternatively, the optimal allocation can be implemented by requiring borrowersto hold an unremunerated reserve (the opportunity cost is then essentially a Pigouvian tax).
• Excessive risk-taking. Suppose there are two states of the world in period 1, and the consumercan trade state-contingent claims with a risk-averse foreign investor in period 0. Becausethe planner values liquidity more highly in a period-1 state in which the constraint binds, hepromises smaller repayments in such states. Hence, the second best features less amplificationthan in the decentralized outcome. In richer models, a pecking order of financing is introduced.Foreign-denominated debt is most risky due to adverse RER movements during bad times.CPI-indexed debt is less risky. Stock market indexed debt (e.g., FDI debt) is least risky sincerepayments are procyclical.
• Excessive short-term debt. Suppose everything is deterministic, but now there are two financ-ing vehicles available in period 0: a short-term and a long-term bond. The long-term bondcarries a premium but pays off in period 2 and does not need to be rolled over at time 1.Because the planner values liquidity in period 1 higher, he takes on more long-term relativeto short-term debt than the private outcome. This leads to a smoother consumption profile.
The author briefly discusses how heterogeneity of agents affect the results. If recipients of capitalinflows differ mostly in profitability, price controls are preferred to quantity controls since thisallows for more flexibility in resource allocation. If recipients of capital inflows differ mostly inriskiness, quantity controls are preferable.
7 Sovereign Debt, Debt Crises
7.1 Aguiar and Gopinath (2006): “Defaultable debt, interest rates and thecurrent account”
Summary In standard SOE models that allow the country to default on its non-contingent bonds,it is hard to generate realistic default rates. With deterministic trend growth, the threat of autarkyis minor, since on the one hand unit root Y shocks limit the usefulness of consumption smoothing,while on the other hand, i.i.d. Y shocks do not impact life-time wealth much. Consequently, thedefault decision depends mostly on current debt (not the state), making the supply curve of debtvery steep, which causes agents to not take on too much debt. If, however, the trend of Y growthis stochastic and subject to shocks, the current state influences the default decision to a greaterextent, flattening the supply curve and allowing agents to rationally take on more debt. Introducing
24

trend shocks also helps make both interest rates and CA countercyclical, since (1) the interest rateschedule as a function of debt is flatter and (2) the probability of default drops more markedly ingood times, causing a favorable shift in interest rates.
Motivation Unlike in developed SOEs, the interest rate and CA is countercyclical in emergingmarkets. We also observe a fairly high rate of default.
Model SO endowment, bonds-only economy. Representative agent has CRRA preferences. En-dowment is yt = eztΓt, where zt is an AR(1) process and Γt = gtΓt−1, with log gt following adifferent AR(1) process. NFA are denoted at. Upon default, at is set to 0 but the economy faces aproportional output loss of 1− δ and is forced into autarky. If in default, the economy is redeemedwith probability λ. V G(at, zt,Γt) is the value function if in non-default and V B(zt,Γt) is in default.The Bellman recursions are then
V B(zt,Γt) = u((1− δ)yt) + λβEtV (0, zt+1,Γt+1) + (1− λ)βEtVB(zt+1,Γt+1),
V G(at, zt,Γt) = maxct=yt+at−qtat+1
u(ct) + βEtV (at+1, zt+1,Γt+1),
V (at, zt,Γt) = max{V G(at, zt,Γt), VB(zt,Γt)}.
The economy internalizes the effect of at+1 on the bond price qt. International investors are riskneutral and require expected return r∗. Hence,
q(at+1, zt,Γt) =Et(1−Dt+1)
1 + r∗,
where the default function D(at, zt,Γt) is 1 if V Bt > V G
t and 0 otherwise.
Results Two calibrated models are analyzed. The calibrations are meant to match key momentsfor Argentina. In Model I, the trend is deterministic, so gt ≡ µg. In Model II, the trend Γtis stochastic and they set zt ≡ 1 for simplicity. The model is solved numerically by exploitinghomogeneity of the value, default and price functions, such that everything can be written in termsof detrended variables.4
For given z, it is clear that there exists a unique cut-off at for which V G equals V B, since theformer depends positively on at while the latter does not depend on at.
It is not so clear how the default decision depends on zt for given at. When λ = 0, V G should beat least as steep as V B at the indifference point. This is because the continuation value for an agentwith good credit standing is always higher than for one with bad standing (since for λ = 0, thegood agent can mimic the bad one), so if an agent is indifferent between defaulting or not, it mustbe that the current consumption absent default is less than that under default, implying highercurrent MU in the non-default case. Suppose then that the agent is offered an additional unit ofendowment. Under autarky this unit must be consumed. If a non-defaulting agent consumed theunit, her utility would increase more due to the higher MU, and in fact she can even choose to savesome of the extra endowment if it makes her better off. The conclusion follows. For λ > 0, theargument doesn’t apply, however.
4All the following expressions involve these detrended variables.
25

For Model I, the default region features a very steep slope along the at axis for the intuitivereasons mentioned earlier. The bond supply curve is therefore also very steep:
qt(at+1) =1− Pr(zt+1 < z(at+1)|zt)
1 + r∗.
Because the economy internalizes the steepness of the supply schedule, a higher desire to borrowdoesn’t result in more debt. The default rate is consequently very low. Due to minimal borrowing,NX are very stable. The calibrated income process is very persistent, yielding a countercyclicalCA. However, the interest rate is procyclical, counterfactually. The reason is the following. In goodtimes agents therefore want to borrow more, but due to the steepness of the bond supply schedule,interest rates will spike (however, the slope of the interest schedule turns out to be countercyclical,which allows the CA to also be countercyclical). There is also a second effect, namely that ingood times default becomes less likely, so the interest rate schedule shifts favorably. However, sinceshocks are transitory, the latter effect is small compared to the former.
The authors perform a Lucas (1985) calculation showing why it is difficult to sustain a realisticlevel of debt. They stack the cards against autarky by assuming that shocks are i.i.d., autarky lastsforever and that financial integration implies perfectly smooth consumption at the cost of interestpayments rB per period. The Y process is Yt = Y ezte−σ
2z/2, zt ∼ N (0, σ2
z). Then
V B = E∑t
βtY 1−γt
1− γ
and
V G =∑t
βt(Y − rB)1−γ
1− γ
can be calculated and compared. Without default penalty δ and for realistic σ2z and γ, maximum
sustainable debt payments as a percentage of Y are tiny. Imposing δ = 0.02 make debt paymentsof 20% of Y sustainable.
Model II generates much better results. The reason is that shocks to the growth rate implypermanent effects on Y, so access to capital markets is very beneficial in good times. BecauseV G−V B depends more elastically on the state than in Model I, the default region has a less sharpslope, leading to a less steep bond price function, more borrowing in equilibrium and more default.The CA and interest rate are both countercyclical. The latter is obtained since introducing trendshocks makes both the two previously mentioned effects of the state on the interest rate go in theright direction. NX and interest rates are more volatile than in Model I, although the latter is stillmore muted than in the data.
While Model II performs better, the default rate is still too low. A quick fix is provided byintroducing third-party bailouts, i.e., debt guarantees up to some limit a∗ in the form of transfersto the international creditors (from an unmodeled source). The price of debt is then
qt =min{1, a∗/at}+ Et(1−Dt+1) max{1− a∗/at, 0}
1 + r∗,
i.e., the probability of default only discounts the un-guaranteed fraction of the debt. Bailoutsessentially subsidize defaults, so it is possible to get the default rate into the right territory withstochastic trend shocks, although interest rate volatility remains subdued.
26

7.2 Broner, Martin and Ventura (2010): “Sovereign Risk and Secondary Mar-kets”
Summary The conventional wisdom is that in the absence of default penalties, sovereign riskeliminates the possibility for international trade. The authors show that this is not the case ifdebt is traded in secondary markets. If the Home country is in debt, the government wishes tonot enforce contracts. However, infinitesimal domestic agents privately have an incentive to buythe Home country debt back from foreign creditors at a price below or at face value, while foreigncreditors are willing to sell at any positive price if they fear non-enforcement. Because contractsare then sold back to Home agents, the Home government now wishes to enforce the contracts soas to not unequally redistribute wealth. All bonds end up in the hands of those that are capableof redeeming them. The authors show that this intuition holds in a wide class of models, as longas (1) there are no impediments to trade in secondary markets and (2) governments only decidewhether to enforce contracts and they can’t commit in advance to do so. If these assumptions arenot met, sovereign risk does influence foreign asset trade but in a surprisingly rich way.
Model The simplest model is called Debtor-Creditor World (D-C World). Two periods, Todayand Tomorrow. There are two countries, Debtor and Creditor, with infinitesimal agents. Theutility function is additively separable in Today and Tomorrow consumption with no discounting.All debtors (inhabitants of Debtor) receive endowment y − ε Today and y + ε Tomorrow. Allcreditors (inhabitants of Creditor) receive y + ε Today and y − ε tomorrow. Since endowmentsdiffer across regions, there are gains from trade.
The bond market that opens Today is called the primary market, while the one that opensTomorrow is the secondary market. There is a government in each country. If enforcement ofcontracts were full, bonds would trade at price 1 and resources would be distributed such thatevery agent consumed y in both periods.
Suppose instead governments strategically choose which bond payments to enforce after sec-ondary markets have opened, and they care about the average (Tomorrow) utility of their domesticagents. If there were no secondary market, the Debtor government would always choose not toenforce the repayments to the creditors, so in equilibrium there would be no trade. However, withsecondary markets operational, it is possible to achieve the same Pareto efficient outcome as in thefull-enforcement case, with the same prices: Suppose creditors sell their claims back to debtors atface value in the secondary market, but these claims are distributed unequally among the debtors.If secondary market contracts are enforced, all debtors (and creditors) consume y Tomorrow. Ifcontracts are not enforced, some debtors consume less than y (because they were holding moreclaims) and others more than y, which is strictly worse for the Debtor government due to Jensen’sinequality. Hence, it chooses to enforce the contracts and the equilibrium outcome is the sameas in the full-enforcement case, except that the necessary trading volume is higher (under fullenforcement, no secondary market trade is necessary to achieve the optimum).
Another way to think about the above is that secondary markets create a prisoner’s dilemmasituation among the debtors. They would collectively like to default on their aggregate debt soas to increase their total consumption, i.e., they would like to all agree on not buying back eachother’s debt from the creditors. This is not an equilibrium, however, because creditors would bewilling to sell claims at any positive price, so each debtor has an enormous private incentive to buyback claims than can be redeemed at face value.
In the above world, there also exists a pessimistic equilibrium, where the Debtor government
27

isn’t expected to enforce any contracts, so no bonds are issued Today or Tomorrow and the autarkyoutcome prevails. This equilibrium is eliminated if we assume that there is a tiny welfare cost tonot enforcing contracts.
It is possible to slightly alter the assumptions to obtain models in which the strategic enforce-ment outcome is a Pareto improvement upon the full-enforcement outcome. For example, in a worldwith more than one state of nature and if insurance markets are missing so only non-contingentbonds are available, introducing the possibility of selective default can help complete markets.
The authors show that the above conclusions also hold in a much richer model with manyregions, many periods, many shocks, market incompleteness and extensive heterogeneity. The ar-gument basically only needs two ingredients: (1) if the government is expected to enforce paymentswithin a group of agents, individual maximization leads to agents within this group buying backtheir own maturing assets, and (2) if each group buys back their own assets (so there are no out-standing claims left across groups), enforcement of contracts within each group is consistent withgovernment maximization, by Jensen’s inequality.
The above results did, however, rest on the assumptions that the secondary market is wellfunctioning, i.e., there are no trading frictions and individuals are infinitesimal, and the governmentonly chooses whether to enforce contracts or not, without having the option of committing inadvance.
• If transaction costs are introduced, the additional secondary-market trading necessary in thestrategic enforcement case entails that consumption smoothing is hindered more than underfull enforcement.
• If there is a single large debtor (or debtors can fully coordinate), financial trade completelycollapses. The debtor will internalize the prisoner’s dilemma and refuse to trade on thesecondary market Tomorrow so that default ensues. However, this breaks down trade. Ifthere are multiple debtors but one is large, consumption smoothing partially breaks down.Coordination among creditors doesn’t help them: they never receive payment directly fromdebtors and so can’t exploit their market power.
• Suppose governments can commit to enforcing or not enforcing certain contracts before thesecondary market opens. Suppose also the basic D-C World is extended to have two Tomorrowstates, with one group of debtors being lucky (in terms of endowment) in one state and unluckyin the other, and another being unlucky in the first and lucky in the second. Enforcementof Debtor contracts must be nondiscriminatory in equilibrium since creditors can always selltheir claim at face value to a debtor and de facto receive their payment. Hence, the Debtorgovernment can either enforce all payments or shut down all. Due to the ex post heterogeneitybetween debtors, there is then a tradeoff after primary market trade: committing not toenforce avoids payments to creditors, while committing to enforce improves the distributionof consumption among debtors.
• If governments have alternative policy instruments, they will use those to fight the reallocationof contracts on the secondary market. Suppose for example there are two types of goods andutility depends on an aggregator of those two goods. Suppose the Debtor government canimpose capital controls on transactions but can’t discriminate between different types oftransactions. Then there’s a tradeoff between thwarting payments to creditors, on the onehand, and facilitating trade in the two goods to exploit gains from trade, on the other hand.
28

7.3 Bulow and Rogoff (1989): “Sovereign Debt: Is to Forgive to Forget?”
Summary The threat of loss of reputation in international borrowing arrangements is not enoughto deter a country from defaulting on its debt. As long as it still has cash-in-advance contracts(i.e., a contract where the country pays a positive amount up front for a state-contingent, non-negative payment next period) available after defaulting, it is always possible, from some timeperiod on, to increase consumption in all subsequent periods by defaulting and initiating a sequenceof feasible cash-in-advance contracts. Hence, non-reputational costs of default are needed to justifythe existence of sovereign debt.
Model The borrower is a small country that can’t affect the world interest rate r (constant overtime). Foreign investors are risk neutral. The country production function is Yt = f(~θt, ~It−1), where~θt = (θt, θt−1, . . . ) is the history of exogenous shocks and ~It−1 = (It−1, It−2, . . . ) is the history ofinvestment decisions. Both these are fully observable by everyone.
A reputation contract (implicitly) specifies state-contingent payments Pt(~θt). The present valueof future repayments is
Dt(~θt) = Et
∞∑s=t
Ps(1 + r)s−t
.
It is assumed that if a country defaults, it still has access to cash-in-advance contracts that areindexed to the same variables as the reputation payments: The country pays At in period t, andin period t + 1 it receives the state-contingent payoff Gt+1(~θt+1). Foreign investors accept such acontract if they break even,
(1 + r)At = Et[Gt+1(~θt+1)],
and no further future payments are needed from the borrower,
Gt+1(~θt+1) ≥ 0 ∀~θt+1.
Under the assumption that the present value of the country’s output (net of investment) is finite,Theorem 1 shows that in any equilibrium, Dt ≤ 0 for all t. Hence, default must occur in at leastsome state. The proof goes as follows:
• Find a period s with relatively high Ds.
• Default on the debt and initiate a series of carefully specified, feasible cash-in-advance con-tracts.
• The resulting payments are uniformly smaller in every period t ≥ s. Equality only holds ifDt ≤ 0.
Hence, the proof is an arbitrage-type argument and does not rely on the form of the utility function.The authors then consider a model in which lenders can impose a random output penalty of
πt(~θt, ηt) < Yt − It on a defaulting borrower, where ηt is independent of θ. Define
Πt = Et
∞∑s=t
πs(1 + r)s−t
.
Theorem 2 shows that any equilibrium must have Dt − Πt ≤ 0, i.e., the debt obligations are fullysupported by non-reputational sanctions.
29

In the conclusion, the authors argue that, while the existence of private information invalidatestheir assumptions and thus their results, it should also limit the extent of reputation contractsavailable. Hence, research into non-reputational penalties is warranted.
7.4 Calvo (1988): “Servicing the Public Debt: The Role of Expectations”
Summary If public debt may be partially repudiated, e.g., by monetization, the temptationto repudiate is increasing in the burden of the debt, while the interest rate is increasing in thelikelihood of repudation. Hence, multiple equilibria naturally emerge: Either the interest rate andrepudiation are low, or the interest rate and repudation are high.
Model Two periods, two types of agents: competitive consumers and the government. In period0, government borrows b at gross interest rate Rb. Government can repudiate a fraction θ ∈ [0, 1]of the debt. Consumers have perfect foresight and break even, i.e., (1− θ)Rb = R, where R is thereturn on physical capital. The government’s taxation need x is
x = (1− θ)bRb + g + αθbRb,
where α ∈ [0, 1] is the proportional cost of repudiation (e.g., transaction costs). Governmentpurchases g are exogenous. The more the government taxes, the less debt it has to repudiate.
Individuals consume all their resources in period 1, giving consumption
c = y − z(x) + kR+ (1− θ)bRb − x,
with z(x) representing the deadweight loss from taxation. The government is benevolent, and so inperiod 1 it chooses x to maximize c subject to its budget constraint. Rb is taken as given in period1 (no commitment). Because θ ∈ [0, 1], this is equivalent to minimizing
z(x)− α
1− αx
subject tog + αbRb ≤ x ≤ g + bRb.
Let x∗ be the unconstrained optimum. The government’s reaction function (i.e., the optimal taxa-tion x as a function of Rb) is depicted in Figure 1. For low values of Rb, it is optimal not to repudiateθ = 0, so x = g + bRb. For high values of Rb, full repudiation is optimal and x = g + αbRb. Forintermediate values of Rb, partial repudiation and x = x∗ are optimal.
Substituting the perfect-foresight break-even condition into the government’s budget constraint,we get the consistency condition
x = g + (1− α)bR+ αbRb.
Equilibria are now determined as the intersections of the government’s reaction curve and the aboveconsistency condition in (Rb, x) space. See Figure 2.
There are three cases.
30

1. If x∗ > g + bR, there are two equilibria. One has no repudiation, Rb = R and x = g + bR.The other has partial repudiation, Rb > R and x = x∗. Substituting the perfect-foresightbreak-even condition into the expression for period-1 consumption, we get
c = y − z(x) + (k + b)R− x,
so the equilibria can be Pareto-ranked based on x. The first equilibrium is thus better thanthe second.
2. If x∗ < g + bR, no equilibrium exists. The intuition is clearest for α = 0: A benevolentgovernment would repudiate all debt, but this can’t be an equilibrium in which consumersbreak even.
3. If x∗ = g + bR, there is a unique equilibrium with Rb = R and no repudiation.
Comparative statics:
• The higher outstanding debt b is, the smaller is the interest rate in the bad equilibrium.
• The higher repudiation costs α are, the larger is the consumption cost in the bad equilibrium.
Calvo also develops an alternative model in which the government chooses the price level Pt (andthus inflation π). The share of debt that is not repudiated can then be thought of as 1−θ = P0/P1.Hence, θ = π/(1 + π). Inflation is assumed not to be costly for the government but costly toconsumers. Furthermore, the government collects an inflation tax. Even though θ is now onlyconstrained to lie in (−∞, 1], the previous conclusion goes through: Under the right conditions,multiple equilibria exist.
7.5 Cole and Kehoe (2000): “Self-Fulfilling Debt Crises”
Summary Analytical model in which fundamentals determine whether a crisis can occur, whilemarket expectations (sunspot shocks) then determine whether the crisis actually occurs. Causalityruns from expectations to interest rates. The government can’t commit ex ante to repay its debt,so investors’ beliefs about repayment matter for the government’s ability to service the debt. Inthe equilibrium class that the authors study, it is often optimal for the government to forego someconsumption smoothing and gradually run down its debt so as to exit the fundamental-determined“crisis zone.” Exiting the crisis zone causes interest rates to drop and private investment to boom.Extending the maturity of outstanding debt reduces the crisis zone, since smaller per-period debtpayments limit the incentive of the government to default.
Motivation During the Mexican crisis of 1994–1995, fear of default led to the inability of thegovernment to service its debt. This was exacerbated by the short maturity structure of theoutstanding debt.
Model There is a single good, which can either be consumed or saved as capital. Three types ofagents: consumers, international investors and the government. The first two are risk neutral inprivate consumption with discount factor β. Consumers also derive additive concave utility fromgovernment consumption and their budget constraint is
ct + kt+1 ≤ (1− θ)atf(kt).
31

The government’s objective is to choose borrowing Bt+1, the repayment decision zt ∈ {0, 1} andpublic consumption gt to maximize consumers’ utility. Its budget constraint is
gt + ztBt ≤ atθf(kt) + qtBt+1.
If the government chooses to default, zt = 0, productivity drops from at = 1 to at = α < 1 forever,and the government loses all access to international borrowing and lending.
The timing is such that first a sunspot variable ζt is realized and becomes part of the state vectorst, then the government chooses Bt+1 given the price schedule qt = q(st, Bt+1), then internationalinvestors choose how much debt to supply given price qt, then government chooses whether todefault, and finally consumers choose consumption and investment given at. Hence, the timing issuch that the government must roll over old debt into new debt, which opens the possibility for aself-fulfilling crisis.
A crisis is one in which the government is unable to sell new debt at a positive price qt. Theauthors focus on a class of equilibria that are Markov in the state vector (i.e., not time-dependent)and for which the probability πt of a crisis (given that the fundamentals allow for a crisis occurring)is constant over time, πt ≡ π. The region for fundamentals (debt and capital levels) in which acrisis occurs with probability π ∈ (0, 1) is called the crisis zone. The sunspot shock ζt, which isuniform on (0, 1), determines whether a crisis actually occurs in the crisis zone. The no-crisis zoneis the region in which it never pays for the government to default, regardless of fundamentals orsunspots. In the default zone, the government always defaults.
Given risk neutrality, the international investors demand a price qt = β(1−π) in the crisis zone,qt = β in the no-crisis zone and qt = 0 in the default zone.
Consumers are risk neutral and so behave in a rather mechanical way. Their optimal investmentplan depends solely on the value of the productivity parameter in the next period. Depending onwhether they ascribe probability 0, π or 1 to it being α, they choose one of three (stationary)capital levels.
The three zones can now be characterized in terms of the government’s value function. LetV ng (s,B′, q) and V d
g (s,B′, q) be the values of not defaulting and defaulting, resp., given state s =(B,K, a = 1, ζ), after it has sold new debt B′ at price q. In any equilibrium with positive lending,the participation constraint
V ng (s,B′, q) ≥ V d
g (s,B′, q)
must hold. If we set q = β(1− π), the constraint determines the upper bound B(K,π) on debt forwhich positive lending can occur in a sunspot equilibrium of the above-mentioned type. Further-more, for a crisis to be able to occur, the government must satisfy a no-lending condition
V ng (s, 0, 0) < V d
g (s, 0, 0),
i.e., that if q = 0, then the government prefers to default. This condition determines the upperbound b(K) on debt at which the government prefers to repay even if q = 0 and a crisis can’t occur.The crisis zone is then given by (b(K), B(K,π)].
It is possible to show that in the crisis zone, the government either chooses to default now, torun the debt down to b(kn) over T periods, or to keep the debt constant and not run it down.Here kn is the level of capital if consumers expect default with probability 0. The value functionfor each of these cases (and for each T ) can be calculated, leading to a characterization of optimalpolicy. Intuitively, the government is motivated to forego some consumption smoothing and instead
32

gradually run down the level of debt, because as it exits the crisis zone, the interest rate 1/qt ondebt decreases, making it easier to finance future government consumption. Furthermore, as thecountry exits the crisis zone, private investment booms since the risk of a productivity declineis eliminated. As the equilibrium parameter π increases, the motivation to exit the crisis zonebecomes greater.
The authors draw a number of conclusions from their model.
• A policy that enhances the credibility of the government by increasing the cost of default maybe interpreted as a drop in α. This indeed raises the level of debt B that can be sustained ifa crisis doesn’t occur, and it also raises the level of debt b at which a crisis is possible. Thegap between these two need not be removed, though, so the crisis zone may remain.
• If the maturity of the bonds is increased, the amount of debt that needs to be rolled overevery period is smaller, decreasing the incentive to default. For sufficiently high maturities,the crisis zone is eliminated.
• The more the government cares about private consumption relative to government consump-tion, the higher is the cost of default, since private consumption really suffers. The governmentcan then satisfy the participation constraint with a higher level of debt. But this high levelof debt makes a crisis possible, widening the crisis zone.
7.6 Eaton and Gersovitz (1981): “Debt with Potential Repudiation”
Summary Sovereign debt is characterized by the absence of an explicit mechanism to enforcecontracts. A dynamic model is laid out in which the borrower may choose to default at the(endogenous) cost of being excluded from future borrowing. Only non-state-contingent, one-perioddebt is considered. Lenders are risk neutral and competitive. Under general conditions, it is shownthat the credit supply curve is upward-sloping and the equilibrium level of credit is the minimumof the demand for credit and a credit ceiling imposed by the lenders. Hence, credit rationingmay occur. The model is specialized to one in which national income can take one of two values.While the demand for credit is always increasing in the growth rate and variability of output,the borrowing limit depends ambiguously on these (if output is stochastic). The implications ofthe model are tested with an econometric model that exploits the minimum condition on realizedborrowing.
Model A country produces output yt. Consumption is ct = yt + bt − pt, where bt ∈ Bt (thefeasible set of debts) and pt are debt service payments. The borrowing country maximizes thesum of future discounted utility. Debt matures in one period and the repayment due is denoteddt+1 = R(bt). If dt < pt, the country is cut off from future borrowing, i.e., Bτ = {0} for τ ≥ t. Theprobability of default is λt = Pr(V D
t > V Rt ), where V D
t is the continuation value of autarky andV Rt is the value function given a decision not to default,
V R(yt, dt) = supbt∈Bt
U(yt + bt − dt) + βE[max{V D(yt+1), V R(yt+1, dt+1)}].
The probability of default is shown to be increasing in the debt service obligations dt.Lenders are competitive and risk neutral, so they break even in expectation:
[1− λ(R(bt))]R(bt) = (1 + r)bt,
33

where r is the safe world interest rate. From this it can be shown that the set of feasible loans hasthe form Bt = [0, bt] for some credit ceiling, and R(bt) is increasing and convex, i.e., the supply ofcredit slopes upwards. If the ceiling is exceeded by the amount b∗t demanded by the country, it canbe shown that there is credit rationing and actual borrowing is bt = min{b∗t , bt}. In credit markets,prices can’t adjust to clear markets since the price won’t be paid if the borrower defaults. Hence,some other margin must adjust and credit rationing occurs.
The model is specialized in two ways. First, a deterministic model is considered in which outputalternates between a high and a low value. The country borrows when output is low and saveswhen output is high (at potentially different interest rates). Trend output grows at gross rate G.Utility is CRRA. The amount of credit demanded is increasing in growth and volatility (i.e., theamount by which output deterministically changes from period to period) for the usual reasons.The authors also show that the credit ceiling is increasing in volatility, while G has an ambiguouseffect on the ceiling. A higher interest rate on saving makes smoothing via borrowing less attractive,reducing the credit ceiling. Finally, if the lenders can impose an exogenous penalty on the countryif it defaults, the credit ceiling rises.
The second specialized model is stochastic. For tractability, the authors assume no growth andno saving. In each period, output can take on one of two values with equal probability. Debt is non-contingent and so default is more attractive in bad times. In contrast with the deterministic case,the debt ceiling may either rise or fall with the volatility of output. Intuitively, higher volatilityincreases the value of future consumption smoothing but also raises the cost of debt service if outputis low. If β is low, the latter effect may dominate.
The various conclusions from the theoretical models are summarized in Section 2.4.
Empirics The model is taken to the data by postulating
b∗i = X ′iα1 + ui, bi = X ′iα2 + vi,
with ui and vi normally distributed and independent. Observed debt is then given by bi =min{b∗i , b}, as in the model. The data is a cross section of developing countries. The model isestimated by ML. It is found that the growth rate of GNP does indeed raise desired debt but hasa near-zero effect on the ceiling.
If an additional penalty of default were exclusion from international trade, this penalty shouldbe increasing in the volatility of exports. Both b∗ and b rise with the volatility of exports, aspredicted by the model.
While the credit ceiling depends significantly on GNP, as expected, the desired debt does not,which is surprising.
The probability model can be used to determine the number of countries in the sample that aremore likely to be credit rationed than not. By this measure, 65 of 85 countries were constrained in1970 and 1974.
7.7 Reinhart and Rogoff (2011): “From Financial Crisis to Debt Crash”
Summary Using an extensive cross-country data set that stretches back almost 200 years, theauthors study correlations between debt, default and crises of various kinds. The main conclusionsare:
• Debt (both public and private) surges non-linearly before a debt crisis hits.
34

• Banking crises tend to precede debt crises.
• Debt becomes more short-term before a debt crisis.
• Banking crises in international financial centers predict banking crises in other countries.
• International defaults come in waves and are often separated by many years.
• Currency and inflation crises go hand in hand.
• Periods of high indebtedness are associated with higher incidence of inflation crises.
• The median duration of default spells has been cut in half post-WW2. The frequency ofbanking crises has also dropped, but they occur as often in developed as in emerging markets.
7.8 Yue (2010): “Sovereign default and debt renegotiation”
Summary Following sovereign defaults creditors typically are able to recover a fraction of thevalue of the loans. Yue develops an SOE model with endogenous default decisions and Nashbargaining over debt restructuring following default. Recovery rates are higher in relatively goodstates, yielding useful insurance for the SOE. Interest rates increase with the level of debt because ofhigher default probability and lower recovery rates. In simulations, due to countercyclical interestrates (and trend shocks), the TB is also countercyclical. The model generates volatile consumptionand about the right amount of interest spread volatility. The average spread is too low sinceinternational investors are risk neutral.
Model SOE with identical households that receive exogenous endowment yt. International in-vestors are risk neutral and require expected return r. Borrowing happens only through one-perioddebt with face value b′ (amount to be repaid next period). Positive b signifies positive NFA. Thebond price function is denoted q(b′, y).
A country’s credit history is denoted by a binary variable h. If h = 0, the country is ingood standing, h = 1 otherwise. A country with h = 0 can choose to default, in which case itrepays nothing in the current period but goes into bad credit standing. The debt is immediatelyrestructured through Nash bargaining (see below) to a new level that is a fraction α(b, y) of theoriginal debt b. If h = 1 and b < 0 (unpaid debt arrears), the country has an unresolved defaultand suffers a proportional output loss λyt, λ ∈ (0, 1), as well as exclusion from capital markets.
The value function v(b, h, y) is characterized as follows. If h = 0, we have
v(b, 0, y) = max{vr(b, 0, y), vd(b, 0, y)},
where the repayment value function is
vr(b, 0, y) = maxb′
u(y + b− q(b′, y)b′) + βE[v(b′, 0, y′) | y],
and the default value function is
vd(b, 0, y) = u(y) + βE[v(α(b, y)b, 1, y′) | y].
35

If h = 1 and the country has only partially repaid its debt arrears, b < 0, the debt is rolled over atinterest rate r. Hence, the value function is
v(b, 1, y) = maxb′∈[b,0]
u
((1− λ)y + b− b′
1 + r
)+ βE[v(b′, 1, y′) | y].
The model therefore allows for an endogenous time of exclusion from debt markets, despite theimmediate restructuring. When all debt arrears are paid in full, the country regains good creditstanding:
v(0, 1, y) = v(0, 0, y).
The debt renegotiation proceeds as follows. The threat point for the debtor country is eternalautarky. The threat point for international investors is no recovery. Let a denote the hypotheticalrecovery rate. The surplus for the country is then
∆B(a; b, y) = u(y) + βE[v(ab, 1, y′) | y]− vaut(y),
where the last term is the continuation value of autarky. The surplus for the lenders is
∆L(a; b, y) = − ab
1 + r,
the present value of recovered debt. Let θ be the bargaining power of the debtor country. The debtrecovery rate α(b, y) solves the Nash bargaining program
maxa∈[0,1]
(∆B)θ(∆L)1−θ
subject to ∆B,∆L ≥ 0. Since the recovery rate is state-contingent, it provides additional insurancefor the defaulting country and helps complete markets.
Foreign lenders are competitive so the bond price schedule is q(b′, y) = 1/(1 + r) if b′ ≥ 0 and
q(b′, y) =1− p(b′, y)
1 + r+p(b′y)γ(b′, y)
1 + r
if b′ < 0. Here p(b′, y) is the expected probability of default, which is E[1{V d(b′,y′)>V r(b′,y′)} | y] inequilibrium. γ(b′, y) is the expected discounted recovery rate conditional on default, which is
E[α(b′, y′)/(1 + r) | y, V d(b′, y′) > V r(b′, y′)]
in equilibrium.
Results Yue first characterizes the model solution theoretically. Because a only enters into thebargaining problem through the product ab (i.e., given default, only the absolute amount of debtreduction matters to creditors and debtor), we can write α(b, y) = min{b(y)/b, 1}. The recoveryrate decreases with the amount of defaulted debt. The default region is increasing in the level ofdebt, and so is the default probability. Because default probability rises with debt and the recoveryrate decreases with debt, the interest rate increases with debt.
The model is calibrated to the most recent Argentinian default. Output is subject to trendshocks as in Aguiar and Gopinath (2006). β and θ are calibrated to match the average default
36

frequency since 1824 and a 27% recovery rate during the 2005 restructuring. The resulting discountfactor and bargaining power parameter are both 0.72.
Quantitatively, the option to restructure is not so beneficial that countries always default whendebt is positive. When a country is hit by a bad shock, the higher debt reduction implies a higherincentive to default, leading to higher interest rate spreads (also through the direct channel ofshocks on default probability). Thus, the correlation between output and interest rates is negativeas in the data. Consumption is more volatile than output due to countercyclical interest rates.These also imply a countercyclical TB (although trend shocks contribute here).
The model supports a 10% debt/GDP ratio, lower than in the data but better than Arellano(2008). Bond spreads are in the right ballpark in terms of volatility but are too low on average dueto risk neutrality among investors. Debt recovery rates are negatively correlated with debt and thuswith default probability. This is consistent with cross-country data. The average length of exclusionfrom financial markets following default is only 2 quarters, perhaps because debt restructuring isimmediate.
The effect of the debtor’s bargaining power θ on the recovery rate is negative, as expected.If the recovery rate decreases, ceteris paribus, the interest rate spread increases, but this detersborrowing, lowering the default probability and thus lowering interest rates. The effect of θ on theinterest rate spread and the default probability is therefore non-monotone, so higher bargainingpower does not necessarily translate into higher borrowing costs.
8 Real Exchange Rates and Purchasing Power Parity
8.1 Alessandria, Kaboski and Midrigan (2010): “Inventories, Lumpy Trade andLarge Devaluations”
Summary At least in emerging markets, importers face non-negligible fixed transaction costsand delivery lags, creating economies of scale in the transaction technology. This leads importersto transact infrequently and hold substantial inventories. A model of the importer’s inventorymanagement problem is constructed and calibrated. Quantity adjustment frictions break the linkbetween a good’s replacement cost and its marginal valuation, and the relationship is non-monotonicin the size of current inventories. Realistic transaction frictions have a tariff equivalent of 20%,much larger than the physical cost of trade. Inventories affect the dynamics of adjustment followinga large unanticipated devaluation: The resulting increase in the wholesale price of imports and theincrease in the interest rate cause importers to want to reduce their inventories rapidly, leading toa drop in imported goods (mainly driven by the extensive margin due to lumpy decisions). Becauseof the desire to reduce inventories, retail prices are raised more slowly than the wholesale price.
Motivation The authors present a number of stylized facts gathered from several micro- andmacro-level data sets.
• Time lags in international trade are considerable. Importing time lags are about three weekson average.
• Importing and exporting costs as a fraction of shipment are around 5–10%.
37

• In a panel of Chilean manufacturing plants, importers hold about 30% of its annual purchasesin inventories, while non-importers hold about 20%. Plants tend to have 2.1 months worthof domestic goods on hand and 4.3 months of imported goods.
• In transactions level data from a U.S. steel wholesaler, international orders tend to be 50%larger and half as frequent as domestic orders.
• Comprehensive monthly data on U.S. exports and imports show that for most goods, exportsare concentrated in just a few months of the year, rather than being sold continuously. Importvalues are higher for firms that have not recently imported.
• In Argentinian CPI data, nonstorable (no inventory) goods respond more to the NER. Theshort-run pass-through is smaller for storable goods that are held in inventories.
• As in Burstein et al. (2005), in six large devaluation episodes, the retail price rose moreslowly than the wholesale price (import price at the dock). Imports collapsed in all episodes,driven mostly by the extensive margin (note that this is opposite of the traditional J-curveview of sluggish trade adjustment for developed economies). The higher the initial increasein the ToT, the larger the immediate drop in imports.
Model Partial equilibrium model of the importer’s inventory problem. There’s a continuum ofimporters. The state is denoted ηt. Importer j is monopolistically competitive with demand curve
yj(ηt) = eνj(ηt)[pj(ηt)]−θ,
where νj(ηt) is a demand shock with i.i.d. distribution N (0, σ2). The wholesale per-unit cost ofimported goods is ω for all importers. Let ij(ηt) denote the quantity imported. If ij(ηt) > 0, theimporter pays a fixed cost f . Re-exporting goods, ij < 0, is not allowed. There is a one-periodlag between ordering imports and delivery, i.e., sales qj(ηt) are constrained not to exceed the firm’sbeginning-of-period inventory sj(ηt):
qj(ηt) = min{yj(ηt, pj(ηt)), sj(ηt)}.
The law of motion for inventories is
sj(ηt+1) = (1− δ)[sj(ηt)− qj(ηt) + ij(ηt)],
where δ is the depreciation rate. Let V a(s, ν) be the value function of a firm conditional onadjustment, and V n(s, ν) be the value function conditional on not adjusting. Then the valuefunction is V (s, ν) = max{V a(s, ν), V n(s, ν)}, where
V a(s, ν) = maxp,i>0
q(p, s, ν)p− iω − f + βE[V (s′, ν ′)],
V n(s, ν) = maxpq(p, s, ν)p+ βE[V (s′, ν ′)],
subject to the sales function q and law of motion for s′.The optimal level of imports conditional on adjustment satisfies the FOC
ω = β(1− δ)E[Vs(s′, ν ′)],
38

and since νj is i.i.d., the optimal next-period inventories s′ conditional on adjustment are constant.The adjustment threshold s∗(ν) increases with ν, as firms with high demand deplete their currentinventories rapidly and thus import more readily.
Due to isoelastic demand, price is set at a constant markup θ/(θ−1) over marginal cost Vs(s, ν).However, marginal cost does not always equal the replacement cost ω (see their Figure 3). For low s,the firm will stock out (i.e., fully deplete inventories), and so the price is set so high that inventoriesare just depleted. For slightly higher s, current inventory holdings do not constrain current salesbut the firm will import to restock its inventory. Hence, ω = Vs(s, ν) and price equals a constantmarkup over the replacement cost. There is a kink in the price function at the adjustment thresholds∗(ν). For slightly higher s, the firm doesn’t adjust and the value of a marginal good in inventoryexceeds the replacement cost since it allows the firm to delay paying the fixed cost. For very highs, however, extra goods in inventory become a nuisance due to the carrying costs and the inabilityto re-export; hence, price is set below the markup times replacement cost to deplete the inventory.
Simulations The model is calibrated using some of the above-mentioned data sets. A period isone month. The resulting fixed cost is about 3.6% of the average value of an import shipment. Theauthors calculate the tariff equivalent of the import costs, i.e., how big of an ad valorem tariff thefirm would pay to get rid of the fixed cost and delivery lag. The value to a firm facing no frictionsbut a tariff τ is
V f (τ) = maxpE0
∑t
(pt − (1 + τ)ω)y(ηt, pj(ηt)),
and the tariff equivalent then satisfies V f (τ) = E[V (0, ν)]. It comes out to 20% for the benchmarkcalibration. This is due to not only the fixed cost but also the carrying costs.
For comparison, the model is calibrated to match domestic retailers. The delivery lag is set tohalf a month and the fixed cost f is set to match a twice as high frequency of orders. The differencein cost per shipment between this and the baseline is just 1.9%, but the tariff equivalent of the gapis 11 percentage points.
With f = 0, inventories are smaller, and the tariff equivalent (solely arising from the deliverylag) is roughly 2/3 of the benchmark. With the benchmark f but no delivery lag, inventory holdingsdrop (no reason to hold a buffer stock) and the tariff equivalent is 40% of the benchmark. Relativeto the benchmark, increasing carrying costs through a doubling of δ raises the tariff equivalent by60%.
A simulation experiment is now carried out to match the model to one of the large devaluations.The devaluation is modeled as an unanticipated increase in ω, ∆ logω = 0.5. Since the interest ratetypically rises in these situations, β is decreased following the devaluation. The mean of ν is shifteddown by 0.15 to encompass the contraction in aggregate demand. Furthermore, it is assumedthat importers produce their final output with both labor l and imported goods m through theproduction function y = lαm1−α, with α = 0.25. This breaks the tight link between marginal costand the wholesale price.
Following the devaluation, the fixed cost is high relative to profits, so firms desire to decreasetheir overoptimistically large inventories. In the transition from the previous steady state to thenew one, firms run down their inventories by (1) importing less on average (primarily a drop inextensive margin) and (2) making the retail price rise less than one-for-one with the wholesale price(since the marginal value of inventories is small). This is consistent with the empirical evidence.In an alternative simulation experiment, the devaluation is assumed to be gradual, and firms learn
39

the full path of ω from the beginning. In this case, firms increase imports initially to stock up oninventories while they are cheaper, but otherwise the conclusions are the same.
8.2 Burstein, Eichenbaum and Rebelo (2005): “Large Devaluations and theReal Exchange Rate”
Summary Studies the behavior of prices of traded and nontraded goods following five largedevaluations. It is found that the ER pass-through to pure traded goods is high and consistentwith relative PPP, while the pass-through to nontraded goods is low. This implies that the relativeprice of nontradables is the main driver of RER movements (which are substantial) in these cases.Using conventional measures of the price of traded goods, based on retail prices, is misleading, asthese include a large component of nontradable distribution services as well as local goods thataren’t actually traded. Traded goods prices at the dock are much more consistent with relativePPP. In-depth analysis of the Argentinian devaluation of 2002, using various detailed data sets,confirms that goods prices change much more and more frequently than prices of services. There isalso evidence of a “flight from quality,” i.e., consumers substitute to lesser-quality items which maybias downward official measures of CPI inflation. Finally, the authors look at large appreciationsand medium-size devaluations; the main results are qualitatively the same, although more muted.For small business-cycle frequency fluctuations in the NER, the traded component of the RER ismore important than the nontradable, but the latter still contributes significantly.
Model The real exchange rate is defined as
RERt =PtStP ∗t
.
Note that an appreciation of the RER corresponds to an increase in RERt, whereas an appreciationof the NER corresponds to a decrease in St (which is in local per foreign units).
For the purposes of price accounting, the CPI is written as
Pt = (P Tt )1−ω(PNt )ω,
where the price of tradables isP Tt = (P It )1−θ(PLt )θ.
Here P It is the retail price of traded (not the same as tradable) goods and PLt the retail price oflocal goods. They make the following assumptions.
• The technology used to transform traded goods or local goods into retail tradable goodsuses nontradable distribution services and is of Cobb-Douglas form. The C-D exponent ondistribution services is φ.
• The price of distribution services equals the price of nontradable goods.
• The distribution sector is perfectly competitive.
• The ex-distribution price of local goods equals the price of nontradables.
40

From the first three assumptions, we can write
P It = (P It )1−φ(PNt )φ, PLt = (PLt )1−φ(PNt )φ,
where a bar signifies ex-distribution price. From the fourth assumption, PLt = PNt . Then the CPIcan be written
Pt = (P It )1−α(PNt )α,
where α = 1− (1− θ)(1− φ)(1− ω).
Results The five large devaluations are Argentina (2002), Brazil (1999), Korea (1997), Mexico(1994) and Thailand (1997). All these are accompanied by a large drop in the (trade-weighted)RER, so inflation is much slower than the NER depreciation. The prices of imports and exportsmove very much in lockstep with the NER. In contrast, the retail price of tradable goods movesmuch less and nontradables even less. The latter can’t be explained by the behavior of government-controlled prices, as these have approximately the same rate of inflation as other nontradables.
The authors conduct a number of price accounting exercises. First, they argue that classifyinggoods as tradables and services as nontradables is too simplistic. By this measure, nontradablesconstitute about 50% of the CPI basket. But the distribution margin, defined as (retail price− producer price)/retail price, is roughly 50% for these countries. Since distribution services areinherently nontradable, this increases nontradables’ share in CPI to 75%. Furthermore, some goods,like yogurt, aren’t actually traded. Taking local goods into account (based on import statistics),reduces the weight of pure traded goods in CPI to about 14%.
They then use the CPI decomposition described under “Model.” They take the price of non-tradables from the data and use two different measures of P It . The first assumes that relative PPPholds for pure traded goods: P It = kStP
I∗t . P I∗t is a trade-weighted average of foreign import and
export prices. The second measure is an equally weighted geometric average of import and exportprices for the country in question. Conditional upon a choice for α, the authors can now constructa theoretical CPI series and compare its rate of inflation with the actual rate of inflation. Theyconsider four different assumptions on ω, θ, φ.
• If all goods are assumed to be traded, α = 0, the implied rate of inflation is much too high.
• If φ = θ = 0, i.e., no distribution costs or local goods, the rate of inflation is still too high.
• If θ = 0, so there are no local goods, but the distribution margin is set to φ = 0.5, the impliedinflation rate looks better but is still a bit too high for all countries.
• If 1−α (the share of pure traded goods in CPI) is set to the total import weight of consump-tion, the result is a lower bound on the importance of pure traded goods since it abstractsfrom exportables (for which they don’t have good data). The implied inflation rate is closeto the true one, but undershoots a bit.
It’s unrealistic to assume that the distribution sector is perfectly competitive. It’s possible tointroduce a multiplicative markup factor in the prices P It and PLt . Doing so, the authors can backout the implied markup that makes the model CPI fit the data. In the latter two cases above,the implied markup moves less than 20% over the devalution, whereas it moves 40%–60% if nodistribution costs or local goods are assumed.
41

The authors argue that, since all their devaluations are associated with a contraction, onewould expect consumers to substitute toward lower-quality items, a “flight from quality.” If CPIprice inspectors underestimate the extent of the quality reduction, this induces a downward bias inmeasured CPI inflation.
The authors decompose the RER into relative tradable prices and relative relative nontradableprices, as in Engel (1999). Using the conventional measure of retail prices for tradables, it wouldseem that the relative price of tradables is the most significant component of the RER movements.However, if the decomposition is based on at-the-dock prices of pure tradables (equally weightedaverage of import and export prices), the nontradable component becomes dominant.
The Argentinian experience is examined in detail using better data. Disaggregated CPI datashows that the rate of increase in retail prices is higher for goods that have a higher market shareof imported and exported goods. This conclusion is backed by scanner data. A survey on pricesof goods and some services in Buenos Aires shows that the frequency of price changes for goodsis much higher than that for services. Finally, some evidence on flight from quality is presented:disappearing products tend to be the higher-priced ones, premium brands suffer larger declines inmarket share and surveys indicate that many consumers switched to cheaper brands.
The authors assess the robustness of their results by comparing with other episodes. First,they consider two large RER appreciations, in Argentina and Mexico. Again, movements in theprices of pure traded goods account for a small fraction of the movement in the RER. They alsostudy medium-size devaluations in 11 OECD countries. There is still substantial ER pass-throughto import and export prices, but less so than for the large devaluations. Using retail prices ratherthan pure traded prices still leads to bias but not as much as before. Finally, the authors considersmall ER fluctuations at the business cycle frequency in OECD countries (the data is HP filteredto isolate higher frequencies). They find that the volatility of at-the-dock traded prices is smallerthan that of the overall RER. However, at-the-dock traded prices still account for about 2/3 of theRER movements. Thus, the relative price of nontraded goods is a significant contributor, but it isnot dominant in this case.
8.3 Carvalho and Nechio (2011): “Aggregation and the PPP Puzzle in a Sticky-Price Model”
Summary Develop a two-country model with multiple sectors in each country. The degree ofprice stickiness varies across sectors. The RER is more persistent and volatile in the heterogeneous-stickiness multiple-sector world than in a counterfactual one-sector world with average price sticki-ness. When the distribution of price stickiness across sectors is calibrated to match U.S. micro data,the model generates a half-life of the aggregate RER of 39 months, consistent with the consensusin the literature. The authors argue that the model helps explain the conflicting findings in theempirical literature on the aggregation bias and the PPP puzzle.
Model Two countries, complete markets. Consumers supply labor to intermediate firms that theyown. Intermediate firms are monopolistically competitive and operate in one of K sectors. Theycan price discriminate across countries. Each sector has a continuum of firms. The relative weightof sector k in the country’s total mass of firms is fk. The final consumption good is nontraded andproduced competitively. Per-period utility is (C1−σ
t − 1)/(1 − γ) − N1+γt /(1 + γ) and the budget
constraint isPtCt + Et[Φt,t+1Bt+1] ≤WtNt +Bt + Tt,
42

where Φt,t+1 is the SDF and Tt are profits received from intermediate firms. Foreign consumerssolve a similar problem. State-contingent assets are denominated in Home currency; the NER(price of Foreign currency in terms of Home’s) is Et. The aggregate real exchange rate is
Qt = EtP ∗tPt.
Due to complete markets, the Backus-Smith condition
Qt = (C∗t /Ct)−σ
holds.The final good Yt is produced by combining aggregate bundles Yk,t from sectors k = 1, . . . ,K;
the elasticity of substitution across sectors is η. Aggregate sector bundles are produced by com-bining Home and Foreign sector bundles YH,k,t and YF,k,t using home-bias weight ω and elasticityof substitution across countries ρ. Finally, Home and Foreign sector bundles are produced by com-bining goods from individual firms in the relevant sector in the relevant country; the elasticity ofsubstitution within sectors is θ.
Home’s final good producing firm maximizes
PtYt −∑k
fk
∫ 1
0(PH,k,j,tYH,k,j,t + PF,k,j,tYF,k,j,t)dj
subject to the production technology for Yt. The sectoral real exchange rate is
Qk,t = EtP ∗k,tPk,t
,
with sectoral price indices appropriately defined.The Calvo probability of updating in sector k is αk, common across the two countries. Inter-
mediate firm j from sector k in Home chooses prices XH,k,j,t, X∗H,k,j,t, to be charged domestically
and abroad (LCP), to maximize
Et∑s
Φt,t+s(1− αk)s(XH,k,j,tYH,k,j,t+s + Et+sX∗H,k,j,tY ∗H,k,j,t+s −Wt+sNk,j,t+s)
subject to the demand curves and technology constraint
YH,k,j,t + Y ∗H,k,j,t = Nχk,j,t.
The equilibrium is assumed to be symmetric so that all firms in a given sector within a countrychoose the same price. The model is closed by specifying a process for nominal aggregate demandZt = PtYt in Home and Foreign (alternatively, an interest rate rule could be defined). The modelis then log-linearized around a zero-inflation steady state.
Additionally, the authors construct a counterfactual one-sector world economy by setting thenumber of sectors K to 1 and letting the probability of price change in this sector equal the averageprobability in the multi-sector world α =
∑k fkαk.
To show some analytical results, the authors specialize to log utility, linear disutility of laborand linear production function (no strategic complementarity). NGDP is assumed to follow an
43

AR(1) process in first differences, with coefficient ρz. It is shown that the sectoral RER follows theAR(2) process
(1− ρzL)(1− (1− αk)L)qk,t = ϕkut,
where ϕk is a constant that depends on β, αk, ρz and ut is white noise (depends linearly on theNGDP shocks in Home and Foreign). If the sectoral RERs are added up, the aggregate RER followsan ARMA(K + 1,K − 1) process (Granger and Morris, 1976):
(1− ρzL)∏k
(1− (1− αk)L)qt =
∑k
∏j 6=k
(1− (1− αj)L)fkϕk
ut.
The dynamics of the aggregate RER can therefore be quite different from those of the sectoral ones.However, from the above it follows that the RER in the counterfactual one-sector world economyfollows an AR(2) process (1− ρzL)(1− (1− α)L)q1sec
t = ϕut. The authors consider three measuresof persistence: the cumulated impulse response (CIR), largest autoregressive eigenvalue (LAR) andthe sum of the autoregressive coefficients (SAC). For each of these measures, it is shown that thepersistence of the multi-sector RER is higher than in the one-sector world. This also holds true forthe variance. The reason is that these persistence measures are convex functions of the frequencyof price adjustments.
Simulations and empirics The full model is then calibrated, assuming that the cross-sectoraldistribution of price stickiness is the same in both countries. The data on sectoral frequency of priceadjustment from Nakamura and Steinsson (2008) is used. The resulting average monthly frequencyof price changes is once per 4.7 months (α = 0.211). The parameter ρz is set to 0.8 for now, in linewith empirical estimates.
The model generates a half-life of the aggregate RER of 39 months, in line with the consensusview of 3–5 years. The counterfactual one-sector world economy produces a half-life of just above 1year. The volatility of the RER is more than twice as big in the heterogeneous model. The impulseresponse to a shock to the RER is hump-shaped as in the data, and the sluggishness is both in theup-life and quarter-life. The degree of persistence and volatility depends crucially (and positively)on the exogenous persistence parameter ρz.
To relate to the empirical literature, the authors decompose the persistence of the aggregateRER as follows. Let P denote a persistence measure. The total heterogeneity effect P(q)−P(q1sec)is decomposed as
P(q)− P(q1sec) =
(P(q)−
∑k
fkP(qk))
)+
(∑k
fkP(qk)− P(q1sec)
).
The first term is the aggregation effect (the difference between the persistence of the average andthe average persistence) while the second term is the counterfactuality effect (the difference betweenthe average persistence and the persistence in the counterfactual one-sector world economy). Usingthe Eurostat data from Imbs et al. (2005), it is shown that both these terms are positive in thedata (for the standard persistence measures), but the counterfactuality effect is much larger. Chenand Engel (2005) and Crucini and Shintani (2008) had concluded that the aggregation effect wassmall. Imbs et al. (2005), by obtaining a half-life from their Mean Group estimated autoregressivemodel, had essentially concluded that the total heterogeneity effect is large. The conclusions in
44

the literature are therefore consistent with each other after all, as they were measuring differentobjects.
The (simplified) model predicts that the standard persistence measures for sector k shouldincrease in (1 − αk). The same is true for the sectoral variance. This cross-sectional prediction istested. First, it is found that an AR(2) specification is a very good fit to almost all of the sectorsin the data; the first and second estimated AR coefficients are for almost all sectors positive andnegative, respectively, as predicted by the simple model. For most of the countries in the sample,there is a significant positive relationship between sectoral price stickiness and persistence/volatilityof the RER.
It is found that a relatively high value of ρz is needed to match the theoretical AR(2) dynamicsto the estimated ones. A value of ρz of 0.8, however, implies much too high an autocorrelationof changes in the NER in the model. If ρz were calibrated to match the latter, one would getρz ≈ 0.35. The authors explore whether this shortcoming can be fixed by tampering with the realrigidities, since these should in theory be able to generate additional endogenous persistence (lessnominal adjustment per unit shock). An exercise is carried out where the ρz and the C-D exponentχ are held fixed at 0.35 and 2/3, while the within-country elasticities of substitution θ and η areincreased gradually. It is found that if these are increased enough, the necessary persistence of theRER is salvaged. The required elasticities are quite high, but the authors interpret their exerciseas showing what could happen if one were to model additional realistic real rigidities. They findit interesting that increasing the degree of real rigidities raises the persistence relatively more insectors that are relatively flexible, thus perhaps explaining why persistence in the data is somewhathigh uniformly across sectors.
8.4 Engel (1999): “Accounting for U.S. Real Exchange Rate Changes”
Summary Decomposes the RER into the relative price of traded goods and the relative priceof nontraded relative to traded goods. Using five different measures of traded and nontradedgoods prices, finds that almost all the MSE of the RER over various horizons can be accountedfor by drift and volatility in traded goods. This is true for most U.S. bilateral RERs with otherdeveloped economies. The findings seems to be qualitatively robust to misclassification of tradedand nontraded goods.
Model The geometric domestic price index can be decomposed as
pt = (1− α)pTt + αpNt ,
where α is the share of nontraded goods. The same holds for the foreign country, whose variablesare denoted with stars (and whose share of nontraded goods is β). Then
qt = st + p∗t − pt = xt + yt,
where st is the log NER (price of foreign currency in terms of domestic),
xt = st + p∗Tt − pTt
is the relative price of traded goods and
yt = β(p∗Nt − p∗Tt )− α(pNt − pTt )
45

is the relative relative price of nontraded goods.The paper chooses MSE as a comprehensive measure of both the drift and variance of RERs.
Engel looks at two different decompositions of the MSE. The first assumes that xt − xt−n is un-correlated with yt − yt−n, so that the share of the MSE of the RER attributed to traded goodsis
MSE(xt − xt−n)
MSE(xt − xt−n) + MSE(yt − yt−n),
whereMSE(xt − xt−n) = Var(xt − xt−n) + [E(xt − xt−n)]2.
In generalMSE(a+ b) = MSE(a) + MSE(b) + 2Cov(a, b) + 2E(a)E(b).
The second decomposition arbitrarily attributes half of the latter two terms to xt, i.e.
MSE(xt − xt−n) + Cov(xt − xt−n, yt − yt−n) + E(xt − xt−n)E(yt − yt−n)
MSE(qt − qt−n).
Standard errors are calculated by bootstrapping: Two independent random walks for xt and yt aresimulated, given the sample mean and variance for the differences.
Results Five different data sets are used.
1. CPI data. Traded goods are commodities, while nontraded are housing and services. Theweight of nontraded goods in the overall index is computed by regression. The author notesthat marketing is a component of the traded goods series, although it probably shouldn’t beincluded. On the other hand, financial services are part of the nontraded series. The tradedand nontraded indexes are approximately uncorrelated in first differences, so the first MSEdecomposition is used. For all countries except Canada, traded goods account for almost100% of the movement of the RER, over all horizons (from 1 month up to almost 40 years).This also holds true if the decomposition were based on just variance or squared drift. Itholds over both the fixed ER period 1962–69 and the subsequent floating period.
2. Output prices. Data from OECD’s sectoral database. De Gregorio et al. (1994) had classifiedthese sectors as traded or nontraded based on export share in total production. MSE decom-positions give the same results as for CPI above. Since marketing should be a much smallerproportion of output prices, this suggests that the CPI results aren’t driven by misclassifica-tion.
3. PCE deflators. Traded goods is the deflator index for PCE on commodities; nontraded areservices. Pattern is the same as for CPI and output prices.
4. PPI. Overall PPI is used as an index of traded goods, so that xt = st + log PPI∗t − log PPItand yt = log CPI∗t − log PPI∗t − [log CPIt − log PPIt]. The author notes three shortcomings ofthis approach: some of the PPI should be attributed to nontraded goods, the data come fromdifferent surveys, and the CPI index is not geometric. Furthermore, xt and yt are no longeruncorrelated in differences, so the second MSE decomposition must be used. The resultsstill indicate, however, that traded goods prices are the dominant driver of movements in theRER, although the share is about 80% rather than close to 100%.
46

5. U.S.-Japan RER. The author takes a closer look at the U.S. vs. Japan RER. The reasonwhy the traded goods component is so dominant is that the upward movement in Japaneserelative nontraded to traded prices has been matched very closely by similar movements inthe U.S. relative price. Furthermore, the share of nontraded goods in Japanese consumptionis only about 1/3. There is no evidence that the relative price of marketing has moved overtime.
Even if the relative price of marketing is constant over time, the MSE decomposition could stillbe biased. Suppose that the price of marketing were perfectly correlated with the measure pNtof nontraded goods prices. Then the measure pTt of traded goods prices could be written pTt =γpNt + (1− γ)pCt , where pCt is the price of truly traded goods. Then the true weight of nontradedgoods in the overall price index is α+γ(1−α). Engel redoes some of the calculations assuming valuesof 1/3 and 2/3 for γ. While a higher value of γ does increase the importance of relative nontradedgoods prices for RER movements, the traded goods component continues to be dominant.
Why are traded goods so important and nontraded so unimportant? One explanation is terms oftrade movements: If relative prices of various traded goods fluctuate a lot, and these prices receivedifferent weights in countries’ price indices, the relative traded goods price index will fluctuate,even if PPP holds good for good. However, when Engel computes foreign price indices based onU.S. weights, the results aren’t much different.
The remaining explanation is that there are large deviations from PPP in traded goods (amongrich countries). Engel refrains from speculating on why that may be but lists a number of areasthat must be better understood. He also cautions against drawing conclusions about the long runfrom his study, since the stationarity and possible cointegration between qt, yt and xt can’t bediscerned based on his limited sample.
8.5 Gopinath, Gourinchas, Hsieh and Li (2009): “Estimating the Border Effect:Some New Evidence”
Summary Use detailed data from a large grocery chain with stores in the U.S. and Canada toestimate the border effect. The data set has weekly prices and costs for products identified at thebarcode level from several stores in both countries, located at various distances from the border.During the 2004–2007 period, the median price gap of Canadian products rose almost in lockstepwith the NER. This was almost entirely due to a rise in the relative cost gap, as relative markupsstayed virtually constant. A circular city model is presented that explains the relationship betweenrelative prices, distance to the border and border costs. The model predicts that markets becomefully segmented when border costs rise above a certain level; in this case, cross-border prices arenot further affected by the border cost. Empirically, the authors obtain a more precise estimate ofthe border effect using a regression discontinuity design. There are large price discontinuities atthe border, but these range from positive to negative across goods. Again, the entire discontinuityis driven by wholesale prices, not markups. This is consistent with full market segmentation.
Model The authors develop a model with a circular world of unit length. Locations are indexedby ω ∈ [0, 1]. There are NA stores in country A and NB in country B. The borders are located atlocations ω = 0 and ω = NA/(NA+NB) (see their Figure 5). Each store sells a homogeneous good.There is a unit mass of consumers who each buy one unit of the good. The utility of a consumer
47

located at ω from the purchase of a good from a store located at location ωi is
u(ω) = ν − θp− t(ωi − ω) + bI(ωi, ω).
Here θ is the price elasticity of demand, t the unit cost of travel, b is the border cost and I(ωi, ω) ∈{0, 1} equals 0 iff. ω and ωi are on the same side of the border. The marginal cost of producing agood in location ωi is ci = min{χi, χ−i + bc} in country i ∈ {A,B}, where χi is the wholesale pricein country i and bc the border cost to the retailer.
They look for an equilibrium where each consumer purchases from the nearest store. Betweenany two stores i and i + 1, there will be a marginal consumer who is indifferent. It is possible toderive the total demand for products at each interior store i (i.e., one that is not right next to theborder) in terms of the prices of firms i− 1, i and i+ 1. The store then chooses pi to maximize itsstatic profits, taking the other prices as given. The FOC gives rise to a difference equation whichis solved by imposing an initial condition for the price at the border. Proposition 1 implies thatthe price pi of store i only depends on the border cost indirectly through its influence on the priceof the store at the border, and the indirect effect decreases with the distance from the border.
They then characterize the prices at the border. There are two cases:
• If the border cost b is high, the marginal consumer is located right on the border. The pricedifference at the border is too small to warrant crossing the border, so national markets arefully segmented. The observed price difference at the border is thus independent of b.
• If the border cost b is small, there is partial segmentation, and the model solution dependson whether the marginal consumer is located in country A or B. The border cost b enters theexpressions for the prices. Intuitively, with integrated markets, stores compete for customerson either side of the border. Hence, if cA > cB, the border store in country A charges a lowerprice than interior stores in its country, while the border store in country B charges a higherprice than interior stores in its country.
The model illustrates that simple regressions using a border dummy and distance from the bordermay be misleading. If the two countries were completely symmetric, the endogenous price distri-bution would be identical across countries with no price discontinuity at the border, despite thepresence of border costs. On the other hand, if the border cost is so high that markets becomefully segmented, the magnitude of the border cost does not further influence prices. Furthermore,idiosyncratic factors in the two countries may influence prices, but a regression may mistakenlyattribute this to border effects (this is outside the model). The authors thus argue for an RDdesign as a better empirical specification.
Empirics The data is from a leading grocery store chain that operates in the U.S. and Canada.Data is weekly and across many stores and product codes. It is possible to match goods acrossstores precisely using unique identifiers. Prices exclude taxes. The data set includes informationon the wholesale cost, i.e., the price the retailer pays for the product at a wholesaler. This isnot the total cost of the good for the retailer, since transportation and wholesale rebates are notincluded. To allow for this, the authors compute the net cost as the price minus “adjusted grossprofits.” It is argued that at short horizons, where rent, capital and labor are fixed, this measuremay be interpreted as the marginal cost of the good to the retailer and adjusted gross profits asthe markup. The prices in the data set change every 2.4 weeks in the U.S. (4.5 in Canada).
48

Preliminary summary evidence on the failure of the LOP is presented. The median cross-border price gap varies across time and rises from 5% in 2004 to 15% in June 2007. The time seriesprofile is almost identical to that of the NER, since the Canadian dollar appreciated markedly inthat period. Using the decomposition log(price) = log(cost) + log(markup), the authors study thetwo subcomponents. It is found that the entire price gap is accounted for by the relative costs,whereas the relative markup stays basically constant. There is a large dispersion of price gapsacross products; some gaps are positive, others negative. Markups are much tighter linked. Themedian price gaps within countries are much smaller. The preliminary evidence thus indicates highborder costs and virtually full market segmentation.
The authors move on to an RD design. The model is
log pki = αk + γkCi + βk′Xi + εki ,
where k indexes products and i stores. Ci is a dummy that equals 1 if the store is in Canada. Xi arecontrols (demographics, density of retail stores in the area, opening year, household income). γk isthe border effect, the parameter of interest. The problem is that E[εki |Ci, Xi] 6= 0, i.e., unobservedcharacteristics may correlate with the location of store i.
Let Di be the distance of store i to the border (Di > 0 if located in the U.S.). If
limδ↑0
E[εki |Di = δ] = limδ↓0
E[εki |Di = δ],
i.e., unobserved characteristics don’t change discontinuously at the border, then the border effectmay be estimated consistently by
γk = limδ↑0
E[log pki − βk′Xi|Di = δ]− lim
δ↓0E[log pki − βk
′Xi|Di = δ].
Each of the two terms can be estimated by local linear regression. The bandwidth (cut-off distancefor δ) may be obtained by cross-validation.
There is no significant discontinuity in store density right at the border, suggesting that storesdon’t locate strategically. Most of the covariates don’t display marked discontinuities at the bordereither.
The RD estimates tell the same story as the preliminary evidence above. The discontinuitiesat the border are significant for most products but vary between being positive and negative. Themedian discontinuity tracks the NER closely. This is found to be almost 100% due to changesin relative wholesale prices, not markups. This indicates full market segmentation, including inwholesaling.
Some product brands are produced by the retail chain itself. It should thus have more controlover the supply chain. We would thus expect the market segmentation to be weaker for theseproducts, which is indeed the case in the data.
Finally, the authors investigate whether a border effect is present at the Washington-Oregonborder. There is no evidence of price or cost discontinuities.
The authors conclude that their microlevel data don’t support the hypothesis that aggregatelevel border effects are due to compositional effects. Surprisingly, cross border price differences aredue to an apparently tradable component of costs, not markup differences.
49

8.6 Imbs, Mumtaz, Ravn and Rey (2005): “PPP Strikes Back: Aggregationand the Real Exchange Rate”
Summary The authors argue that time series or panel data models of the persistence of RERsthat impose common persistence among sectoral RERs (or use aggregate data) are likely to bebiased upwards relative to the true mean sectoral persistence, if these persistence parameters areindeed heterogeneous among sectors (as in a random coefficients setup). Intuitively, sectors withhigher persistence have higher variance and so receive larger weight when estimating the supposedlycommon persistence parameter by standard procedures. Monte Carlo and analytical evidence ispresented to back up this claim. The authors instead advocate using estimation methods that allowfor dynamic heterogeneity. When using such methods, they estimate a mean half-life of about 1–2years as opposed to the consensus in the literature of 3–5 years.
Model Suppose the true DGP for the RER qit in sector i is given by
qit = γi + ρiqi,t−1 + εit, (2)
where γi = γ + ηγi , ρi = ρ+ ηρi for some mean-zero variables ηγi , ηρi . The parameter of interest is ρ,
or more precisely the half-life log 2/ log ρ. Then
qit = γ + ρqi,t−1 + eit, (3)
whereeit = εit + ηγi + qi,t−1η
ρi .
If one were to estimate the common-coefficient model (3) by, say, pooled OLS, the resulting estimateof ρ would be biased, since the regressor qi,t−1 is correlated with the error term eit (at leastconditional on ηγi , η
ρi ). In fact, we can say more.5 Set γi ≡ 0 for simplicity. The sign of the bias of
the common-coefficients pooled OLS-estimator is given by the sign of
E[eitqi,t−1] = E[q2i,t−1η
ρi ] = E{E[q2
i,t−1|ηρi ]ηρi } = E
[σ2i
1− ρ2i
ηρi
].
Here I have set σ2i = E[ε2
it] and assumed E[εitqi,t−1] = 0 and that ηρi is independent of {εit}t. Ifthe distribution of ρi is concentrated on (0, 1), ηρi and ρ2
i are positively related. It follows that theabove bias will be positive.
Instead of panel regressions, some papers perform a time series regression on aggregate data.Let ωi be the weights for aggregating sectoral RERs to the aggregate RER qt =
∑i ωiqit. Then
under the above true model,qt = γ + ρqt−1 + et,
where et =∑
i ωieit. For the same reason as above, OLS estimation will be biased, and the biasmay be expected to be positive.
A consistent estimator is Pesaran and Smith’s (1995) Mean Group estimator, which is just thecross-sectional average of the equation-by-equation OLS estimates ρi from (2). Imbs et al. alsoconsider a variety of other estimators that differ in their treatment of the error covariance structure.
5The following is a simplified version of Imbs et al.’s argument.
50

Results The dataset is from Eurostat and contains monthly cross-country observations on sec-toral prices. The RERs are CPI-based and relative to the U.S. Standard common-coefficientsestimation procedures such as FE or Arellano-Bond give standard estimates of a half-life between3 and 5 years. Estimators that allow for dynamic heterogeneity all yield substantively smallerestimates of the “average” half-life (I put “average” in quotation marks due to Jensen’s inequality:the average ρ is estimated consistently but the resulting half-life is not the average of the sectoralhalf-lives). The MG estimator gives a point estimate of about 2 years, while other estimators thatadjust for cross-sectional correlation in the errors yield even smaller estimates. Standard errors areon the order of two months. The individual sector and country estimates of ρi reveal substantialheterogeneity, particularly among sectors within countries, but also within sectors across countries.Generally, traded sectors tend to display lower persistence than nontraded ones.
A Monte Carlo experiment confirms that severe upward bias may result from estimators thatdon’t take into account the possibility of cross-sectional heterogeneity in persistence. Furthermore,the average persistence implied by their preferred estimates squares well with the calibrations inthe theoretical model of Chari, Kehoe and McGrattan (2002), and so is consistent with only amoderate degree of nominal stickiness.
Finally, the authors conduct some robustness checks. First, a Hausman test (performed for eachcross section unit) based on the difference between OLS and IV rejects the notion that measurementerror of sectoral RERs is an issue. Second, the authors perform some bootstrap-based and analyt-ical bias corrections on their autoregressive estimates. The resulting bias-corrected half-lives aresomewhat higher than the uncorrected ones, but still well below the literature’s consensus range.
The authors conclude that it is important to allow for cross-sectional heterogeneity when hold-ing theory up against data. The aggregate RER is still a well-defined object with a well-definedaggregate persistence. However, the high persistence estimates arising from such time series re-gressions do not imply a failure of theory; in fact, the properly estimated mean sectoral persistenceseems to be in line with what is produced by standard OE models with price stickiness.
9 LCP vs PCP
9.1 Atkeson and Burstein (2008): “Pricing-to-Market, Trade Costs, and Inter-national Relative Prices”
Summary Relative PPP predicts that the ToT should move one for one with the PPI-basedRER. On the other hand, since the CPI is a trade-weighted average, the CPI-based RER shouldbe smoother than the PPI-based RER. However, in U.S. data, the ToT are much less volatile thanthe PPI-based RER, while the CPI-based RER is about as volatile. This indicates that relativePPP does not hold. The authors develop a flexible price model with nested CES demand functionsand trade costs. A reasonable calibration of the model matches the empirical facts. To break thelink between the RER and ToT, it is necessary to have pricing-to-market. Two ingredients arekey: imperfect competition with variable markups and international trade costs. Without variablemarkups, firms would set prices at a country-constant markup over costs and relative PPP wouldhold. Without trade costs, firms would face the same competitors at home and abroad and thusdon’t price-to-market. For the CPI movements to be large, the import share of expenditures mustbe small, which is ensured with trade costs. To get the relative volatility of the ToT to move inthe right direction, it is necessary to have a large amount of price dispersion since only large firms
51

(that have significant market power abroad) price-to-market in the required way.
Empirics and basic theory Their Figure 1 shows the evolution of the U.S. PPI-based RER,CPI-based RER and the ToT. Movements in the former two are of approximately the same magni-tude, whereas the latter is 1/3 to 2/3 as volatile. The ToT is positive correlated with the PPI-basedRER, but less than perfectly.
The log change in the PPI-based RER may be decomposed as
PPI
PPI ∗=
EPI
IPI+
PPI
EPI+
IPI
PPI ∗, (4)
where the first term on the RHS is the ToT, the second is the ratio of producer and export prices,and the third is the ratio of import (foreign export) and foreign producer prices. All prices areexpressed in a common currency. Under relative PPP, the second and third terms should be zero,and so the PPI-based RER and the ToT should move one for one. In the data all three terms onthe RHS are positively correlated with the LHS. This holds both at the aggregate, trade-weightedlevel as well as for country-of-origin and sectoral measures.
Consider a simple two-country symmetric model with balanced trade. Since there are onlytwo countries, EPI 1 = IPI 2 and vice versa. The log change in the CPI for country 1 is thenapproximately
CPI 1 ≈ PPI 1 + sM (IPI 1 − EPI 1),
where sM is the share of consumption spent on imports (same for both countries due to symmetryand balanced trade), and for country 2,
CPI 2 ≈ PPI 2 + sM (EPI 1 − IPI 1).
ThenCPI 1 − CPI 2
PPI 1 − PPI 2
≈ 1− 2sMEPI 1 − IPI 1
PPI 1 − PPI 2
.
Hence, for the CPI-based RER to move about one for one with the PPI-based RER, it is necessaryto have (1) a low import share sM and (2) small movements EPI 1 − IPI 1 in the ToT relative tothe PPI-based RER.
Model Two symmetric countries indexed by i = 1, 2. Aggregate shocks to productivity are seen asthe driving shocks. Consumer preferences are u(c, l) = µ log c+(1−µ) log(1− l). Asset markets arecomplete, so the Backus-Smith condition c2/c1 = P1/P2 holds. The final nontradable consumptiongood ci in each country is produced by a competitive firm using output from a continuum of sectorsindexed by j ∈ [0, 1] using a CES production function with elasticity η. This leads to an inversedemand function
PijPi
=
(yijci
)−1/η
for goods in sector j. In each country-sector pair there are K domestic firms selling distinct goods.The K firms from the corresponding Foreign sector may sell goods in the Home sector as well (more
52

on this below). The sectoral output is a CES aggregate of all firm outputs. The inverse demandfunction for goods within the sector is then
PijkPij
=
(qijkyij
)−1/ρ
.
The production function is CRS and uses only labor, Aizl, where Ai denotes aggregate productivityand z is idiosyncratic productivity that differs across firms, log z ∼ N (0, θ). Marginal costs,excluding trade costs, are then Wi/(Aiz). There is a fixed labor cost F for a firm that wishesto export. Furthermore, it pays a proportional “iceberg” cost D ≥ 1 for each good exported, somarginal cost for exported goods is DWi/(Aiz).
Goods within a sector are more substitutable than goods across sectors, ρ > η > 1. Domesticfirms in a sector always enter. The entry decision of foreign firms is modeled as follows. All firmsthat have entered a sector are assumed to play a static game of quantity competition in everyperiod: They choose their quantity taking as given other quantities, the wage rate and the finalconsumption price and quantity, but they recognize that their decision influences sectoral pricesand quantities. I.e., they choose P, q to maximize Pq− qWi/(Aizijk) subject to the inverse demandcurve. The FOCs give, for country 1,
P1jk =ε(s1jk)
ε(s1jk)− 1
W1
A1z1jk, ε(s) = [ρ−1(1− s) + η−1s]−1,
where sijk = Pijkqijk/∑
l Pijlqijl is the market share for firm k in its sector. In terms of prices,
sijk = P 1−ρijk /
∑l P
1−ρijl .
The number of foreign firms that enter a sector is determined sequentially. Let aggregatevariables be given. First the most productive foreign firm tries to enter (this is just one of manypossible equilibria). Equilibrium prices and quantities are computed, recognizing that it has ahigher marginal cost. If the foreign firm’s resulting profits exceed the fixed cost, it enters, and thenext-most productive foreign firm tries to enter. Otherwise, no foreign firms enter. This process isthen repeated. The general equilibrium is determined by finding a fixed point in terms of aggregatevariables for the sectoral entry decision and price and quantity determination.
The assumption ρ > η implies that markups increase with the market share: a firm with nomarket share perceives only the sectoral demand elasticity ρ, whereas a firm with the entire marketshare perceives the lower elasticity of demand across sectors η. This opens up for the possibilityof less-than-full pass-through of costs: If a firm’s marginal costs go up relative to other firms,this firm loses market share and so decreases its markup in equilibrium. If there are trade costs,firms will tend to have a smaller market share abroad than at home. Hence, if firms in country 1experience an aggregate cost shock, they will price-to-market and raise their export price less thantheir domestic producer price. Thus, the ToT rises less than the PPI-based RER.
Simulations The model is calibrated to match trade volume, the share of firms that export andthe median Herfindahl index across sectors. Two alternatives to the benchmark are considered.One sets ρ = η which gives constant markups. The other sets D = 1 and F = 0 so there isfrictionless trade.
The benchmark model manages to reproduce all the qualitative features of the relative volatili-ties and comovement of the PPI- and CPI-based RER and ToT. As in the data, the subcomponents(4) of relative PPI-RER changes are positively correlated. The import share is small at sM = 0.165
53

as required. The CPI-based RER doesn’t move quite as much as the PPI-based RER, although it’sclose. The authors show that an extension of the model to include distribution costs increase therelative volatility of the CPI-based RER (they decrease the effective import share, and their pricefluctuations exceed those of the PPI-based RER if there is incomplete pass-through).
In the frictionless trade parameterization, there is still incomplete pass-through since η < ρ, butall firms have the same cost for sales in each country, so the market share, price and quantity is thesame across countries for each firm. Therefore export prices remain constant relative to domesticproducer prices. The CPI-based RER does not move at all because relative PPP holds and theconsumption baskets are identical across countries.
For the constant markup parameterization, relative PPP holds good for good.In the benchmark model there is a great deal of heterogeneity in pricing behaviors. For many
firms with small market shares, export prices tend to change more than domestic producer prices.However, large firms dominate the index. Intuitively, for a firm that exports, there are two effectsof an idiosyncratic increase in its marginal costs.
• First, its home market share tends to be larger than that abroad, and so the domestic markupis reduced more; this effect goes the wrong way.
• Second, if the domestic sectoral price level rises relative to that abroad, a domestic firm hasa comparatively high price in the foreign market and so wants to reduce its markup abroad;this effect goes the right way.
The latter effect only wins out for large firms with sizeable foreign market shares (note that byassumption, only the most productive firms enter the foreign market).
The sensitivity analysis shows that the only really crucial feature is the relatively high valueof the within-sector Herfindahl index. The authors conclude that their results are sensitive to themodel.
9.2 Gopinath and Itskhoki (2010): “Frequency of Price Adjustment and Pass-Through”
Summary In the data, goods whose prices are adjusted frequently also exhibit the largest amountof long-run pass-through (LRPT) following exchange rate movements. The correlation betweenfrequency and size of adjustment is close to zero. The authors develop two models that explainthis. First, in a static menu cost set-up, they show that variable markups deliver the desired result.Higher markup elasticity raises the curvature of the profit function with respect to prices, whichreduces the region of non-adjustment, but it also reduces the size of the desired adjustment sothat the price is more likely to stay within the adjustment bounds. The latter effect dominates,so a higher markup elasticity reduces both frequency and size of adjustment. The authors go onto develop a dynamic version of the model that they calibrate and simulate. Varying the markupelasticity generates a good deal of variation in the frequency of adjustment, although less thanin the data. If both the markup elasticity and the menu cost vary independently across firms inthe cross-section, the zero correlation between frequency and size of adjustment can be matched.Neither a menu cost model with constant markups nor a Calvo model matches the facts.
Empirics The data set from Gopinath and Rigobon (2008) is used. Only dollar-priced importsare considered, restricting attention to market transactions and excluding intrafirm prices. The
54

authors run two kinds of regressions. Before running the regressions, the products are sorted intotwo equal-sized bins according to the frequency of price adjustment.
• The first regression is at the micro-level and uses life-long changes, i.e., the cumulative changesover the life of the product in question. The (CPI inflation adjusted) change in log price isregressed on the cumulative change in the log bilateral CPI-based RER (an increase means areal dollar depreciation). The life-long pass-through is then the estimated coefficient on theRER.
• The second regression is at the country level. For each month it regresses the monthly changein the log price level (for that country) on 24 distributed lags of the bilateral RER. Theaggregate LRPT is then the sum of the lag coefficients.
Using the life-long PT regressions, the PT is more than double for the high-frequency goods com-pared to the low-frequency goods (44% to 21%). This is even starker if attention is restricted toimports from high-income OECD countries. Results are basically the same in the sample of differ-entiated goods. The difference holds within countries as well as in the aggregate. If the numberof frequency bins is increased to 10, LRPT goes from 18% to 75% across these bins. The medianabsolute size of price adjustment is about the same across the 10 frequency bins. The authorsalso regress the change in log price on the change in log RER, the frequency of adjustment and theinteraction between the latter two. The interaction term comes out significantly positive. Finally, avariance decomposition of price frequency into between- and within-sector components shows thatwithin-sector variation is dominant.
For the aggregate LRPT regressions, the results are qualitatively the same, although somewhatdiluted and with larger standard errors.
The authors stress that in this paper they are measuring long-run as opposed to medium-runPT. Gopinath and Rigobon (2008) measured the latter. They found that MRPT is decreasing infrequency, but that is purely driven by the non-dollar-denominated prices.
Simple model There is a single firm. It sets a price before observing productivity and ERshocks, after which it can pay a menu cost to be allowed to update its price. The demand scheduleis Q = ϕ(P |σ, ε), where P is its price and σ, ε are parameters. The price elasticity of demand isσ = −∂ logϕ/∂ logP and the superelasticity of demand is ε = ∂ log σ/∂ logP . A normalization isimposed such that if P = 1, then σ = σ and ε = ε. Furthermore, it is assumed that ϕ(1|σ, ε) ≡ 1.The constant MC are
MC = (1− a)(1 + φe)c,
where a is productivity shock, e a real ER shock and φ is the sensitivity of MC to the ER. Theshocks are independent with mean zero. The constant c is set to (σ− 1)/σ, which implies that theoptimal flexible price when a = e = 0 is 1. Profits are
Π(P |a, e) = ϕ(P )(P −MC (a, e)).
The desired price P (a, e) is the argmax of the above; Π(a, e) is the optimal profit Π(P (a, e)|a, e).The desired price is given implicitly by
P (a, e) =σ(P (a, e))
σ(P (a, e))− 1(1− a)(1 + φe)c.
55

Let P0 denote the price the firm sets before the shocks hit. The firm chooses to reset its price if
L(a, e) ≡ Π(a, e)−Π(P0|a, e) > κ.
The non-adjustment region is therefore ∆ = {(a, e) : L(a, e) ≤ κ}, and the initial price is optimallychosen as
P0 = arg maxP
∫(a,e)∈∆
Π(P |a, e)dF (a, e) = arg maxP
ϕ(P )(P − E∆[MC ]),
using linearity of profits in MC. A log-linearization shows that P0 ≈ P (0, 0) = 1. Intuitively, if ∆is nearly symmetric around zero and shocks are symmetrically distributed, a = e = 0 is a goodstarting point for setting the price.
It is shown thatP (a, e)− P0
P0≈ Ψ(−a+ φe), Ψ =
1
1 + ε/(σ − 1),
and ERPT is Ψe = φΨ. To interpret, note that the markup elasticity is
∂ log[σ/(σ − 1)]
∂ logP= − ε
σ − 1,
which is −ε/(σ−1) at P = 1. Ψ is a negative transformation of the (absolute value of the) markupelasticity. A higher price increases the elasticity of demand which leads to a lower desired markup.
They also show that
L(a, e) ≈ 1
2
σ − 1
Ψ
(P (a, e)− P0
P0
)2
.
Hence, ceteris paribus, a higher (absolute) markup elasticity increases L(a, e), the benefit fromadjusting. This is because it increases the curvature of the profit function.
Combining the above,L(a, e) ≈ 1
2(σ − 1)Ψ(−a+ φe)2.
This is decreasing in the markup elasticity. Even though a high markup elasticity increases profitlosses conditional on the PT, it also reduces the desired PT, and so the end result is a lowerfrequency (i.e., probability) of price adjustment. Note also that the frequency of price adjustmentincreases with the sensitivity of MC to the ER, φ. An increase in the menu cost κ clearly reducesthe frequency of adjustment.
The model predicts that frequency and size of adjustment are positively correlated (since bothdepend negatively on the markup elasticity). However, this can be diluted (as in the data) byintroducing independent cross-sectional variation in ε and κ.
Dynamic model and simulations The dynamic model has continuum of goods varieties. Thereis a unit measure of U.S. varieties and ω < 1 of foreign varieties. The demand schedule is derivedfrom the Kimball (1995) aggregator, and results in
ϕ(Pj , P ) =
[1− ε log
PjP
]σ/ε.
56

MC are constant and derive from domestic and foreign wages. Profits are
Πjt(Pjt) =
[Pjt −
W 1−φt (W ∗t )φ
Ajt
]ϕ(Pjt, Pt),
where φ is the share of foreign labor inputs in production. Ajt is idiosyncratic productivity,which follows an AR(1) in logs. The firm is assumed to only base its decisions on the statevector Sjt = (Pj,t−1, Ajt, Pt,Wt,W
∗t ) for numerical convenience. Let V N and V A be the value
functions conditional on not adjusting and conditional on having paid the menu cost. ThenV = max{V N , V A − κ} is the overall value function, and
V N (Sjt) = Πjt(Pj,t−1) + E[Q(Sj,t+1)V (Sj,t+1|Sjt],
V A(Sjt) = maxPjt
Πjt(Pjt) + E[Q(Sj,t+1)V (Sj,t+1|Sjt],
where Q is the one-period SDF, which is set equal to β.All prices are in units of the domestic currency. The latter is assumed stable, so Wt = 1. The
wage-based RER is Et = W ∗t /Wt = W ∗t . A period is one month. The discount rate is 4%. ω iscalibrated to match the import share. φ = 0 and φ∗ = 0.75. The log RER follows a very persistentAR(1). σ = 5 so the s.s. markup is 25%. A range of different values for ε is tried, with ε = 4 beingthe baseline since it matches the LRPT in the data. The menu cost is 2.5% of revenues, conditionalon adjustment, in s.s.
The LRPT produced by the model is estimated as in the empirical section. There is a strongpositive relationship between frequency and LRPT for importers. The relationship is essentially flatfor domestic firms (the only reason why it’s not entirely flat is the indirect effect working throughthe price index). Both regressions used in the empirical section produce estimates that are close tothe infeasible counterpart (which uses actual MC).
Varying ε generates substantial variation in the frequency and LRPT. The dispersion of fre-quencies is not as large as in the data, though. The LRPT depends too steeply on the frequencyrelative to the data. Varying φ generates a lot of variation in the LRPT, unsurprisingly, but notmuch in the frequency. Varying κ generates a ton of variation in the frequency, of course, butalmost no change in the LRPT. The authors now try to let both ε and κ vary independently acrossfirms according to some distributions. This sufficiently dilutes the steepness in the frequency-LRPTrelation, and it ensures that frequency and size of adjustments are uncorrelated.
Finally, the authors find that a Calvo model with large exogenous differences in the probability ofadjustment can’t induce a sufficiently positive correlation between frequency and measured LRPT.The Calvo model generates much slower adjustment than the menu cost model, so the low-frequencyfirms don’t get to adjust enough following ER movements, and so the measured LRPT at, say, the24-month horizon is non-zero. However, even this measured difference between high- and low-frequency firms is much too small.
9.3 Gopinath, Itskhoki and Rigobon (2010): “Currency Choice and ExchangeRate Pass-Through”
Summary In U.S. import data, there is a large difference between the ERPT of goods priced indollars and of those priced in non-dollars, at both medium and long horizons. This is inconsistentwith standard OE models in which the assignment of firms to LCP vs PCP is exogenous: Under this
57

assumption, in the short run the PT is 100% for PCP firms and 0% for LCP firms, but when pricesadjust, ERPT is the same. In the data, non-dollar pricers adjust less frequently than dollar pricers.The authors construct a Calvo pricing model, with the option for firms to choose their currencywhen resetting prices. First they show analytically that, in a first-order log-linearization, a firmchooses PCP if the desired medium-run PT (i.e., the expected desired ERPT until the next pricechange) is high. This particular MRPT measure may be recovered from a simple regression of thecumulative price change since last adjustment on the increase in the NER, without controlling forother variables. Hence, a sufficient statistic for optimal currency choice is available and estimable,regardless of the source of incomplete PT. On the other hand, LRPT is a less useful statistic inthis regard. The model is analyzed numerically, assuming variable markups and imported inputsin production. Both Calvo and menu cost pricing is considered. A firm selects PCP when theelasticity of its markup is low and the share of imported inputs is high (i.e., when the sensitivityto the ER is high).
Empirics Same data set as in Gopinath and Rigobon (2008). Include only countries that havea significant share of exports to the U.S. priced in non-dollars. This leaves only richer Europeancountries, Japan and Canada.
They first present aggregate evidence. For every country, two price change series are constructed,one for dollar goods and the other for non-dollar goods. Then for each of these series, the pricechange is regressed on lagged NER changes, lagged foreign inflation and lagged U.S. GDP growth.The PT is defined as the sum of the coefficients on NER lags. First all the countries are pooled. Thecontemporaneous PT is close to zero for dollar goods and close to 1 for non-dollar goods, consistentwith price stickiness. However, the PT only gradually rises up to 0.2 in the dollar subsample as thehorizon is increased to 24 months. This pattern is found in all the individual country series, exceptfor Canada where the two PT elasticities intersect. The pattern also holds up using individual goodpanel regressions.
The authors go on to estimate micro-level PT conditional on a price change, i.e., for everyprice change, the change in price is regressed on the cumulative NER change over that period andcontrols. The PT measured in this way is 0.24 for dollar goods and 0.92 for non-dollar goods. Theresults are similar in the subsample of differentiated goods. When the exercise is carried out onseparate sectors, there is substantial variation in the results, but 18 of the 19 sectors that have amix of dollar and non-dollar items show a larger ERPT for the latter items.
It is also possible to measure the lifelong PT, i.e., using the change in price and ER over thelife of each good in the sample. Life-long PT is 0.49 for dollar goods and 0.98 for non-dollarones. Hence, PT for dollar goods is about twice as high in the long run as for the first round ofadjustment.
Non-dollar pricers have lower price adjustment frequency (0.07) than dollar pricers (0.10). Thispartly reflects that non-dollar pricers are mostly in the differentiated sector. The median size andabsolute size of price changes is similar regardless of currency.
Model Partial equilibrium environment. State vector st. A single firm that exports into the U.S.decides which price pt to set. The desired (flexible) log price is
p(st) = arg maxp
Π(p|st).
58

The desired log price in the producer’s currency is then p∗t = pt − et. et is assumed to follow arandom walk for now. Each period, there’s a probability (1− θ) that the firm is allowed to adjustits price and its currency of pricing. The value to the firm of LCP (resp., PCP) is VL(p|st) (resp.,VP (p∗|st)), where
VL(p|st) = Π(p|st) + δθEt[VL(p|st+1)] + δ(1− θ)Et[V (st+1)],
VP (p∗|st) = Π(p∗ + et|st) + δθEt[VP (p∗|st+1)] + δ(1− θ)Et[V (st+1)].
The optimal local (resp., producer) currency price is denoted pL,t (resp., p∗P,t). Then
V (st) = max{VL(pL(st)|st), VP (p∗P (st)|st)}.
Proposition 1 shows that, up to a first-order log-linearization, we have
pL(st) = (1− δθ)∞∑t=0
(δθ)lEtp(st+l), p∗P (st) = (1− δθ)∞∑t=0
(δθ)lEt[p(st+l)− et+l],
so pL(st) = p∗P (st) + et (due to the RW assumption). So the reset price will be the same (convertedto the same currency), regardless of LCP vs PCP. Hence, if firms with the same underlying char-acteristics are assigned a currency exogenously, the ERPT should be the same conditional on thefirst adjustment (the proof does not rely on the currency choice being endogenous).
The difference between the LCP and PCP value functions are
L(st) = VL(pL(st)|st)− VP (p∗P (st)|st) =∞∑l=0
(δθ)lEt[Π(pL(st)|st+l)−Π(p∗P (st) + et+l|st+l)],
which may be seen from the Bellman equations. In Proposition 2, this is approximated to secondorder to arrive at
L(st) ≈−∂2Π(p(st)|st)
∂p2
∞∑l=0
(δθ)lvart(et+l)
[1
2− covt(p(st+l), et+l)
vart(et+l)
].
Hence, LCP is chosen iff.
Ψ ≡ (1− δθ)2∞∑l=1
(δθ)l−1lcovt(p(st+l), et+l)
vart(et+l)<
1
2.
The sufficient statistic on the LHS is termed the MRPT. It is a weighted average of ERPT co-efficients into desired prices. We see that currency choice does not just depend on LRPT or thedesired PT on impact, but on a weighted average of the entire path of PTs until the next ad-justment. LRPT is determined by the characteristics of the profit function, not on price settingdynamics.
The authors put some more structure on the problem. First they write
pt ≡ p(et, Pt|zt) = µ(pt − Pt|zt) +mc∗(et|zt) + et,
where Pt is the log sectoral price level. They show in Proposition 3 that if φt ≡ ∂(mc∗t + et)/∂etand Λt ≡ −∂µt/∂(pt − Pt) are constant, and the log sectoral price level follows an AR(1) process,then the covariance terms in Ψ do not depend on st. Hence, currency choice is once-and-for-all.
59

Corollary 4 shows that if the desired profile of PT to ER shocks is increasing, then the firm ismore likely to choose PCP if it has a longer price duration (as in the data) or an everywhere higherdesired PT profile.
Proposition 5 shows that under the simplifications above, the population micro-level regressionof the price change since last adjustment pL,t− pL,t−τ on ∆et yields the coefficient Ψ (for PCP theLHS variable should be p∗P,t+ et− p∗P,t−τ − et−τ ). This is exactly the MRPT regressions carried outin the empirical sections, except that there they used the cumulative ER change et − et−τ on theRHS. They argue that using the latter should result in less noisy estimates.
Simulations The model is now parameterized and solved numerically, without imposing some ofthe simplifications needed for the analytics. The general message is that the analytical conclusionshold up in the richer set-up.
The model incorporates variable markups and imported intermediate inputs. The demandschedule is the Kimball-type
q = [1− ε(p− P )]σ/ε,
such that the elasticity is σ/[1− ε(p−P )] and superelasticity is ε/[1− ε(p−P )]. The steady state(p = P ) markup elasticity is Γ = ε/(σ− 1). The log MC are mct = φet− at. φ is thought of as theshare of domestic inputs in production (for the exporter). In the Calvo version of the model, thefirm updates price and currency with probability 1− θ. In the menu cost version, the firm can paycost κ to update.
Both at and et follow persistent AR(1) processes. θ and κ are calibrated to match the empiricalprice durations. The sectoral price level follows an AR(1)
(Pt − P ) = α(Pt−1 − P ) + (1− α)φet, P = log[σ/(σ − 1)].
Hence, φ = 0.5 measures the aggregate LRPT. α = 0.95. The steady-state elasticity of demand isset to σ = 5. ε and φ are varied on [0, 8] and [0.5, 1], respectively.
The LRPT is computed as the desired ERPT given the long-run response of Pt. With φ fixed,both the MRPT and the LRPT are decreasing in Γ, but MRPT decreases faster. It is found thatthe cut-off of 0.5 for the MRPT is a good rule of thumb for determining the optimality of LCP vsPCP (i.e., the comparison of value functions gives approximately the same result). See Figure 3.Keeping ε fixed, it is found that both MRPT and LRPT increase with φ, at about the same rate.Figure 5 shows the region in (Γ, φ) space in which PCP is optimal; this is the case when Γ is lowand φ high. It is found that the empirical MRPT micro-level regressions provide good estimates ofthe theoretical MRPT Ψ (despite the fact that the ER isn’t exactly a RW here).
The authors finally discuss whether there is a way to reconcile exogenous currency choice withthe data. If firms were backward-looking, i.e., don’t set prices too far from past prices, there wouldbe differential PT conditional on price adjustment, as in the data. However, the LRPT shouldstill be the same for similar firms. Furthermore, in the data there is distinct sorting of non-dollarpricers into certain sectors. This could be for institutional reasons, but then one would have toexplain why other sectors have a mix of dollar and non-dollar pricers.
9.4 Gopinath and Rigobon (2008): “Sticky Borders”
Summary BLS data on individual imported and exported U.S. goods show that prices are stickywith an average duration of about a year. Stickiness is quite heterogeneous. 90% of U.S. imports
60

and 97% of exports are priced in dollars. Prices contracted in foreign currency are only slightlymore sticky than dollar prices. There has been a trend decline in the probability of price adjustmentfor imports; this holds across different kinds of goods, so the effect is largely within-sector and notcompositional. ER pass-through into U.S imports is low, 20–30%, even when one conditions on aprice change. Goods with a lower frequency of price adjustment display higher pass-through. Thereis evidence that most prices in the data set are allocative and that quantities are more flexible incontracts: Many exporting firms specify that the country of destination is not price-determining,and when asked whether the price is specific to a quantity, most firms answer the default “no.”
Empirics The data set is an unpublished survey of U.S. import and export prices for individualgoods that the BLS conducts to construct price indices. Price data is collected monthly, 1993–2005.It is voluntary for firms to respond. The authors only include price quotes for actual transactionsand further leave out intrafirm transactions.
The frequency of price changes is calculated in various ways, depending on the adjustment forgoods substitution and discontinuation. The trade-weighted median duration for imports variesbetween 11–14 months and 11–16 for exports. Heterogeneity in stickiness is relatively large; forimports (exports) the weighted median monthly frequency of price adjustment is 9% (7.5%), theweighted mean is 28.8% (23%) and standard deviation 27.4% (26%). The authors classify goodsinto three categories: organized exchange traded goods, reference priced goods (whose prices arequoted in trade magazines) and differentiated goods. The median frequency of price change ishighest for exchange goods (83%), then reference (30%), then differentiated (7%). This accordswith the prediction from menu cost models where the cost of not adjusting is increasing in theelasticity of demand. However, goods traded on organized exchanges are probably also subject tomore speculation.
The authors note that the observed frequency of price adjustment accords well with the literatureon U.S. retail prices (adjusted for sales) as well as producer prices.
The authors also focus on episodes in which the foreign currency depreciated by more than 15%in one month. The change in price durations for imports from that country is negligible, althoughthe frequency does increase a tiny bit right after the depreciation.
The average probability of import price changes decreased by about 10 percentage points to22% in 2004. The decline is mostly concentrated in the 1990s and is across the board for all typesof goods and all countries of origin.
There are three reasons why exchange rate pass-through may be incomplete: (1) if firms havemarket power, they absorb part of an ER-driven cost increase by decreasing their markups; (2) ifmarginal costs are increasing, a price raise lowers MC, which lowers the desired price; (3) somefraction of a firm’s inputs may be imported from countries whose currencies aren’t affected bythe ER movement. The authors measure pass-through as the change in price in response to thecumulative change in the ER since the last price change (i.e., conditional on a price change).Specifically, they regress the price change on the cumulative ER change, the change in MC (proxiedby foreign CPI inflation) and controls (U.S. GDP and U.S. CPI inflation). They also include sectorand country fixed effects. The estimation is carried out on 20 different goods categories. Theaverage pass-through is 21%, and except for one, all sectors have pass-through below 33%. Whenthey sort goods into ten quantiles based on price stickiness, they find that more price-sticky goodsdisplay higher pass-through. This is because differentiated goods have high stickiness and also alower demand elasticity, making a large price adjustment more attractive for firms, conditional on
61

adjustment.
10 Open Economy Models with Nominal Rigidity
10.1 Chari, Kehoe and McGrattan (2002): “Can Sticky Price Models GenerateVolatile and Persistent Real Exchange Rates?”
Summary Develops two-country OE model with complete markets, LCP, monetary shocks andnominal rigidity via staggered price setting a la Taylor. The main objective is to explain thevolatility and persistence of the RER. The benchmark parameterization has separability of C andleisure in the utility fuction and relatively high risk aversion. Through the Backus-Smith equation,the volatility and persistence (first-order autocorrelation) of the RER increases with the CRRAfor a given volatility and persistence of C. It is found that the benchmark parameterization canfit the volatility of the RER but the persistence is too small, the persistence anomaly. Due tothe B-S relation, the model’s RER is highly positively correlated with relative consumption, whichgoes against the data, the consumption-RER anomaly. A number of fixes to these anomalies areattempted. Non-separability in C and L in the utility function (a C-D-type specification) makesthe persistence anomaly worse. Adding shocks to productivity and government purchases doesnot do much quantitatively. Adding nominal wage stickiness through monopolistic unions andTaylor-type contracting generates a bit more persistence but not enough. Making asset marketsincomplete by restricting the menu of assets to an uncontingent nominal bond does not make aquantitative difference. Finally, adding habit persistence in consumption would in principle help,but simple calculations suggest that it doesn’t do nearly enough.
Empirics The authors use quarterly data on bilateral exchange rates between the U.S. andindividual European countries as well as their aggregate. Both the nominal and real ERs are veryvolatile (more than 4 times more volatile than output) and they are almost perfectly correlated.The relative price ratio is quite smooth. A decomposition a la Engel (1999) indicates that therelative price of traded goods accounts for almost all the variation in the RER, whereas the relativeprice of nontradables to tradables contributes insignificantly. Hence, the authors abstract fromnontradables in their model.
Model Two countries, complete markets. In each country, a nontraded final good is producedby competitive producers. Intermediate goods producers are monopolistically competitive and canprice-discriminate across countries but must set prices in the local currency. Prices are fixed for Nperiods (see below).
The state of the world is st and the full history of shocks is denoted st = (s0, . . . , st). Thecommodities are L, a C/K good, money, a continuum of intermediate goods indexed by i ∈ [0, 1]in each country, and final goods. Final goods are produced using the aggregator
y(st) =
[a1
(∫ 1
0yH(i, st)θdi
)ρ/θ+ a2
(∫ 1
0yF (i, st)θdi
)ρ/θ]1/ρ
,
where yH and yF are intermediate goods from Home and Foreign, resp. The parameter θ willdetermine the markup, ρ (and θ) determine the elasticity of substitution between Home and Foreign
62

goods, while a1 and a2 (and ρ, θ) will determine the import shares. Final goods producers arecompetitive and maximize profits
maxP (st)y(st)−∫ 1
0PH(i, st−1)yH(i, st)di−
∫ 1
0PF (i, st−1)yF (i, st)di
subject to the production function. The prices of intermediate goods can only depend on st−1
because intermediate goods producers set prices before observing the shock. The FOCs lead todemand functions for Home and Foreign intermediate goods. The zero-profit condition determinesthe price P (st) of the final good in terms of the prices of intermediate goods; since the latter onlydepend on st−1, so does P in equilibrium.
The technology for producing intermediate goods is
yH(i, st) + y∗H(i, st) = F (k(i, st−1), l(i, st)),
where F exhibits CRS. Investment is denoted x(i, st). There are convex adjustment costs of capital.Intermediate goods producers set prices for N periods in a staggered way: a (deterministicallydetermined) fraction 1/N get to reset every period. They choose prices PH(i, st−1) and P ∗H(i, st−1),L, K and I to maximize profits given the common SDF Q.
Contingent, one-period nominal bonds denominated in the Home currency are traded. Residentsof each country own that country’s firms. Consumers choose their allocations after observing theshock st. They face the budget constraint
P (st)c(st) +M(st) +∑st+1
Q(st+1|st)B(st+1) ≤ P (st)w(st)l(st) +M(st−1) +B(st) + Π(st) + T (st),
where Π are profits and T transfers of home currency from the monetary authority. They are alsosubject to a lower bound on borrowing to rule out Ponzi schemes. The utility function depends onc, l and real money balances M/P . The labor-leisure, RMB and bond FOCs are
−Ul,tUc,t
= wt,
Um,tPt− Uc,t
Pt+ β
∑st+1
π(st+1|st)Uc,t+1
Pt+1= 0,
Q(st|st−1) = βπ(st|st−1)Uc,tUc,t−1
Pt−1
Pt.
Similar expressions hold for Foreign. The bond Euler equations for Home and Foreign may beiterated back to time 0 and combined to yield
Uc,tUc,0
P0
Pt=U∗c,tU∗c,0
e0
et
P ∗0P ∗t
,
which yields the B-S condition
qt ≡ etP ∗tPt
= κU∗c,tUc,t
. (5)
63

The money supply process for Home is M(st) = µ(st)M(st−1), where µ is a Markov process. Newmoney balances are distributed lump sum to consumers, T (st) = M(st) −M(st−1). Similar forForeign.
The resource constraint and labor market clearing condition in Home require
y(st) = c(st) +
∫ 1
0x(i, st)di, l(st) =
∫l(i, st)di.
Market clearing for bonds requires B(st) +B∗(st) = 0.To solve the model, all nominal variables are deflated by the price level. The equations are then
log-linearized.In terms of calibration, the utility function is picked to be
U(c, l,M/P ) =1
1− σ
[ωc(η−1)/η + (1− ω)(M/P )(η−1)/η
](1−σ)η/(η−1)+ ψ
(1− l)1−γ
1− γ.
It is therefore separable in C and L. The production function is F (k, l) = kαl1−α. They set σ = 5and γ = σ to get balanced growth. The FOC for RMB can be shown to imply a standard moneydemand function that the authors estimate from the data to calibrate parameters. The elasticitybetween Home and Foreign goods is 1/(1− ρ), which is calibrated to 1.5. They pick θ = 0.9, whichgives 11% markup in s.s. They set N = 4 so prices are fixed for a year. The growth rate of themoney stock follows an AR(1) in logs. It is estimated from U.S. data (for both countries). Thestandard deviation of shocks is chosen to match the output volatility in the data.
Simulations The benchmark model generates nominal and real ERs that are volatile, persistentand highly cross-correlated. However, the persistence and cross-correlation is still too small tomatch the data. RERs and relative C are highly positively correlated. The price ratio is toovolatile and I isn’t volatile enough.
To understand the relationships, the authors log-linearize the B-S condition (5) to obtain
q = A(c− c∗) +B(m− m∗) +D(l − l∗), (6)
where
A = −cUccUc
, B = −mUcmUc
, D = − lUclUc
,
all evaluated at the s.s. Quantitatively, A ≈ σ = 5 (the only reason it’s not exactly σ is due tononseparability between C and RMB), B ≈ 0 and D = 0 (separability). Thus,
std(q)
std(y)≈ σ std(c− c∗)
std(y), corr(q, q−1) ≈ corr(c− c∗, c−1 − c∗−1).
Numerical experiments show that a σ of about 5 is needed to get the right relative volatility ofthe RER. Because C isn’t very persistent in the model (in particular, less persistent than in thedata), the RER in the model doesn’t achieve sufficient persistence. Persistence increases as pricestickiness N increases, but an unrealistic increase is necessary to match the data.
I is not volatile enough in the model, because a relatively high adjustment cost is needed tomake C volatile. L is more volatile in the model than in the data because almost all the volatilityin Y has to come from changes in L (since K moves sluggishly and there are no technology shocks).The cross-country correlations of Y and C are the same in the model, while in the data the Y oneis highest. Finally, NX are acyclical in the model but somewhat countercyclical in the data.
64

Extensions The model is extended in various ways to try to fix the anomalies. First, another C-D-type preference specification is attempted, so that there is complete nonseparability of C, RMBand L. This generates less volatility in the RER. The reason is that under such a specification (andσ > 1), we have Ucl > 0, so when a monetary shock raises C and L, Uc doesn’t decrease as much asit would if Ucl = 0, so movements in L offset movements in C, and the RER (which is a ratio of Uc)stays relatively constant. In terms of relation (6), D is now negative and quantitatively significant.
The authors instead add two additional shocks. One is a country-specific technology processwhose log follows an AR(1). The other is a shock to government purchases gt that now enter intothe economy-wide resource constraint. It also follows an AR(1) in logs. The AR(1)’s are estimatedfrom the data. The quantitative results are not very different from the benchmark case, exceptthat relative L volatility actually increases a bit (due to technology shocks).
If the money growth rate rule is replaced with a Taylor interest rate rule, the endogenous policyreaction tends to offset exogenous shocks so much that C, and thus the RER, is too smooth.
The authors try introducing a labor market friction through sticky wages. Consumers arenow assumed to belong to one of a continuum of unions that each supply a differentiated laborgood. Intermediate goods firms produce using a Dixit-Stiglitz composite of all the domestic laborgoods. They choose the cost-minimizing composition of different types of labor. A fraction 1/M ofunions set their wages each period, and the wage is set for M periods at a time. The consumers’labor-leisure condition is then replaced by an optimality condition for nominal wages. The authorscalibrate M = 4. The model improves a bit on the benchmark due to the additional friction butmore is needed.
Two approaches to dealing with the C-RER anomaly are attempted. First, the set of assets isrestricted to only non-contingent one-period bonds. The B-S condition is then replaced with
Et[qt+1 − qt] = Et[(U∗c,t+1 − Uc,t+1)− (U∗c,t − Uc,t)].
The quantitative effect of moving to incomplete markets is tiny, however.The second approach is to add habit persistence in C by replacing ct in the utility function with
ct − dct−1, where ct−1 is last period’s aggregate consumption. Then condition (6) becomes (withD = 0)
qt =A
1− d[(c− c∗)− d(ct−1 − c∗t−1)] +B(m− m∗).
The authors use data for the U.S. and Europe to compute the correlation between the RHS andthe actual RER. d was varied between −1 and 1. The maximum attainable correlation was −0.19.Hence, it seems that habit persistence will not help in matching the data.
The authors call for more work on introducing asset market frictions to break the link betweenRERs and MUs.
10.2 Devereux and Engel (2003): “Monetary Policy in the Open EconomyRevisited: Price Setting and Exchange-Rate Flexibility”
Summary The traditional argument for the optimality of floating exchange rates relies cruciallyon firms setting prices in their domestic currencies, i.e., the assumption of PCP. Under PCP (andnominal rigidities), following a bad real shock to Home, the ensuing depreciation of its currencyleads to expenditure switching towards Home’s goods, which mitigates the adverse effect of theoriginal shock. However, if instead export prices are set in local currency (LCP), the NER has
65

no effect on relative goods prices while the stickiness lasts. Thus, expenditure switching plays norole. The authors develop a simple two-country, stochastic, complete markets model that can besolved (almost) analytically. Prices are set in each period before the realization of shocks. Thegovernments in each country choose the money supply to maximize welfare for domestic consumers.Under PCP, governments are able to replicate the first-best flexible price solution by influencingthe NER to generate sufficient relative price movements and thus expenditure switching. UnderLCP, governments are unable to generate relative price movements; the optimum features perfectrisk-sharing but lower expected consumption due to the inefficient price movements. The optimalpolicies turn out to be invariant to whether a Nash solution concept is employed or whether countriesact cooperatively.
Motivation PCP has been the usual assumption in OE macro. There is a well-established factthat an appreciation of a country’s NER tends to be associated with an improvement in the ToT.Keynesian reasoning suggests this is consistent with PCP but not LCP (Obstfeld and Rogoff, 2000):The ToT is given by
ToT =SP ∗HPF
,
where S is the NER in Home currency per Foreign currency, P ∗H is the Foreign currency price ofHome exports and PF is the Home currency price of Home imports. Suppose S drops, i.e., the Homecurrency appreciates. If there is PCP and price stickiness, then SP ∗H and PF /S are constant in theshort run, so ToT increases one-for-one with the drop in S, i.e., the ToT improve (and Foreignexperiences a favorable expenditure switching as their export goods become relatively cheaper).However, under LCP, P ∗H and PF are both fixed in the short run, so the ToT deteriorate.
Devereux, Engel and Tille (2003) has shown that this conclusion can be circumvented by intro-ducing importing intermediaries who set prices in local currencies.
Model set-up Two countries, monopolistic firms, shocks to velocity (which multiplies utilityderived from real money balances) and production technology. Producers set prices each periodbut before the realization of the shocks. They maximize profits using the consumers’ commonSDF. Consumers are infinitely lived and have utility that’s separable in C, RMB and L. Marketsare complete and pay off in currencies, not goods (otherwise the distinction between PCP and LCPwould be inconsequential, as households could circumvent international price discrimination). Thegovernment supplies households with direct transfers of money. The production function is linearin L. Velocity and TFP follow RWs with i.i.d. independent normal innovations.
The money demand function implied by the consumers’ preferences is not of a nice log-linearform, so it is log-linearized. This is the only approximation used in solving the model. Sinceall other relations are nicely multiplicative, logs can be taken and the log-normal distribution forvelocity and productivity may be used. Due to complete markets, the B-S condition holds.
Under PCP, firms choose a single price in their domestic currency. It is not just given by aconstant markup over unit costs, since there is an additional risk premium from the covariance ofprofits with consumption. The LOP holds.
Under LCP, the firm price discriminates between the Home and Foreign market.
Policy assumptions and model solution Under flexible prices, consumption is equalized acrosscountries and solely determined by Home and Foreign productivity shocks.
66

As for government policy, it is assumed that the government controls the money supply process,i.e., picks the innovation. This is done after having seen the current-period shocks. It is assumedthat the government only responds to unanticipated shocks so that shocks to the money supplyare also unanticipated. Apart from a time trend that is invariant to policy, the decision rules ofall agents are stationary due to the foregoing assumptions. Hence, the government can be thoughtof as maximizing the ex ante expected per-period utility. The simplifying assumption that thegovernment doesn’t care about the consumers’ utility derived from RMB is imposed. Only utilityfrom C and L is counted in the optimization. Finally, it is assumed that government can committo their policy in advance.
Under PCP, PPP holds, so consumption is equalized across countries according to the B-Scondition. The government’s objective function turns out to be quadratic, while the optimal policy(i.e., choice of money innovation) can be written as a linear function of the exogenous model shocks.Because Home and Foreign consumption is identical state by state, it doesn’t matter whether thepolicy game is construed as a Nash equilibrium or a cooperative solution. Proposition 1 says thatthe governments can and will implement the flexible price solution. Intuitively, there are threedepartures form efficiency in this model: sticky prices, monopolistic pricing and a departure fromthe Friedman rule of zero nominal interest rates. The second inefficiency can’t be affected bypolicy. The government is assumed not to care about the third one. Hence, policy solely focuses oneliminating the adverse effects of nominal rigidity. This is done by steering the money supply suchthat the NER causes an adjustment in the ToT that generates efficient expenditure switching.
Operationally, the Home government expands the money supply after a positive domestic pro-ductivity shock to make demand for goods meet supply (money demand has to rise so C rises); thisraises the Home price level, so through the LOP the NER depreciates. Optimal policy also respondsto Foreign productivity shocks, because after a positive shock to Foreign, the Foreign governmentgenerates a NER appreciation (from Home’s point of view), a fall in Home’s price level, an increasein RMB and thus a rise in Home consumption (there’s an additional effect through the nominalinterest rate’s effect on the demand for RMB); this must be counteracted by a reduction in Home’smoney supply. Finally, Home velocity shocks are perfectly accommodated to cancel their effect onthe NER (since the flexible price allocation is independent of velocity).
Under LCP, PPP does not hold. By assumption, the price level in each country is predeterminedin every period. There is no transmission of Foreign money supply or velocity innovations toHome consumption; in particular, the NER is not transmitted to the price level. However, bothHome and Foreign productivity shocks influence Home consumption through the nominal interestrate (determined by the contingent assets). Since consumption is not necessarily equated acrosscountries, the objective functions for the two governments differ. Proposition 2 shows that optimalpolicy in a Nash solution leaves the NER constant. This is because the ToT can’t be affected.Policy makers can influence welfare only by affecting the aggregate consumption indexes (i.e., theglobal demand for Home and for Foreign goods, respectively). In the flexible price equilibrium,aggregate consumption is a function of only world productivity shocks, and optimal policy underLCP replicates this. In particular, consumption is equalized across countries, which is ensured bykeeping the NER and thus the RER constant. However, relative consumption of Home and Foreignproduced goods can’t be kept at the first best and thus neither can employment. Due to the sub-optimal substitution between Home and Foreign goods, expected consumption is lower than underPCP.
It is also true under LCP that the cooperative solution is the same as the Nash solution. Here
67

the reason is that there is effectively no strategic element to government policy, as Foreign policydoesn’t influence the prices that Home faces.
10.3 Engel (2011): “Currency Misalignments and Optimal Monetary Policy: AReexamination”
Summary Previous theoretical studies of optimal monetary policy have either assumed thatthe LOP holds or that prices are only fixed one period, meaning that inflation can’t cause pricedispersion within countries. Engel seeks to evaluate the (cooperative) policy tradeoff betweeninflation, the output gap and currency misalignment (defined as the average deviation betweenprices paid by Foreign consumers compared to those paid by Home consumers for the same bundles).The latter can lead to inefficiencies even when inflation and the output gap are zero, since it impliesthat consumers in different countries don’t face the same prices and so allocations are inefficient. Afairly general two-country model with complete markets is developed, and it’s shown that a second-order approximation to welfare may be derived without assuming anything about how prices orwages are set. If the LOP does not hold, currency misalignment enters the welfare expression.The model is specialized to involve Calvo pricing with no cross-country price discrimination whenprices are initially set. There are exogenous shocks to markups so the inflation-output tradeoff isnontrivial. Under PCP, the LOP holds, and optimal policy trades off domestic price inflation andthe output gap, as in the closed economy. Under LCP, the LOP doesn’t hold, so optimal policytargets CPI inflation rather than domestic inflation. The NER no longer serves a useful allocativerole. Instead, policy influences relative final consumption in the two countries to target the currencymisalignment. Unlike under PCP, when the cost-push shock is eliminated, optimal policy isn’t ableto replicate the first-best flexible price solution due to the relative price distortions.
Model Two countries of equal size, a continuum of consumers in each. Goods producers aremonopolistically competitive. Each household supplies a unique type of labor to firms in its homecountry but are otherwise identical; hence, they set the same wage. Markets are complete.
Period utility is C1−σ/(1− σ)− 11+φN
1+φ. Here C is a consumption aggregate over Home andForeign goods bundles CH and CF with EoS ξ and home bias weight ν/(2 − ν), ν ∈ [0, 1]. Thelabor aggregate is N and wage W . Apart from wages, consumers each receive a share of aggregateprofits from Home firms. The production function is linear in labor input with productivity Atthat is stochastic and common across firms in a country. The labor aggregate is a Dixit-Stiglitzaggregator with stochastic EoS νt. A fraction τt of the wage is subsidized by the government (taxesare lump sum).
The ToT are defined as St = PFt/PHt, S∗t = P ∗Ht/P
∗Ft, where for example P ∗Ht is the Foreign-
currency price of goods exported from Home, while P ∗Ft is the Foreign-currency price of goodsproduced in Foreign for local consumption. The Backus-Smith condition (Ct/C
∗t )σ = EtP ∗t /Pt
holds, where Pt is the consumption price aggregate in Home.The model is log-linearized to derive approximate welfare. For some relations second-order
linearizations are necessary. Key quantities are
mt =1
2(et + p∗Ht − pHt + et + p∗Ft − pFt)
and
zt =1
2(pFt + p∗Ht − pHt − p∗Ft).
68

mt is called the currency misalignment and measures the average deviation of the price paid byForeign consumers relative to that paid by Home consumers (with a weight of 1/2 for each country’sbundle). zt measures the average relative price of exported goods to imported goods. Note that ifthe LOP holds, both mt = zt = 0, but otherwise neither of mt = 0 or zt = 0 implies the other.
The policy maker wishes to minimize the expected PDV of Xt, where Xt is the differencebetween the maximal achievable consumer utility without inefficiencies and the market-determinedutility. The loss function for cooperative policy makers is derived, i.e., the one relevant for worldwelfare. In general, it is a linear combination of (yRt )2 (the relative output gap), (yWt )2 (theworld/total output gap), m2
t , z2t , σ2
pH t(the cross-sectional variance of pH), σ2
p∗H t, σ2
pF tand σ2
p∗F t.
The dispersion of prices enters because it affects the allocation of labor. Note that if the LOPholds (e.g., pHt(f) = p∗Ht(f) + et for every firm f), then σ2
pH t= σ2
p∗H tbecause et doesn’t vary
cross-sectionally, and mt = zt = 0, so the welfare function simplifies. For the same reason, underPCP (and LOP) price dispersion can be eliminated simply by eliminating producer price dispersion.Under LCP (and not LOP), all four kinds of price dispersion enter separately.
mt and zt enter into the welfare function in the general case because they measure the extentto which consumers in the two countries face different prices for the same goods. Any such pricedisparity results in inefficient allocations because private tradeoffs aren’t perfectly matched torelative marginal ratios of substitution (i.e., a social planner would allocate a good according tothe unique shadow price of the good in the aggregate resource constraint).
The author notes that to arrive at the welfare expression it was not necessary to assume anythingabout how prices or wages are set.
Optimal policy The model is now specialized so as to analyze optimal policy in a concreteframework. Wages are set flexibly by the households who exercise their monopoly power and setreal wages at a markup 1/(ηt− 1) over the labor wedge. The government sets a constant subsidy τthat would eliminate the distortions from monopolistic behavior in the non-stochastic steady state.
Under PCP, firms reset prices with Calvo probability 1 − θ. When they do, they set a singleprice in their own currency and the LOP holds. Engel derives the resulting NKPCs for Home andForeign producer price inflation πHt and π∗Ft.
Under LCP, firms still reset with Calvo probability 1− θ, but when they do, they choose botha local price in Home currency and an export price in Foreign currency. The Home-currency valueof the export price is then subject to NER fluctuations until the next time prices are reset. Engelderives four NKPCs for each of the consumption bundles. Due to the symmetry of the model (andthe assumption of no trade barriers), relative prices pFt − pHt and p∗Ft − p∗Ht in Home and Foreignare always equal, even though the LOP doesn’t hold. Hence zt = 0, and also πFt−πHt = π∗Ft−π∗Ht.
The world government chooses nominal interest rates in the two countries, but we can thinkof it as choosing inflation and output subject to the NKPCs. Optimal policies with and withoutcommitment are analyzed, but the main conclusions of the paper are the same regardless of thecredibility of policy.
Optimal policy depends on the price-setting regime.
• PCP. As in Galı and Monacelli (2005), optimal policy linearly trades off domestic (producer)inflation and the domestic output gap. The relative weight is given by the EoS among goodsproduced in the country (the higher the EoS, the higher the weight on inflation). Home biasin preferences plays no role. The NER plays a large role as it makes up for the stickiness inproducer prices. Thus, it is actually beneficial to generate movements in the non-domestic
69

component of CPI inflation (import prices) to influence relative consumption of differentbundles.
If there are no markup (cost-push) shocks, policy can implement the first-best flexible priceoutcome thanks to NER flexibility.
• LCP. As noted above, we have zt = 0 in the model. The author makes the simplifyingassumption that φ = 0 (linear disutility of labor). This makes the evolution of the ToT stindependent of policy and each period’s choice of output level does not constrain the choicesfor subsequent periods (MC are constant). Setting φ = 0 does not limit the comparability tothe PCP case, as φ doesn’t enter into the optimal policy rule under that assumption.
When φ = 0, policy can’t influence internal relative prices as the NER doesn’t affect them(if φ 6= 0, policy could affect firms’ MC and thus prices). Because the LOP doesn’t hold,there is currency misalignment, which can be influenced somewhat by steering relative totalconsumption ct − c∗t . However, relative consumption of bundles from different countries, i.e.,cH − cF and cH − c∗H can’t be influenced by policy. This remains true even if there are nomarkup shocks and only productivity shocks, so policy can’t achieve the efficient outcomein this case; although the world output gap can be set to zero (and the RER to its efficientlevel), the country-specific output gaps can’t.
In the LCP case, optimal policy rules involve CPI inflation rather than just domestic inflation.If the LOP held, price dispersion could be eliminated by only controlling domestic inflation,but this isn’t the case under LCP. Engel’s equation (42) shows that optimal policy underLCP can be thought of as trading off relative CPI inflation with inefficiencies in the changeof the RER.
Finally, impulse responses are simulated for a calibrated version of the model without markupshocks. Under LCP, the ToT respond much more sluggishly to a productivity shock than underthe first best. Because the right relative price movements aren’t generated, output does not rise asmuch as potential and the output gap drops. The NER is less volatile under LCP than under PCP.Because optimal policy stabilizes CPI inflation fully under LCP (there are no cost-push shocks),the NER is perfectly correlated with the RER.
10.4 Farhi, Gopinath and Itskhoki (2011): “Fiscal Devaluations”
Summary It’s possible to replicate the real effects of a NER depreciation using revenue-neutraltax policy while holding the NER fixed, a so-called fiscal devaluation. While certain details ofimplementation vary depending on whether the devaluation is expected or not and on the com-pleteness of asset markets, the policy recommendations are robust to the nature of price settingand other model details.
Two types of revenue-neutral fiscal policies can replicate the effects of a NER depreciation.Consider PCP. First, the government can impose an export subsidy and an equally sized importtariff, as this will have the desired effect on international after-tax export prices and thus the ToT.Second, the government can move the ToT by increasing the VAT (which is border-adjusted, i.e.,rebated to exporters and levied on importers), while imposing a payroll subsidy so as to not distortlabor demand. If markets are complete, international risk-sharing is affected by the RER. Anykind of devaluation works by making Home exports cheaper relative to Foreign exports. However,under the two above-mentioned fiscal policies, this is achieved by making Home consumption more
70

expensive by taxing imports, whereas under a NER depreciation, Home produced goods are maderelatively cheaper. The response in the RER is therefore different (it appreciates under a fiscaldevaluation), and to cancel the risk-sharing effects of this out, a consumption tax is needed.
Another effect of a NER depreciation is that the Foreign-currency value of Home-currencydenominated debt is depleted. To replicate this without a NER depreciation, the Home governmentmust partially default on its debt. All of the fiscal policies discussed require appropriate responsesin the money stock. This can’t be achieved in a currency union. Instead, fiscal devaluations canbe achieved by having the union central bank transfer seignorage to regional governments.
The conclusions of the paper are illustrated both in a simple static model and a full-fledgedNK model. The dynamic framework introduces a few more complications. If the devaluationis anticipated, interest rates will behave differently than if the devaluation is not anticipated, sorequired responses in the money supply differ. Under the tariff policy, it’s necessary to introduce atax on dividends because a time-varying consumption tax affects price setting through the SDF.
Static model The basic insights are demonstrated with a one-period model with two countries,Home and Foreign. Foreign follows a passive policy without taxation and fixed money M∗. Thereare two goods, one produced in each country. The utility of the Home representative consumer is
U =1
1− σC1−σ − κ
1 + ϕN1+ϕ.
The consumption aggregator is C-D with a share γ for domestic goods. This allows for home bias.Due to constant consumption shares, market clearing can be written
Y = γPC
PH+ (1− γ)
P ∗C∗
P ∗H,
and similarly for Foreign production. Consumers are subject to the cash-in-advance constraint
PC
1 + ζc≤M,
where ζc is Home’s consumption subsidy. P is the price of C exclusive of the consumption tax.Home households face the budget constraint
PC
1 + ζc+M + T ≤ WN
1 + τn+
Π
1 + τd+Bp,
where τn is the labor-income tax, T is a lump sum tax and Bp are household NFA. The capital taxτd plays no role in the static analysis. Note that last period’s money holdings have been left outof the RHS due to the static nature of the model.
Home’s government constraint is
M + T + TR +Bg ≥ 0,
where Bg is the governments’ NFA and TR stands for all non-lump-sum fiscal revenue (see footnote10). Total NFA are B = Bp +Bg. International asset market clearing requires B +B∗ = 0.
Consider first the model with PCP. Wages and prices are partially sticky in the beginning ofthe period before productivity shocks and policies are realized. Wages are set according to
W = W θw
[µw
1 + τn
1 + ζcκPCσ
(Y
A
)ϕ]1−θw,
71

where θw indexes wage stickiness, W is the preset wage and the expression in the brackets is theflexible wage. Under PCP, the LOP holds, and producers set the domestic currency price
PH = PθpH
[µp
1− ζp
1− τvW
A
]1−θp,
which is inclusive of the VAT. Here PH is the preset price and the expression in the brackets theflexible price. ζp and τv are the payroll subsidy and VAT, resp.
Exports are subsidized at rate ζx and imports are subject to a tariff τm. The VAT is reimbursedat the border for exports but levied on importers (VAT with border adjustment). Thus,
P ∗H = PH1
E1− τv
1 + ζx, PF = P ∗FE
1 + τm
1− τv,
where E is the NER (Home currency per Foreign; an increase is a depreciation).The authors consider several degrees of openness of the capital account.
• Under balanced trade (financial autarky), P ∗C∗ = P ∗HC∗H . Along with market clearing and the
CIA constraint, this implies E ∝M/M∗, where the constant of proportionality is determinedby tax rates alone.
• Under complete markets, the Backus-Smith condition λ−1(C/C∗)σ = Q ≡ P ∗E/P (1 + ζc)holds. Here Q is the CPI-based RER. The authors normalize λ = 1. Using the CIA constraint,E = (M/M∗)Q(σ−1)/σ.
• Under arbitrary portfolios, we write B = Bh+Bf∗E , where Bh are Home-currency assets andBf∗ Foreign-currency ones. The expression for the NER is more complicated in this case, cf.their equation (14).
A nominal devaluation of size δ is the outcome of an increase in the Home money supply so that∆E/E = δ without a change in taxes. A fiscal devaluation of size δ is a set of fiscal policies suchthat the allocation of C, L and Y is the same as under the nominal devaluation but while holdingE fixed.
Proposition 1 states that if trade is balanced or the country only holds foreign-currency NFA,a fiscal devaluation of size δ can be attained in one of two ways:
1. Via an export subsidy and import tariff: τm = ζx = δ, τ c = τn = ε, ∆M/M = (δ −ε)/(1 + ε).
2. Via a VAT increase and payroll subsidy: τv = ζp = δ/(1 + δ), τ c = τn = ε, ∆M/M =(δ − ε)/(1 + ε).
In both cases, ε can be chosen arbitrarily. The proof proceeds by showing that this choice of taxeshas the same effect on all equilibrium relations involving real variables as a change in E . Theintuition can be seen by considering the ToT
S =P ∗FP ∗H
=P ∗FPHE 1 + ζx
1− τv,
using the LOP. Evidently, given relative domestic prices P ∗F /PH , the required change in the ToTcan be generated with either an export subsidy or VAT. To make sure that PH and PF don’t
72

change more than required to, we must compensate with an import tariff (in the first policy) ora payroll subsidy (in the second policy). A consumption subsidy is not needed here but may beused, provided its effect on wages (through the labor wedge) is canceled out by an income tax. Ifit’s used, a smaller expansion of the money supply is needed (cf. the CIA constraint).
If markets are complete, there is an additional effect through the RER. Fiscal and nominal de-valuations make Home exports cheaper relative to Foreign exports. But nominal devaluations doesthis by making Home-produced goods cheaper, while fiscal devaluations makes Home consumptionmore expensive by taxing imports. Hence, the RER appreciates under a fiscal devaluation of thesort mentioned above, unless the consumption subsidy is used to decrease Home’s CPI P/(1 + ζc).Under perfect risk-sharing, a RER movement leads to a reallocation of consumption across coun-tries that doesn’t happen under a nominal depreciation. Hence, if markets are complete, theabove-mentioned two fiscal devaluation policies must be accompanied by ζc = τn = c (Proposition2). The money supply must be expanded or contracted appropriately.
Finally, if the country has NFA denominated in Home currency, a NER depreciation is accom-panied by a valuation effect, as the Foreign-currency value of the debt is depleted. This is a directtransfer of wealth across borders. To replicate this, a fiscal devaluation must be accompanied by apartial default on the debt, where the default fraction is given by the devaluation rate that wouldoccur under the nominal depreciation.
Under LCP, the results are the exact same. Now firms set prices for each of the two mar-kets. Nevertheless, the relevant wedges created by the various taxes are the same as under PCP.Proposition 4 shows that Proposition 1 and 2 apply to LCP as well. Importantly, this does notimply that the allocations attained by the devaluation (nominal or fiscal) are the same under PCPas LCP. For example, if prices are fully fixed in the short run, the ToT responds differently toa devaluation depending on the assumptions on currency of pricing (Obstfeld and Rogoff, 2000),leading to different behaviors of the real variables.
Proposition 5 shows that the suggested fiscal policies can be made revenue-neutral if ε = δ andthe dividend tax is set appropriately. Revenue neutrality here refers to the primary budget (TR),as seignorage may be affected to. Also, revenue neutrality is measured relative to the fiscal positionthe government would be in under a nominal devaluation.
Dynamic model The authors lay out a full-fledged two-country NK model with Calvo pricingand Calvo monopolistic wage setting. Real money balances m = M(1 + ζc)/P appear (separately)in the utility function, so money demand is interest-elastic. Markets are assumed complete withincountries. Production is linear in labor and subject to country-wide and idiosyncratic technologyshocks. Taxes may be time-varying. Now dividend (profit) taxes τdt matter.
A nominal devaluation is defined as a path for Et relative to the initial value E0. A fiscaldevaluation is one that achieves the same dynamic allocation in terms of C, L and Y but for whichEt ≡ E0. Many different nominal devaluations are possible, including anticipated and unanticipatedones.
Proposition 6 shows that under PCP and complete markets, a fiscal devaluation can be achievedwith the natural time generalization of the policies from the static case. Again, the proof showsthat the relevant equilibrium relations are satisfied by comparing to the situation with a changingNER. The appropriate money supply rule is simpler if the devaluation is not anticipated, becauseif it is anticipated, the interest rate differential will increase before the devaluation, which changesmoney demand.
73

Under the export subsidy and import tariff policy, it’s necessary to use dividend taxes. Thereason is that the time-varying consumption tax affects the dynamics of the SDF, which the firmsuse to set prices. Under the VAT and payroll subsidy policy, the effects on the SDF are exactlyoffset, so a dividend tax is not needed.
The authors consider a model in which international asset trade is restricted to an uncontingentrisk-free one-period bond. Now international risk-sharing only holds in expectation. Consequently,if the devaluation is unexpected, the risk-free bond does not help with sharing risk relative tofinancial autarky, and so the fiscal devaluation can be carried out with ζct = τnt = τdt = 0, just asin the static model.
The valuation effect on Home-currency denominated assets is analogous to the static model,and partial default is needed to replicate the nominal devaluation.
The authors also consider trade only in Home and Foreign equities (claims to profit streamsfrom the firms). A nominal devaluation leads to a negative valuation effect for Foreign holders ofHome equity and a positive valuation effect for Home holders of Foreign equity. The VAT-plus-payroll-subsidy effectively taxes Home firms. If a consumption subsidy for Home households isadded to the mix, the profit tax is undone by creating an effective subsidy on holding Foreignequity.
All results continue to hold under LCP. The authors also consider an extension with capitalinvestment. They introduce an investment tax credit, a tax on capital income and a subsidy onthe rental cost of capital. Firms rent capital from households. The production function is C-D incapital and labor. There is an additional FOC for investment. Consider the case of incompletemarkets and an unexpected devaluation. Under the export-import policy, the results from before gothrough. However, under the VAT-payroll policy, a subsidy on the rental rate of capital is needed,for the same reason that a payroll subsidy is needed: without that adjustment, firms would havean incentive to substitute from capital to labor. In the general case, since the consumption subsidyand labor income tax must be used even when there is no capital, the investment subsidy and taxon capital income must be used so as to not distort the investment decision of households.
The authors provide a numerical illustration of an optimal devaluation when the Home countryis hit by a negative productivity shock. The Foreign country is taken to be large so that all itsvariables remain fixed. It’s assumed that prices are flexible but wages are subject to the Calvofriction. There is only trade in a risk-free bond. The optimal devaluation (whether nominal orfiscal) replicates the flexible price outcome. Home prices jump on impact, and so do all othervariables since the shock is permanent. The authors then consider what happens if the NER andtaxes are held fixed. Two relative prices need to adjust: the real wage and the ToT. Only prices canjump at first, so the ToT appreciates too much and the real wage doesn’t adjust enough. Instead,nominal wages slowly converge to the new steady state, leading to depressed hours and a negativeoutput gap. The exaggerated initial ToT response leads first to trade deficits (a result of lostcompetitiveness) and then to surpluses.
Discussion The authors discuss several details concerning implementation. The standard tri-lemma of international macroeconomics says that a country can’t maintain an independent MP inan OE if the NER is fixed and capital can move freely. The results in this paper say that the lossof MP freedom does not restrict the range of real outcomes that can be achieved.
In general, the proposed fiscal devaluations require a change in Home money supply with nochange in Foreign money supply. This can’t be done directly in a currency union where member
74

states have surrendered their MP independence. Instead, the solution can be implemented byhaving the union CB increase the pan-union money supply Mt as the Home government wouldhave done, and then distribute all union seignorage ∆Mt to Home’s national government. Theauthors note that if the coefficient on the RMB term in the utility function goes to zero, therequisite seignorage transfers are very small.
10.5 Galı and Monacelli (2005): “Monetary Policy and Exchange Rate Volatil-ity in a Small Open Economy”
Summary Develop a model of an infinitesimally SOE. Prices are set in the producer’s currencyand subject to Calvo frictions. Markets are complete. Log-linearization of the equilibrium con-ditions lead to an NKPC and dynamic IS equation with the exact same reduced form as in theclosed economy, while the slope parameters depend on structural parameters relating to the degreeof trade openness and the elasticity of substitution between goods of different origin. Monetarypolicy is assumed to control the nominal interest rate. It is shown that in a special case of the modelwith log utility of consumption and unitary EoS between goods of different origins, optimal policyimplements the flexible price equilibrium (this is so because an employment subsidy is assumed tocancel the distortions from monopolistic markups and the ToT, leaving price dispersion as the onlyinefficiency). This requires keeping the output gap at zero and thus full stabilization of domesticgoods inflation (different from CPI inflation). In turn, this implies that the NER optimally is quitevolatile. A second-order approximation to consumer utility is employed to gauge the welfare lossfrom following Taylor rules or a NER peg. The latter policy is the worst, since it implies excesssmoothness of the NER and so insufficient domestic price stability. The Taylor rules perform some-what better but still generate excess smoothness of the NER, and slightly more so if the Taylorrule is formulated in terms of CPI inflation rather than domestic inflation.
Model There is a continuum of world economies that are identical except for their exposure toidiosyncratic productivity shocks. Utility is derived from a C Armington/Dixit-Stiglitz aggregateof Home CH and imported goods CF , with prices PH and PF . The home bias coefficient is 1− α,so α indexes the degree of trade openness. The foreign goods bundle is a D-S aggregate of bundlesfrom each foreign country.
Markets are complete so the SDF Q is common for all consumers. Due to the D-S aggregators,all demand functions are isoelastic, while the demand for Home and imported goods are alsomultiplied by (1− α) and α, resp. Period utility takes the form
U(C,L) =C1−σ
1− σ− N1+ϕ
1 + ϕ.
The effective terms of trade are St = PF,t/PH,t. Log-linearization of the CPI formula around thePPP condition PH = PF gives
pt = (1− α)pH,t + αpF,t = pH,t + αst.
This implies a relationshipπt = πH,t + α∆st
between CPI and domestic inflation.
75
The LOP holds for all goods at all times: Pi,t(j) = Ei,tP ii,t(j) (the LHS refers to the price ofcountry i’s good j in the domestic currency). This implies that
pF,t = et + p∗t ,
where et is the log nominal effective ER (summing over all countries) and p∗t is the log world priceindex. Then,
st = pF,t − pH,t = et + p∗t − pH,t.
The bilateral RER is Qi,t = Ei,tP it /Pt. The log effective RER is the sum over the logs of thebilateral ones. It is
qt = et + p∗t − pt = st + pH,t − pt = (1− α)st.
The Backus-Smith condition holds (the constant is assumed to be 1), so
ct = c∗t +1
σqt.
The home currency price of a riskless bond denominated in foreign currency is Ei,t(Rit)−1 =Et[Qt,t+1Ei,t+1], while the price of a domestic bond is (Rt)
−1 = Et[Qt,t+1]. We then get theuncovered interest parity condition
Et[Qt,t+1(Rt −Rit(Ei,t+1/Ei,t)] = 0,
orrt − r∗t = Et[∆et+1]
in log-linear form. Notice that this is not an additional equilibrium condition; it follows from theC Euler equation and risk sharing conditions.
Technology is linear in labor with productivity At that is common to all producers in a givencountry and evolves as an AR(1) in logs. Employment is subsidized at rate τ , so real MC (in termsof domestic prices) are
mct = −ν + wt − pH,t − at, ν = − log(1− τ).
Each period firms reset prices in their domestic currency with Calvo probability 1 − θ. As in theclosed economy, the log-linear reset pricing rule is
pH,t = µ+ (1− βθ)∞∑k=0
(βθ)kEt[mct+k + pH,t],
since the expression inside the expectation is nominal MC. µ is the log gross markup. This leadsto exactly the same NKPC as in the closed economy, when expressed in terms of MC and domesticgoods inflation, πH,t = βEtπH,t+1 + λmct.
Market clearing and the Backus-Smith condition imply various relationships between productionand consumption. Real MC is affected positively by world output and the ToT, since these impactdomestic consumption (through risk-sharing) and thus labor supply. Changes in the ToT also havea direct effect on the product wage W/PH for any given real wage W/P . The natural (flexible
76

price) level of output also depends on world output. It can be derived that domestic real MC isproportional to the output gap,
mct = (σα + ϕ)xt, σα ∝ σ.
This may be substituted into the MC NKPC to get an output gap specification whose slope dependson the OE parameters. Intuitively, if elasticities are relatively high, an increase in trade opennessα lowers the adjustment in the ToT that is necessary to absorb a given change in relative domesticoutput (i.e., to generate enough expenditure switching), which dampens the impact of the ToTadjustment on MC and inflation.
One can also substitute into the C Euler equation to obtain a dynamic IS equation. The naturalrate of interest depends on expected foreign output. Again, the OE parameters influence only thenatural rate of interest and the slope (the interest rate sensitivity). Intuitively, if the various EoSsare high, an increase in trade openness raises the sensitivity of demand to the ToT, and thus alsoto the nominal interest rate.
Optimal policy There are three distortions relevant for policy here: (1) price dispersion, (2)monopolistic pricing and (3) an incentive to manipulate the ToT to benefit the home country(due to sticky prices and imperfect substitutability of Home and Foreign goods). The employmentsubsidy can be chosen so as to eliminate the latter two.
The authors consider the special case in which σ = 1 and there is unitary EoS between bothHome and Foreign goods and between different bundles of foreign country bundles. This allowsthe equilibrium relations to be expressed exactly rather than as log-linearizations. The optimalallocation for a SOE, who takes world Y and C as given, must satisfy
−UN,tUC,t
= (1− α)CtNt.
The LHS is the MRS between leisure and consumption, and the RHS is the MPL for productionof the composite consumption good (uses market clearing and risk-sharing). Given the choice ofutility specification, C drops out and one can solve for an optimal constant level of labor. It isalso possible to substitute into the formula for flexible price MC, MC t = eµ, to show that for theright choice of τ , the above-mentioned optimal constant level of labor N does indeed generate theflexible price MC. This implies that in the optimum, the output gap is zero and so, by the NKPC,domestic inflation πH,t = 0 for all t. Thus, strict domestic inflation targeting (DIT) is optimal.This may be implemented by ensuring that the nominal interest rate equals the natural rate at alltimes. This, in turn, is ensured if, say, policy follows a Taylor rule that leads to determinacy.
Under DIT, real variables behave as in the flexible price equilibrium. In this case, an increasein world output generates a direct positive demand effect on Home goods as well as a windfall fromfinancial risk-sharing; however, the ToT appreciate as a result, generating expenditure switchingand risk-sharing effects. The natural exchange rate is et = st− p∗t , while the level of the CPI, giventhe constancy of domestic prices, is proportional to the ToT, with the proportionality being thedegree of openness, pt = αst. Hence, if the economy is very open and domestic productivity is notvery synchronized with world output, optimal policy is consistent with a highly volatile CPI index.
The authors derive a second-order approximation to welfare. Its expectation depends (nega-tively) on the variance of domestic inflation and the output gap. This welfare criterion is thenused to numerically evaluate three alternative monetary policy rules. The domestic inflation-based
77

Taylor rule (DITR) sets rt = ρ+ϕππH,t, the CPI inflation-based Taylor rule (CITR) is similar butwith CPI-inflation πt, and the exchange rate peg (PEG) sets et = 0. The calibration is standardand sets ϕπ = 1.5.
Consider a shock to domestic productivity. Under the optimal policy (the flexible price alloca-tion), this shock should lead to a transitory expansion in C and Y. To generate this response, thedomestic interest rate must be lowered. Due to the constant world interest rate, uncovered interestrate parity implies that the NER depreciates at first and is subsequently expected to appreciate.The ToT respond strongly initially since pH,t is constant.
The DITR generates a response that is qualitatively similar to the optimal policy, althoughthe movements in the ToT are slightly muted. This is even more so the case for CITR, since CPIstability requires a smaller movement in the ToT and in fact a fall in domestic prices. Finally,under the PEG, the currency can’t depreciate to support the expansion in C and Y. The responsein the ToT is very muted while inflation and the output gap are volatile. Hence, the NER and ToTexhibit excess smoothnes (consistent with Mussa, 1986), given that prices are sticky and so can’tprovide the adjustment themselves.
The authors finally note that due to PCP, they have implicitly assumed full NERPT.
11 Currency Unions
11.1 Chari and Kehoe (2007): “On the need for fiscal constraints in a monetaryunion”
Summary In a monetary union with benevolent national governments and a union CB that can’tcommit to its future policies, a time inconsistency problem arises for MP that leads to a free-riderproblem for fiscal policy. If debt levels are high, the union CB has an incentive to inflate, althoughthis is balanced against the resulting output losses. If national governments take on more debt,they can thus expect higher inflation going forward. However, each national government does notinternalize the cost of inflation imparted on the other union members. This free-rider problem leadsto excessive debt and inflation relative to the coordinated optimum. Hence, debt limits can raisewelfare in each country. However, if the union CB is able to commit to an inflation rate beforenational governments choose their debt levels, the problem goes away and debt limits can onlyweakly decrease welfare.
Model Two periods, 0 and 1. There are I identical, small countries that form a monetary unionwith a central MP authority. In period 0, countries start with price level p0 = 1. MP choosesthe common time-1 price level p1, leading to gross inflation π = p1/p0 = p1. In period 0, countryoutput is given by ω, while in period 1 it’s y(π), where y(·) is decreasing and convex. It’s assumedthat π ≥ 1 and ω is sufficiently small that the countries wish to borrow in period 0.6 Each countryi faces budget constraints
ci0 = ω + bi, p1ci1 = p1y(π)− xi,where xi is the nominal repayment on debt. A debt contract is denoted (bi, xi) with implicit grossreturn Ri = xi/bi. Note that we can write
ci1 = y(π)− xi/π.6If they were net creditors, the optimal gross inflation rate would be 0, as deflation would be beneficial both in
terms of output and in terms of the real value of debt.
78

The government of country i maximizes
U(ci0) + βU(ci1).
Governments borrow from risk neutral, competitive international lenders, who will agree to acontract (bi, xi) iff. −bi + βxi/π ≥ 0. The monetary authority maximizes an equally weightedaverage of the objective functions of all governments in the union.
Consider the case without commitment. The monetary authority moves last. Taking repay-ments x = (x1, . . . , xI) as given, it chooses π to solve
maxπ
1
I
I∑i=1
U(y(π)− xi/π).
The resulting MP rule is denoted π(x). In a non-cooperative equilibrium, national governmentschoose their debt simultaneously in order to maximize their individual objective functions,
maxbi,xi
U(ω + bi) + βU(y(π(x))− xi/π(x)),
subject to the lending constraint, and recognizing that their choice of xi influences π(x). In acooperative equilibrium, all countries go together to solve
maxb,x
1
I
I∑i=1
[U(ω + bi) + βU(y(π(x))− xi/π(x))].
Under both types of equilibria, the lending constraint will bind, so bi = βxi/π(x).The authors restrict attention to symmetric equilibria. Proposition 1 shows that welfare, as mea-
sured by average total utility, is larger in the cooperative equilibrium than in the non-cooperativeone. Because the non-cooperative solution is feasible in the cooperative optimization problem, allthat needs to be shown is that the FOCs for the two problems don’t coincide. Indeed, they don’t,as they differ by a term (once the monetary authority’s FOC has been substituted in)
(I − 1)y′(π)∂π
∂xi,
which is the inflation cost that a marginal unit of government i debt induces on the remainingcountries in the union.
Proposition 2 shows that at the cooperative outcome, each national government would individ-ually prefer to raise its debt level. Hence, if a debt limit b ≤ bC were imposed, where bC is theoptimal cooperative debt, then the cooperative outcome would be a non-cooperative equilibrium(at least each union member would be optimizing locally). The authors note that as the numberof countries I grows, the induced inflation cost rises, so the free-rider problem should be more ofan issue in a large union.
The model with commitment instead lets the monetary authority choose π first, and thennational governments choose debt levels. Working backwards, given an inflation rate π, non-cooperative governments will each maximize
maxbi,xi
U(ω + bi) + βU(y(π)− xi/π).
79

A cooperative union would maximize
maxb,x
1
I
I∑i=1
[U(ω + bi) + βU(y(π)− xi/π)].
But these two problems have the exact same solutions, since π is given and the union objectivefunction is the average of the individual objective functions with no strategic interactions betweenterms. Hence, the cooperative and non-cooperative equilibria coincide. It also then follows thatimposing debt limits will weakly reduce welfare.
11.2 Galı and Monacelli (2008): “Optimal monetary and fiscal policy in a cur-rency union”
Summary Lays out a NK model of a currency union with a continuum of small member countriessubject to imperfectly correlated shocks. There is no trade with outside countries. Prices are Calvo-staggered. There is room for fiscal policy decided by national governments as it yields utility toprivate households. There is home bias in consumption and markets are complete. The efficientallocation under flexible prices is compared with that under nominal rigidity, using a second-order approximation to union-wide household utility. Under flexible prices, the optimal allocationimplies that the bilateral ToT equal the ratio of TFP, which implies that the inflation differential(i.e., relative to unionwide inflation) is inversely proportional to the productivity growth differential(again relative to aggregate union productivity). An NKPC, featuring both the output gap andfiscal gap (i.e., relative to the flexible price allocation), is derived along with an expression forthe output gap differential. The utility approximation involves both inflation, the output gap andthe fiscal gap. Optimal coordinated policy under commitment involves fully stabilizing union-wideinflation and setting the aggregate output and fiscal gaps to zero. This in turn implies that optimalfiscal policy doesn’t set both the individual output and fiscal gaps to zero. Instead the authorsshow, partly through simulations, that the optimal policy mix requires using fiscal policy to smooththe adjustment of prices over time, leading to a positive fiscal gap and negative output gap followinga positive productivity shock.
Model The currency union is modeled as a closed system with a continuum of SOEs i ∈ [0, 1], eachinfinitesimally small so that they take foreign aggregates as given. Each country has a continuumof monopolistically competitive producers j ∈ [0, 1]. The LOP holds across all individual goods.
Households derive utility U(C,N,G) = (1−χ) logC+χ logG−N1+ϕ/(1+ϕ) from C, governmentpurchases and L. Cit is C-D consumption index with relative weight α on Foreign-produced goods.The bundle of Home-produced goods is a CES aggregate with EoS ε. The bundle of Foreign-produced goods is given by
CiF,t = exp
∫ 1
0cif,tdf,
where cif,t is the log of a CES aggregate of goods produced in country f , also with EoS ε. Becausethe economy is infinitesimally small, an α < 1 implies home bias in consumption. Hence, countrieshave different consumption baskets so CPI inflation differentials can emerge even when the LOPholds for each good.
Taxes are lump-sum and because households are infinitely lived, Ricardian equivalence holds.Households can trade a complete set of contingent claims. The common SDF is denoted Qt,t+1. The
80

gross nominal (unionwide) risk-free return is R∗t = 1/Et[Qt,t+1], which the union CB is assumed toset. Optimal allocations of expenditures are given by the usual isoelastic and C-D formulas. Theoptimal allocation of expenditures on imported goods by country of origin, implied by the form ofcif,t, is
P ft Cif,t = P ∗t C
iF,t,
where P ft is the price index for goods produced in country f and P ∗t is the union-wide price index.
The CPI for country i is P ic,t = (P it )1−α(P ∗t )α. The bilateral ToT are Sif,t = P ft /P
it , while the
effective ToT are Sit = P ∗t /Pit = exp
∫ 10 s
if,tdf . We have P ic,t = P it (Sit)α, so
πic,t = πit + α∆sit.
International risk-sharing (and symmetry) implies the Backus-Smith condition
Cit = Cft (Sif,t)1−α.
Public consumption Git is a CES aggregate over domestic goods with EoS ε. The government isassumed to allocate expenditures across goods so as to minimize total cost, which gives an isoelasticgovernment demand function for individual goods.
The technology is linear in labor, Y it (j) = AitN
it (j). Country-wide TFP follows an AR(1) in
logs with coefficient ρa. There is a constant employment subsidy τ i such that real MC (in terms ofdomestic goods) is
mcit = log(1− τ i) + wit − pit − ait,
and this must be common across firms due to the linear technology. The output aggregate Y it is a
CES aggregate of firm outputs with EoS ε.Firms reset prices with Calvo probability 1−θ. As usual, the optimal reset price is approximately
pit = µ+ (1− βθ)∞∑k=0
(βθ)kEt[mcit+k + pit+k],
where µ = log[(ε− 1)/ε] is the steady-state and flexible price log markup.
Results A log-linear approximation (around the symmetric steady state) to the market-clearingcondition for goods gives
yit = γgit + (1− γ)c∗t − (1− γ)(pit − p∗t ),
where c∗t is aggregate consumption (a proxy for the strength of union demand) and γ = G/Y isthe steady-state share of government purchases in GDP. By integrating the above over i and usingthe consumption Euler equation, it’s possible to derive the union-wide DIS equation:
y∗t = Et[y∗t+1]− (1− γ)(r∗t − Et[π∗t+1]− ρ)− γEt[∆g∗t+1],
where π∗t =∫ 1
0 πitdi. Hence, fluctuations in union-wide output are determined by variations in
current government purchases and expected real long-term interest rates.The PPI-based NKPC written in terms of real MC is exactly the same as in the closed economy.
Real MC can be written
mcit =
(1
1− γ+ ϕ
)yit −
1
1− γgit − (1 + ϕ)ait.
81

Given output, an increase in git either crowds out consumption or generates a real appreciation,both of which reduce the product wage (real wage, deflating by the price of the good) and thusreal MC. The elasticity of MC wrt. output is increasing in γ: For any given percent increase inoutput, and given government purchases, a larger γ is associated with a larger percentage increasein either consumption or the ToT. Both of these reduce the product wage and thus real MC. Usingthe above expression for real MC, it’s possible to derive a union-wide NKPC.
Suppose prices are flexible and consider the social planner’s problem. He sets the marginalutility loss of producing an extra unit of the composite good equal to the utility gain from each ofits three uses: (1) consumption by domestic households, (2) consumption by all households in theunion and (3) domestic government spending. The optimal allocation (denoted by bars) turns outto have N i
t = 1 andCit = (1− χ)(Ait)
1−α(A∗t )α,
where A∗t = exp∫ 1
0 aft df is aggregate productivity. This allocation can be decentralized as in Galı
and Monacelli (2005) by setting a constant employment subsidy to offset the markup distortion(note that the incentive to distort the ToT isn’t an issue here as only cooperative optima areconsidered). From the Backus-Smith condition, in the flexible price optimum, the ToT are givenby
Sit = (Cti/C∗t )1/(1−α) = Ait/A
∗t ,
so the inflation differential is inversely related to the productivity growth differential,
πit − π∗t = −(∆ait −∆a∗t ).
Now consider the case with nominal rigidities. Let tildes denote differences from the flexible priceallocation. Hence, yit is the output gap and f it the fiscal gap. It’s assumed that relative governmentconsumption in steady state is efficient, which means γ = χ. One can derive an NKPC
πit = βEt[πit+1] + λ(1 + ϕ)yit −
λχ
1− χf it , (7)
and an expression for the output gap differential,
∆yit −∆y∗t =χ
1− χ(∆f it −∆f∗t )− [(πit − π∗t )− (∆ait −∆a∗t )]. (8)
Suppose the unionwide gaps are zero. We see that closing the individual output and fiscal gapsis consistent with zero domestic inflation in the NKPC. But if domestic inflation is zero and pro-ductivity shocks are asymmetric, the second equation implies that closing the output gap whilekeeping the fiscal gap closed requires a ToT adjustment and thus a movement in prices (in Galıand Monacelli, 2005, the movement could come from the NER). There is then a tradeoff betweenstabilizing the gaps and domestic inflation.
If we integrate the above conditions across i, the ToT term disappears. Hence, zero unionwideinflation is consistent with zero unionwide output and fiscal gaps. The authors derive a second-orderapproximation to aggregate welfare; it features quadratic terms in domestic inflation and the twogaps. They then seek to characterize optimal coordinated policy. They set up the Lagrangian andoptimize with respect to inflation and the two gaps, both individual and unionwide. The constraintsare (7)–(8) and the expressions for the aggregate in terms of the individual decision variables. TheFOCs imply that the optimum has π∗t = y∗t = f∗t = 0, i.e., at the union level inflation and the two
82

gaps should be zero, which is implemented by setting the interest rate to the unionwide naturalinterest rate at all times (and using some Taylor rule off the equilibrium path). Under this optimalaggregate policy, equation (8) (in non-differenced form) simplifies to
yit −χ
1− χf it + pit = −ait,
under the normalization p∗t = 0. As the price level adjusts only gradually, positive productivityshocks are thus smoothed by a combination of positive fiscal gaps and negative output gaps. In-tuitively, the sluggish adjustment in prices and the ToT leads to too little demand switching overto Home-produced goods, leading to a negative output gap, which must be alleviated using fiscalpolicy. This is illustrated in a simulation with three different values of θ: 0, 0.4 and 0.75. Thelarger θ (the more price stickiness), the longer does the adjustment to a positive productivity shocktake. For θ = 0, the price level drops instantaneously and the output and fiscal gaps remain closedas the ToT depreciate efficiently. For θ > 0, the above-mentioned mix of fiscal policy and outputbelow potential are used to smooth the slow transition to the new efficient allocation.
Galı and Monacelli mention that their model leaves out wage stickiness, distortionary taxation,non-Ricardian behavior of households and incompleteness of markets. If markets weren’t complete,optimal policy would presumably involve a complementary role for fiscal policy as a tool for cross-country insurance.
11.3 Mundell (1961): “A Theory of Optimum Currency Areas”
Summary Proponents of flexible exchange rates say that its equilibrating function on the termsof trade can alleviate unemployment problems in deficit countries and inflation in surplus countries.However, flexibility of price adjustment is needed primarily across areas where factor inputs are im-mobile, not between those where capital and labor can move freely. Mundell defines an area withinwhich factor inputs are mobile, but whose borders limit factor mobility, as a region and arguesthat, in a world with flexible exchange rates, the optimal currency area is a region, not a nation.In practice, an upper limit on the optimal number of currency areas is placed by requirements thatcurrency should serve a useful function as a unit of account and medium of exchange, not be tooprone to speculation, and imports must be a sufficiently small part of the region’s expenditures toreasonably allow the kind of money illusion in wage bargaining necessary for the flexible exchangerate argument to work.
Theory The discussion on flexible ERs can be split into two questions. First, one must askwhether a system of flexible ERs can work efficiently. This requires (1) robustness to speculation,(2) that required ER changes are not too violent, (3) risks can be covered in forward markets, (4)CBs will refrain from monopolistic speculation, (5) monetary discipline will be maintained by thethreat of adverse effects from depreciation, (6) protection of debtors and creditors, and (7) thatwages and profits aren’t indexed to the price of imports. The main focus of this paper is the secondquestion, which is: What determines the size of an optimal currency area?
First Mundell lays out a distinction between (1) a currency area containing many nations withtheir own currencies but fixed ERs and (2) a currency area with a common currency and thus asingle central bank. In case (1), if there’s a shift of demand from country B to country A, and thesurplus country (A) isn’t willing to allow its price level to rise and so tightens credit conditions,the necessary adjustment is a decrease in B’s real income, which implies a rise in unemployment.
83

In case (2), the union CB must increase the money supply to fight the recessionary tendency in B,which exacerbates the inflationary tendency in A. In either case, it’s impossible to prevent bothunemployment and inflation among all members of the currency area.
In fact, adjustment by means of a flexible ER is only necessary between regions, as defined above:If factor inputs are freely mobile between localities, exchange rate flexibility is not necessary to bringabout the adjustment. Hence, the optimum currency area is the region.
This does not imply that the optimal number of currency areas is equal to every single minorpocket of unemployment arising from labor immobility. The above arguments deal only withstabilization concerns. However, the fewer currencies there are, the better do each of them servetheir functions as a unit of account and a medium of exchange. Currencies of small areas willtend to be more subject to speculation. Lastly, one of the mechanisms by which the NER bringsabout adjustment works through money illusion in wage bargaining; unions are supposed to caremore about nominal wages and the domestic price level than variations in the NER. But this is notrealistic if the currency area is so small that imports constitute a large share of total expenditures.
11.4 Santos Silva and Tenreyro (2010): “Currency Unions in Prospect andRetrospect”
Summary Summarizes the empirical evidence on the benefits and costs of joining a currencyunion. Particular emphasis is placed on the Eurozone. The literature has mostly found thatcurrency unions benefit the volume of trade within the union. The authors provide a new set ofdiff-in-diff result, comparing the trade statistics of EZ countries to similar countries outside of thezone. Graphically, while trade among EZ countries has increased since the creation of the euro, thisis also the case for these countries’ trade with non-EZ countries. Regression results confirm thatthe partial effect of the EZ dummy is insignificant and that it’s important to control for the factthat EZ countries traded a lot with each other before the creation of the euro. The literature hasfound positive effects of the euro on capital integration. While it’s hard to test, there’s no evidenceof improvements in diversification of risks. Inflation rate differentials have actually increased withthe adoption of the euro. There is some evidence that the euro has led to structural changes inlabor and product markets.
Benefits of currency unions Most studies that estimate the effect of currency unions on tradeuse a gravity model where the LHS variable is some measure of trade flows (uni- or bidirectional)and the explanatory variables are distance (both physical and other trade barriers), size of thecountries and a CU dummy. Typically, a multiplicative specification is used. Rose (2000) kickedoff the literature by finding a huge effect (200%) on bilateral trade. Many studies pointed outthe potential for endogeneity as CUs are not randomly formed due to cultural and historical links.Various matching, Heckman and IV approaches have been employed. Studies typically find positiveeffects, although the range is sizeable. For the EZ, estimates range from 2% to 70%.
The authors use trade data on the Euro-12 countries to provide another set of results. A diff-in-diff approach is used, using data on three groups of similar countries outside the EU-12. Thesample is 1993–2007. Figure 1 shows that trade among EU-12 countries has increased over time,but so has trade between EU-12 countries and the other countries in the sample. The authors runa gravity regression with an added dummy indicating whether a country pair is in the EU-12. TheEZ dummy then measures the partial effect of those countries joining the euro. The EU-12 dummy
84

is strongly significant, indicating that past trade ties are important. However, the EZ dummy isnot significant, so there’s no added effect of adopting the euro.
Another supposed benefit a CU is the scope for increased capital integration. Indeed, with theadoption of the euro, yield differentials dropped and cross-border bond and equity holdings as wellas FDI increased. As measured by consumption volatility and output growth, risk sharing hasnot improved, however. This may be due to (1) there being little scope for diversification as thecountries face symmetric shocks, or (2) the elimination of the NER margin has removed a usefulinsurance instrument.
Alesina and Barro (2002) argued that joining a common currency may eliminate the inflationarybias resulting from time inconsistency in MP. Fleming (1971) argued that low and stable inflationrates among member countries were a precondition for a successful CU, since this reduces volatiltityin the ToT and thus external imbalances. However, inflation differentials among EZ countries haveactually increased since its creation, with Germany on the low end and Ireland on the high. Thisis due to differences in productivity growth, changing competition and different exposure to shocksoutside the union, all affecting prices through the Balassa-Samuelson effect.
Costs of and criteria for currency unions The main cost of joining a CU is the loss of MPindependence. Mundell (1961) argued that OCAs should feature synchronized shocks so that thedirection of optimal stabilization policy is unambiguous. European countries have historically beensubject to less correlated shocks than U.S. states; however, in principle it is ex post shocks thatmatter. The literature has found that adoption of a CU increases the comovement of relativeprice shocks but decreases that of output shocks. This may be due to increased specialization,although the evidence is ambiguous. Mundell (1973), in somewhat of an about-face, instead arguedthat due to deeper capital markets integration, countries with asynchronous shocks make ideal CUpartners. Theoretical work (Ching and Devereux, 2003) has found that the diversification andcommon-stabilization-policy motives may cancel each other.
Mundell (1961) emphasized labor mobility as an important adjustment mechanism in a CU.Mobility among EZ countries has historically been lower than among U.S. states, and the mainequilibrating mechanism in Europe seems to have been labor-force participation. Alesina, Ardagnaand Galasso (2010) found that the euro’s creation has brought about subtle reforms, as a secondaryflexible labor market has emerged in many EZ countries and there seems to be less indexation ofwages to past inflation.
Kenen (1969) argued that industrially diversified countries would be better candidates for a CU,as this would lead to asymmetric effects of shocks. There does not seem to be significant differencesbetween industrial diversification in the U.S. and the EZ.
Friedman (1953) argued in favor of a flexible NER due to the existence of nominal rigidities.However, this rested on an assumption of PCP. When there is LCP and pricing-to-market, ERPTmay be low, so that NER flexibility is inconsequential for stabilization. Empirical studies by Engeland coauthors find low ERPT.
Finally, Kenen (1969) argued that fiscal transfers are essential to maintaining a CU. The authorsdo not summarize the empirical literature on this topic.
85

12 Exchange Rate Disconnect
12.1 Bachetta and van Wincoop (2006): “Can Information Heterogeneity Ex-plain the Exchange Rate Determination Puzzle?”
Summary Develop a noisy rational expectations model of exchange rate determination in whichinformation about the fundamental (relative money supplies) is symmetrically dispersed amongtraders. Traders face different idiosyncratic ER exposures on their non-asset income. These expo-sures are private information, so the ER has an aggregate hedging component that is unobservable.When the ER changes, private investors can’t tell whether this is driven by hedging or new infor-mation about the fundamental, so they rationally ascribe part of the change to the latter. Thismeans that effects of hedging trades on the ER are magnified (relative to the benchmark withidentically informed traders), leading to a disconnect from fundamentals. Because the ER will ingeneral depend on aggregate higher-order expectations, shocks to the unobservable hedging tradeslead to persistent effects on the ER. Eventually, information about the fundamentals will dissemi-nate to all investors through price discovery, so in the long run ERs and fundamentals are closelylinked. Finally, the authors are explicit about the mechanism by which prices clear markets: Limitorders are passively placed based on public information and are conditional on the ER; they arethen matched by market orders, which are the pure private component of asset demand and arenot conditional on the ER. These latter orders are seen as the active ones, so the order flow isdefined to be equal to market orders. The authors then show that the ER can be written as alinear combination of public information and order flow. Since the ER is very sensitive to privateinformation in the model, it is closely linked to order flow in the short run, as in the data.
Model Two countries, one good, PPP holds. There is a continuum of investors in each country.There are overlapping generations of investors that each live for two periods and make only oneinvestment decision; when they die, they bequeath their private information to their heir. Investorscan invest in four assets: money in their home country, nominal bonds of either country and atechnology with fixed real return (the latter just pins down the Home interest rate, for simplicity,as Home is assumed to be large and Foreign infinitesimally small). Each investor’s non-asset incomehas a stochastic exposure to the ER st (Home per Foreign currency) so that a hedging demandarises. The individual exposures are symmetrically dispersed around the aggregate mean, and it’sassumed that the variance of the dispersion term is so large that individual exposure provides nosignal about average exposure.
Under the assumptions of the model, money market equilibrium is given by
mt − pt = −αit, m∗t − p∗t = −αi∗t ,
while bond market equilibrium yields
Et[st+1]− st = it − i∗t + γσ2t bt.
Here Et denotes the cross-sectional average expectation, and the last term above (the deviation fromUIP) is the aggregate hedging demand, which is unobservable. Define the observable fundamentalft = mt −m∗t . Then one can shift the above equation forward and use money market equilibriumto get
st =1
1 + α
∞∑k=0
(α
1 + α
)kEkt [ft+k − αγσ2
t+kbt+k],
86

where higher-order expectations are given by Ekt [xt+k] = EtEt+1 . . . Et+k−1[xt+k].The information structure is as follows. At time t, each investor i receives a signal
vit = ft+T + εvit , εvit ∼ N (0, σ2v),
about the fundamental T periods ahead. Hence, the investor has private signals about future fun-damentals ft+1, . . . , ft+T , while the current and past fundamentals ft, ft−1, ft−2, . . . are commonknowledge. The MA(∞) process (not its realizations) for ft is common knowledge; let the innova-
tions be denoted εft . The ER at time t is conjectured to only depend on εft+T , εft+T−1, . . . as well
as innovations to aggregate hedging demand:
st = A(L)εft+T +B(L)εbt .
Because only the innovations εft+1, . . . , εft+T to ft are unknown, the investor solves a signal extraction
problem for a finite number of innovations. Having solved this signal extraction problem, theaverage expectation of st+1 can be computed and substituted back into the above equations. ThenA(L) and B(L) can be determined by solving a fixed point problem.
In recent years, ER trades have been carried out on organized exchanges in the form of auctions.Some investors place limit orders, which passively supply liquidity and are displayed to otherinvestors. These other investors may then submit market orders to execute a deal at the postedterms (and thus drain liquidity). This kind of market is called order driven and stands in contrastto a quote driven market in which market makers are in charge of posting single bid and ask prices.Bachetta and van Wincoop’s model is tied to the order driven market structure in the followingway. Limit orders are assumed to only depend on public information, but they can be conditionalon the ER at the time of deal execution. Market orders are defined as the pure private componentof asset demand, and they can’t be conditioned on the realized ER. The demand for foreign bonds
biF t = α1Ipt + α2st + α3I
it ,
where Ipt represents public information and Iit private, can therefore be split into a market ordercomponent α3I
it−E(α3I
it |I
pt ) and a limit order component, which is the residual. Because a market
order is the active side of the trade in this interpretation, the order flow ∆xt is taken to be theaggregate of individual market orders at time t. Note that if a shift in demand is due only to newpublic information, the order flow is zero but the ER will still change.
Because st−1 is part of Ipt , we can write
∆st = η1Ipt + η2∆xt
for appropriate constants. The two terms on the RHS are orthogonal by construction, so a regressionof changes in the ER on order flow leads to an unbiased estimate of η2. Causality runs from quantityto prices in this model, since order flow decisions are determined before the ER is known.
Results The authors first consider the simplest case T = 1 (investors receive one signal eachperiod about next period’s fundamental). The model may then be solved analytically. Onlyaverage first-order expectations matter in this situation since ft+1 is common knowledge at timet+1, so it doesn’t matter whether an investor thinks that he is differentially informed at time t. Theinvestor’s signal extraction problem can be solved analytically by first conjecturing a solution for
87

st. Relative to a benchmark model in which all investors receive the same signal, in the expressionfor st in the heterogeneous information case, the coefficient on aggregate hedging demand is larger(more negative) by a factor of z. This is because investors are rationally confused, as explainedunder “Summary.” Thus, when aggregate non-asset ER exposure bt changes, it affects st directlythrough the risk-premium channel but also through the indirect effect on Etft+1. The magnificationz depends non-monotonically on the private signal variance. It rises at first, since the precision ofthe private signal is reduced and so more weight is given to the ER signal. Eventually it declines,because larger variance means that there is less total information about next period’s fundamental,so the ER will depend less on Etft+1.
In the benchmark model where all investors receive the same signal, investors can perfectlydeduce bt from st since they know everyone else’s information set, i.e., the ER is fully revealing.The R2 from a regression of the ER on observed fundamentals is therefore higher in the common-information case than in the heterogeneous-information case (in which bt is unknown).
The authors solve for the order flow by identifying the private information component of theequilibrium demand for foreign bonds. The ER can then be written as a linear combination of ftand ∆xt. The more magnification z, the higher the weight on order flow. The order flow capturesthe extent to which the ER changes due to the aggregation of private information. Thus, the ER isclosely linked to order flow in the heterogeneous information model, while it is more closely linkedto the observed fundamental in the common information model.
The authors go on to numerically solve the model for T > 1. The higher T , the more persistentare the effects of even transitory shocks to bt, as investors only gradually realize that the changein the ER is not caused by an innovation in the fundamental. As learning proceeds over time,the impact of the initial shock bt dissipates. The model is calibrated numerically. The model isfound to be consistent with a large magnification z. In the short run, most of the variation in ERchanges is due to hedging demand, whereas long-run regressions of st+k − st on lags of observedfundamentals approaches 100%. The R2 of a regression of the ER on order flow is high at shorthorizons and grows even higher with time. This is not inconsistent with the observation that theER is closely linked with fundamentals in the long run, as order flow is the mechanism by whichinformation about said fundamentals is expressed over time. Evans and Lyons (2002) also foundsuch patterns in the data.
12.2 Engel, Mark and West (2008): “Exchange Rate Models Are Not as Badas You Think”
Summary Much has been made in the literature about the lack of forecasting power of ER modelsbased on fundamentals; in particular, Meese and Rogoff (1983) found that no model was able tobeat a simple RW model in terms of out-of-sample performance, even though realized fundamentalswere generously used to generate the macro model forecasts. Engel et al. review the theoreticaland empirical results from Engel and West (2005), which explain the poor short-term performanceof the macro models and provide evidence that they are not all bad. The authors emphasize thatpredictions from ER models depend crucially on whether MP is modeled as endogenous: If the CBfollows a Taylor rule, higher inflation leads to an appreciation due to expected policy tightening;this is not the case with passive money supply. The authors construct proxies for the PDVs usingsurvey expectations and find that these proxies can account for a non-negligible amount of the highER volatility. Finally, it’s shown that if ER models are estimated using panel data (as opposed tocountry-by-country), the long-run out-of-sample forecasting ability beats the RW model.
88

Theory Engel et al. provide an additional example of the theoretical result in Engel and West(2005). The model is a version of the Dornbusch (1976) overshooting model. Suppose that (10)holds with ρt = 0 (UIP), and that the fundamentals follow a random walk, i.e.,
∆[mt −m∗t − γ(yt − y∗t )− (vmt − v∗mt)] = ut,
where ut is i.i.d. As in Dornbusch, a mechanism for RER adjustment is derived using price stickiness.Assume that PPP holds in the long run, so pt−pt−1 eliminates part of the time-(t−1) PPP deviationst−1 + p∗t−1− pt−1. There is also a forward-looking trend term that is equal to the expected changein the market-clearing ER. Hence,
pt − pt−1 = θ(st−1 + p∗t−1 − pt−1) + Et−1st + p∗t − (st−1 + p∗t−1).
The analogous relation holds for the other country. The above equation implies that Et−1qt =(1− θ)qt−1. Substituting back into the PDV formula for st, one can get
st − st−1 = − θ
1 + αθqt−1 +
1 + αθ
αθut.
In response to a shock ut, the expected ER jumps more than one for one; this is the overshooting.Intuitively, the lack of adjustment in prices causes overadjustment in financial variables. Thevolatility is greater, the stickier prices are (the smaller θ is). It is also seen that the Engel-WestRW theorem holds, because st − st−1 ≈ ut as b = α/(1 + α) → 1. The relation above can berewritten to isolate the RER and the R2 of a regression of qt on qt−1 can be calculated. For areasonable calibration, the R2 is tiny.
The authors also derive a formula for the ER where the interest rate is determined by a Taylorrule. Such models can have quite distinct implications. For example, if the coefficient on inflation inthe Taylor rule is greater than 1, an increase in inflation leads to an appreciation of the ER becausethe CB is expected to sufficiently tighten MP by raising it. In traditional money-demand models,an increase in expected inflation lowers the demand for money, which lowers the market-clearingit, thus causing a depreciation of the currency.
ER models have been criticized because they imply too little persistence in the RER for reason-able amounts of price stickiness. E.g., for the Dornbusch model above, the persistence of the RERequals the persistence of prices. However, Engel et al. note that other models are able to delinkprice persistence and RER persistence. This was pointed out by Benigno (2004). The authors giveanother example, using the framework in Galı and Monacelli (2005). In this model, the RER isproportional to the MP shock and the autocorrelation does not depend on price stickiness (exceptthat the afore-mentioned constant of proportionality is zero if prices are flexible). Intuitively, aftera positive MP shock, the firms that first get to adjust their prices only adjust upward moderatelydue to other firms being stuck at a lower price. This generates persistence.
The authors give an example (as in Campbell, 2001) that explains why forecasting power startslow but increases with the forecasting horizon. Suppose that the ER is given by
st = (1− b)xt + bρt + bEtst+1,
and observed fundamentals follow a RW xt − xt−1 = εt, while unobserved fundamentals follow anAR(1), ρt = αρt−1 + ut. The forward solution is
st = xt +b
1− bαρt,
89

which implies the k-period-ahead equilibrium correction model
st+k − st =k∑j=1
εt+j + (1− αk)zt +b
1− bα
k∑j=1
αk−jut+j , zt = xt − st ∝ ρt.
Note that if the model is correct, the econometrician observes zt. One can now calculate the R2 ofthe above population regression of st+k − st on zt. It may take on a hump-shaped pattern in k: Ask grows, the mean reversion in ρt makes it easier to forecast, but the variance of xt+k − xt growswithout bound and eventually dominates. This intuition suggests that long-term forecasts may dobetter than short-term ones.
Empirics Engel et al. replicate the Granger causality results found by Engel and West (2005).They also use VARs to generate measures of the PDV in various models of the ER and computehow much of the actual volatility in ER changes can be explained by changes in the PDV. Monetarymodels of the ER can account for a fairly large fraction of volatility, about 50%.
The authors review the literature on high-frequency event studies of ER movements. Thesestudies have generally found that when news about U.S. activity variables are released by statisticalbureaus, the ER moves in the direction implied by Taylor rule models (i.e., news that suggest anexpanding economy cause an appreciation).
The authors also construct the relevant PDVs using survey forecasts of inflation and outputfrom Consensus Forecasts. Surveys are conducted every six months and contain predictions for upto 10 years out. The change in the RER is regressed on changes in the expected PDV of inflationand of output. For most countries in the sample, the coefficients get the right sign.
Finally, the authors estimate short-horizon predictive regressions using panel methods. Theliterature has mostly been using country-by-country regressions. The panel model is
si,t+k − sit = βk(xit − sit) + εi,t+k, εi,t+k = ζi + θt + uit.
As for the fundamentals xt, the authors use measures based on a monetary model m∗t −mit−γ(y∗t −y∗it), a PPP model p∗t −pit and a Taylor rule model (whose coefficients are simply postulated ratherthan estimated). 1- and 16-quarter-ahead out-of-sample forecasts are generated and compared tothose from a RW model. Relative forecast accuracy is measured by the ratio of root mean squareprediction error (RMSPE) relative to the RW model (called Theil’s U statistic). They calculatet-statistics from Clark and West (2006, 2007). None of the models do good at the 1-quarter horizon.At the 16-quarter horizon, the monetary and PPP models outperform the RW (with and withoutdrift) for most currencies in the sample. The Taylor rule model’s relative performance is moreambiguous. The authors conclude that the macro models perform well at the longer horizon, atleast if estimated using panel methods, and that the ER evidence is consistent with interest ratemovements being mainly driven by monetary factors.
12.3 Engel and West (2005): “Exchange Rates and Fundamentals”
Summary Meese and Rogoff (1983) showed that most fundamentals-based macro models of theNER don’t outperform a simple RW model out of sample. In most macro models, the ER is givenby a PDV of expected future fundamentals. Engel and West prove that, if the fundamentals areI(1), as the discount factor goes to 1, the NER will get close to behaving like a RW. This explains
90

the poor short-run performance of fundamentals-based models. However, PDV models imply thatthe reverse causation may still be at work: the ER should Granger cause future fundamentals. Thisdoes in fact hold up moderately well in quarterly data for bilateral G-7 exchange rates, althoughstatistical significance is achieved inconsistently across countries and measures of fundamentals.Nominal variables seem to be better predicted by the ER. Finally, the authors construct empiricalmeasures of the PDV implied by various measures of fundamentals, using VAR estimates of theexpectations. If only the particular fundamental variable’s own lags is used to generate expectations,the correlation between the generated PDV and the actual NER is negative. If the ER is alsoused in generating the VAR expectations, the correlation turns moderately positive. Unobservedfundamentals still seem to account for a large fraction of ER movements.
Theory Most macro models of the NER st (the log of the domestic currency price of foreigncurrency) can be written
st = (1− b)a′1xt + ba′2xt + bEtst+1,
where xt are fundamentals and b ∈ (0, 1). The no-bubbles forward solution is
st = (1− b)Et∞∑j=0
bja′1xt+j + bEt
∞∑j=0
bja′2xt+j . (9)
Suppose for simplicity that E∆xt = 0 and let ∆xt = θ(L)εt be the Wold decomposition of the firstdifferenced fundamentals. The authors’ theorem shows the following.
• If a2 = 0, then plimb→1[∆st − a′1θ(1)εt] = 0. Thus, ∆st will behave approximately like theunpredictable sequence a′1θ(1)εt as the discount factor approaches 1.
• If a1 = 0, then plimb→1[(1− b)∆st − ba′2θ(1)εt] = 0. Hence, the correlation of (1− b)st (andthus st) with time-(t− 1) information will be close to zero.
• More generally, we have plimb→1[(1− b)∆st − ((1− b)a1 + ba2)′θ(1)εt] = 0.
Hence, the ER will behave approximately like a RW for large b if one of these two conditions hold:(a) a′1xt is I(1) and a2 = 0, or (b) a′2xt is I(1) (a′1xt can be either stationary, I(1) or identicallyzero).
Intuitively, as long as one of the fundamentals is I(1), we can write st as a PDV of an I(1)component plus a PDV of stationary components. As b → 1, changes in the former will attaininfinite variance and thus dominate. Here’s a somewhat more precise explanation. Suppose firsta2 = 0 and a′1xt is I(1). We can Beveridge-Nelson decompose a′1xt = τt + µt, where τt is a RWand µt a stationary RV. As b→ 1, more weight is placed on expectations far into the future, so τtdominates variance-wise relative to µt. We then get
st ≈ (1− b)∞∑j=0
bjEt[τt+j ] = (1− b)∞∑j=0
bjτt = τt.
If instead a′2xt is I(1), the first PDV in expression (9) will dominate as b → 1, because the firstone is multiplied by (1− b). We can then use logic that is similar to the above to establish that stbehaves like a RW.
91

A model that fits into the above framework is the following. Suppose we have the moneydemand relation
mt = pt + γyt − αit + vmt,
(which holds similarly for the foreign country), the RER formula
st = pt − p∗t + qt
and the interest parity relationship
Etst+1 − st = it − i∗t + ρt,
where ρt measures deviations from UIP (e.g., a risk premium or expectational error). Then
st =1
1 + α[mt −m∗t − γ(yt − y∗t ) + qt − (vmt − v∗mt)− αρt] +
α
1 + αEtst+1. (10)
Here the discount factor is b = α/(1 +α). The literature has typically estimated α between 15 and60, so b is very close to 1.
Instead of the money demand equation, we can assume that Home and Foreign CBs followTaylor rules that put some weight on the bilateral NER’s deviation from some target. Then asimilar expression for the ER can be derived, with α replaced by the coefficient on the ER gap inthe Taylor rule.
The authors note that the efficient markets model of Samuelson (1965) does not predict arandom walk in ERs. Indeed, this model predicts that UIP holds with ρt = 0, so a populationregression of ∆st+1 on it− i∗t should give a coefficient on 1. Instead, Engel and West’s result statesthat the coefficient will get arbitrarily close to zero as b→ 1.
Empirics The authors have thus argued that a failure to beat a RW in short-term forecastingexercises is not damning for macro fundamental models. How then to test the theory? Because stis a PDV of expected future fundamentals, it should provide extra forecasting power for predictingthese fundamentals, as long as it contains some extra information above what is contained in lagsof the fundamental in question.
The authors use quarterly data on bilateral U.S. exchange rates with the other six G-7 coun-tries. Five measures of fundamentals ft are used: mt, pt, it, yt,mt − yt. They are each examinedseparately. First, it’s found that a Dickey-Fuller test can’t reject a unit root in any of the fivemeasures. Consistent with their theory, changes in the NER are essentially uncorrelated and veryvolatile. There does not appear to be cointegrating relations between the ER and the fundamentals,indicating that the unobserved fundamentals are I(1). The null of ∆st not causing ∆(ft − f∗t ) isrejected at the 10% level in 12 out of the 30 cases (six countries times five measures of ft). Thestrongest rejections pertain to prices. On the other hand, the null that the fundamentals don’tcause the ER can’t be rejected in 28 of the cases. There is therefore moderate evidence that ERshelp predict fundamentals, at least compared to the evidence of reverse causation.
Finally, the authors write
st =
∞∑j=0
bjEtft+j +
∞∑j=0
bjEtzt+j = Ft + Ut,
92

where Ft is the observed component and Ut the unobserved one. Two empirical proxies for Ft aregenerated:
F1t = E
∞∑j=0
bjEtft+j
∣∣∣∣ft, ft−1, . . .
, F2t = E
∞∑j=0
bjEtft+j
∣∣∣∣ft, st, ft−1, st−1, . . .
.
The former is computed using a univariate AR, while the second uses a bivariate VAR. Theytry different discount factors and different choices for the observed fundamental ft. Regardingunivariate results, ∆F1t is actually negatively correlated with ∆st. Regarding the bivariate results,the correlation between ∆F2t and ∆st is positive and around 0.1–0.25. Since the fundamentals areused one by one, it’s not surprising that the correlation isn’t close to 1, but there’s likely still alarge unexplained component to ERs.
12.4 Rogoff (2008): “Comment on ‘Exchange Rate Models Are Not as Bad asYou Think’”
Summary Rogoff doesn’t see it as controversial that ERs are forecastable at very short andvery long horizons. However, the big challenge is the 1 month to 1 year horizon, which is themost relevant for policy. Chen and Rogoff (2003) showed that so-called “commodity currencies”(e.g., Australia, New Zealand and Canada) are somewhat forecastable even at this horizon. Rogoffdoesn’t think that the RW theorem of Engel and West (2005) fully explains why macro models farepoorly out of sample. For example, if
st = (1− b)a′1xt + ba′2xt + bEtst+1,
and it − i∗t = Et∆st+1 + ρt, then
(1− b)(st − a′1xt) = bρt + b(it − i∗t ),
where a′2xt has been associated with the risk premium ρt. This type of equation for the ER wasconsidered by Meese and Rogoff without much success. But because expectations of future ERsare embodied in the observed interest rate spread, there is no concern about RW behavior of theER in the above model.
13 Forward Premium, Time-Varying Risk
13.1 Alvarez, Atkeson and Kehoe (2009): “Time-Varying Risk, Interest Rates,and Exchange Rates in General Equilibrium
Summary To explain the forward premium puzzle, it’s necessary to have the risk premium beeven more volatile than interest rate differentials and the NER must be expected to appreciatewhen the risk premium falls. Because aggregate consumption tends to be smooth in most models,representative agent models can’t generate enough variability in the risk premium. The authorsinstead develop a two-country, cash-in-advance model with flexible prices and endogenously limitedparticipation in asset markets. The model has a variable SDF despite aggregate C being almostconstant, since the SDF is determined by the marginal investor. MP changes the inflation rate,which increases the benefit of participation. As more households participate, the effect of a givenmoney injection on the active households’ MU is reduced, which causes a fall in the risk premium.
93

Intuition The only source of uncertainty is the money growth rate. Households face an idiosyn-cratic fixed cost of transferring resources between the asset and goods markets. Inactive HHs (whochoose not to pay the fixed cost) must consume their RMB, and so their consumption is decreasingin the money growth rate. As the money growth rate increases, more HHs pay their fixed costand become active. Active HHs trade in a complete set of contingent contracts and therefore allhave the same level of consumption. As their number increases, the social planner allocates moreresources to them, although the average (deadweight) fixed cost paid to participate also increases.Hence, the consumption of active HHs is increasing and concave in the money growth rate. Thisimplies that the MU of active HHs is more variable at lower money growth rates than higher ones.Because the SDF is determined by the MU of active HHs, this means that the ER risk premium isvariable and decreasing with the money growth rate.
To explain the FPP, it remains to be shown that an increase in the money growth rate causesan expected ER appreciation that is smaller than the fall in the risk premium. An increase in themoney growth rate increases the expected inflation rate, which c.p. would cause the NER to beexpected to depreciate, but the authors show that for not-too-large increases in the money growthrate, the RER appreciates enough to offset the expected inflation effect (in a model without limitedparticipation and flexible prices, the RER wouldn’t change).
Theory: FPP The risk premium pt is given by the difference between the Home currency returnon holding a Foreign bond minus the return of holding a Home bond:
pt = i∗t + Et∆et+1 − it,
where the ER exp(et) is in Home per Foreign units. If the ER follows a RW, Et∆et+1 is constant,and so all movements in the RP are movements in interest rate differentials, Var(pt) = Var(it− i∗t ).In the data, when one regresses ∆et+1 on (it − i∗t ) on U.S. data vis-a-vis other countries, theestimated regression coefficient is typically negative, so that the NER is not in fact quite a RW.However, this leads to the forward premium puzzle: Suppose
Cov(it − i∗t ,∆et+1) = Cov(it − i∗t , Et∆et+1) ≤ 0. (11)
By the expression for the RP, this implies
0 ≥ Cov(it − i∗t , pt + it − i∗t ) = Var(it − i∗t ) + Cov(it − i∗t , pt),
and so by C-S,
Var(it − i∗t ) ≤ |Cov(it − i∗t , pt)| ≤√
Var(it − i∗t )Var(pt)⇒ Var(pt) ≥ Var(it − i∗t ).
So the RP has to be even more variable than it would have to be if the ER were a RW. Similarly,(11) implies
Cov(Et∆et+1, pt) ≥ Var(∆et+1) > 0
and by C-S,Var(pt) ≥ Var(Et∆et+1),
so the ER is expected to appreciate when the RP falls, but the movement in the RP tends to belarger than the expected appreciation.
94

13.2 Bachetta and van Wincoop (2010): “Infrequent Portfolio Decisions: ASolution to the Forward Discount Puzzle”
Summary In the data, high-interest currencies tend to predictably appreciate over the next 5–10quarters before slowly depreciating (“delayed overshooting”), more or less reverting to UIP overthe long run. The authors develop a two-country GE model in which overlapping generations ofinvestors make one portfolio decision for the next T periods. In between decisions, the portfolioshares are passively rebalanced.
Consider a persistent, mean-reverting rise in the Foreign interest rate. Foreign bonds are moreattractive, so new investors have a higher demand for those. Over the next few periods, in equi-librium, new generations of investors keep buying Foreign bonds, while older investors (who earnhigher returns on their holdings of Foreign bonds) passively sell them to keep portfolio shares con-stant. However, investors correctly foresee that in the future, when the interest rate differentialis lower, the aggregate demand for Foreign bonds will shift inward, causing an expected futuredepreciation. This expected future depreciation will eventually outweigh the interest rate differ-ential. Thus, the delayed overshoot pattern emerges. The model has noise traders that createrealistic volatility and limited predictability. Due to the high risk, the cost of active management(calibrated to real-life fees) is sufficiently high that it is in fact optimal for investors to re-optimizetheir portfolio shares infrequently.
The authors consider an extension in which infrequently trading investors only base their de-cisions on the current interest rate differential (as in a carry trade). This generates even moreovershooting (closer to the data), as investors keep demanding Foreign bonds for longer withoutheeding the expected future depreciation.
Motivation Banks trade extensively in the Forex market but hold virtually no overnight posi-tions. Mutual funds’ currency positions are constrained since they are only allowed to trade withincertain asset classes.
13.3 Brunnermeier, Nagel and Pedersen (2009): “Carry Trades and CurrencyCrashes”
Summary The carry trade entails going long in a high-interest “investment” currency financedby a short position in a low-interest “funding” currency. The authors present empirical evidenceon the carry trade that is consistent with a theory of currency traders as being subject to fundingconstraints that limit their ability to erase UIP deviations and occasionally force them to prema-turely unwind their positions, leading to asymmetric crash risk. On average, the carry trade isprofitable in expectation and its Sharpe ratio dominates that for equities. However, positive in-terest rate differentials predict future negative skewness of ER movements, i.e., disproportionatedownside risk. Speculators’ (i.e., investors that engage in futures markets for reasons other thancommercial hedging) positions increase with the interest rate differential, and net speculative po-sitions predict increased negative skewness. Times of higher global risk, as measured by the VIXor TED spread, coincide with carry trade losses and reduced speculative carry positions, while theexpected future excess carry return increases. Using options data, the authors find that the priceof insuring against crash risk rises after carry trade losses (despite the conditional skewness movingcloser to zero), perhaps because investors who are forced to unwind their positions become morecautious. Controlling for the VIX or TED spread, the predictive power of interest rates for excess
95

returns decreases, possibly resolving part of the FPP. Finally, the authors show that currencieswith similar interest rates co-move closely, indicating that funding constraints have a large globalcomponent and thus can’t be diversified away.
Options data The authors use so-called risk reversals, which is the implied volatility of an out-of-the-money call minus the implied volatility of an equally out-of-the-money put, both written onthe Foreign currency. Such an options position pays off when the Foreign currency appreciates alot, while they lead to negative payoff when it depreciates a lot. If the risk-neutral conditionaldistribution of the ER is symmetric, the risk reversal is zero. Otherwise, its sign equals that of therisk-neutral conditional skew of the ER. One can think of the risk reversal contract as providinginsurance against a large Foreign appreciation, i.e., it’s the price of insuring against the crash riskassociated with a carry trade that uses the Home currency as investment currency and the Foreigncurrency as Funding currency.
13.4 Burnside (2009): “Comment on ‘Carry Trades and Currency Crashes’”
Summary The author holds a favorable view toward the Brunnermeier et al. (2009) paper,although he has reservations about the quantitative ability of the underlying theory that the em-pirics are supposed to support. First, Burnside criticizes other explanations of the FPP. The Lustigand Verdelhan (2007) thesis is dismissed, because their estimated SDF is apparently uncorrelatedwith the purported consumption risk factors. “Peso problem” (rare disaster) explanations are alsodismissed, since hedged portfolio carry trades tend to generate about the same average return asunhedged ones (Burnside et al., 2008). Turning to the Brunnermeier et al. (2009) explanation,Burnside notes that the relationship between the forward premium and skewness is stronger usingrealized skewness than using options-implied skewness. This calls into question whether specula-tors really anticipate changes in crash risk. Because the story depends so much on time-varyingconditional ER skewness, and this variation seems modest in the data, it’s important to evaluatethe funding-constraint model quantitatively to see whether it can generate enough amplification.
Theory Burnside gives a short exposition of the FPP. The return of an investment strategy thatconverts Home to Foreign currency, invests in Foreign bonds and then converts back to Homecurrency is
Rct+1 = (1 + i∗t )St+1
St.
St is measured in Home per Foreign units. Covered interest parity requires
1 + it1 + i∗t
=FtSt.
Absence of arbitrage implies the existence of an SDF Mt+1 such that 1 = Et[Rt+1Mt+1] for anygross return Rt+1. This yields 1 + it = 1/EtMt+1. Inserting Rt+1 = Rct+1 and rearranging, one gets
FtStEtMt+1 = Et
[Mt+1
St+1
St
]⇒ Etδt+1 = ft −
Covt(Mt+1, δt+1)
EtMt+1,
where δt+1 = (St+1 − St)/St and ft = (Ft − St)/St. The last term on the RHS above is the riskpremium pt. The unbiasedness hypothesis says that the forward rate Ft is an unbiased predictor of
96

the future spot rate St+1, which we see is equivalent with pt = 0. From covered interest rate parity,we also have
ft =1 + it1 + i∗t
− 1 ≈ it − i∗t .
So we can write Etδt+1 ≈ it − i∗t − pt, and UIP is also approximately equivalent with pt = 0.
13.5 Burnside (2011): “Carry Trades and Risk”
Summary The author considers various explanations for the FPP. He constructs various carrytrade portfolios and estimates linear factor models by GMM. First, it’s found that common factormodels that price U.S. equities—such as the CAPM (single factor is excess market return), CCAPM(single factor is consumption growth), Fama-French three-factor model (factors are market return,size premium SML and value premium HML) and Yogo (2006) extended EZ-CCAPM—do not pricecarry returns, as the betas are mostly insignificant and pricing errors too large (i.e., J-test rejects).Second, it’s found that some proposed models with factors constructed from currency returns doseem to perform well. As factors, the literature has used the average carry return, the HMLcarry return, global currency volatility and global currency skewness for high-interest currencies.While such factor models price carry returns, they perform badly on stock returns. This could justbe due to market segmentation, but the currency-factor models also fail to price other currency-based portfolios such as momentum strategies. Hence, while these findings are suggestive of aconnection between carry returns and factors such as volatility and skewness, Burnside argues thatit’s unsatisfactory that no unifying SDF specification for both stock and currency returns has beenfound. Previous papers have suggested that conditional betas grow large during times of overallcrisis, but Burnside uses rolling regressions to show that the degree of magnification is insufficient,as many stock market declines did not feature negative carry returns (although the 2008 crisisdid). Finally, the author views “peso problem” models (estimated using options data) favorably,although he cautions that these models will need to explain the correlations between ERs, volatilityand skewness, and should also work for the stock market. This is difficult, because rare consumptiondisasters ought to reduce the cross-sectional spread in betas (Julliard and Ghosh, 2010).
13.6 Engel (2011): “The Real Exchange Rate, Real Interest Rates, and theRisk Premium”
Summary The FPP literature finds that high-interest currencies tend to appreciate in the shortrun, thus offering high expected carry returns. This suggests that those countries’ bonds are risky.On the other hand, a separate part of the international macro literature has documented thatwhen a country’s relative real interest rate rises, its currency tends to be stronger than its long-term average, and indeed by more than UIP would imply. Because the RER will have to revert toits long-term average (under stationarity), this suggests that such a country’s bonds are less riskythan others. Engel gives a decomposition of the RER into a component due to expected futureshort-term real interest rate differentials and a component due to expected future excess returns(the latter component vanishes if UIP holds). Both these components, which are estimated usingVARs, are negatively correlated with the RER in the data. Existing models designed to explain theFPP imply that after an interest rate hike, the NER appreciates gradually over time. However, theabove fact about the RER implies that the NER should in fact jump by more than implied by UIPinitially and then ultimately revert back to a long-run level, so any risk-based explanation must
97

include a risk reversal, by which the conditional correlation of excess returns and the real interestrate differential shifts sign at some point. Engel argues that this pattern can’t be generated by aone-factor model of the expected depreciation and the interest rate differential, since such modelsautomatically imply proportionality between excess returns and the real interest rate differential.However, Engel also shows that some more sophisticated models have a hard time generating therisk reversal, as these models are typically engineered to generate a risk premium that is verysensitive to interest rates in the short run, without worrying about the long-run implications.
Theory and empirics Let st be the log NER in units Home per Foreign. Let λt = i∗t +Et∆st+1 − it be the excess return on Foreign bonds. The FPP literature has documented thattypically Cov(∆st+1, it − i∗t ) < 0, which by definition implies Cov(λt, it − i∗t ) < 0. Let the RER beqt = st + p∗t − pt and the ex ante real interest rate be rt = it − Etπt+1. Then
λt = r∗t − rt + Etqt+1 − qt. (12)
Suppose rt − r∗t and λt are stationary with means r, λ. Suppose also E[∆qt+1] = 0. Then
qt − Etqt+1 = −(rt − r∗t − r)− (λt − λ).
Iterating forward, we get
qt − limj→∞
Etqt+j = −Rt − Λt, Rt =
∞∑j=0
Et[rt+j − r∗t+j − r], Λt =
∞∑j=0
Et[λt+j − λ].
If the RER is stationary (which is debatable in the data; certainly the half-life is long), we havelimj→∞Etqt+j = q, the long-run mean of the RER. Rt is the prospective real interest rate dif-ferential, while Λt is the level risk premium. Note that Λt ≡ 0 if UIP holds, as in the classicDornbusch model. In this model, a high real real interest rate is associated with a comparativelystrong currency in real terms due to the favorable investment opportunities in the Home country.
Engel estimates VARs to obtain empirical counterparts to rt, Rt and Λt. Unsurprisingly,Cov(Rt, rt − r∗t ) > 0 for most currency pairings with the U.S. dollar. It’s more surprising thatalso Cov(Λt, rt−r∗t ) > 0. Since the FPP result Cov(λt, rt−r∗t ) < 0 holds robustly (both in nominaland real terms), we must see a risk reversal Cov(λt+j , rt − r∗t ) > 0 for some j, and this is indeedthe case in the data for sufficiently long horizons. Since Cov(Λt, rt−r∗t ) > 0, the short-run reactionof the RER to the interest rate is more sensitive to the real interest rate than if UIP held.
The above evidence is inconsistent with most existing models. For example, suppose Et∆qt+1 =a1φt, rt − r∗t − r = c1φt, so the expected real depreciation and the real interest rate differential aredriven by the same factor φt. Then the excess return equation (12) implies that also λt = g1φt forsome constant g1. But then Cov(λt, rt − r∗t ) = c1g1Var(φt) and no risk reversal can occur.
Even most models with more than two factors will have trouble squaring with the empiricalevidence. The reason is that these models have been constructed to generate a risk premiumthat is very sensitive to the (factors driving the) interest rate differential, such that Var(λt) >Var(Et∆qt+1). But if the model doesn’t have an explicit way that the long-run mechanisms differfrom the short-run ones, the risk reversal doesn’t occur. Models of investor underreaction, such asBachetta and van Wincoop (2010), are able to separate short- and long-run behavior, but the resultsabove indicated that the RER initially reacts more than what UIP would imply to an interest rateshock.
98

13.7 Farhi, Fraiberger, Gabaix, Ranciere and Verdelhan (2009): “Crash Riskin Currency Markets”
Summary It’s argued that a small probability of adverse movements in the SDF can explain asignificant fraction of the excess return on carry trades. A complete markets model is developed inwhich the Home and Foreign log nominal SDFs are driven by (1) partially cross-country correlatedGaussian processes plus (2) a perfectly cross-country correlated Poisson disaster process with avery small arrival rate. Assuming that a disaster does not occur in the sample, the model deliversclosed-form solutions for short-dated options (i.e., as the maturity tends to 0), interest rates, excesscarry returns and risk reversals.
Expected carry returns can be written as the sum of a Gaussian risk premium and a disasterrisk premium. A hedged carry trade is a zero-investment trade in which one borrows in the fundingcurrency and uses that money to both buy insurance in the form of a put option and to buy theinvestment currency. The model implies that the expected return on a hedged carry trade canalso be written as two components. However, both risk premia are reduced due to the presenceof insurance: The disaster risk is completely eliminated (if one assumes that only the investmentcurrency is subject to disaster risk), while the Gaussian risk is ameliorated, and the degree ofamelioration depends on the put’s delta. Interest rates are increasing in disaster risk (as investorsseek compensation to hold the local currency), and Home’s risk reversal (price of OTM put minusequally OTM call) is positive if its crash risk is higher than in Foreign. Putting the above together,the model predicts that (1) currency excess returns increase with interest rates, and (2) increasesin risk reversals are associated with contemporaneous ER depreciations (due to higher perceivedcrash risk) but expected future positive returns (due to higher risk compensation).
Using GMM to estimate the model on monthly data, the authors find that about a quarter ofthe carry trade risk premium is due to priced disaster risk. The authors see the experience in theFall of 2008 as an illustration of a rare disaster, and indeed carry trades suffered large losses overthis crisis period.
Empirics The authors form currency portfolios to empirically test the predictions. Hedged port-folios have lower, but still positive, excess returns than unhedged portfolios. The implied volatilitiesof high-interest currencies are larger than those for low-interest currencies, indicating that optionmarkets price a depreciation risk for high-interest currencies. Risk reversals increase monotonicallywith interest rates.
The model’s structure is taken to the data using GMM. The disaster risk premium is about1–3% annually, whereas the Gaussian risk premium is 3–6%. A J-test leads to a p-value of 0.28.
There is a strong contemporaneous link between risk reversals and ERs, as predicted, but thereis limited evidence of risk reversals providing extra ER predictability.
13.8 Lustig and Verdelhan (2007): “The Cross Section of Foreign CurrencyRisk Premia and Consumption Growth Risk”
Summary The UIP condition is violated in the data. For a U.S. investor, higher foreign interestrates predict higher excess returns (except in the case of very high inflation currencies). The au-thors show that this compensates the investor for U.S. consumption risk: high foreign interest ratecurrencies tend to depreciate against the dollar when U.S. consumption growth is low, while lowforeign interest rate currencies appreciate. These statistics are obtained by assigning currencies to
99

8 continually rebalanced portfolios, sorted after interest rate differential with the U.S. dollar. Thehighest-interest portfolio earns a large positive excess return, while the lowest-interest portfolioearns a negative return. The very highest-interest portfolio is dominated by high-inflation curren-cies, and these actually have more modest excess returns (more in line with UIP). A consumptionEuler equation SDF approach with EZ preferences over durable and non-durable consumption(Yogo, 2006) is used to price the returns, with estimates formed by Fama-MacBeth. The impliedapproximate linear factor model prices the returns well, explaining about 80% of the variation inreturns. However, it suffers from the EPP, as it needs a CRRA of about 100, the same as the modelgets from U.S. equity and bonds returns. The betas on C growth are small for the low-interestportfolios and high for the high-interest portfolios. The authors relate their findings to the Backus-Smith (1993) puzzle: Conditional on interest rates, the correlation between ERs and C growth isin fact high.
100

A Appendix: Abbreviations
The following are some of the abbreviations used.
• B-S: Backus-Smith
• C: consumption
• CA: current account
• CB: central bank
• CD/C-D: Cobb-Douglas
• CRS: constant returns to scale
• C-S: Cauchy-Schwarz
• CU: currency union
• DIS: dynamic IS
• DRS: decreasing returns to scale
• D-S: Dixit-Stiglitz
• EoS: elasticity of substitution
• EPP: equity premium puzzle
• ER: exchange rate
• EZ: Epstein-Zin or Eurozone (depending on context)
• FOC: first-order condition
• FPP: forward premium puzzle
• GE: general equilibrium
• GHH: Greenwood-Hercowitz-Huffman
• H: hours
• HH: household
• HP: Hodrick-Prescott
• I: investment
• K: capital
• L: labor
• LCP: local currency pricing
• LOP: law of one price
• LRPT: long-run pass-through
• M: imports
• MC: marginal cost
• MP: monetary policy
• MPL: marginal product of labor
• MPK: marginal product of capital
101

• MRPT: medium-run pass-through
• MU: marginal utility
• N: labor
• NER: nominal exchange rate
• NERPT: nominal exchange rate pass-through
• NFA: net foreign assets
• NGDP: nominal GDP
• NGM: neo-classical growth model
• NK: New Keynesian
• NKPC: New Keynesian Phillips Curve
• NX: net exports
• OE: open economy
• OLG: overlapping generations
• PT: pass-through
• PCP: producer currency pricing
• PDV: present discounted value
• PPP: purchasing power parity
• RD: regression discontinuity
• RER: real exchange rate
• RMB: real money balances
• RP: risk premium
• RW: random walk
• S: saving
• SDF: stochastic discount factor
• SOE: small open economy
• TB: trade balance
• ToT: terms of trade
• UIP: uncovered interest parity
• X: exports
• Y: output
• ZCB: zero-coupon bond
102


![ERIE IEF s EIEF WORKING PAPER s (EIEF) · 2019. 5. 14. · Notes: Annual data for Argentina, 1995-2017. ... [11], Schmitt-Grohe and Uribe [12], and others, one approach is to model](https://img.pdfslide.net/doc/110x75/60a8e1d235aa551cb40d7352/erie-ief-s-eief-working-paper-s-eief-2019-5-14-notes-annual-data-for-argentina.jpg)