Embed Size (px)
Citation preview

A Work Project, presented as part of the requirements for the Award of a Master Degree in Finance from the
NOVA – School of Business and Economics.
BEYOND THE MEAT: PLANT-BASED MEAT
ALTERNATIVES AND THEIR MARKET, A FOCUS
ON BEYOND MEAT
ANDREA VERZEGNASSI 33809
A Project carried out on the Master in Finance Program, under the supervision of:
Filipa Frade de Castro
3rd of January 2020

Abstract
This equity report aims at analyzing the recently listed company Beyond Meat,
and the latest development in the plant-based meat alternatives landscape. By
thoroughly analyzing the company and its industry, we conceived a valuation
model that encompasses all the drivers which will underpin the growth of the
company and the industry. Throughout the report, we present drivers as well
as the methodology used to arrive at our underlying model assumptions.
Having analyzed the current and the potential future environment for Beyond
Meat, our results suggest that the company is trading at a discount and
recommend investors to buy the stock.
Keywords
Beyond Meat, plant-based, meat alternatives, high-growth
This work used infrastructure and resources funded by Fundação para a Ciência e a Tecnologia
(UID/ECO/00124/2013, UID/ECO/00124/2019 and Social Sciences DataLab, Project 22209), POR
Lisboa (LISBOA-01-0145-FEDER-007722 and Social Sciences DataLab, Project 22209) and POR
Norte (Social Sciences DataLab, Project 22209).

A Work Project, presented as part of the requirements for the Award of a Master Degree in Finance from the NOVA – School of Business and Economics.
EQUITY RESEARCH REPORT: VALUATION OF BEYOND MEAT
STEFAN MAYRL 33994 ANDREA VERZEGNASSI 33809
A Project carried out on the Master in Finance Program, under the supervision of:
Filipa Frade de Castro
3rd of January 2020

Abstract
This equity report aims at analyzing the recently listed company Beyond Meat,
and the latest development in the plant-based meat alternatives landscape. By
thoroughly analyzing the company and its industry, we conceived a valuation
model that encompasses all the drivers which will underpin the growth of the
company and the industry. Throughout the report, we present drivers as well
as the methodology used to arrive at our underlying model assumptions.
Having analyzed the current and the potential future environment for Beyond
Meat, our results suggest that the company is trading at a discount and
recommend investors to buy the stock.
Keywords
Beyond Meat, plant-based, meat alternatives, high-growth
This work used infrastructure and resources funded by Fundação para a Ciência e a Tecnologia
(UID/ECO/00124/2013, UID/ECO/00124/2019 and Social Sciences DataLab, Project 22209), POR
Lisboa (LISBOA-01-0145-FEDER-007722 and Social Sciences DataLab, Project 22209) and POR Norte
(Social Sciences DataLab, Project 22209).

MASTER IN FINANCE
THIS REPORT WAS PREPARED EXCLUSIVELY FOR ACADEMIC PURPOSES BY STEFAN MAYRL AND ANDREA VERZEGNASSI, MASTER IN
FINANCE STUDENTS OF THE NOVA SCHOOL OF BUSINESS AND ECONOMICS. THE REPORT WAS SUPERVISED BY A NOVA SBE FACULTY
MEMBER, ACTING IN A MERE ACADEMIC CAPACITY, WHO REVIEWED THE VALUATION METHODOLOGY AND THE FINANCIAL MODEL. (PLEASE REFER TO THE DISCLOSURES AND DISCLAIMERS AT END OF THE DOCUMENT)
Page 1/32
-
100
200
300
400
500
600
700
800
900
1000
May-19 Jun-19 Jul-19 Aug-19 Sep-19 Oct-19 Nov-19 Dec-19
Beyond Meat S&P 500
+202.6%
+10.8%
▪ Beyond Meat is the current flagship of the plant-based meat
industry. Following the company’s IPO in May 2019, investors pushed
the share price up to a peak of 840% of the initial offer price in only
three months’ time, making the IPO one of the most successful of the
last years.
▪ The company was able to show impressive top-line growth
rates of 101% and 170% in the years 2017 and 2018 and delivered
positive net income for the first time in Q3 2019.
▪ The market is expected to grow significantly over the next five
years at a CAGR of 14.8%, reflecting consumers increased concerns
about healthier lifestyles, animal welfare and the environment.
Competition however, is going to be fierce, with major food
conglomerates with high firepower about to enter or already
penetrating the market.
▪ Key to survive under these conditions will be to retain a
sufficiently high market share of the plant-based meat market. In order
to forecast BYND market share we used an analogy to the plant-based
milk market and specifically its player Almond breeze.
▪ Given our assumed market share and the forecasted inputs in
our DCF analysis we consider the stock to be undervalued and issue
a BUY recommendation at a predicted share price of USD 90.05.
Company description
Beyond Meat is a producer of plant-based meat alternatives. The current product portfolio includes beef and pork substitutes, with proteins of the products being entirely extracted from peas.
Recommendation: BUY
Price Target FY20: 90.05 $
Price (as of 2-Jan-20) 75.64 $
Bloomberg: 02/01/2020
52-week range ($) 25-75.6
Market Cap ($m) 4,581
Outstanding Shares (m) 60,565,840
Source: Bloomberg as of 02/01/2020
Source: Bloomberg as of 02/01/2020
(in $ millions) 2017A 2018A 2019E
Net Revenues 32.5 87.9 321.9
Gross Margin (7%) 20% 31.2%
EBIT (28.5) (27.9) (7.1)
Net income (loss) (30) (30) (8.7)
R&D as % of sales 17.6% 10.9% 5.4%
Source: Beyond Meat, own estimates
BEYOND MEAT, INC COMPANY REPORT
PLANT-BASED MEAT ALTERNATIVES 03 JANUARY 2020
STUDENTS:
STEFAN MAYRL, ANDREA VERZEGNASSI [email protected]
Hype of a new industry
First-mover or future market leader

BEYOND MEAT, INC COMPANY REPORT
PAGE 2/32
Table of Contents
EXECUTIVE SUMMARY .......................................................................... 3
COMPANY OVERVIEW ........................................................................... 4
COMPANY DESCRIPTION ....................................................................................... 4 FUNDING, IPO AND PAYOUT POLICY .................................................................... 4 PRODUCTION PROCESS ........................................................................................ 5 SOURCING ............................................................................................................. 5 RESEARCH & DEVELOPMENT ............................................................................... 6 MARKETING AND SALES ....................................................................................... 7 PRODUCT PORTFOLIO .......................................................................................... 7 FRESH PLATFORM ................................................................................................. 8
▪ Beyond Burger .............................................................................. 8 ▪ Beyond Beef ................................................................................. 9 ▪ Beyond Sausage .......................................................................... 9 ▪ Beyond Beef Crumbles ............................................................... 9
UPCOMING PRODUCTS........................................................................................ 10 ▪ Beyond Chicken ......................................................................... 10 ▪ Further potentially upcoming products .................................... 10
THE PLANT-BASED INDUSTRY ............................................................10
THE MARKET AT A GLANCE ................................................................................. 10 HEALTH ............................................................................................................... 11 ENVIRONMENT AND SUSTAINABILITY .................................................................. 11 COMPETITION ...................................................................................................... 12 WHERE DOES BEYOND MEAT STAND? ............................................................... 14
FORECAST .............................................................................................16
MARKET FORECAST ............................................................................................ 16 SALES FORECAST ............................................................................................... 17
▪ Almond Breeze – Blue Diamond .............................................. 18 ▪ Silk – WhiteWaveFoods ............................................................ 18
VALUE DRIVERS .................................................................................................. 19 ▪ Value drivers- Balance sheet ................................................... 20 ▪ Value drivers - Income statement ............................................ 20
VALUATION ............................................................................................24
APPENDIX ..............................................................................................28
DISCLOSURES AND DISCLAIMERS .....................................................29
REPORT RECOMMENDATIONS ............................................................................ 30

BEYOND MEAT, INC COMPANY REPORT
PAGE 3/32
Executive summary
Beyond Meat is the first plant-based meat company to draw worldwide attention to
the plant-based industry given its recent IPO and innovative product portfolio.
Driven by health, environmental, sustainability, and animal welfare concerns, the
global plant-based meat market is expected to grow significantly over the next few
years and reach USD 30.9 billion in revenues by 2026.
By being an early mover in the market, and with its healthier and more sustainable
product offerings, the company is well positioned to respond to this ‘old-but-new’
trend spreading across the packaged food industry.
However, given the size and appeal of this market opportunity, competition is going
to be aggressive, and major food companies such as Nestlé, Unilever or Kellogg’s
have already entered the market. Therefore, factors such as brand positioning,
product innovation, pricing policy, and market expansion are crucial for Beyond
Meat to attain a high market share in the long-term.
In order to attract consumers and retailers, as well as foodservice companies,
Beyond Meat has to consistently innovate and introduce new products, making it
heavily dependent on its R&D expenses. The next upcoming product being the
Beyond Chicken, which was already tested at KFC. Additionally, the company is
currently in trial phases with McDonald’s and Subway. On Beyond Meat’s product
pipeline, there are further animal-meat and seafood substitutes that are expected
to be introduced in the following years. With an expansion strategy primarily
focused on Europe and Asia, which will be led through the establishment of co-
manufacturing facilities in the Netherlands and China, Beyond Meat wants to be a
market leader in plant-based meat alternatives.
In order to forecast the market share of Beyond Meat in our model, we used the
analogous development of the plant-based milk industry starting from 2004, given
that timing and stage of the market, as well as the main factors underpinning the
growth of the industry in the past, are deemed to be comparable. In particular, we
considered the market share of the almond milk producer Almond Breeze to be a
good approximation of the market share Beyond Meat will be able to obtain in the
future.
Taking into account these factors and conducting a DCF analysis, we found a value
per share of USD 90.05 at December 31, 2020 for Beyond Meat, which implies a
buy recommendation at the current share price of USD 75.64.

BEYOND MEAT, INC COMPANY REPORT
PAGE 4/32
-
15 ,000
30,000
45,000
60,000
December2018
May2019
October2019
Retail Foodservice International
Figure 1: Points of distribution evolution per year
Source: Company
Retail52%
Foodservice48%
Figure 3: 2019 revenues breakdown by channel
Source: Company
Company overview
Company description
Founded in 2009 by Ethan Brown, Beyond Meat is a producer of plant-based meat
alternatives. The company is incorporated in Delaware and headquartered in El
Segundo, California. The business first started selling chicken substitute products
in 2013 at Whole Foods supermarket in the US and introduced a beef alternative
product for the first time in 2014. The company’s current product portfolio includes
beef and pork substitutes, namely the Beyond Burger, Beyond Beef, Beyond
Sausage and Beyond Beef Crumbles. The proteins of all current plant-based meat
alternative products are extracted from peas. Beyond Meat separates its business
units into retail and foodservice in North Americas as well as international sales.
As of October 2019, the products were available at 58,000 points of distribution
(28,000 retail, 23,000 foodservice and 7,000 international – see Figure 1).
The most important US retailers offering Beyond Meat products are Walmart,
Whole Foods, Kroger, Target, Albertsons and Meijer. The most important
restaurant and foodservice chains offering Beyond Meat products are TGI Friday’s,
Sysco, Carl’s Jr., Del Taco and Dunkin Donuts. Moreover, the company is in
product trial phases with McDonald’s, Tim Hortons, Subway, KFC, Courtyard by
Marriott, Denny’s, Hello Fresh and Blue Apron.
Major international sales points include Lidl, TESCO, Metro, Tim Hortons, Coop,
Edeka, Coles (Australia), Ahold Delhaize (Belgium) Albert (Netherlands) and
Continente (Portugal).
For the fiscal year ended 2018 and the nine months ended September 2019,
Beyond Meat reported net revenues of USD 88 million (58% retail, 42%
foodservice) and USD 199 million (52% retail, 48% foodservice – see Figure 3),
respectively, 7% and 14% of which coming from international sales.
Funding, IPO and Payout policy
Beyond Meat went public on NASDAQ stock exchange on May 2nd, 2019 under
the ticker symbol BYND at a share price of USD 25. Net proceeds of the IPO
amounted to USD 252 million. On the first trading day, the stock tripled its share
price to USD 65 and surged to a peak of USD 235 on July 26, 2019 (see Figure
4). On August 5, 2019, the company completed a secondary public offering in
which it sold 250,000 shares at a price of USD 160, amounting to total net proceeds
of USD 37,5 million.
Beyond Meat is continuously increasing its product availability.
US Foodservice
International sales points
Trial sales
US Retailers
Figure 2: Major sales points for Beyond Meat
Source: Company

BEYOND MEAT, INC COMPANY REPORT
PAGE 5/32
+839.6%
+202.6%
-
2550
75
100
125
150
175
200
225
250
May-1
9
Jun
-19
Jul-
19
Aug
-19
Sep
-19
Oct-1
9
No
v-1
9
De
c-1
9
Figure 4: Beyond Meat share price performance since IPO
Source: Bloomberg
Source: Company
Although Beyond Meat was able to deliver positive results in Q3 2019 for the first
time, concerns about increasing competition and the ending of the post-IPO lockup
period of 180 days for early investors at the end of October 2019 led to a sharp
decrease in the stock price.
The company has continuously declared to invest all future earnings into
operations and not to pay out any dividends in the foreseeable future, making stock
appreciation the only means of capital gain for investors. We don’t expect this
payout policy to change any time soon.
Production process
The production process is partly conducted internally and partly outsourced to
third-party co-manufacturers. Beyond Meat is getting delivered a dry blend
containing the pea protein. In a first step, the pea protein passes through an
extruder, where water and steam are added. Heating, cooling and application of
pressure then weave the pea proteins together. Subsequently, the woven protein
is cut into smaller pieces, frozen and then mostly sent to co-manufacturers, which
combine it with flavours and other ingredients according to Beyond Meat’s formula
to obtain the finished products. All manufactured goods are then distributed directly
from co-manufacturers to the desired destination.
Beyond Meat only manufactures the Beyond Burger for the foodservice channel
itself. All other products are assembled by co-manufacturers in California, Texas,
Georgia and Pennsylvania. In order to protect intellectual property of Beyond Meat,
all co-manufacturers are required to sign non-disclosure agreements.
Beyond Meat recently announced to partner with the Dutch company Zandbergen
to have its first European based co-manufacturer. Production in the Netherlands is
expected to start in early 2020, with Zandbergen covering all capital expenditures
required to manufacture Beyond Meat products. After the release of the Q3 2019
results, Beyond Meat announced plans to have a co-manufacturer in China by the
end of 2020 to easily serve Asian markets. In the long-term, the company
announced to set up its own woven protein production facilities in Europe. We
expect these expansions to be a crucial driver for future market share increases.
Sourcing
Pea protein is delivered to Beyond Meat and processed to woven protein.
Woven protein is shipped to co-manufacturers who add ingredients according to BYND’s formula and package the finished goods.
Zandbergen will be the first co-manufacturer outside of the US.
BYND is planning to expand production to China by end of 2020.

BEYOND MEAT, INC COMPANY REPORT
PAGE 6/32
The key ingredients of the company’s products are pea protein and plant-based
flavours. Pea protein is sourced from two different suppliers, Roquette America
Inc. and Puris Proteins, LLC.
Roquette, one of the world’s biggest pea protein providers, sources peas from
Canada and France. Beyond Meat has entered into a one-year supply agreement
with Roquette that expires on December 31, 2019.
Puris, the biggest US pea protein provider, is sourcing domestic protein under a
supply agreement that will expire on December 31, 2021.
Roquette and Puris have both independently announced to more than double their
pea protein production levels in the following two years to meet demand
(Bloomberg 2019).1 With additional global players, like the Belgian supplier
Cosucra or American ADM, which also declared to expand operations, and the
generally growing demand, the global pea protein market is expected to reach a
volume of around USD 313 million by 2025 (Grand View Research 2019), almost
tripling in size by then. 2
Despite these announced expansions, Beyond Meat’s capabilities to renegotiate
terms with Roquette as in the past, and the statement of Puris CEO, Tyler
Lorenzen, who believes pea producers will be able to meet future demand, we
believe that the company may face some challenges in the supply of raw materials
in the future. In point of fact, Beyond Meat has already faced supply problems in
2017 and 2018, and now that more plant-based manufacturers are basing their
products on peas (CNBC 2019)3, the downstream risk throughout the supply chain
may be higher for the time ahead.
Research & Development
Beyond Meat has a research team of currently 71 employees, who are dedicated
to improving existing product formulas and find new ways to mimic animal-based
meat. In 2018 the company opened its new 30,000 square foot research centre,
the “Manhattan Beach Project innovation centre”, in El Segundo, California.
Beyond Meat was investing roughly 11% of sales in R&D in 2018, well above the
packaged goods industry median of 0.5% (see Figure 16, page 13). The key areas
on which the research team is continuously working on include: better fat adipose
1 Bloomberg. 2019. “Plant Protein Boom Gets Beyond Meat Supplier Thinking Bigger.” Accessed December 27. https://www.bloomberg.com/news/articles/2019-10-20/beyond-meat-supplier-mulls-fava-beans-to-tap-plant-protein-craze. 2 Grand View Research. 2019. “Pea Protein Market Size Worth $313.5 Million by 2025.” Accessed December 27. https://www.grandviewresearch.com/press-release/global-pea-proteins-market. 3 CNBC. 2019. “Beyond Meat’s pea protein supplier receives additional $75 million investment from Cargill.” Accessed December 27.https://www.cnbc.com/2019/08/28/beyond-meats-pea-protein-supplier-receives-additional-75-million-investment-from-cargill.html.
The “Manhattan Beach Project” is a state-of-the-art innovation centre which is driving steady product development.
The base of all current products is protein sourced from peas.
BYND has two existing sourcing contracts with Roquette and Puris. Minimum pea protein purchase commitments in 2020 and 2021 amount to USD 24 million in both years.

BEYOND MEAT, INC COMPANY REPORT
PAGE 7/32
-
20%
40%
60%
80%
100%
2016 2017 2018 Q3 2019
Fresh platform Frozen p latform
Figure 5: Revenues breakdown by platform
Source: Company
9M 2019
and saturated fat mimics, alternative functional proteins, connective tissue
equivalents, encapsulation materials and technology, and materials to support
flavour and texture.
Marketing and Sales
Beyond Meat is marketing its products in the meat case at grocery retailers in order
to better attract consumers who are accustomed to buy animal-based proteins but
may also be in favour of buying plant-based meat for dietary needs, environmental
and sustainability concerns (refer to pages 10-11).
As of October 2019, Beyond Meat was able to expand its points of distribution by
30,000 (13,000 in retail, 11,000 in foodservice, and 6,000 international) when
compared to the year-end figure of 28,000 in 2018. We expect especially
international points of distribution to further increase in the future to support growth.
The primary tools through which the company is attracting customers is via social
media, its website as well as its digital newsletter. Beyond Meat also uses its
extensive network of company ambassadors to promote products.
Product Portfolio
The company sells products in two categories, referred to as fresh platform (ready-
to-cook products) and frozen platform (ready-to-heat products). Even though the
company started off with ready-to-heat products, the recent growth was mainly
driven by the fresh platform. Beyond Meat is expecting only a small percentage of
the overall sales volume to come from its frozen platform in the future. At
December 31, 2018, 84% of sales were coming from the fresh and 16% from the
frozen platform. As of the nine months ended 2019, 94% of sales are generated
from the fresh and 6% from the frozen platform. (see Figure 5) When considering
this evolvement in terms of volumes produced, the percentage points of the fresh
platform are slightly lower, in 2018 78% were generated by the fresh platform and
92% in the nine months ended 2019.
According to a global study conducted by Vomad (2019), the main reasons for
people to start a vegan diet are animal welfare (68%), health issues (17%) and
environmental concerns (10%) – see Figure 6.4 The American Heart Association
(2019) pointed out in a recent research paper, that people who eat a plant-based
diet have a 16% lower risk of having cardiovascular diseases (like heart attacks,
4 VOMAD. 2019. “Why People Go Vegan: 2019 Global Survey Results.” Accessed December 27. https://vomadlife.com/blogs/news/why-people-go-vegan-2019-global-survey-results.
The company separates its products into two platforms, the fresh platform and the frozen platform.
BYND fresh products, in particular the Beyond Burger are sold in the meat case.
Social media is a key tool to enhance product awareness and strengthen the brand recognition.
Brand ambassadors who continuously promote BYND products are partially awarded with restricted stock grants.

BEYOND MEAT, INC COMPANY REPORT
PAGE 8/32
Animal welfare
68.10%
Health
17.40%
Environment9.70%
Other4.80%
Source: Vomad
Figure 6: Main reasons to go vegan in 2019
strokes, etc) and a 25% lower risk of death from those diseases, as meat is high
in saturated fats and cholesterol, which both are linked with heart diseases.5
All of the company’s products are free of gluten (about 1% of global population is
considered to have a gluten intolerance) and genetically modified organisms
(GMOs, which use is heavily discussed in society), and lower in saturated fats and
cholesterol than animal-based meat. However, currently some Beyond Meat
products, especially the Beyond Burger, are higher in sodium than normal minced
beef, which is a link to higher blood pressure and therefore to cardiovascular
diseases (World Health Organization 2019).6
By looking at the price of plant-based meat, it can be regarded that it is significantly
more expensive than normal minced meat or processed meat products for the
following reasons:
• Higher production costs: Beyond Meat is still not in the position to make
use of economies of scale to the same extent as mature food companies.
Additionally, the company is lacking bargaining power for their ingredient
cost component.
• Higher R&D costs: The company is heavily reliant on R&D, as increasing
competition is demanding improved and innovative product formulas.
Mature food companies do not have the same R&D/sales ratio.
• Higher marketing costs: Beyond Meat is selling a branded product and
is therefore spending a relatively higher amount of money on marketing.
Minced beef in contrast is usually not branded at all.
Fresh platform
▪ Beyond Burger
The Beyond Burger is currently the main product, representing 70% and 55% of
gross revenues, in 2018 and in the nine months ended 2019, respectively. It is also
expected to remain the leading fresh platform product in the foreseeable future.
The Beyond Burger is solely marketed within the meat section at retailers.
As can be regarded in the comparison table below (see Table 1), the Beyond
Burger has less saturated fats, no cholesterol, and about the same amount of
5 Kim, Hyunju., Caulfield, Laura E., Garcia-Larsen, Vanessa., Steffen, Lyn M., Coresh, Josef., and Rebholz, Casey M. 2019. “Plant-Based Diets Are Associated With a Lower Risk of Incident Cardiovascular Disease, Cardiovascular Disease Mortality, and All-Cause Mortality in a General Population of Middle-Aged Adults”. Journal of the American Heart Association 8 (1). 6 World Health Organization. 2019. “Reducing sodium intake to reduce blood pressure and risk of cardiovascular diseases in adults.” Accessed December 27. https://www.who.int/elena/titles/sodium_cvd_adults/en/.
Beyond Burger is the company’s flagship product.

BEYOND MEAT, INC COMPANY REPORT
PAGE 9/32
Table 1: Nutritional values comparison table
Serving size
113g
Beyond
Burger-
Retail
Impossible
Burger
Minced Beef
(80% Lean /
20% fat)
Calories 250 240 287
Total fat 18g 14g 22,6g
Daily value 23% 18% 29%
Saturated fat 6g 8g 8,7g
Daily value 30% 40% 44%
Cholesterol 0mg 0mg 80mg
Daily value 0% 0% 27%
Sodium 390mg 370mg 76mg
Daily value 17% 16% 3%
Potassium 300mg 610mg 305mg
Daily value 6% 13% 6%
Total
carbohydrate 3g 9g 0g
Daily value 1% 3% 0%
Dietary fiber 2g 3g 0g
Daily value 8% 11% 0%
Sugars 0g <1g <1g
Daily value 0% 1% 1%
Protein 20g 19g 19,4g
Daily value 40% 38% 39%
Price per pound $ 12.0 $ 12.0 $ 3.8
Serving size
76g
Beyond
Sausage -
Brat Orginal
Johnsonvill
e Original
Brats
Calories 190 241
Total fat 12g 19,4g
Daily value 15% 25%
Saturated fat 5g 7,4g
Daily value 25% 37%
Cholesterol 0mg 60mg
Daily value 0% 20%
Sodium 500mg 680mg
Daily value 22% 30%
Potassium 230mg 0mg
Daily value 5% 0%
Total
carbohydrate 5g 2g
Daily value 2% 1%
Dietary fiber 3g 0g
Daily value 12% 0%
Sugars 0g 1g
Daily value 0% 1%
Protein 16g 14g
Daily value 32% 28%
Price per pound $ 12.5 $ 3.8
Sources: Beyond Meat website, Impossible foods website, Johnsonville website
protein when compared to its biggest competitor, the Impossible Burger or to usual
minced beef (80% lean / 20% fat) that can be purchased in supermarkets.
However, the Beyond Burger has 5x the amount of sodium and costs about 4x as
much as the retail price of minced beef in the US.
▪ Beyond Beef
Beyond Beef was introduced in March 2019 and is designed to imitate ground beef.
▪ Beyond Sausage
The Beyond Sausage, launched in December 2017, comes in two flavours (Hot
Italian and Brat Original). Around 14% of gross revenues in 2018 were coming
from these two products. When comparing the Beyond Sausage to Johnsonville
Bratwurst, which according to a US consumer survey is the most often eaten
bratwurst brand (Statista 2019)7, it can be observed that the Beyond Sausage
contains less total and saturated fat, no cholesterol, less sodium, and more
potassium as well as proteins. However, the Beyond Sausage is currently about
more than 4x the price of the Johnsonville Original Brats.
Frozen platform
▪ Beyond Beef Crumbles
7 Statista. 2019. “U.S. population: Which brands of fresh bratwurst do you eat most often?” Accessed December 27. https://www.statista.com/statistics/279813/us-households-most-eaten-brands-of-fresh-bratwurst/
Beyond Sausage is the number two in terms of percentage of sales.
The frozen platform is diminishing in percentage of sales as BYND is strongly focusing on fresh products.

BEYOND MEAT, INC COMPANY REPORT
PAGE 10/32
A shift towards healthier lifestyles and increased concerns on environment and sustainability to be the main drivers for growth
10.1
30.92
-
10
20
30
40
20
18
20
19e
20
20e
20
21e
20
22e
20
23e
20
24e
20
25e
20
26e
CAGR: +13.2%
Figure 7: Global plant-based meat market revenues forecast (in $bn)
Source: Euromonitor
Beyond Beef Crumbles were the company’s first products on the market. However,
the percentage of frozen products have declined over the last two years (from 52%
of gross revenues in 2017 to 16% in 2018 and 6% in the nine months ended 2019).
Given the focus of the company on its fresh product line, we expect the frozen
platform to still co-exist next to the fresh platform in the future, although accounting
for a lower level of gross revenues, as per 2019 data.
Beyond Beef Crumbles come in two varieties, Beyond Beef Crumbles Beefy and
Beyond Beef Crumbles Feisty.
Upcoming products
▪ Beyond Chicken
Beyond Meat has partnered with KFC to try out the Beyond Chicken in a KFC store
in Atlanta, Georgia on August 26, 2019. No official nutritional details have been
made public yet, but according to a statement of a company spokesman, the
Beyond Chicken is made from wheat protein mixed with spices and flavours, and
has the following nutritional details in comparison to KFC traditional nuggets:
• 60 calories vs. 90 calories, 3 grams (g) of fat vs. 5 g of fat, 0 milligrams (mg)
of cholesterol vs. 10 mg of cholesterol, 145 mg of sodium vs. 300 mg sodium,
5 g protein vs. 5 g protein – per 27-gram nugget.
▪ Further potentially upcoming products
The company has filed for application of several trademarks with the US Patent
and Trademark office including for example Beyond Hot Dogs, Beyond Ham,
Beyond Tuna, Beyond Crab, Beyond Turkey or Beyond Shrimp. This might give
an indication about possible product line extensions, which will be crucial for
Beyond Meat to retain and increase its market share in the future. For a full list of
registered trademarks and pending applications refer to Appendix 1.
The plant-based industry
The new hot trend in food is without any doubt the rise of plant-based diets, and in
particular the growing popularity of meat-substitute products. After Beyond Meat’s
successful IPO, the plant-based meat producer is now in the spotlight and a lot of
attention is drawn on the many uncertainties that this market portrays, which will
affect the future profitability of the company. Will Beyond Meat be able to maintain
its position as a pioneer of this new niche-market with high growth potential or will
other major food manufacturers take the lead?
The market at a glance
Beyond Beef Crumbles are the only frozen product.
Beyond Chicken will be the next upcoming product line extension.
The trial with KFC in August 2019 was a remarkable success with Beyond chicken products being sold out in five hours.
Potential future products include Beyond Hot Dog, Beyond Ham, Beyond Crab or Beyond Turkey.

BEYOND MEAT, INC COMPANY REPORT
PAGE 11/32
No hormones, no antibiotics, and low cholesterol are among the main reasons for a switch towards plant-based products
“After thoroughly reviewing the accumulated scientific literature, a Working Group of 22 experts from 10 countries classified the consumption of red meat as probably carcinogenic to humans”
World Health Organization 26 October, 2015
532.9
888.2
-
250
500
750
1,000
20
12
20
13
20
14
20
15
20
16
20
17
20
18
20
19e
20
20e
CAGR: +5.8%
Figure 8: US plant-based meat market revenues forecast (in $m)
Source: Euromonitor
82% from plant-based food
18%
from
meat
&
diary
50%
Agriculture
77% Livestock
37% from
meat &
diary
Habitable land
Agricultural land
Global
calorie supply
Global
protein supply
23%
Crops
73% from plant-
based food
Figure 9: Global land use for food production
Source: FAO
37%
Forests11%
Shrub
2% urban &
built-up
Besides being a trend in the food industry, the plant-based meat market is also
currently growing at an incredible pace. Since its expansion in the US (started back
in 2012) it has grown by as much as 50.3% until 2018, and the last 2 years it has
been growing at a pace of +25% and +10% y/y for 2017 and 2018, respectively.
There is a high potential for growth for this type of product given the increased
concerns that animal-meat poses with respect to our health and the environment.
These two, are the main drivers expected to underpin the growth of plant-based
meat worldwide. Forecasts estimate the US and global plant-based meat market
to reach $880.2 million and $30.9 billion in revenues by 2026, respectively (see
Figure 7 and 8).
Health
To better understand where medical opinion stands with regard to the concerns
resulting by meat consumption on our health, we have to go back to 2015 when
for the first time the International Agency for Research on Cancer (2015) issued a
press release classifying processed meat as “carcinogenic to humans”.8 In the
articles published, there is evidence for health-related diseases as a result of red
meat consumption. Boada et al. (2016), presented epidemiologic studies
highlighting the increased incidence of obesity, type 2 diabetes, cardiovascular
diseases, and cancers, linked to red meat consumption.9
Additionally, there are many other factors which encourage the switch or a
reduction of animal-meat intake. Among those, there are: no use of hormones, no
antibiotics, and low cholesterol. Evidence in favour of these factors are found in a
report drafted by the European Commission (2002), which states that the use of
hormones poses a health risk to consumers, and in the research published by the
Centers for Disease Control and Prevention (2019) – according to which antibiotic-
resistant infections are one of the biggest public health challenges of our time.10 In
light of the evidence presented above, and on the rise of “flexitarian”, vegetarian,
and vegan diets, (Nielsen, 2015)11, we expect health to be one of the main pillars
to drive demand for plant-based meat products among consumers.
Environment and sustainability
8 IARC. 2015. “IARC Monographs evaluate consumption of red meat and processed meat.” Accessed December 27. https://www.iarc.fr/wp-content/uploads/2018/07/pr240_E.pdf 9 Boada, Luis D., Henríquez-Hernández, L.A., Luzardo, O.P. 2016. “The impact of red and processed meat consumption on cancer and other health outcomes: Epidemiological evidences”. Food and Chemical Toxicology 92: 236-244. 10 European Commission. 2002. “Growth promoting hormones pose health risk to consumers, confirms EU Scientific Committee.” Accessed December 27. https://ec.europa.eu/commission/presscorner/detail/en/IP_02_604; CDC. 2019. “Antibiotic / Antimicrobial Resistance.” Accessed December 27. https://www.cdc.gov/drugresistance/index.html. 11 Nielsen. 2015. “Global Health and Wellness Report.” Accessed December 27. https://www.nielsen.com/wp-content/uploads/sites/3/2019/04/Nielsen20Global20Health20and20Wellness20Report20-20January202015-1.pdf

BEYOND MEAT, INC COMPANY REPORT
PAGE 12/32
41% 46%52%
68%
Beef Pork Chicken Salmon
Source: Mowi
Figure 11: Edible yield (edible meat to total body weight)
34% 31%
18% 15%
Chicken Salmon Pork Beef
Figure 10: Protein retention
Source: Mowi
7
3
1.91.1
Beef Pork Chicken Salmon
Source: Statista
Figure 12: Feed conversion ratio by category
15,415
5,9984,325
2,000
Beef Pork Chicken Salmon
Source: Statista
Figure 13: Amount of water per kilogram of edible food
30.0
5.92.9 2.7
Beef Pork Salmon Chicken
Figure 14: Carbon footprint (kg of CO2 per kg of edible meat)
Source: Statista
Another touching point for the potential future growth of the plant-based meat
market lies behind the environmental impact that meat, and particularly beef
production has been known to have on our planet. According to a study conducted
by the FAO (2019), livestock is using 77% of agricultural land, however producing
only 18% of global calories and 37% of global proteins (see Figure 9). Additionally,
studies estimate greenhouse gas emissions of livestock to lie in between 18%-
51% of total global volume (Independent 2009)12. To highlight how cattle farming
is resource intensive and not sustainable, and in particular, how inefficient it is
when compared to other animal farming categories, metrics such as protein
retention, feed conversion ratios, edible yields, and water and carbon footprints are
presented, outlining a sustainability problem for this specific category (see Figure
10–14). This issue is even exacerbated when considering the constant increase in
food demand arising from the overall growth of the worldwide population.
In addition, the worsening conditions of animal welfare, which were reported on
the news over the last couple of years, have been playing a role in growing
consumer awareness and concerns on the dreadful practices spread across the
animal farming industry. As outlined earlier, a survey conducted by Vomad (2019)
presented animal welfare to be the main response why consumers are shifting
towards healthier and more sustainable diets (see Figure 6 above). We therefore
expect environmental, sustainability, and animal welfare concerns to drive growth
for plant-based meat products among consumers.
Competition
To better understand what is happening in the plant-based meat industry it is
worthwhile to look at some relevant events to get to know where consumer demand
stands for these products and also what stakeholders expect from major food
companies in terms of strategy for plant-based products. For example, Green
Century Equity Fund, an investor in Kraft Heinz, has recently filed a shareholder
proposal asking the board of directors to outline the company’s strategic plan
towards the plant-protein market, as a consequence of the lack of response to the
rising demand for plant-based products (Green Century Funds 2019)13. By
considering that Kraft Heinz is the third largest food company in North America,
this action describes investors’ concerns about the prospective positioning of the
company in light of the shift the industry is experiencing. Ultimately, the increase
12 Independent. 2009. “Study claims meat creates half of all greenhouse gases”. Accessed December 27. https://www.independent.co.uk/environment/climate-change/study-claims-meat-creates-half-of-all-greenhouse-gases-1812909.html. 13 Green Century Funds. 2019. “Green Century Squeezes Kraft Heinz To Diversify Its Protein Products”. Accessed December 27. https://www.greencentury.com/green-century-squeezes-kraft-heinz-to-diversify-its-protein-products/.

BEYOND MEAT, INC COMPANY REPORT
PAGE 13/32
Figure 16: R&D spending as % of $ sales
1.8%
1.1%1.1%
0.6%
0.4% 0.4%
0.3%
Median0.5%
Source: Companies, Bloomberg
Note: R&D expense as a % of $ sales according to annual 2018 figures as reported
on companies’ financial statements
Figure 15: Plant-based meat products currently in the market
in demand for plant-based products is supported by the fact that more retailers and
food chains are introducing plant-based meat alternatives. For example, the
September roll-out of the Impossible Burger 2.0. in 27 US grocery stores or the
partnership of Unilever with Burger King to offer the Rebel Whopper in around
2,500 European Burger King restaurants (Reuters 2019)14.
The plant-based meat market does not present high barriers to entry, therefore,
some major food players have already positioned their products on grocery store
shelves or distributed them to foodservice chains in the US and around the World.
Other players instead, are planning to launch some products during the next year.
Among these companies, besides Impossible Foods and Unilever mentioned
above, there are Nestlé, Maple Leaf Foods, Kellogg’s, Hormel Foods, Tyson
Foods, Conagra, and the lacklustre Kaft Heinz. These are the companies with
which Beyond Meat will likely have to compete in the plant-based meat landscape.
Facts and strategies unveiled by three of the major competitors of Beyond Meat,
namely, Impossible Foods, Nestlé, and Kellogg’s, are outlined below.
Impossible Foods – Deemed also to be one of the pioneers of plant-based burgers,
Impossible Foods is the direct competitor of Beyond Meat in the US, given that the
GMOs concerns around its products do not enable the company to sell in Europe
yet. Since its first product launch in 2016, the company has been focusing only on
the foodservice channel. However, this September, it has rolled out its Impossible
Burger 2.0. in 27 US grocery stores at USD 9 per a 12-ounce box. This signals that
there is enough consumer interest in plant-based meat for grocery stores to stock
another brand. In addition, in May, the company has secured its last round of
investment of USD 300m, dedicated to expansion capacity and R&D (an average
of USD 56m per year between 2013 and 2015 was spent to develop its products).
In 2018, the company generated revenues of USD 44.9m. For its future expansion,
Impossible Foods is targeting Asia and especially China. The company has
recently faced some short-term challenges arising from the surge in demand for its
products given its limited production capacity. To avoid such an issue in the future,
Impossible has signed a partnership with OSI, a US meat producer, to use one of
its production facilities to manufacture its products (McKinsey & Company 2019).15
Nestlé – With USD 313.3bn in market cap and USD 93bn in revenues, the Swiss
multinational has already made its move in the plant-based meat space and is
offering its plant-based products in grocery stores across Europe and the US
14 Reuters. 2019. “Burger King picks Unilever to make plant-based Whoppers in Europe”. Accessed December 27. https://www.reuters.com/article/us-unilever-burger-king/burger-king-picks-unilever-to-make-plant-based-whoppers-in-europe-idUSKBN1XM00C 15 McKinsey & Company. 2019. “An incredible year for Impossible Foods”. Accessed December 27. https://www.mckinsey.com/industries/agriculture/our-insights/an-incredible-year-for-impossible-foods

BEYOND MEAT, INC COMPANY REPORT
PAGE 14/32
Source: Bloomberg
25.8%
21.6%
19.7%
17.7%
14.1%
9.5%
9.3%
19.5%
Median
Figure 17: EBITDA margin of major packaged food players / competition
Source: Companies, Bloomberg
Note: EBITDA margin according to annual 2018 figures as reported on companies’ financial
statements; industry median from North America packaged food industry
through its brand, Garden Gourmet. The main products offered are the Incredible
Burger and Incredible Mince, which are soy and wheat-based products, while its
pea protein variants, the Awesome Burger and Awesome Ground, have been
recently launched in both the US and Switzerland. The latter having been launched
under the brand Sweet Heart Food. Nestlè has the highest R&D spending per
dollars of sales generated as shown in Figure 16, and it is also better positioned to
generate earnings given its higher EBITDA margin (see Figure 17), with respect to
the above-mentioned group of competitors. The multinational is also moving its
attentiveness for plant-based meat to China and has recently opened a new R&D
centre in Beijing as well as a Technology centre in Shenzhen (Nestlè 2019)16.
Kellogg’s – The American multinational, with USD 21bn in market cap and USD
13.5bn in revenues was one of the first to enter the plant-based market with its
Morningstar brand. The company is now focusing on frozen plant-based products
but has announced in September that it is going to launch its fresh line in early
2020. Products will include the Incogmeato Burger, Chik’n Nuggets, and Chik’n
Tenders. Kellogg’s, which has a R&D spending of 1.1% (see Figure 16), being
second after Nestlè, will also focus on product innovation and is targeting to
become 100% plant-based with its brand by 2021. (Kellogg’s 2019)17.
Cultured meat
Cultured meat, another name for meat grown in the laboratory, has the potential to
become a growth impediment for plant-based meat as it is considered another
substitute product for conventional meat. As industrialised cultured meat is
currently under development and expected to be available in the market only in the
next few years, potential impact on the plant-based meat industry is not fully clear.
However, by analysing the market forecasts of cultured meat and plant-based
meat, we don’t expect our valuation to be materially impacted by the rise of cultured
meat.
Private label
By analysing the drivers of private label penetration and of consumer behaviour
towards purchasing private brands, we do not expect Beyond Meat’s market share
to be materially impacted by private label competitive offerings in the future.
Where does Beyond Meat stand?
In the arguments presented above we have discussed the main potential drivers
for the growth of the plant-based meat industry, however, in order to better
16 As stated on the company website. https://www.nestle.com/investors. 17 As stated on the company website. https://investor.kelloggs.com/.

BEYOND MEAT, INC COMPANY REPORT
PAGE 15/32
The Beyond Burger generates 90% less greenhouse gases, and has almost a 100% less impact on water scarcity
Figure 18: Beyond Burger environmental footprint vs. traditional beef burger
Source: Beyond Meat, University of Michigan
understand where Beyond Meat stands within this landscape, we decided to
present its competitive advantages along with the potential threats and issues that
the company may have to face in the near future.
Competitive advantages
Health, environment & sustainability – The growth in demand for plant-based meat
arising from increased concerns on health, environment, and sustainability, is
expected to increase demand for Beyond Meat products, which are well-positioned
to answer consumer needs. A study conducted by the University of Michigan
(2018), pointed out that the Beyond Burger generates 90% less greenhouse gas
emissions, requires 46% less energy, and has 99% less impact on water scarcity
and 93% less impact on land use than a quarter pound of US beef (see Figure 18).
To put that into numbers, a 41-square-foot plot of land can produce just one beef
burger for every 15 Beyond Burgers.18
First mover advantage – Being a first mover in a disruptive and high growth market
has helped the plant-based meat manufacturer growing as well as gaining
international exposure. We believe this factor will positively affect the company’s
revenues in the medium-term.
Brand awareness – By promptly placing its products in the market, Beyond Meat
will also benefit from the relationships that the brand may be able to generate with
its customers. If the product wins the ‘repeat purchase’ phase, this will likely help
the company suffer less from competition in the future.
Cutting edge R&D – The newly opened Research & Development facility follows
the company’s strategy to continuously innovate and improve the meat-less
experience of its products. We believe that an in-house research team is extremely
valuable in order to differentiate competitive offerings in the future. Beyond Meat
has spent 7% of its sales in R&D in 2018 and it is estimated to spend 5% for 2019.
Potential threats and issues
Competition – The threat of new entrants into the market is high because of low
barriers to entry. In support of this view, we can look at what has happened recently
to Impossible Foods and its plant-based patties, which have already been replaced
with Lightlife burgers (produced by Maple Leaf Foods) at Dave & Buster’s. Beyond
Meat will have to differentiate, adapt and innovate its products to retain market
share in the future given the firepower of big players such as Nestlé and Kellogg’s.
18 Heller, Martin C., Keoleian, Gregory A. 2018. “Beyond Meat’s Beyond Burger life cycle assessment: a detailed comparison between a plant-based and an animal-based protein source.” CSS Report, University of Michigan: Ann Arbor 1-38.

BEYOND MEAT, INC COMPANY REPORT
PAGE 16/32
Figure 19: Price for a 2-plant-based burger pack (c. 225g)
Company Product Price
LidlNext Level
Burger€2.99
NestleIncredible
Burger€3.49
BYNDBeyond
Burger€4.99
Source: Lidl, Nestlè, Beyond Meat
2.4
%
2.6
%
2.7
%
2.8
%
2.9
%
2.8
%
3.3
%
3.5
%
3.9
%
4.2
% 4.8
%
5.3
%
5.8
%
6.1
% 6.7
%
20
04
20
05
20
06
20
07
20
08
20
09
20
10
20
11
20
12
20
13
20
14
20
15
20
16
20
17
20
18
Figure 20: US plant-based share of the milk market
Source: Euromonitor
2.6
%
2.9
%
3.1
%
3.3
%
3.7
%
4.2
% 4.9
% 5.5
%
6.1
%
6.6
%
6.5
%
6.5
%
6.5
%
6.4
%
6.5
%
20
04
20
05
20
06
20
07
20
08
20
09
20
10
20
11
20
12
20
13
20
14
20
15
20
16
20
17
20
18
Figure 21: World plant-based share of the milk market
Source: Euromonitor
Price – As a consequence of more players entering the market, prices are
expected to be lower in the future. Given that e.g. plant-based patties offered by
Lidl and Nestle are sold at a discount (see Figure 19) when compared to the
Beyond Burger, we expect prices to converge in the future and therefore for
Beyond Meat to market its products at a lower price. Additionally, it is also
important to mention how income levels affect purchases of healthier and more
sustainable products among consumers. As pointed out in a study from Fanzo and
Davis (2019)19, these categories of products are not as accessible for lower-
income households as for medium- or higher-income groups. Given that the
current price of the Beyond Burger is about 4x higher than animal ground beef, we
believe the company will have to take this socio-economic factor into account if it
wants to reach a broader customer base in the future and therefore keep its market
share growing.
Highly processed food – With its 19 ingredients and high sodium and fat content,
Beyond Meat’s products are deemed to be highly processed (Gelsomin, 2019)20,
however, the evidence is mixed regarding to what extent processed foods are bad
for our health, as pointed out by the National Health Service (2019).21 This
‘drawback’ may potentially steer some consumers away from purchasing the
product solely for health reasons.
Forecast
Market forecast
Besides relying on market estimates for the plant-based meat category published
by various market research organisations, in order to forecast the future size of the
plant-based meat market and the potential market share of Beyond Meat, we
decided to look at what happened (and what is currently happening) in its closest
comparable market, the plant-based milk industry.
As for the meat-alternative category, dairy-alternatives were mainly driven by
sustainability, environmental, and health concerns, as well as by the swell of vegan
diets. Over a 14 years period, we can see how plant-based milk alternatives grew
and increased their share in percentage of the total dairy milk market. In 2018,
according to Euromonitor data, the penetration rate of plant-based milk in its
19 Fanzo, Jessica., Davis, Claire. 2019. “Can Diets Be Healthy, Sustainable, and Equitable?” Current Obesity Reports 8: 495-503. 20 Harvard. 2019. “Impossible and Beyond: How healthy are these meatless burgers?” Accessed December 27. https://www.health.harvard.edu/blog/impossible-and-beyond-how-healthy-are-these-meatless-burgers-2019081517448. 21 NHS. 2019. “Eating Processed Foods.” Accessed December 27. https://www.nhs.uk/live-well/eat-well/what-are-processed-foods/.

BEYOND MEAT, INC COMPANY REPORT
PAGE 17/32
2.0
3.4
6.4
-
1.0
2.0
3.0
4.0
5.0
6.0
7.0
20
13
20
14
20
15
20
16
20
17
20
18
20
19e
20
20e
20
21e
20
22e
20
23e
20
24e
CAGR: +10.4%
CAGR: +9.4%
Figure 22: US plant-based milk market revenues and forecast (in $bn)
Source: Statista
63.7
20.5
17.6
12.0
10.1
8.9
7.2
Silk
Meyenberg
All R ipp le Foods
Almond Breeze
So Delicious
Good Karma
Bol thouse Farms
Figure 24: Sales of milk alternatives in 2018, by major brands (in millions of $)
Source: Statista
68%
65%
41%
41%
39%
39%
24%
22%
20%
I l ike the taste
Healthier
More humanely produced
Substi tu te for cooking
Production is more humane
Lower calorie
Lactose intolerant
Have many flavors
My die t
Figure 23: Reasons for buying plant-based milk among consumers
Source: Mintel
animal-based antagonist market was 6.7% and 6.5% in the US and the world,
respectively (see Figure 20 and 21). Even though dairy-alternatives were also
partly driven by food-intolerances, we believe that the mentioned factors such as
health, environment, and sustainability played an important role in pushing
consumers towards these types of products, which market reached USD 3.4bn in
2018 (see Figure 22). A recent study conducted in 2017, which aimed at analysing
the drivers of consumer choices with respect to dairy milk versus plant-based
alternatives, pointed out that ‘lactose-free’ is an attribute for plant-based milk
consumers, but it also highlighted that by purchasing this type of product
consumers felt they were contributing to the goal of limiting the consumption of
animal products, and therefore supporting animal welfare. Moreover, plant-based
milk consumers also perceived a lesser impact on the environment, while
maintaining a balanced diet and a healthy lifestyle (McCarty et. al, 2017)22. Mintel
also conducted a study in the US on the subject and the results showed that 65%
of the respondents bought plant-based dairy-alternatives because they deemed
those products to be healthier, while only 24% reported to buy them because they
are lactose-free (see Figure 23). The link between plant-based milk and plant-
based meat is therefore not far apart. The question to be answered is to what
extent plant-based milk consumers and normal meat consumers can be convinced
to purchase plant-based meat products.
Sales Forecast
As mentioned before, the plant-based meat market is a new and high-growth
landscape, where there is not only headroom for new players to jump in, but also
potential for Beyond Meat to consolidate its position and retain a good portion of
the costumers therein.
Given the ‘new-born’ type of company we are analysing and, in particular, by
considering the significant top-line growth showed in the past, and the one we are
modelling in the future, we did not observe any listed consumer company that is
currently comparable in terms of growth or nature to Beyond Meat. Most of the
packaged-food manufacturers that will enter the market are bigger, more mature,
and diversified than Beyond Meat, and the business of smaller high-growth
consumer staples companies is too different to be considered a good comparable
company. However, when applying our approach with plant-based milk products
we considered two brands of dairy-alternatives in order to better understand how
the market share of Beyond Meat may evolve over time. Silk and Almond Breeze
22 McCarthy, K.S., Parker, M., Ameerally, A., Drake, S.L., Drake, M.A. 2017. “Drivers of choice for fluid milk versus plant-based alternatives: What are consumer perceptions of fluid milk?” Journal of Diary Sciences 100: 6125-6138.

BEYOND MEAT, INC COMPANY REPORT
PAGE 18/32
Almond Breeze was among the first movers in the almond milk market.
95
0
5,0
50
-
1,500
3,000
4,500
6,000
2013 2015 2017 2019e 2021e 2023e
Almond milk Soymi lk
CAGR: +14.9%
Figure 26: Evolution of sales of almond milk and soymilk in the US (in millions of $)
0.6
%
0.8
%
1.0
%
1.6
%
2.1
%
2.3
%
2.5
% 2.9
%
3.4
%
3.7
%
0.1
%
0.1
%
0.1
%
0.2
%
0.2
%
0.3
%
0.3
%
0.3
%
0.4
%
0.4
%
2010 2011 2012 2013 2014 2015 2016 2017 2018 2019
US World
Figure 27: Almond Breeze market share evolution in plant-based milk products
Source: Euromonitor
40.0%
34.3%
18.2%
6.9%
0.3%
Almond Breeze
Silk Pure Almond
Priva te labe l
Ca lifia Farms
Silk
Figure 25: Market share of key almond milk brands in the US in 2019 (in % of $ sales)
63.7
20.5
17.6
12.0
10.1
8.9
7.2
Silk
Meyenberg
All R ipp le Foods
Almond Breeze
So Delicious
Good Karma
Bol thouse Farms
Figure 24: Sales of milk alternatives in 2018, by major brands (in millions of $)
Source: Statista
are two dominant brands in the plant-based milk industry, and for almond milk in
particular (see Figure 24 and 25). These two brands belong to the companies
WhiteWave Foods and Blue Diamond, respectively. We consider almond milk and
especially the brand Almond Breeze to be a good approximation of the situation
that Beyond Meat is in right now. Almond milk turned out to be a new category in
the already longer existing plant-based milk market and led Almond Breeze to
completely turn over the whole industry, being able to attract new consumers and
gaining traction from soy milk. In 2010, almond milk started to become popular and
by 2013 it had already surpassed soy milks sales by USD 150m (see Figure 26).
Beyond Meat in comparison is also operating in the already longer existing
alternative meat market. Through its innovative pea-protein food and its unique
marketing approach, Beyond Meat is also, in analogy to Almond Breeze,
significantly changing the industry, leading to an opening of the market to attract
new consumers as well as competitors.
▪ Almond Breeze – Blue Diamond
Blue Diamond is a California-based almond grower which history goes as far back
as the 1850’s. With its brand Almond Breeze, which was introduced to the market
in 2008, the company has managed to excel in the almond milk market and
became one of its main players, as shown in Figure 25 above.
As presented in Figure 27, the brand had a market share of 0.6% in 2010, when
Almond milk products started to gain traction in the US. We consider Almond
Breeze to be the first mover in this new, high-growth market back in 2010.
▪ Silk – WhiteWave Foods
Silk is a Colorado-based company that started back in 1977 with tofu-based
products to then begin the journey into milk-alternatives with soy milk at the end of
the 90’s under WhiteWave Foods. Even though there is no public financial data

BEYOND MEAT, INC COMPANY REPORT
PAGE 19/32
As a first mover back in 1996, Silk has been able to fight competition in a high-growth market by updating its product portfolio over the years.
592
1,452
-
200
400
600
800
1,000
1,200
1,400
1,600
2009 2010 2011 2012 2013 2014 2015
CAGR: +13.7%
Figure 28: WhiteWave Foods’ plant-based sales (in millions of $)
Source: Euromonitor3.7
%
3.8
%
4.1
%
4.1
%
3.7
%
3.8
%
3.7
%
0.5
%
0.5
%
0.5
%
0.6
%
0.5
%
0.5
%
0.5
%
2013 2014 2015 2016 2017 2018 2019
US World
Figure 29: Silk market share in plant-based meat products
Source: Euromonitor
available for WhiteWave during these periods, we know the company was acquired
by Dean Foods in 2002 for a deal value of EUR 209m with revenues standing at
USD 125m. After that, the company became public in 2012, and in 2016 was sold
to Danone for EUR 10,881m with revenues of c. USD 3.9bn, of which
approximately USD 1.5bn coming from its plant-based category in 2015 (see
Figure 28). By exploiting its advantage as an early-mover in the plant-based dairy
alternatives, WhiteWave was able to grow its sales from USD 592m to USD 1.5bn
in 7 years.
Silk launched PureAlmond in the market in 2010, and accordingly, is also
considered to be one of the first companies to enter the almond milk category.
However, besides almond milk, the company has evolved and updated its product
portfolio to meet changing consumer tastes and demands, and started offering
other milk alternatives like coconut, nut or soy milk throughout the years. This
continuous development of its product portfolio has helped the brand retain its
market share in a high-growth market with increasing competition (see Figure 29).
We believe that by expanding its product portfolio, Beyond Meat will be able to do
the same and retain its market share in the future. For this reason, and for the fact
that Silk is an early-mover in the dairy-alternative market, we believe the long-term
evolution in market share of this brand to be a good approximation of what we
could see for Beyond Meat in the future.
Value drivers
In order to determine the valuation of Beyond Meat we considered a 10-year
explicit forecast horizon, followed by a 10-year annuity and a terminal value. This
long time-span was chosen due to Beyond Meat’s rapid recent growth, which we
expect to prolong in the future as well as the high level of uncertainty around the
overall plant-based meat market development. We expect the company’s growth
to slow down after the 10-year forecast, to be lower in the annuity period, and to
only reach a stable state after 20 years. The main value drivers we deemed
appropriate to forecast Beyond Meat’s financial performance are outlined below.
1996 2010
2016 2011
BEYOND MEAT, INC COMPANY REPORT
PAGE 20/32
5.2%
4.7% 4.6%4.2%
3.1%3.1% 3.0%
Median 4.3%
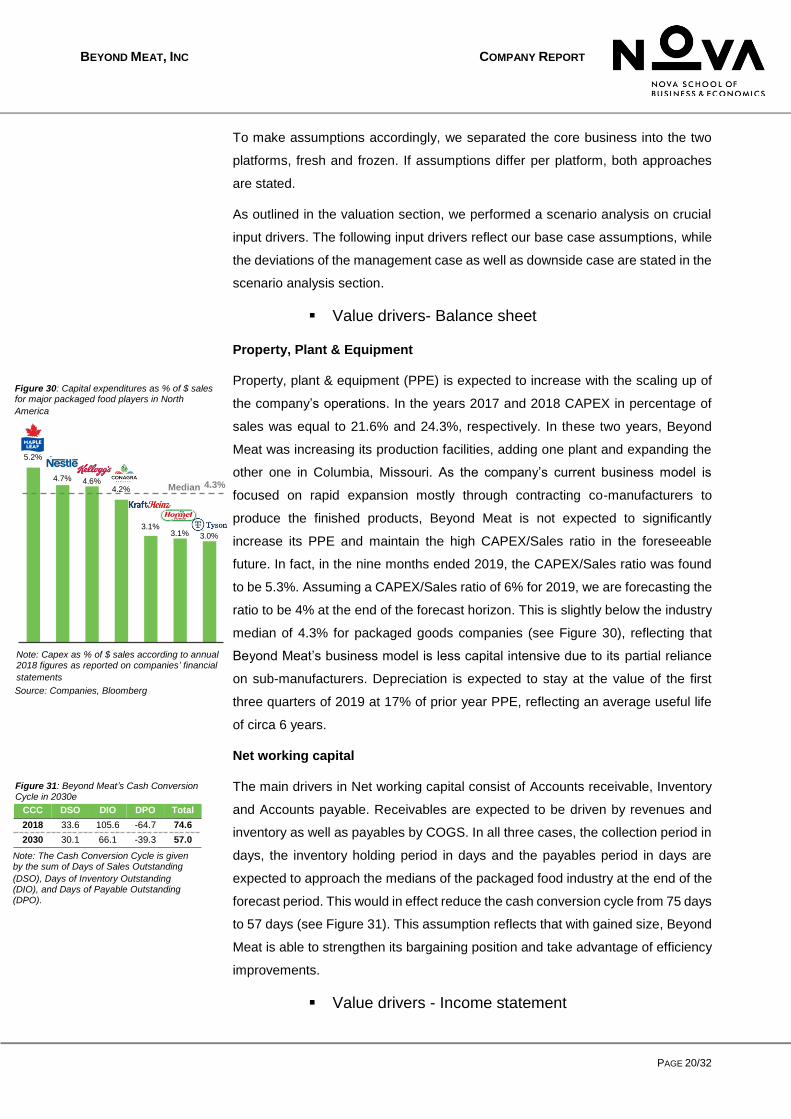
Figure 30: Capital expenditures as % of $ sales for major packaged food players in North
America
Source: Companies, Bloomberg
Note: Capex as % of $ sales according to annual 2018 figures as reported on companies’ financial
statements
CCC DSO DIO DPO Total
2018 33.6 105.6 -64.7 74.6
2030 30.1 66.1 -39.3 57.0
Figure 31: Beyond Meat’s Cash Conversion Cycle in 2030e
Note: The Cash Conversion Cycle is given by the sum of Days of Sales Outstanding
(DSO), Days of Inventory Outstanding (DIO), and Days of Payable Outstanding (DPO).
To make assumptions accordingly, we separated the core business into the two
platforms, fresh and frozen. If assumptions differ per platform, both approaches
are stated.
As outlined in the valuation section, we performed a scenario analysis on crucial
input drivers. The following input drivers reflect our base case assumptions, while
the deviations of the management case as well as downside case are stated in the
scenario analysis section.
▪ Value drivers- Balance sheet
Property, Plant & Equipment
Property, plant & equipment (PPE) is expected to increase with the scaling up of
the company’s operations. In the years 2017 and 2018 CAPEX in percentage of
sales was equal to 21.6% and 24.3%, respectively. In these two years, Beyond
Meat was increasing its production facilities, adding one plant and expanding the
other one in Columbia, Missouri. As the company’s current business model is
focused on rapid expansion mostly through contracting co-manufacturers to
produce the finished products, Beyond Meat is not expected to significantly
increase its PPE and maintain the high CAPEX/Sales ratio in the foreseeable
future. In fact, in the nine months ended 2019, the CAPEX/Sales ratio was found
to be 5.3%. Assuming a CAPEX/Sales ratio of 6% for 2019, we are forecasting the
ratio to be 4% at the end of the forecast horizon. This is slightly below the industry
median of 4.3% for packaged goods companies (see Figure 30), reflecting that
Beyond Meat’s business model is less capital intensive due to its partial reliance
on sub-manufacturers. Depreciation is expected to stay at the value of the first
three quarters of 2019 at 17% of prior year PPE, reflecting an average useful life
of circa 6 years.
Net working capital
The main drivers in Net working capital consist of Accounts receivable, Inventory
and Accounts payable. Receivables are expected to be driven by revenues and
inventory as well as payables by COGS. In all three cases, the collection period in
days, the inventory holding period in days and the payables period in days are
expected to approach the medians of the packaged food industry at the end of the
forecast period. This would in effect reduce the cash conversion cycle from 75 days
to 57 days (see Figure 31). This assumption reflects that with gained size, Beyond
Meat is able to strengthen its bargaining position and take advantage of efficiency
improvements.
▪ Value drivers - Income statement

BEYOND MEAT, INC COMPANY REPORT
PAGE 21/32
Revenues
The crucial value drivers for our model are the ones underpinning revenue
generation for Beyond Meat. By highlighting that the type of market we are dealing
with is new and with high-growth potential, as well as the length of our forecast
horizon, there is significant uncertainty involved. Our forecast is based on sales
volumes in pounds for both platforms and focused specifically on two regions, the
US (Beyond Meat’s main market), and the rest of the world. To arrive at an estimate
for revenues, we have taken the following steps:
First, we found total meat consumption in the US and the rest of the world. We
obtained data from the OECD for the forecast of total meat consumption (beef,
veal, pork, poultry, and sheep) per capita and multiplied those numbers for the
population forecast extracted from the WorldBank databases.
Second, we applied a percentage (reflecting the plant-based share) to the total
meat consumption estimated, to find the plant-based meat consumption in pounds.
As outlined earlier, we considered the plant-based milk market a good
approximation of how the plant-based meat market may develop. Thus, we applied
the percentage of retail sales in volume of the plant-based share of the milk market
to retail meat consumption volumes. By looking at the data extracted from Passport
for plant-based milk sales between 2002 and 2018, and by considering that the
stages of the two markets are similar in terms of development, we took the market
share of milk alternatives as of 2002 and applied it to the size of the meat market
in 2019 to get an estimate for the plant-based meat market. The logic for this
approach stems from the fact that dairy-alternatives started to disrupt the animal-
milk market around the end of the 90’s, and that the early-mover Silk entered the
market with soy milk in 1996. Therefore, by starting circa in 1996 and following 6
years’ time, dairy-alternatives registered a market share of 1.86% in the US. On
the other hand, meat alternatives started to become popular in the US market
around 2012, and by looking at the share of plant-based meat versus the total US
meat market after 6 years, plant-based meat alternatives registered a market share
of 1.02% for 2018 (see Appendix 2). Considering the hype created by Beyond Meat
around plant-based meat products and the announcement of several major
packaged food players to enter this high-growth industry in the near future, we
deem the share of 1.9% of the dairy-alternatives market in 2002 to be attainable
and comparable to the plant-based meat share in 2019.
As described earlier, a certain number of plant-based milk consumers were
purchasing it due to intolerances. However, by taking into account existing meat
intolerances and the fact that consumer habits are changing over time, as well as

BEYOND MEAT, INC COMPANY REPORT
PAGE 22/32
the main drivers for consumers to buy milk and meat alternatives, which nowadays
are environmental, sustainability and health reasons (McCarthy et. al, 2017)23, we
do not think that an adjustment to the dairy alternatives market share is required.
Third, given that competition will likely have a negative impact on both Beyond
Meat’s product price and market share, and that there is a high level of uncertainty
on how many players will enter the market (besides the ones we already covered)
in the future, we decided to look at comparable companies to forecast BYND’s
market share. As outlined earlier, Almond Breeze and Silk are the two brands we
will focus our attention on. We decided to look back at what share of the market
Almond Breeze was able to capture after entering the high-growth dairy-
alternatives market with almond milk in 2008. By looking at the data we obtained
from Euromonitor (see Appendix 3) we decided to take the market share of Almond
Breeze as of 2014 (6 years after launch) as our starting point for our market share
forecast in 2019. The main reason we decided to start from 2014 is because by
comparing the timing and stage of development of the two markets (plant-based
meat and milk) we discovered that year to be the closest comparable for our
forecast. 2014 was six years after the disruptive launch of Almond Breeze products
in the dairy milk industry, whereas Beyond Meat started to sell its first products in
2013, which also represents a six-year time-span until 2019. Moreover, we
assumed that the stage of development of the plant-based milk market, and in
particular of the market for almond milk, was similar to the one of the plant-based
meat market today. By comparing the CAGR between 2013 and 2018 of the sales
of plant-based milk alternatives [+9.4%] and of almond milk [+16.3%] in the US
with that of plant-based meat between 2018 and 2023e [+14.8%] we can observe
that both plant-based industries represent high-growth markets with similar
attributes and are therefore at a comparable stage of development.
More precisely, by looking at the actual numbers, Beyond Meat had a market share
of 1.93% in the US in 2018 (and 0.75% in 2016 – one year after the launch of the
Beyond Burger). Almond Breeze, in comparison, had according to the data
gathered, a share of 0.6% in the US in 2010 (two years after it introduced almond
milk to the market), and of 2.1% four years after in 2014, which represents our
starting point in 2019 (therefore assuming a gain in market share for BYND of 0.2
percentage points). Ultimately, by looking at the market share of Almond Breeze
after 10 years in 2019 and of that of Silk, which was an early-mover in the dairy-
alternatives market starting in 1996 with soy milk, and by observing how these
values have stagnated around circa 3.7% because of the more aggressive
23 McCarthy, K.S., Parker, M., Ameerally, A., Drake, S.L., Drake, M.A. 2017. “Drivers of choice for fluid milk versus plant-based alternatives: What are consumer perceptions of fluid milk?” Journal of Diary Sciences 100: 6125-6138.

BEYOND MEAT, INC COMPANY REPORT
PAGE 23/32
Prices (in $) 2018 2019E 2020E 2021E 2022E 2023E 2024E 2025E 2026E 2027E 2028E 2029E 2030E 2031E
Nominal price 6.9 6.5 6.3 6.1 5.9 5.8 5.7 5.6 5.5 5.4 5.3 5.2 5.1 5.0
Inflation adjusted price
6.9 6.5 6.5 6.4 6.4 6.4 6.4 6.4 6.4 6.4 6.5 6.5 6.5 6.5
Figure 32: Nominal and inflation adjusted prices forecast
Note: Current dollar prices are adjusted for the change in price level forecasted by the IMF
competition, which saw more and more players entering the market throughout the
years, we expect Beyond Meat market share to behave the same during the final
years of our forecast and stabilise around 4.0% for the US and 0.5% worldwide.
Fourth, to arrive at gross revenues, we need to take the sales volumes that we
obtained from the respective market share and multiply them by an assumed price.
As already discussed, due to increased competition and Beyond Meat’s
announcement to sell less expensive products, we expect prices to decrease
slightly over the forecast horizon. Currently, the Beyond Burger package sells for
USD 12 per pound in retail, which is about 4x as expensive as normal minced beef,
or about one dollar more expensive than the Incredible Burger of Nestlé (which
sells for USD 11 per pound). By assuming that competition will grow fast in the
next few years, we expect the nominal price to decrease more in the near future
than in the long-term. Starting from the average price of the first three quarters of
2019, we forecast prices to drop by 3% in the following three years and reach a
sales price of ca. one dollar less than in 2018, reflecting the price difference of one
dollar between the Beyond Burger and the Incredible Burger. In the remaining
years of the forecast, we expect the nominal price to decrease by a lower
percentage of 2% y/y, arriving at a reduction of an additional dollar less at the end
of the forecast horizon. This price erosion is partly offset by inflation forecasts (of
the US, as our main market) obtained from the IMF and used to obtain real prices
(see Figure 32).
Costs of goods sold
For the year ended 2018, after separating core and non-core businesses, we are
assuming COGS to be of USD 4.7 and USD 3.1 for fresh and frozen platform
respectively. Taking into account data collected and our own estimates, we broke
down COGS into five categories, which represent the following percentage of total
COGS: pea protein costs (11.3%), tolling fees (19.5%), spices, flavours and other
ingredients (23.5%), packaging costs (7%) as well as other costs (38.6%, include
e.g. direct labour costs, rent and other utility costs). By applying the concept of
learning curve, which assumes that by doubling the output (in our case the volumes
manufactured) the costs will fall by a certain percentage, we forecasted the
evolution of COGS per pound sold. According to research studies, the average

BEYOND MEAT, INC COMPANY REPORT
PAGE 24/32
Assumptions General Rationale
Asset beta
The unlevered beta used to calculate the WACC is an equally-weighted average of two different
betas coming from 1) a set of peers of Beyond Meat 2) a set of high growth consumer staples companies in the US
(1)
1) In light of the type of company we are analyzing, we used data for major packaged food players which are assumed to be comparables of Beyond Meat in the long-term, given the objective of the company to become a leader in the plant-based meat space. It is also important to note that all of these players are entering or have already entered the plant-based meat market. These asset betas were also adjusted for cash to better reflect the
riskiness of operations of the companies2) Beyond Meat is a high-growth company and as such it will incorporate a greater risk in its
operations, at least in the medium-term, with respect to more mature packaged food players. To correct for this factor we have taken the asset beta of a set of high-growth consumer staples companies in the US
Risk free rate
The risk-free rate used in the WACC calculations
is the yield of a 10-year US treasury note as of November 2019. The yield is equal to 1.94%.
Beyond Meat is based in the US and as per in its last available financial statements, 83% of its sales are coming from this geography. According to the company's management, the US
will remain the main target market while trying to expand and grow internationally in Europe and Asia
Market risk premium
The market risk premium used is the equity risk premia of US companies in 2019 taken from Damodaran NYU Stern database. The premium
equals 5.96%
By following the same rationale assumed for the risk-free rate, Beyond Meat is undertaking and will focus most of its operations in the US
Cost of debt
The cost of debt used in our WACC computations is obtained by adding to the 10-year US risk free rate, an implied credit spread
found using the following formula: YTM -Probability of Default × Loss Given Default; the
credit spread was computed by looking at the current bond outstanding in the market for the same set of peers used for the unlevered betas
in 1)
The rationale behind this approach stems from the fact that in the long-term, we expect Beyond Meat to have a credit quality which will be similar to the one of major US packaged food companies. The financial risk incurred by Beyond Meat's bondholders in the future is
therefore reflected in this credit spread
Capital structure: target D/E
Given our approach to compute Beyond Meat's
discounted cash flow, it is reasonable to assume two different capital structures for Beyond Meat: 1) for the first 10 years of operations, given its
high-growth stage 2) for the following years, a
different capital structure to be reflected in the annuity (over 10 years) and perpetuity calculations
The rationale behind the use of two different target D/E ratios, lies behind the fact that the implied capital structure forecasted by our model in 2031 presents a D/E ratio of 1.1%,
which is not in line with the packaged food industry median of 21%, and therefore may well not reflect the capital structure that Beyond Meat will likely have in the future when it will be a more mature player.
1) For the explicit forecast period we have used the D/E ratio implied by our model at the
end of 2031 to compute the WACC. According to our model, the D/E ratio of is 2.2%;2) For the following years, we have instead used the median D/E ratio of the packaged food industry of 21%
Implied debt beta
Given that in the annuity and perpetuity period we assumed a target D/E ratio for our model, we
had to calculate the riskiness of the debt of the company in order to compute the levered beta of Beyond Meat
Usually, a constant debt level would imply that the debt bears no risk, as it is the case in the explicit forecast period. On the other hand, a constant D/EV ratio would imply that the
company repurchases equity by issuing new debt every time the firm value rises, and issues equity to retire debt every time the firm value decreases. Therefore, and in the extreme case, the tax savings from debt issuance are perfectly correlated with the value of
the unlevered assets of the firm, implying BU=BTS(1)
. Both assumptions are deemed to be too simplistic for our model in the annuity and perpetuity period, and thus we have
calculated the riskiness of the debt of the company given the cost of debt and the equity risk premia
Re-levered equity beta
The re-levered equity beta for Beyond Meat was computed for both target D/E ratios. Therefore,
once we re-levered the asset beta with a D/E ratio of 2.2% (for the first 10 years), while the second time we re-levered the asset beta with a
D/E ratio of 21% (annuity and perpetuity)
Cost of equity
The cost of equity was computed by following
CAPM, given the risk-free rate and the equity risk premia outlined above
Table 2: Assumptions for the calculation of the weighted average cost of capital of Beyond Meat
Note: The table presents the assumptions made to calculate the discount rate used (WACC) for Beyond Meat’s valuation; (1) the two sets of companies are presented in the section above “Beta”; (2) BU refers to the asset beta while BTS refers to the beta of the tax shield. All the
formulas used are presented in the financial model; and the values presented in the table are sourced from Bloomberg as of November 2019.
Refer to Appendix 4 for the implied credit spread used in the calculation of the cost of debt; and to Appendix 5 for the two WACC obtained.
cost reduction of raw material lies between 5% and 7%24. For our base case
assumption, we assumed the learning rate to be 6.5%.
R&D Expenses
Beyond Meat is heavily dependent on research and development, as improved
and new products are expected to be presented by the company in the upcoming
years. Therefore, R&D expenses are forecasted to exceed the median industry
R&D/Sales ratio of 0.5%. By assuming a steady increase in R&D personnel (the
main cost factor in R&D expenses) and a slightly rising R&D/employee rate, R&D
spending is forecasted to be approximately 5% of sales in 2019. This percentage
is expected to decrease over the forecast horizon, reaching a value of 3% at the
end of the period.
SG&A
SG&A expenses consists primarily of outbound freight and personnel costs. SG&A
in percentage of revenues declined sharply from 2016 to 2018, dropping from 78%
to 39% overall. In the nine months ended 2019, this trend continued with SG&A
expenses representing 24% of net revenues. We expect the ratio to approach the
industry median of 17.5% in the forecast period.
Valuation
WACC
Given the type of company we are analysing (high-growth, early stage), we
assumed two different target capital structures to compute the weighted average
cost of capital for Beyond Meat. The assumptions made to calculate the cost of
capital for the explicit 10 years forecast period, and the annuity and perpetuity
period, are outlined in the table below (see Table 2). The values found for Beyond
Meat for the two periods are 6.1% and 5.8% respectively and are presented in
Appendix 5.
24 Strategos. 2014. “Learning & Experience Curves in Manufacturing.” Accessed December 27. http://www.strategosinc.com/downloads/learning-curves-dl1.pdf

BEYOND MEAT, INC COMPANY REPORT
PAGE 25/32
Assumptions General Rationale
Asset beta
The unlevered beta used to calculate the WACC
is an equally-weighted average of two different
betas coming from 1) a set of peers of Beyond
Meat 2) a set of high growth consumer staples
companies in the US (1)
1) In light of the type of company we are analyzing, we used data for major packaged food
players which are assumed to be comparables of Beyond Meat in the long-term, given the
objective of the company to become a leader in the plant-based meat space. It is also
important to note that all of these players are entering or have already entered the plant-
based meat market. These asset betas were also adjusted for cash to better reflect the
riskiness of operations of the companies
2) Beyond Meat is a high-growth company and as such it will incorporate a greater risk in its
operations, at least in the medium-term, with respect to more mature packaged food
players. To correct for this factor we have taken the asset beta of a set of high-growth
consumer staples companies in the US
Risk free rate
The risk-free rate used in the WACC calculations
is the yield of a 10-year US treasury note as of
November 2019. The yield is equal to 1.94%.
Beyond Meat is based in the US and as per in its last available financial statements, 83% of
its sales are coming from this geography. According to the company's management, the US
will remain the main target market while trying to expand and grow internationally in Europe
and Asia
Market risk premium
The market risk premium used is the equity risk
premia of US companies in 2019 taken from
Damodaran NYU Stern database. The premium
equals 5.96%
By following the same rationale assumed for the risk-free rate, Beyond Meat is undertaking
and will focus most of its operations in the US
Cost of debt
The cost of debt used in our WACC
computations is obtained by adding to the 10-
year US risk free rate, an implied credit spread
found using the following formula: YTM -
Probability of Default × Loss Given Default; the
credit spread was computed by looking at the
current bond outstanding in the market for the
same set of peers used for the unlevered betas
in 1)
The rationale behind this approach stems from the fact that in the long-term, we expect
Beyond Meat to have a credit quality which will be similar to the one of major US packaged
food companies. The financial risk incurred by Beyond Meat's bondholders in the future is
therefore reflected in this credit spread
Capital structure: target D/E
Given our approach to compute Beyond Meat's
discounted cash flow, it is reasonable to assume
two different capital structures for Beyond Meat:
1) for the first 10 years of operations, given its
high-growth stage 2) for the following years, a
different capital structure to be reflected in the
annuity (over 10 years) and perpetuity
calculations
The rationale behind the use of two different target D/E ratios, lies behind the fact that the
implied capital structure forecasted by our model in 2031 presents a D/E ratio of 1.1%,
which is not in line with the packaged food industry median of 21%, and therefore may well
not reflect the capital structure that Beyond Meat will likely have in the future when it will be
a more mature player.
1) For the explicit forecast period we have used the D/E ratio implied by our model at the
end of 2031 to compute the WACC. According to our model, the D/E ratio of is 2.2%;
2) For the following years, we have instead used the median D/E ratio of the packaged food
industry of 21%
Implied debt beta
Given that in the annuity and perpetuity period
we assumed a target D/E ratio for our model, we
had to calculate the riskiness of the debt of the
company in order to compute the levered beta of
Beyond Meat
Usually, a constant debt level would imply that the debt bears no risk, as it is the case in the
explicit forecast period. On the other hand, a constant D/EV ratio would imply that the
company repurchases equity by issuing new debt every time the firm value rises, and
issues equity to retire debt every time the firm value decreases. Therefore, and in the
extreme case, the tax savings from debt issuance are perfectly correlated with the value of
the unlevered assets of the firm, implying BU=BTS(1)
. Both assumptions are deemed to be
too simplistic for our model in the annuity and perpetuity period, and thus we have
calculated the riskiness of the debt of the company given the cost of debt and the equity risk
premia
Re-levered equity beta
The re-levered equity beta for Beyond Meat was
computed for both target D/E ratios. Therefore,
once we re-levered the asset beta with a D/E
ratio of 2.2% (for the first 10 years), while the
second time we re-levered the asset beta with a
D/E ratio of 21% (annuity and perpetuity)
Cost of equity
The cost of equity was computed by following
CAPM, given the risk-free rate and the equity
risk premia outlined above
Table 2: Assumptions for the calculation of the weighted average cost of capital of Beyond Meat
Note: The table presents the assumptions made to calculate the discount rate used (WACC) for Beyond Meat’s valuation; (1) the two sets of companies are presented in the section above “Beta”; (2) BU refers to the asset beta while BTS refers to the beta of the tax shield. All the
formulas used are presented in the financial model; and the values presented in the table are sourced from Bloomberg as of November 2019.
Refer to Appendix 4 for the implied credit spread used in the calculation of the cost of debt; and to Appendix 5 for the two WACC obtained.
Peers Unlevered beta
Nestlè 0.58
Kellogg's 0.35
Tyson Foods 0.49
Conagra 0.60
Hormel Foods 0.35
Kraft Heinz 0.51
Maple Foods 0.33
Median 0.49
Average 0.46
Table 3: Assumptions for the calculation of the weighted average cost of capital of
Beyond Meat
Note: The table presents the unlevered betas for the major packaged food
players in North America, these are also
considered to be competitors of Beyond Meat
Beta
To estimate the beta, we utilised the historical approach on two different sets of
companies. On one hand, direct competitors of Beyond Meat, which are mature
players in the packaged-food industry, on the other, a set of high-growth (s)mid-
cap consumer staples.
After having calculated the beta for each of these companies by having regressed
individual weekly excess stock returns on excess market returns – calculated with
respect to the relevant market index, which was dependent on the location of the
company’s operations – over a period of 3 years, we unlevered and adjusted them
for cash, and looked at the medians of the two sets. By computing an equally
weighted average of these two values we came up with an initial asset beta of 0.7
for Beyond Meat’s operations. Ultimately, by re-levering the beta with the two
different target D/E ratios presented in Table 2 above, we obtained a levered beta
of 0.7 and 0.8 for the explicit forecast period and the annuity and perpetuity period,
respectively. Table 3 and 4 on side show the unlevered betas for the two sets.

BEYOND MEAT, INC COMPANY REPORT
PAGE 26/32
Market share in the US 2029E 2030E 2031E
Management case 4.90% 4.95% 5.00%
Base case 4.00% 4.00% 4.00%
Downside case 3.70% 3.70% 3.70%
Figure 33: Beyond Meat’s market share in the US
Discounted Cashflow Method
In order to find a price per share for Beyond Meat at year-end 2020, we applied
the discounted cashflow method, using the forecast values described above. The
DCF valuation can be split into three parts, the explicit forecast period of 10 years,
the annuity period of 10 years, and the terminal value. The annuity value formula
was applied in the year of 2031. The period of 10 years was chosen, as we believe
the company will still be able to show higher than economy growth rates throughout
the annuity time frame.
The assumed annuity growth rate and RONIC of the fresh platform for the base
case are 7% and 25%, respectively, following the development in the last years.
The terminal growth rate used is 3% and reflects a weighted average of the latest
GDP growth forecasts of our assumptions of BYND’s prospective main markets,
US (50%), Europe (40%) and Asia (10%), as we believe that the US will remain
the main market, while Europe and Asia will follow afterwards. Assumed fresh
platform base case RONIC for the terminal value is 12.5%, as we expect the
company to retain competitive advantage and a strong brand in the future. By
discounting these values at a mid-year discount rate equal to the WACC (see
Appendix 5) we arrived at the value of the core business, and by adding the value
of non-core business as well as excess cash we arrived at the enterprise value.
When dealing with high-growth companies, and therefore being confronted with a
high level of uncertainty, the best approach is to find the value per share as a
weighted average of different scenarios (Koller et al., 2010)25. As outlined in the
forecast section, in our case, we assumed three different scenarios: base,
management, and downside case. All details in the forecast section are stated for
the base case. For the management and downside cases, we focused on the value
drivers considered to be of crucial importance for success or failure. Reasons for
inclusion and derivations of the most important drivers thereof to the base case are
outlined in the paragraph below.
Scenario Analysis
• Market share of Beyond Meat
Market share is in our point of view the most important value driver, as
Beyond Meat’s prospective success depends heavily on how much share
of the market the company can grasp. We assume in the Management
case that the company’s US and worldwide market share will converge to
5% and 1%, respectively. We believe, that these values represent an
25 Koller, Tim., Goedhart, Marc., and David Wessels. 2010. Valuation: Measuring and Managing the Value of Companies. New York: John Wiley & Sons, Inc.

BEYOND MEAT, INC COMPANY REPORT
PAGE 27/32
Market share in the World 2029E 2030E 2031E
Management case 0.95% 0.98% 1.00%
Base case 0.50% 0.50% 0.50%
Downside case 0.40% 0.40% 0.40%
Figure 34: Beyond Meat’s market share in the World
upper bound of future market share considering the competitive
environment Beyond Meat will be facing. For the downside case, US and
worldwide market share will converge to 3.7% and 0.4%, respectively
(reflecting the market share Almond Breeze was able to capture). The
factors for success are deeply linked with Beyond Meat’s ability to
introduce new product lines and to expand into new markets in the future.
• COGS learning rate
The development of COGS and therefore the Gross Margin, is a crucial
cost metric for the company to turn profitable. We assumed the learning
rate for the management case to equal 7%, which according to research
studies is the highest achievable learning rate for raw materials. For the
downside, we believe the learning rate to be equal to 6%, 0.5% lower than
in the base case. These assumptions led to a Gross Margin of 42%, 38%
and 36% for the three scenarios, respectively, at the end of the forecast
period. The company itself announced to target a Gross Margin in the
upper region between 35% and 40%. Decisive factors for this development
will be the company’s ability to make use of higher bargaining power and
economies of scale.
• Annuity and Terminal value
Annuity RONIC for the fresh platform is assumed to be 30% and 15%,
while annuity growth rate is assumed to be 10% and 6% for management
and downside cases, respectively. Terminal value RONIC is assumed at
15% and 7.5% for management and downside cases, respectively.
Reflecting the long-term development of the company under each
scenario.
Deducting from the enterprise value the market value of debt and the value of
employee stock options, gives us three equity values for the respective scenarios.
The total value of employee stock options is found by forecasting outstanding stock
options at year-end 2020 and valuing them with the Black-Scholes formula. By
dividing the three equity values by stocks outstanding of 60,565,840, we arrived at
value per share of 219.3, 60.0 and 20.9 for the management, base, and downside
cases, respectively. As we believe the base case to be the most likely outcome,
weights for the scenarios were assumed to be 25%, 50% and 25% respectively, to
find a value per share for Beyond Meat at December 31, 2020 of USD 90.05.

BEYOND MEAT, INC COMPANY REPORT
PAGE 28/32
Plant-based meat market 2016 2017 2018
Growth of plant-based meat $ sales - 25.2% 10.0%
US Plant-based retail meat market (in million $) 584 731 801
US Retail meat market (in million $) 76257 76693 78459
US Plant-based share (% of retail volume sales) 0.77% 0.95% 1.02%
Appendix 2: Plant-based meat market share over the last 3-years
Plant-based milk brands penetration 2010 2011 2012 2013 2014 2015 2016 2017 2018 2019
Market share (in %)
US
Almond Breeze 0.6% 0.8% 1.0% 1.6% 2.1% 2.3% 2.5% 2.9% 3.4% 3.7%
Silk (WhiteWave Foods) - - - 3.7% 3.8% 4.1% 4.1% 3.7% 3.8% 3.7%
World
Almond Breeze 0.1% 0.1% 0.1% 0.2% 0.2% 0.3% 0.3% 0.3% 0.4% 0.4%
Silk (WhiteWave Foods) - - - 0.5% 0.5% 0.5% 0.6% 0.5% 0.5% 0.5%
Appendix 3: Almond Breeze and Silk brand market share penetration since 2010
Appendix 1: Trademarks registered and filed
Source: Company
Name Status Name Status
BEYOND BURGER Registered BEYOND SPLIT SAUSAGE Application
BEYOND SAUSAGE Registered BEYOND DAY Application
THE FUTURE OF PROTEIN BEYOND MEAT Registered BEYOND BURRITO Application
THE COOKOUT CLASSIC Registered BEYOND JERKY Application
THE BEYOND BURGER Registered BEYOND BURRITO Application
THE FUTURE OF PROTEIN Registered BEYOND NUGGETS Application
BEYOND BEEF Registered BEYOND HOT DOGS Application
BEYOND CHICKEN Registered BEYOND GROUND Application
BEYOND MEAT Registered BEYOND LAMB Application
BEYOND MEAT Registered BEYOND TUNA Application
BYND Application BEYOND SHRIMP Application
GO BEYOND Application BEYOND FISH Application
BEYOND FRIED CHICKEN Application BEYOND CRAB Application
BEYOND BONELESS WINGS Application BEYOND HAM Application
BEYOND BRUNCH Application BEYOND PORK Application
BEYOND MEATBALLS Application BEYOND TURKEY Application
BEYOND CHILI Application BEYOND BREAKFAST SAUSAGE Application
BEYOND MEATBALL Application EAT WHAT YOU LOVE Application
PeersWeighted average
YTMWeighted average
maturityRating (Moody's /
S&P)PD LGD
Implied credit spread
Conagra 3.8% 9 Baa3/BBB- 3.11% 54% 2.15%
Kellogg's 2.5% 7 Baa2/BBB 2.41% 54% 1.17%
Kraft Heinz 4.3% 13 Baa3/BBB- 4.32% 54% 1.95%
Nestle 1.5% 9 Aa2/AA- 0.66% 54% 1.17%
Tyson Foods 3.3% 12 Baa2/BBB 4.06% 54% 1.15%
Hormel Foods 2.2% 10 A1/A 1.28% 54% 1.54%
Averaga 2.9% 1.52%
Median 2.9% 1.36%
Appendix 4: Implied credit spread for packaged food peers
Note: The table presents the average and median credit spread implied by the formula [Credit spread = YTM – (PD × LGD)], where PD is the ‘probability of default’ and LGD is the ‘loss given default’, or
recovery rate, for a given credit rating and maturity. These two values were sourced from S&P Global
and Moody’s, respectively. The weighted average Yield to Maturity (YTM) and weighted average maturity are calculated with respect to the portfolio of bond outstanding as of November 2019 for each
peer.
Appendix

BEYOND MEAT, INC COMPANY REPORT
PAGE 29/32
Actuals Financial Forecast
Fresh Platform 2016A 2017A 2018A 2019E 2020E 2021E 2022E 2023E 2024E 2025E 2026E 2027E 2028E 2029E 2030E 2031E
Fresh Platform Revenues 813 18 109 81 686 331 527 452 516 507 245 604 523 803 315 892 854 1 124 988 1 275 265 1 452 596 1 614 837 1 630 271 1 645 605 1 661 914
Discount (122) (2 458) (8 076) (29 837) (40 726) (45 652) (54 407) (72 298) (80 357) (101 249) (114 774) (130 734) (145 335) (146 724) (148 104) (149 572)
Net revenue 691 15 651 73 610 301 689 411 789 461 593 550 116 731 017 812 497 1 023 739 1 160 491 1 321 863 1 469 502 1 483 547 1 497 500 1 512 342
COGS, net 902 15 526 55 777 208 101 279 632 314 396 373 092 484 061 532 911 658 927 739 115 832 766 917 382 923 876 930 284 937 175
Gross Profit (212) 125 17 833 93 589 132 157 147 197 177 024 246 955 279 586 364 812 421 377 489 097 552 120 559 671 567 216 575 166
R&D expenses, net 242 2 639 7 078 15 300 18 975 22 750 26 625 28 800 31 025 33 300 35 625 38 000 40 425 42 900 46 413 50 000
SG&A, net 517 7 460 27 249 72 405 96 599 105 782 123 088 159 605 172 994 212 426 234 516 259 966 281 042 275 692 270 174 264 660
Stock-based compensation 30 240 1 842 6 631 8 145 8 116 8 463 9 640 8 929 9 000 8 927 8 716 9 689 8 151 8 228 8 310
Depreciation and amortization 56 1 239 3 818 4 774 6 983 9 807 12 511 15 443 19 336 23 068 27 705 32 373 37 184 41 919 45 542 48 232
EBT (1 057) (11 454) (22 154) (5 522) 1 455 742 6 337 33 468 47 302 87 019 114 604 150 042 183 780 191 008 196 860 203 965
NOPLAT Fresh platform (691) (7 475) (17 019) (5 522) (504) (1 054) 5 400 31 418 44 698 77 725 88 823 116 886 143 354 149 390 153 999 159 596
Frozen Platform 2016A 2017A 2018A 2019E 2020E 2021E 2022E 2023E 2024E 2025E 2026E 2027E 2028E 2029E 2030E 2031E
Frozen Platform Revenues 18 236 19 588 15 896 22 198 30 612 34 668 41 743 55 469 61 652 77 681 88 058 100 302 111 505 112 571 113 630 114 756
Discount (2 745) (2 658) (1 572) (1 998) (2 755) (3 120) (3 757) (4 992) (5 549) (6 991) (7 925) (9 027) (10 035) (10 131) (10 227) (10 328)
Net revenue 15 491 16 930 14 324 20 201 27 857 31 548 37 986 50 477 56 103 70 690 80 132 91 275 101 470 102 439 103 403 104 428
COGS, net 19 552 16 246 10 583 13 466 18 141 20 296 24 049 31 202 34 601 42 783 47 990 54 070 59 564 59 986 60 402 60 850
Gross Profit (4 060) 684 3 741 6 735 9 716 11 252 13 937 19 275 21 502 27 906 32 143 37 205 41 905 42 453 43 001 43 578
R&D expenses 5 366 2 802 1 288 2 147 2 624 3 101 3 578 3 816 4 055 4 294 4 532 4 771 5 009 5 128 5 486 5 844
SG&A, net 11 595 8 070 5 303 5 328 7 181 7 945 9 340 12 111 13 127 16 119 17 795 19 726 21 325 20 919 20 501 20 082
Stock-based compensation 670 260 358 444 551 555 584 666 617 621 616 602 669 563 568 574
Depreciation and amortization 2 018 1 942 1 103 415 607 853 1 088 1 343 1 681 2 006 2 409 2 815 3 233 3 645 3 960 4 194
EBT (23 709) (12 389) (4 311) (1 599) (1 247) (1 202) (653) 1 339 2 022 4 867 6 790 9 291 11 668 12 198 12 486 12 884
NOPLAT Frozen platform (15 569) (8 100) (3 267) (1 599) (1 247) (1 202) (653) 1 200 1 863 4 322 5 243 7 223 9 088 9 529 9 756 10 069
Appendix 6: Pro-forma Income Statement
Actuals Financial Forecast
Core invested capital 2016A 2017A 2018A 2019E 2020E 2021E 2022E 2023E 2024E 2025E 2026E 2027E 2028E 2029E 2030E 2031E
Operating cash 502 1 010 2 726 10 277 14 028 15 725 18 740 24 903 27 678 34 875 39 533 45 030 50 060 50 538 51 014 51 519
Accounts receivable 879 3 581 12 626 29 553 40 212 44 935 53 385 70 671 78 248 98 214 110 906 125 841 139 354 140 139 140 905 141 744
Inventory 6 185 8 144 30 257 62 212 81 060 88 246 101 313 127 037 135 062 160 994 173 850 188 289 199 059 192 048 184 902 177 730
Prepaid expenses and other
current assets437 1 209 1 472 3 109 4 151 4 549 5 297 6 869 7 445 9 142 10 092 11 188 12 095 11 864 11 627 11 390
PPE, net 10 277 14 118 30 527 44 651 62 706 79 991 98 738 123 632 147 492 177 140 206 990 237 748 268 024 291 186 308 389 320 634
CAPEX - 7 022 21 330 19 313 25 646 27 945 32 346 41 680 44 878 54 721 59 963 65 946 70 694 68 726 66 704 64 671
Accounts payable (2 540) (6 276) (17 247) (37 884) (49 050) (53 037) (60 448) (75 203) (79 277) (93 633) (100 102) (107 237) (112 020) (106 656) (101 197) (95 701)
Wages payable (395) (547) (1 255) (1 720) (2 000) (2 400) (2 800) (3 600) (4 050) (4 500) (4 950) (5 175) (5 400) (6 250) (6 250) (6 250)
Accrued expenses and other
current liabilities(387) (505) (2 391) (5 710) (7 623) (8 353) (9 727) (12 613) (13 671) (16 787) (18 533) (20 544) (22 209) (21 787) (21 351) (20 915)
Invested capital core business 15 117 21 110 57 111 105 938 145 465 171 876 207 146 265 215 302 839 370 374 423 374 481 504 536 039 558 227 575 249 587 432
Appendix 7: Pro-forma Balance Sheet
Ethan Brown, CEO and President Mark J. Nelson, CFO Sanjay Shah, COO
Mr. Brown is the founder of Beyond Meat and has served as CEO and President since 2009. Mr. Brown began his career
with a focus on clean energy and the environment, serving as an energy analyst for the National Governors’ Centre for Best Practices. He then joined Ballard Power Systems, a hydrogen
fuel-cell company where he worked for several years before leaving to found Beyond Meat.
Mr. Nelson is CFO and Treasurer at Beyond Meat and had previously held the role of COO in 2017 as well. In September
2018, when he was appointed as Treasurer, he also resigned from the COO position to solely focus on the IPO. He served briefly as CFO at Biolase, a medical device company, and
also at Farmer Bros, where he had the role for two years.
Mr. Shah recently joined the company in September 2019 as COO. Before working in energy operations at Tesla as Senior
Vice President, he held a variety of leadership roles at Amazon from 2011 to 2018, another high-growth business. His curriculum also counts two other important roles in the
sales and operations spectrum: as Managing Director for MFG Southeast Asia, and as Executive Director at Dell. As
COO, Mr. Shah is potentially a capable candidate to lead Beyond Meat through its capacity expansion to match planned sales.
Appendix 8: Management and key board members
Note: Bio of key management as stated on the company website. https://investors.beyondmeat.com/corporate-governance.

BEYOND MEAT, INC COMPANY REPORT
PAGE 30/32
Disclosures and Disclaimers
Report Recommendations
Buy Expected total return (including expected capital gains and expected dividend yield)
of more than 10% over a 12-month period.
Hold Expected total return (including expected capital gains and expected dividend yield)
between 0% and 10% over a 12-month period.
Sell Expected negative total return (including expected capital gains and expected
dividend yield) over a 12-month period.
This report was prepared by Stefan Mayrl (33994) and Andrea Verzegnassi (33809), Master in Finance
students of Nova School of Business and Economics (“Nova SBE”), within the context of the Field Lab – Equity
Research.
This report is issued and published exclusively for academic purposes, namely for academic evaluation and
master graduation purposes, within the context of said Field Lab – Equity Research. It is not to be construed
as an offer or a solicitation of an offer to buy or sell any security or financial instrument.
This report was supervised by a Nova SBE faculty member, acting merely in an academic capacity, who revised
the valuation methodology and the financial model.
Given the exclusive academic purpose of the reports produced by Nova SBE students, it is Nova SBE
understanding that Nova SBE, the author, the present report and its publishing, are excluded from the persons
and activities requiring previous registration from local regulatory authorities. As such, Nova SBE, its faculty
and the author of this report have not sought or obtained registration with or certification as financial analyst by
any local regulator, in any jurisdiction. In Portugal, neither the author of this report nor his/her academic
supervisor is registered with or qualified under COMISSÃO DO MERCADO DE VALORES MOBILIÁRIOS (“CMVM”, the
Portuguese Securities Market Authority) as a financial analyst. No approval for publication or distribution of this
report was required and/or obtained from any local authority, given the exclusive academic nature of the report.
The additional disclaimers also apply:
USA: Pursuant to Section 202 (a) (11) of the Investment Advisers Act of 1940, neither Nova SBE nor the author
of this report are to be qualified as an investment adviser and, thus, registration with the Securities and
Exchange Commission (“SEC”, United States of America’s securities market authority) is not necessary.
Neither the author nor Nova SBE receive any compensation of any kind for the preparation of the reports.

BEYOND MEAT, INC COMPANY REPORT
PAGE 31/32
Germany: Pursuant to §34c of the WpHG (Wertpapierhandelsgesetz, i.e., the German Securities Trading Act),
this entity is not required to register with or otherwise notify the Bundesanstalt für Finanzdienstleistungsaufsicht
(“BaFin”, the German Federal Financial Supervisory Authority). It should be noted that Nova SBE is a fully-
owned state university and there is no relation between the student’s equity reports and any fund raising
programme.
UK: Pursuant to section 22 of the Financial Services and Markets Act 2000 (the “FSMA”), for an activity to be
a regulated activity, it must be carried on “by way of business”. All regulated activities are subject to prior
authorization by the Financial Conduct Authority (“FCA”). However, this report serves an exclusively academic
purpose and, as such, was not prepared by way of business. The author - a Master’s student - is the sole and
exclusive responsible for the information, estimates and forecasts contained herein, and for the opinions
expressed, which exclusively reflect his/her own judgment at the date of the report. Nova SBE and its faculty
have no single and formal position in relation to the most appropriate valuation method, estimates or projections
used in the report and may not be held liable by the author’s choice of the latter.
The information contained in this report was compiled by students from public sources believed to be reliable,
but Nova SBE, its faculty, or the students make no representation that it is accurate or complete, and accept
no liability whatsoever for any direct or indirect loss resulting from the use of this report or of its content.
Students are free to choose the target companies of the reports. Therefore, Nova SBE may start covering
and/or suspend the coverage of any listed company, at any time, without prior notice. The students or Nova
SBE are not responsible for updating this report, and the opinions and recommendations expressed herein may
change without further notice.
The target company or security of this report may be simultaneously covered by more than one student.
Because each student is free to choose the valuation method, and make his/her own assumptions and
estimates, the resulting projections, price target and recommendations may differ widely, even when referring
to the same security. Moreover, changing market conditions and/or changing subjective opinions may lead to
significantly different valuation results. Other students’ opinions, estimates and recommendations, as well as
the advisor and other faculty members’ opinions may be inconsistent with the views expressed in this report.
Any recipient of this report should understand that statements regarding future prospects and performance are,
by nature, subjective, and may be fallible.
This report does not necessarily mention and/or analyze all possible risks arising from the investment in the
target company and/or security, namely the possible exchange rate risk resulting from the security being
denominated in a currency either than the investor’s currency, among many other risks.
The purpose of publishing this report is merely academic and it is not intended for distribution among private
investors. The information and opinions expressed in this report are not intended to be available to any person
other than Portuguese natural or legal persons or persons domiciled in Portugal. While preparing this report,
students did not have in consideration the specific investment objectives, financial situation or particular needs

market. This would make it much higher than the market potential we are assuming in our
valuation model. Therefore, it can be concluded that cultured meat might limit the growth
potential of plant-based meat in the future. However, Beyond Meat is not expected to
significantly suffer from loss of sales and therefore our target price is assumed to remain intact.
References
ATKearney. 2019. “How Will Cultured Meat and Meat Alternatives Disrupt the Agricultural
and Food Industry?.” Accessed December 23.
https://www.atkearney.com/retail/article/?/a/how-will-cultured-meat-and-meat-alternatives-
disrupt-the-agricultural-and-food-industry-.
Barclays. 2019. “Carving up the alternative meat market.” Accessed December 28, 2019.
https://www.investmentbank.barclays.com/our-insights/carving-up-the-alternative-meat-
market.html.
BCC Research. 2019. “Synthetic (Cultured) Meat: Technologies and Global Markets.“
Accessed December 28, 2019. https://www.bccresearch.com/market-
research/biotechnology/synthetic-cultured-meat.html.
Cassidy, Laura. 2018. “Clean Meat.” Inform magazine February 2018.
https://www.aocs.org/stay-informed/inform-magazine/featured-articles/clean-meat-february-
2018.
Good Food Institute 2018. “Growing Meat sustainably: The clean meat revolution.” Accessed
December 23, 2019. https://www.gfi.org/images/uploads/2018/10/CleanMeatEvironment.pdf.
MarketsandMarkets. 2019. “Cultured Meat Market.“ Accessed December 28, 2019.
https://www.marketsandmarkets.com/Market-Reports/cultured-meat-market-204524444.html.
Mosa Meat. 2019. “Company website” Accessed December 22, 2019.
https://www.mosameat.com/.
Reports and Data. 2019. “Cultured Meat Market Analysis.“ Accessed December 28, 2019.
https://www.reportsanddata.com/report-detail/cultured-meat-market.

A Work Project, presented as part of the requirements for the Award of a Master Degree in Finance from the
NOVA – School of Business and Economics.
PRIVATE LABEL: ANALYSIS OF STORE BRANDS
PENETRATION IN THE PLANT-BASED MEAT
MARKET AND ITS IMPACT ON BEYOND MEAT’S
MARKET SHARE
ANDREA VERZEGNASSI 33809
A Project carried out on the Master in Finance Program, under the supervision of:
Filipa Frade de Castro
03-01-2020

Abstract
This report aims at analyzing the potential impact of private label penetration in
the plant-based meat market on Beyond Meat’s future market share. By
revolving around the main product attributes of the Beyond Meat brand,
namely, health and sustainability, this analysis investigates for similarities in
the drivers for private-label offerings and consumers’ purchasing behavior
towards store brands, and the demand for healthier and more sustainable
products. The results of this analysis point into the direction that Beyond
Meat’s market share will not be materially impacted by competitive private-
label offerings in the future.
Keywords
Beyond Meat, plant-based, private-label, market penetration
This work used infrastructure and resources funded by Fundação para a Ciência e a Tecnologia
(UID/ECO/00124/2013, UID/ECO/00124/2019 and Social Sciences DataLab, Project 22209), POR
Lisboa (LISBOA-01-0145-FEDER-007722 and Social Sciences DataLab, Project 22209) and POR Norte
(Social Sciences DataLab, Project 22209).

1. Introduction
This report aims at analyzing the likelihood of private label penetration in plant-based meat
products through an examination of the existing market data and literature available on the
topic. The main rationale of this study stems from the impact that private labels could have on
Beyond Meat’s share of the market. Are private label brands able to compete in this high-growth
and still early-stage market? And what could be the consequences for Beyond Meat? This report
investigates these two questions around the main product attributes exhibited by the Beyond
Meat brand, namely, health and sustainability.
Before discussing what drives consumer demands for private label products in the packaged
food industry, it is relevant to show which were the latest development in this category, and in
particular, the extent to which private label has been increasing its market share throughout the
years in both, US and Europe.
To this extent, it is worthwhile to highlight the recent roll-out of the Next Level Burger by Lidl,
which this summer introduced its plant-based patties in 3,200 of its German outlets. Another
important European retail player that is worth to mention is Aldi, which also recently introduced
plant-based chicken burgers in its offerings (Plant Based News 2019). On the US side, there is
Kroger, the largest US supermarket chain, which announced that it will soon launch its plant-
based meat burgers under the brand Simple Truth (Reuters 2019).
2. The private label market at a glance
To support the recent trend that this category has been experiencing, this report refers to the
study conducted by Nielsen (2019) but also presents some data on private label market shares
obtained by leveraging Euromonitor. Given the importance of the US and European market for
Beyond Meat, this section presents data showing the trajectory in terms of growth of this
category between 2010 and 2019. Private label products are said to be continuously gaining

2
Source: Euromonitor
24.8% 25.1% 25.6% 26.1% 26.6% 26.8% 26.6% 26.8% 27.0% 26.9%
16.6% 16.9% 16.8% 16.8% 16.9% 16.5% 16.2% 16.3% 16.5% 16.6%
2010 2011 2012 2013 2014 2015 2016 2017 2018 2019
EU US
Figure 1: Private label market share in the packaged food
industry for US and Europe between 2010 and 2019
Note: The graph presents the evolution of the retail dollar sales
share of the packaged food market for private label brands.
share across all geographies in the food industry. However, by looking at Figure 1, data on the
US market present mixed evidence when analyzed from 2010 to 2019, while data on the
European market corroborate the growth of store brands outlined in Nielsen (2019).
2.1 Private label brands strategy – Is plant-based meat a target?
According to Nielsen (2019), private-label offerings in packaged food categories are focusing
more and more on understanding consumers’ needs to better position their products and
sometimes even compete with premium branded offerings. The type of products offered by
Beyond Meat, which targets consumers who are concerned with health and sustainability, as
well as the environmental impact that meat is known to have, may well be a potential target for
competitive private label offerings. One of the main reasons to state this lies behind the fact that
private label brands have started focusing on product offerings that embody better-for-you
characteristics as well as promote sustainability values, in addition to the recent move made by
major food retailers in Europe and the US. For this reason, it was relevant to analyze data
regarding the evolution of the market share of private label brands in product categories such
as better-for-you products, which encompasses organic, natural, as well as healthy products.
Moreover, it was worthwhile to investigate the evolution of the penetration of private label in
dairy alternatives. Figures 2 and 3, respectively, present the data found for these two product
categories and show how private label brands have been able to materially increase their market
shares concerning these type of products in Europe only, and not in the US.

3
45.6% 45.9% 46.1% 46.7% 47.1% 47.5% 47.1% 46.7% 46.4% 46.1%
14.5% 14.6% 15.3% 15.3% 15.6% 15.8% 16.0% 16.2% 16.7% 17.0%
2010 2011 2012 2013 2014 2015 2016 2017 2018 2019
EU US
Figure 4: Private label market share in processed meat and seafood
products for US and Europe between 2010 and 2019
Source: Euromonitor
Note: The category processed meat and seafood, stays beneath the
umbrella of the packaged food category.
However, by looking at the private label penetration in the processed meat and seafood category
for these two geographies, the narrative is a bit different for the US. As shown in Figure 4, in
the US the penetration of private label brands has been constantly growing since 2010.
2.2 Private label drivers – Research studies
Some studies concentrating around the market share of private brands present evidence in favor
of socio-economic and demographic factor such as income, culture, and age to drive the growth
in this category (Cadent 2018); while others, highlight the importance of private-label tiers and
product categories1 in consumers’ private brands purchasing behavior (Noorman and
1 Analysed through variables such as relationship intensity (measured by the number of product categories
purchased and purchase frequency), variety seeking (reflected by the number of distinct stock units purchased in
a given category), and price consciousness (a buyer’s unwillingness to pay a higher price for a product and/or
focus on paying a lower price).
25.4% 25.9% 26.6% 27.3% 28.0% 28.1% 28.0% 28.0% 28.0% 28.0%
31.7% 32.1% 31.8% 31.1% 31.5% 30.1% 29.0% 29.2% 29.1% 29.3%
2010 2011 2012 2013 2014 2015 2016 2017 2018 2019
EU US
Source: Euromonitor
Note: The category diary products and alternatives, encompasses
drinking milk products, cheese, yoghurt and sour milk drinks, and the
alternative non-diary products of these categories.
Figure 3: Private label market share in diary products and alternatives
for US and Europe between 2010 and 2019
16.6% 17.2% 18.1% 18.6% 19.1% 19.4% 19.6% 19.7% 19.9% 19.9%
7.8% 8.2% 8.3% 8.4% 8.4% 8.2% 8.0% 8.0% 8.0% 8.0%
2010 2011 2012 2013 2014 2015 2016 2017 2018 2019
EU US
Source: Euromonitor
Note: The category better for you, comprehends products where the
amount of a substance, which is deemed less healthy (in terms of fat,
sugar, salt content), has been actively reduced during the production
process.
Figure 2: Private label market share in better-for-you packaged food
for US and Europe between 2010 and 2019

4
Tillmanns, 2016). Not surprisingly, and in support of the discrepancy in the data between
European and US private brands, also geographical market factors, which can be regarded as
market structure and country segmentation, do affect the degree to which private label
penetrates the respective market (Sebri et al., 2017). Although there is extensive literature on
the drivers of consumers’ behavior towards private label purchases and of private brands market
penetration, no evidence can be found on whether health and sustainability are deemed to be
key determinants for future growth in this category. The rationale behind the focus on these
product features stems behind the fact that Beyond Meat products are targeted and positioned
in such a way that consumers perceive the differentiating attributes of the company’s products,
which are healthier and more sustainable, through its brand. According to a study conducted by
Franco and Cicatiello (2019), the promotion of brands’ awareness is pivotal to enhance
consumer purchasing behavior towards healthier and more sustainable product categories.
3. Conclusion
By analyzing the data gathered from Euromonitor on the penetration of private label brands in
the relevant geographies and packaged food categories, and the literature on the drivers for
private label market share growth and consumer purchasing behavior, there is little evidence
for which it can be stated that private label penetration in the plant-based meat category will
materially impact Beyond Meat’s share of the market. The main reasoning being the fact that
there is not yet a common denominator in the drivers for private-label purchasing behavior and
Beyond Meat products. From a brand perception point of view, and as outlined in the literature,
a private-label offering, which in comparison to Beyond Meat, offers many different products,
may steer the perception of the store brand values away from the consumer and eventually
hamper the demand for the product. Ultimately, the price gap which private label offerings have
been using to attract consumers is considered to be the least effective strategy to win national
brand purchasers in this category of products.

5
References
Franco, Silvio., and Clara Cicatiello. 2019. “The Role of Food Marketing in Increasing
Awareness of Food Security and Sustainability: Food Sustainability Branding.” Encyclopedia
of Food Security and Sustainability 3: 27-31. doi:10.1016/B978-0-08-100596-5.22018-0.
Noorman, Philipp., and Sebastian Tillmanns. 2016. “Drivers of private-label purchase
behavior across quality tiers and product categories.” Journal of Business Economics 87 (3):
359-395. doi:10.1007/s11573-016-0837-1.
Sebri, Mouna., and Georges Zaccour. 2017. “Cross-country differences in private label
success: An exploratory approach.” Journal of Business Research 80: 116-126.
doi:10.1016/j.jbusres.2017.07.009.
Plant based news. 2019. “Budget Supermarket Aldi Launches New Vegan Meat Products.”
Accessed December 27. https://www.plantbasednews.org/lifestyle/aldi-new-vegan-meat-
products.
Nielsen. 2019. “Global private label report.” Accessed December 27.
https://www.nielsen.com/wp-content/uploads/sites/3/2019/04/global-private-label-report.pdf.
Reuters. 2019. “Kroger to sell its own plant-based meat products.” Accessed December 27.
https://www.reuters.com/article/us-kroger-meat/kroger-to-sell-its-own-plant-based-meat-
products-idUSKCN1VQ2GJ.
Plant based news. 2019. “Lidl Creates Affordable Beyond Burgers Inspired ‘Next Level
Burger’.” Accessed December 27. https://www.plantbasednews.org/lifestyle/lidl-affordable-
beyond-burger-next-level-burger.
Cadent Consulting Group. 2018. “The Branding of Private Label.” Accessed December 27.
http://cadentcg.com/publication/the-branding-of-private-label/.