Embed Size (px)
Citation preview
NOVEL APPROACHES FOR CAPTURING AND RECOVERING HUMAN NOROVIRUS
BY PORCINE GASTRIC MUCINS
by
L. CLAIRE LANGLEY
(Under the Direction of Jennifer L. Cannon)
ABSTRACT
Human norovirus is the primary cause of non-bacterial gastroenteritis world-
wide. Porcine gastric mucins (PGM) contain histo-blood group antigens that are capable of
binding multiple genotypes of HuNoV, unlike monoclonal antibodies (mAB) which are less
cross-reactive. The purpose of this study was two-fold: 1) To determine the limit of detection
(LOD) for PGM- and mAB- conjugated magnetic bead-based recovery assays in the context of
elution buffers commonly used in Food Virology; 2) To determine if the addition PGM to
existing low-cost recovery methods could increase virus recovery. When magnetic beads were
coated with PGM, assay detection limits were lower than with mAB-coated beads for all buffer
matrices tested. Neutral pH buffers were most compatible, providing a low LOD with minimal
non-specific binding. Although repeatability was poor for the novel PGM assays, results warrant
future exploration and are an important step in developing cost-effective, rapid and reliable
method for norovirus detection.
INDEX WORDS: Norovirus, Porcine Gastric Mucins, Saliva, Histo-blood group antigens,
Magnetic Beads, Immunomagnetic separation, Norwalk Virus
NOVEL APPROACHES FOR CAPTURING AND RECOVERING HUMAN NOROVIRUS
BY PORCINE GASTRIC MUCINS
by
L. CLAIRE LANGLEY
B.S., The University of Georgia, 2011
A Thesis Submitted to the Graduate Faculty of The University of Georgia in Partial Fulfillment
of the Requirements for the Degree
MASTER OF SCIENCE
ATHENS, GEORGIA
2013
© 2013
L. Claire Langley
All Rights Reserved
NOVEL APPROACHES FOR CAPTURING AND RECOVERING HUMAN NOROVIRUS
BY PORCINE GASTRIC MUCINS
by
L. CLAIRE LANGLEY
Major Professor: Jennifer L. Cannon
Committee: Joseph Frank
Ynes Ortega
Electronic Version Approved:
Maureen Grasso
Dean of the Graduate School
The University of Georgia
December 2013
iv
DEDICATION
I would like to dedicate this thesis to my late husband, Kristopher Langley. I miss you. I
wouldn’t be who I am today without having known you. To my remarkable son, Willard
Langley; I have never loved anything as much as I love you. To my father, Will Hedrick; thanks
for hanging in there with me. Sorry it took me so long to get it together. Finally, to James
Godino; I love you more than words can say. You have been such a source of strength for me
and such a bright light in my life. Thank you for all that you are to me.
v
ACKNOWLEDGEMENTS
Thank you to all of the members of the Athens and Griffin norovirus lab, particularly
Grishma Kotwal for her assistance with my research. Thank you to Dr. Jennifer Cannon for
being such a great mentor. You have bent over backwards to help me with my education and my
career and I cannot thank you enough. Thank you to my committee members, Dr. Joseph Frank
and Dr. Ynes Ortega for your participation and constructive criticism. Lastly, thank you to my
colleagues at the calicivirus lab at the CDC. I have learned a lot from each of you.
vi
TABLE OF CONTENTS
Page
ACKNOWLEDGEMENTS .............................................................................................................v
CHAPTER
1 INTRODUCTION .........................................................................................................1
2 LITERATURE REVIEW ..............................................................................................4
3 MATERIALS AND METHODS .................................................................................16
4 RESULTS ....................................................................................................................25
5 DISCUSSION ..............................................................................................................44
6 CONCLUSIONS..........................................................................................................50
REFERENCES ..............................................................................................................................52
1
CHAPTER 1
INTRODUCTION
Norovirus is the leading cause of gastroenteritis and is responsible for 90% of non-
bacterial gastroenteritis cases and 50% of all gastroenteritis cases, world-wide1. It is responsible
for over 21 million cases and 800 deaths annually.1 A variety of food-types have been associated
with outbreaks of norovirus, including leafy greens and other produce, oysters and other shellfish
that are often consumed raw or undercooked, and prepared, ready-to-eat foods. Because these
foods are typically consumed without a cooking step, they are more likely to cause illness if
contaminated prior to consumption.
There is a need for rapid and reliable detection methodologies for human norovirus.
Typically, during an outbreak, a retrospective epidemiologic study is conducted to determine the
cause of the outbreak; however, the implicated food itself is rarely tested. This type of
surveillance is limited to the memories of the person infected and tends to include a high amount
of error. Although current methods for norovirus detection do exist, they are limited by their
ability to detect multiple genotypes of norovirus, sensitivity, reproducibility, and high costs.
Commonly, a four-step process is used to detect norovirus in foods: viral elution,
concentration, RNA extraction, and detection by real-time RT-PCR. The efficiency of the
elution process is critical. Elution releases viral particles from a surface allowing them to be
further processed. It is crucial that an effective elution buffer be selected. Properties including
pH, ionic strength, and protein concentration can all contribute to the effectiveness of the buffer
and how it interacts with the viral particle. Buffers containing proteins or basic amino acids and
2
have a high pH (above 9.0) are used because the buffer proteins compete with the virus particles
for binding with the food surface, thus forcing the viral particles (which are more negatively
charged) off of the surface. Buffers with high ionic strength can change the charges of the virus
and the food surface, thereby disrupting electrostatic forces between the two. A low pH buffer
will change the charge on the virus particle and may repulse the virus into solution.
Magnetic separation using functionalized superparamagnetic beads can be used for both
concentration and purification; however, the method is limited by its high cost and requirements
for a small sample size. Immunomagnetic separation methods are based on the attachment of
small magnetizable particles (beads) to virions via antibodies, carbohydrates, or ligands like
those found in porcine gastric mucins (PGMs) or saliva. Limitations to using mAB exist because
of its lack of cross-reactivity among norovirus genotypes. This can be circumvented by using the
more broadly-reactive histo-blood group antigens (HBGAs). HBGAs, contained within PGMs
or saliva, are capable of binding multiple genotypes and even genogroups of norovirus, whereas
monoclonal antibodies (mAB) cannot. The addition of HBGA-containing ligands to existing
viral recovery methods could enhance the capture of virions and provide a higher through-put
and cheaper alternative to magnetic bead separation assays.
Other viral concentration methods include polyethylene glycol (PEG) precipitation,
ultracentrifugation, and ultra-filtration; none of which aid in viral purification that is often
needed to remove food debris or other chemicals and can interfere with RT-PCR. PEG
precipitation is the most commonly used method for viral concentration and has a very high
repeatability between experiments. Filtration can be used to separate the virus particle from a
particular matrix and the size of the filter can be adjusted to meet those goals. The objectives of
this study were to compare the performance of HBGA- or mAB-functionalized supermagnetic
3
beads and to determine the lower limit of detection of each assay. Also, the addition of HBGA-
containing ligands to existing viral recovery methods were evaluated for their ability to enhance
the capture of virions, thereby, providing a higher through-put and cheaper alternative to
magnetic bead separation assays.
Monoclonal antibody, NV3901, is able to recognize a common epitope in GI Norwalk-
like virus.2 Saliva from a secretor-positive individual contains histo-blood group antigens that
have been previously shown to bind norovirus.3 Porcine gastric mucins have been shown to
contain type A, H-type 1, and Lewis b antigens.4 Since these antigens are also found in some
secretor-positive humans, this makes them an excellent model for simulating binding proficiency
within the GI tract. PGM has a broader specificity than NV3901 and can target multiple
genotypes of virus, making it more useful in an outbreak scenario where the source strain may
not be known. HBGA-conjugated magnetic beads have previously been used to recover
norovirus from both food and water samples.3
The purpose of this study was two-fold: 1) To determine the limit of detection for PGM-
and mAB- conjugated magnetic beads in the context of a variety of buffer matrices commonly
used in food virology; and 2) to determine if the addition PGM to existing low-cost recovery
methods could increase virus recovery. The success of these assays will determine future
directions of the study of norovirus capture and recovery methods
4
CHAPTER 2
LITERATURE REVIEW
Overview
Norovirus is a non-enveloped, positive sense, single-stranded RNA virus and is
characterized by cup-like structures on the capsid surface, which are characteristic of all viruses
in the family Caliciviridae.5 A prototype strain, discovered in 1968 by Adler and Zickl in the
town of Norwalk, Ohio, was originally referred to as “winter vomiting disease”. It resulted in a
50% attack rate of students and teachers at the local elementary school and a 32% attack rate for
those in direct contact with infected individuals.6 In 1972, suspected viral particles collected
from the outbreak were observed using immune electron microscopy (IEM) and were discovered
to be approximately 27-nm in size.7 These pathogens would become known as the Norwalk
virus. The use of IEM allowed for visualization of the viral-antibody complex and would
eventually lead to discovery of Norwalk-like viruses and other small round structured viruses
(SRSVs), such as the Hawaii virus in 1977 and the Snow Mountain virus in 1982.8; 9; 10
Antigenic
diversity of Norwalk-like and other SRSVs observed through IEM originally led scientists to
believe that they were not related to each other; however, the refinement of the PCR technique
by Dr. Kary Mullis in 1993 ultimately allowed scientists to amplify and sequence genetic
material found in these virus samples.11
This new ability to determine genetic differences and
similarities between samples resulted in taxonomic classification of norovirus and sapovirus.12
Norovirus is a major cause of epidemic gastroenteritis. It is a genus within the
Caliciviridae family, which also includes sapovirus, lagovirus, vesivirus and the newly
5
discovered nebovirus. Human norovirus (HuNoV) is responsible for 95% of non-bacterial
gastroenteritis and 50% of all gastroenteritis outbreaks in the world.13
In the U.S. alone, it is
estimated that there are 23 million cases per year, resulting in roughly 50,000 hospitalizations
and an estimated 300 deaths.13
Recent diagnostic studies have estimated that in developing
countries, over 1 million hospitalizations and 200,000 deaths have occurred annually.14
Norovirus can be spread from person-to-person, through contaminated food or water, aerosolized
vomitus, and fomites. According to the CDC, norovirus is the most common cause of foodborne
outbreaks.15
It has a high rate of infectivity and is extremely stable in the environment.
Resistance to common disinfectants, as well as its ability to cause incapacitating disease has led
to its classification as a Category B biodefense agent. All age groups are susceptible to infection
and secondary infections occur frequently.16
Norovirus outbreaks typically occur in schools,
hospitals, nursing homes, military settings, or any other semi-closed communities.17; 18; 19
Nosocomial norovirus outbreaks commonly cause closures of hospital wards.20
Norovirus is
referred to as the “winter vomiting disease” because most outbreaks occur during the winter
season.21
Norovirus particles have a high rate of infectivity22
and the ability to survive in the
environment.23; 24; 25
These characteristics as well as prolonged shedding from both symptomatic
and asymptomatic individuals have led to the extensive nature of norovirus outbreaks. 26; 27; 28
Infection with norovirus is rapid (24-48 hour incubation period), with symptoms
occurring within 12-72 hours in immunocompetent adults.29
Symptoms include a low-grade
fever, vomiting and diarrhea, nausea, abdominal cramps, and general malaise. Symptoms
typically resolve within a few days; however, in infants and children, the duration of infection
can be prolonged (up to 6 weeks) and symptoms more severe.30; 31; 32
Outbreaks often occur in
nursing homes and the elderly are at a significantly higher risk for severe infection and even
6
death.33; 34
Recovery is usually complete with no long-term effects. There have also been several
documented cases of immunocompromised and suppressed individuals who have had symptoms
that have lasted over 2 years.35; 36; 37; 38; 39
The infectivity of norovirus is dose-dependent and has
been shown to have a 10% probability of infection with a dose of 1000 particles, with the
likelihood of infection increasing as the viral load increases22
; however, as little as 10 particles
may be sufficient in causing infection.40; 41
Viral shedding can begin prior to presentation of
symptoms and may continue for two weeks or more after recovery; an estimated 104-10
12
genomic copies are shed per gram of feces.42; 26
Immunity mechanisms are unclear and
conflicting reports suggest both short-term, strain-specific immunity and long-term protection
from reinfection.43; 44
HuNoV studies have been limited because virus culture is not yet possible.
There has been difficulty ascertaining the total prevalence of norovirus in populations,
particularly in developing countries. The acute nature of norovirus infection leads to a lack of
reporting to health officials. There is also a lack of standardization among national and
international diagnostic and surveillance networks. Significant improvements have been made in
diagnostic assays, thus, increasing the recognition of the overall burden of norovirus disease
rates. Several databases provide a place to aggregate data and allow a way to pin-point the
source of an outbreak. The Food-Borne Viruses of Europe (FBVE) net allows surveillance for
viral gastroenteritis as well as Hepatitis A and E.45
NoroNet was developed in 2009 as an
extension to FBVE and not only serves as an epidemiological surveillance tool, but also has
clinical, diagnostic, and sequencing databases. CaliciNet was launched in March 2009 by the
CDC and includes 20 certified state and local laboratories.46
CaliciNet aims to improve
norovirus surveillance standardization and also includes a database for sequencing data and
outbreak information. This database allows for rapid identification of norovirus strains and can
7
lead to identification of multi-state and multi-source outbreaks. All 50 states have labs that can
test for norovirus, although some do not have the capacity for genotyping.46
Genetic features
Norovirus can be genetically classified into 5 genogroups (GI-GV). Average genome
size is approximately 7.5 kb in length, containing 3 open reading frames (ORFs). Further
classification into genotypes is made based on amino acid identities in major structural protein
(VP1) region of the genome.47
Strains within a genotype share greater than 85% amino acid (aa)
identity, while strains of different genogroups share approximately 51-56% aa identity.47
Genogroups I, II, and IV infect humans.40
Porcine norovirus are the most closely related animal
norovirus to HuNoV strains, sharing 65-71% aa identity with 9 HuNoV strains in genogroup II.48
Genogroup III infects bovines and genogroup V was isolated in mice in 2003.49; 50
A GIV.2
variant that shared 69.3-70.1% aa identity with GIV.1 HuNoV was discovered in a lion in 2006
and in 2008, a canine norovirus was discovered that shared 90.1% amino acid identity with the
GIV.2 lion strain.51; 52
Genogroups I and II show the most genetic diversity of the human
genogroups, with 8 and 17 genotypes, respectively;53
although, genogroup II, genotype 4 (GII.4)
is the most common cause of infection in humans.40; 54; 55
It has been shown through molecular
epidemiology studies, that the GII.4 variant is responsible for 70% of norovirus outbreaks.56; 57
It
is possible that GII.4 may be more environmentally stabile, transmissible, and/or virulent;
however, its dominance in generating illness is not clearly understood.58
The norovirus genome is linear, bound by a viral genome-linked protein (VPg) at the 5’
end and is poly-adenylated at the 3’ end. VPg is the largest of the non-structural proteins and is
crucial for initial translation and viral infectivity and poly-adenylation provides over-all stability
to the virion.53
A viral 3C-like protease (3CLpro
) co- and post-transitionally processes non-
8
structural proteins contained within ORF1 and releases 6 products: p48, NTPase, p22, VPg,
3CLpro, and RNA-dependent RNA polymerase (RdRp), that are encoded, respectively, from N-
terminus to C-terminus.59
The length and amino acid content of these products vary among
genogroups. p48 appears to disrupt intracellular protein trafficking by forming a complex with
the SNARE protein, VAP-A.60
NTPase binds and hydrolyzes ATP.59
Not much is known about
the function of p22, but research suggests it has a role in the disassembly of the Golgi apparatus
during NoV replication, as well as causing a disruption in cellular trafficking.61
The major capsid protein (VP1) is encoded by ORF2; ORF3 encodes the minor structural
protein (VP2).59
VP1 and VP2 are translated from a Vpg-linked sub-genomic RNA transcript
that includes both ORF1 and ORF2. One norovirus particle consists of 90 dimers of VP1 and 1-
2 copies of VP2.59
VP1 contains a shell (S) domain and a protruding (P) domain that are linked
by a flexible hinge.59; 62
The P domain can be further described as having two subdomains: P1
and P2.62; 63
The P2 region contains a receptor binding region and is important in determining
host susceptibility.64; 65
Neutralizing antibodies can also recognize the P2 region, and therefore,
mutation frequency is high in this region.66; 67
The S domain contains an 8-stranded antiparallel
-sandwich that forms the icosahedral shell which protects the genomic RNA.62
Localized
conformational changes occur in the S domain and these interactions are maintained between the
opposing S domains in dimers.62
Expression of VLPs using baculovirus as a vector in insect cells can lead to the
production of recombinant virus proteins.68; 69
Using this method, virus-like particles (VLPs) can
be made by expressing VP1 and VP2 in insect cells. The expression of only the recombinant S
domains of VP1 leads to a self-assembly into smooth VLPs roughly 30 nm in diameter.70
Although VLP assembly is not dependent on the presence of VP2,70
its absence leads to
9
decreased size and stability of the particle.71
VLPs are similar morphologically and antigenically
to native norovirus virions and can be used to further laboratory studies.1 VLPs have proven
useful in gathering data on the capsid structure and functional aspects of their full-genome
counterparts. VP2 is much smaller than VP1 and sequences can vary between genotypes. VP2
has been shown to be essential for the infectivity of the virion in feline calicivirus.72
Histo-blood group antigens (HBGAs) are complex carbohydrate structures at found at the
end of glycan chains. Roughly a century ago, ABO-specific antigens and antibodies were seen
on human red blood cells. This discovery was made by Karl Landsteiner and the antigens were
renamed to “Histo-blood group antigens”. HBGAs can be found on a number of cells in the
body including red blood cells, but also for the majority of people, they can be displayed on
epithelial cells found in the gastrointestinal and respiratory tracts.73; 74; 75
They can also be found
in saliva and breast milk of some individuals. HBGAs are formed when monosaccharides are
added sequentially to the terminal end of a glycolipid or glycoprotein. The make-up and
orientation of these monosaccharides are the result of allelic variants of three genes: FUT3,
FUT2 and ABO, which ultimately determine the Lewis, Secretor, and ABO phenotype of an
individual, respectively.73
Norovirus recognizes α1,2-linked fucose residues.64
In order for an individual to express
these residues on their intestinal epithelial cells, that individual must have FUT2 gene. The
FUT2 gene encodes an enzyme called fucosyl-transferase that promotes fucosylation of the
oligosaccharide chain.76
Those with the FUT2 gene are known as “secretors” and make up about
80% of the population. This demographic is susceptible to the prototype Norwalk virus (GI.1)
infection whereas, the remaining 20% (those who possess a mutated FUT2 gene and do not
produce the enzyme) are known as “non-secretors” and are resistant to infection by some
10
norovirus genotypes.77
Because HBGAs have been associated with infection by GI.1 and GII.4
norovirus, it has been deduced that they are important and likely necessary for infection, but their
role as receptors or co-receptors is not completely understood.77; 78; 79; 80
A series of saliva-based assays has revealed 8 HBGA binding patterns and additional
tests using synthetic oligosaccharides have revealed additional binding patterns;81; 82
however,
more research is needed to determine the relevance of these results. The binding patterns can be
divided into two groups: those that bind A/B antigens and those that bind Lewis antigens.83
Strains that bind A/B do not bind Lewis-type and the reverse is also true. It is possible that this
mutual exclusivity might indicate a co-evolution of the virus with the host; however, there has
been an emergence of distinct norovirus binding patterns that appear to be strain-specific. 82; 84; 85
Two strains, VA115 and DSV, do not bind any HBGAs when tested.82
This might indicate that
other molecules in the body are responsible for their binding and entry into the cell. Because of
the diversity of HBGAs as well as the genetic variability of strains, there is likely a norovirus
strain capable of infecting nearly every allelic variant in the population.86
It is probable that the
variation of HBGA phenotypes in the population indicate an mechanism of the body to ward off
infection, whereas, the diversity of strains might indicate a strategy of norovirus to overcome
these mechanisms.86
This highlights the highly adaptive nature of norovirus and demonstrates the
evolution of both the human norovirus and its host.
Immunity
The mechanisms of immunity to norovirus infection are unclear. Differing responses in
the population, as well as fleeting immunity have complicated our understanding. In early
human challenge studies, patients were administered a homologous virus inoculum of filtered
stool from a norovirus outbreak and two infection patterns emerged.43; 87
The first group of
11
volunteers showed total resistance to primary and secondary infection. The second group
showed primary and secondary infection susceptibility; however, in order for secondary infection
to occur, a six-month time interval had to elapse between challenges, suggesting short-term
immunity. .43; 87
Because norovirus strains are so different, pre-existing antibodies in the blood
from previous infections do not necessarily aid in the prevention of a new infection. Some
antibodies are neutralizing to a certain strain, but not to others, so if a person gets infected with a
strain that cannot be neutralized by the antibodies already present, infection will occur. This
explains how those who have large quantities of antibodies present in their blood can still get
sick.43; 77; 87; 88; 89; 90
Development of herd immunity is also possible at the population level77; 91; 92
and is
supported by the fluctuation of GII.4 between dominance and dormancy in the world
population.93
During the period of time when GII.4 is not dominant, it is proposed that altering
of the amino acids that comprise the P2 region occurs as the virus attempts to escape herd
immunity in the population. 94; 95
This slow change in viral structure, or antigenic drift, and can
cause re-emergence of new strains into a population that is naïve to the new mutation.
Norovirus detection methods
As a prerequisite to the detection of norovirus, certain steps may be necessary to remove
the virus from the sample matrix and to concentrate it once it has been separated. These steps
often use pH and/or ionic manipulation to encourage virus elution or adsorption to a food or
environmental surface. Other purification steps may include one or more of the following:
pretreatment with enzymes that can degrade carbohydrates, extraction with organic solvents to
aid in the removal of lipids, crude- and ultra- filtration to remove particulates, or magnetic
separation of virus particles using synthetic histo-blood group antigens3 or porcine gastric
12
mucins96; 97; 98
conjugated to magnetic beads. Precipitation or ultracentrifugation can be used to
concentrate the virus after separation. In virtually all cases, successful extraction and/or
separation, purification, and concentration of viruses from foods includes a combination of two
or more of these steps.99
Concentration may be necessary to enhance molecular detection when the number of
virus particles in the sample may be limited. The most common type of concentration method is
the addition of poly-ethylene glycol (PEG). High molecular weight PEG can more rapidly
precipitate small viral proteins when it is present in high concentrations.100
Another method of
viral concentration is ultracentrifugation. This involves centrifuging a sample at extremely high
speeds (> 80,000 x g). The target will form a pellet at the bottom of the tube and the supernatant
can be removed. The success of ultracentrifugation relies on heavily on the prerequisite
purification step that is necessary to remove any debris that may interfere with virus detection.
Ultrafiltration can concentrate a sample based on size exclusion and also requires a thorough pre-
purification step to remove debris that may block or puncture the filter. Charged membrane
filters can be used to concentrate viruses, exploiting the native negative charge of the viruses at
neutral pH.
Carbohydrate-, ligand-, or antibody- conjugated functionalized magnetic bead separation
is becoming a more popular means by which to separate and concentrate viral particles. The
type of magnetic bead will vary depending upon which coating will be used: Amine beads are
functionalized with amine groups that easily bind glycoproteins like those found in porcine
gastric mucins and other carbohydrates. Tosyl-activated beads have sulphonyl esters that
encourage covalent bonding to antibodies. In order to maximize target recovery, it is necessary
to select a coating that has a high binding affinity for the target molecule.
13
For molecular detection, RNA can be released from the viral capsid in one of two ways:
heat release by heating a sample to 99°C for ≥ 1 minute or by applying guanidinium thiocyanate
to denature viral proteins and a silica membrane or solid support to bind the subsequently
released nucleic acids.101
While it is bound, the viral RNA is then washed with ethanol and can
be eluted by either using TE buffer or nuclease-free water.
Nucleic acids can then be subjected to conventional reverse transcriptase polymerase
chain reaction (RT-PCR) or to real-time (quantitative) (RT-qPCR). RT-PCR in an assay that
involves the transcription of viral RNA into complementary DNA (cDNA) which is then
amplified with norovirus-specific primers.102
In conventional RT-PCR, products are then
subjected to agarose gel electrophoresis to provide a purely qualitative result. RT-qPCR
incorporates a fluorescent probe that can be used to quantify the amount of nucleic acid in the
sample in real-time.103
Target-specific probes can be used to increase the sensitivity of the
assay.103
The emission of a fluorescent signal by these probes indicates the accumulation of
amplicons above a certain cycle threshold value (CT), separating the signal from background
noise. The probe is inserted into the amplicons; therefore, the intensity of this fluorescent
signal directly corresponds to the quantity of amplicons. The earlier the threshold is crossed, the
higher the quantity of RNA was in the original sample. The RT and the PCR steps can be done
in either a one-step or two-step reaction. The single step reaction is faster since it includes the
production of cDNA as well as the amplification of those products.104
It also limits the handling
of the sample, decreasing opportunities for sample contamination. RT-qPCR assays can be
monoplexed (targeting one genomic region) or multiplexed (targeting two or more genomic
regions). Multiplexing can hinder the sensitivity of an assay by requiring that certain reaction
conditions be compromised to accommodate all primers and probes present in the reaction mix.
14
Alternate methods not based on nucleic acid detection include the Kaplan criteria,
electron microscopy, and immunological assays. Characterization of norovirus outbreaks is
typically performed by applying the Kaplan criteria. To be considered an outbreak caused by
norovirus, the following criteria must be met; the mean illness duration between 12 to 60 hours, a
24- to 48- hour incubation period, and greater than 50% vomiting among those involved in the
outbreak.105
The Kaplan criteria were developed by studying outbreaks that occurred in the US
between 1976-1980, and were validated on outbreaks occurring from 1998-2000, where the
criteria were found to have a 99% specificity and 68% sensitivity.105
The Kaplan criteria are not
valid for hospital outbreaks because the mean duration of illness for hospital outbreaks tends to
exceed that listed in the criteria (>72 hours);106
however; they can be used as an initial
diagnostic tool for cases that are eventually confirmed with laboratory testing.
Norovirus was first visualized in 1972 by electron microscopy (EM).7 EM allows for
visualization of the virus particle, as well as any other pathogens that may be present, but it has a
low sensitivity (~105-10
6 particles).
107 In addition to its low sensitively, EM is not commonly
used because it requires specially trained staff as well as access to an EM facility.
Immunological tests detect norovirus by using specific antibodies, but are limited by the
antigenic diversity of norovirus.108
Norovirus-specific Enzyme–Linked ImmunoSorbent Assays
(ELISA) use a range of antibodies that are broadly reactive with multiple genotypes of viruses.
Although, these cannot make the distinction between infectious and non-infectious particles, they
can act as a useful preliminary detection tool. Because they do not detect all types of norovirus
and have a high limit of detection (>105)109
, they can provide false negatives.110; 111
Because of
these previously mentioned limitations, it can only be used as a preliminary detection tool and
not a means to diagnose.
15
Norovirus is a global problem that causes illness in millions of people annually including
children and the elderly. Current detection methods are limited in sensitivity or are too
expensive and /or time consuming to perform. Rapid and reliable testing methods that are cost-
effective and time-efficient are thus needed.
16
CHAPTER 3
MATERIALS AND METHODS
Preparation of Norwalk virus-positive stool suspension
A (GI.1) Norwalk virus-positive stool sample was acquired from an ill patient that was
part of a human challenge study conducted at Baylor College of Medicine by Dr. Robert Atmar.
A stool suspension was made by placing a pea-size amount of stool into a 1.5 ml tube containing
750 µl of Phosphate Buffered Saline (PBS), providing a ~10-20% stool suspension. After
vortexing the sample until thoroughly mixed (about 1 min), the sample was then centrifuged at
13,000 rpm for 10 minutes. The supernatant was distributed into 10 µl-aliquots before storage at
-80°C. A fresh aliquot was used for each experiment to avoid variation due to multiple cycles of
freeze/thawing of the virus stock.
Determination of the native GI.1 stool suspension virus titer
Five different methods were used to determine the virus stock concentrations. Serial dilutions
(10-fold) were made of previously extracted GI.1 stool suspension in nuclease-free water. A
conventional RT-PCR targeting region C, using GI specific primers (GISKF and GISKR)112
, was
performed using a Qiagen One-step RT-PCR kit (Valencia, CA) using an Applied Biosystems
Veriti® 96-Well Fast Thermal Cycler (Life Technologies; Grand Island, NY) under the
following conditions: (i) RT for 30 min at 42 °C, (ii) Denaturation for 15 min at 95 °C, (iii) 40
cycles of 30 s at 95 °C, 30 s at 50 °C, and 30 s at 72 °C, (iv) final extension for 10 min at 72 °C.
Once complete, the amplified product was run electrophoresed on a 2% Seakem ME gel (Lonza;
Basel, Switzerland) at 105V for 90 minutes. Each dilution series was performed in triplicate,
17
each including a negative control comprised of master mix and RNase-free water only. The last
visible band in the dilution series was used to back-calculate the estimated concentration of viral
RNA per ml of stool suspension.
In addition to the conventional assay, an end-point real-time RT-PCR method and two
quantitative real-time (RT-qPCR) methods were used to calculate virus stock concentration. All
real-time assays were performed using an Applied Biosystems Step-One Real-time PCR System
(Life Technologies: Grand Rapids, NY) under the following conditions: (i) RT for 30 min at 45
°C, (ii) Denaturation for 15 min at 95 °C, (iii) 50 cycles of 10 s at 95 °C, 30 s at 55 °C, and 30 s
at 72 °C. GI-specific primers and probes were used (Cog 1F/1R and Ring 1C, respectively)113
in
a QuantiTect Probe Kit (Qiagen; Valencia, CA). Viral RNA concentrations in each sample were
determined using the ABI software and inclusion of a standard curve made with 10-fold serial
dilutions of either a GI.3b transcript, or a GI.1 transcript, both 3kb in length and obtained from
the Gastroenteritis and Respiratory Virus Laboratory Branch at the CDC (a gift from Jan Vinjé)
that included partial coverage of ORF1 and ORF3, and complete coverage of ORF2. The sample
quantities were reported as log genome copies per milliliter.
The transcript was synthesized by inserting a 3 kb amplified DNA product into a TOP10 plasmid
and cloning the plasmid in E. coli competent cells (Invitrogen). The plasmid was linearized with
restriction enzymes and processed through a Mega Script kit (Ambion) to convert the product
from dsDNA to ssRNA. The sample was then treated with DNase to remove any residual DNA.
Finally, the virus stock concentration was determined by assaying and averaging the virus stock
with each experimental replicate. The mean of the quantity in the inoculum was determined to
be 2 x 10⁵ genome copies per µl (or 2 x 10
8 genome copies per ml). Since this value was also
18
very similar to the values obtained by ¾ of the other methods, this value was considered the most
accurate.
Preparation of monoclonal antibody (NV3901) and carbohydrate ligand coated magnetic
beads
M-280 Tosylactivated Dynabeads (Life Technologies; Grand Island, NY; formerly Invitrogen),
coated with sulphonyl esters that can bind with amino groups on antibodies, were vortexed for 1-
2 minutes to re-suspend the magnetic beads into solution. A 165 µl-portion of beads (5mg) of
were placed in a 1.5 ml tube which was then placed on a Dynamag-2 magnet (Life Technologies;
Grand Island, NY) until the beads were drawn completely to the magnet-facing side of the tube
(referred to as pelleting) until the liquid became clear (about 1 min). The supernatant was
removed and the beads were then washed by adding 1 ml of 0.1 M sodium borate buffer (pH 9.5)
which was mixed by pipetting. The beads were again placed on the magnet, allowed to pellet,
and the supernatant was removed. Monoclonal antibody (NV3901) at a concentration of 2.87
mg/ml specific to Norwalk virus GI.1 (a gift from Dr. Robert Atmar, Baylor College of
Medicine, Houston, TX) was added to 115 µl of 0.1 M PBS (pH 7.4). This ligand mixture was
added to the beads. Ammonium sulfate (3 M) was then added and the bead-antibody mixture
was incubated for 12-18 hours at 37°C with tilt and rotation using a Hula mixer (Invitrogen;
Grand Island, NY) at 12° tilt and 5 rpm rotation. After incubation, the bead-antibody mixture
was placed on a magnet, allowed to pellet completely, and the supernatant was removed. A 1
ml-portion of PBS (pH 7.4) containing 0.5% BSA was added and the beads were again incubated
at 37°C with tilt and rotation for 1 hour. After incubation, the bead-antibody mixture was placed
on a magnet and allowed to pellet completely. The supernatant was removed and washed two
19
times with 1 ml portions of PBS (pH 7.4) containing 0.1% (w/v) BSA. Prior to use, the coated
beads were blocked overnight at 4°C with 5% Blotto made from dehydrated milk and PBS.
M-270 Amine-coated Dynabeads (Life Technologies; Grand Island, NY), chosen because
amine-groups on the surface of the beads bind with carboxyl-groups of the ligand, were vortexed
for 1-2 minutes to re-suspend them into solution. Approximately 1-2 x 10⁹ magnetic beads per
ml were transferred to a 1.5 ml tube. The beads were placed on a magnet and allowed to pellet
for 4 minutes. The supernatant was aspirated and the beads were washed 2 times in 0.1 M 2-(N-
morpholino) ethanesulfonic acid (MES) (pH 4.5-5). The beads were then re-suspended in 0.1 M
MES without dilution. Type III Porcine Gastric Mucins (PGM), (Sigma, St. Louis, MO) were
reconstituted with 0.1 M MES to a concentration of 10 mg/ml by heating in a 37°C water bath
for 10 minutes with intermittent vortexing. The reconstituted PGM was then added to the beads
in a ratio of 6 µl of PGM solution to 94 µl of beads. 15 mg of N-hydroxysuccinimide (NHS) and
10 mg of 1-Ethyl-3-(3-dimethylaminopropyl) carbodiimide (EDC) was dissolved in 1 mL of cold
de-ionized water immediately prior to use. The EDC/NHS solution was added to the beads in
the amount of 50 µl per mg of ligand used, and the mixture was vortexed. The beads were
incubated at room temperature for 2 hours on a Hula mixer. Hydroxylamine (10 mM) was added
to quench the reaction and allowed to incubate for an additional 15 minutes with tilt and rotation.
The beads were then washed with PBS containing 0.5% BSA three times before blocking
overnight at 4°C in 5% Blotto prior to use.
Protein G Dynabeads (Life Technologies; Grand Island, NY), chosen to rule out the
possibility that mAB NV3901 was being presented to the virus incorrectly with the tosylated
bead. The assay was repeated with Dynabead Protein-g beads which bind ligands via their Fc-
region (or tail), rather than the Fab region of the antibody. The beads were vortexed for >30
20
seconds to resuspend them in the vial. Portions of 50 µL were transferred to a 1.5 mL Eppendorf
tube. The beads were placed on a magnet and allowed to pellet for 4 minutes. The supernatant
was aspirated and the beads were removed from the magnet. NV3901 (2.87µg/ml) was prepared
in 200 µL of PBS with 0.02% Tween-20 (Thermo Scientific; Waltham, MA) which was applied
to re-suspend the beads. The bead-antibody mixture was incubated at room temperature on a
Hula mixer for 10 minutes. The beads were then returned to the magnet and allowed to pellet for
4 minutes. The supernatant was aspirated and the beads were removed from the magnet and re-
suspended in 200 µL of PBS with 0.02% Tween-20. The beads were pre-blocked and, therefore,
ready for immediate use according to the manufacturer’s instructions.
Norwalk virus GI.1 capture by functionalized magnetic beads for determining the assay
lower detection limit.
Twenty-µl aliquots of each functionalized and pre-blocked bead type were made in 1.5 ml tubes.
The beads were first washed 3 times with PBS, followed by addition of 1 ml of one of the
following four buffers: 50 mM Glycine containing 0.1 M Tris-HCl and 3% beef extract (used at
pH 7.0 or pH 9.5), PBS containing 1 M NaCl and 0.05% Tween 20, and Citrate buffer at pH 3.6.
By changing the charge on the virus to a positive charge, citrate buffer at pH 3.6 increased viral
binding to the negatively charged carbohydrates of porcine gastric mucin-coated magnetic
beads.97
Glycine buffer at pH 7.0 with 3% beef extract was chosen because its high protein
concentration aids in viral elution114
and has been shown to reduce non-specific binding to
various food matrices.99
An increase to 9.5 creates a very negatively charged buffer which leads
to competitive binding, thus, forcing virus particles off of a food surface. 1M NaCl PBS disrupts
electrostatic interactions between a food surface and the viruses which are negatively charged at
21
a neutral pH. A 0.05% Tween 20 (a polysorbate surfactant) was added to aid in the disruption of
hydrophobic forces between the virus and a food surface.
Serial dilutions (10-fold) of native GI.1 stool suspension were made and 1 µL of each was added
to individual bead/buffer-containing tubes, before incubating at 37°C for 1 hour with tilt and
rotation. To determine non-specific binding, each type of functionalized bead was left uncoated
and treated identically to the coated beads in each buffer matrix. Negative controls consisted of
only the bead/buffer mixture and were not inoculated with virus. After incubation, unbound
viruses in the supernatant were removed and the samples were washed 3 times with PBS. The
beads were re-suspended in 50 µL of PBS and placed in an Applied Biosystems Gene Amp PCR
System 9700 thermocycler (Life Technologies; Grand Island, NY) at 99°C for 5 minutes to heat-
release the viral RNA. Immediately after the heat-release step, the samples were placed on ice to
limit denaturation of the RNA and then spun in a mini-centrifuge (Fisher Scientific; Pittsburgh,
PA) for 3 minutes. The supernatant was removed and placed into a 1.5 mL tube and stored at -
80°C until future testing.
Preparation of lysis buffer
Polyadenylic acid (25 mg) (Life Technologies; Grand Island, NY) was dissolved into
12.5 mL of nuclease free water. A 0.5X Tris-EDTA was made by adding 50 mL of 1X TE (Life
Technologies; Grand Island, NY) to 50 mL nuclease free water. 120 g of Guanidine Thiocyanate
(GuSCN) (Roche; Indianapolis, IN) was dissolved completely into 100 mL of 0.5X TE by
heating the solution in a 56°C in a water bath. To this solution, 11 mL of 5 M NaCl (Life
Technologies; Grand Island, NY) and 11 mL of 3 M NaOAc (Life Technologies; Grand Island,
NY) was added. A polyadenylic acid solution was made by dissolving 25 mg Polyadenylic acid
22
in 12.5 mL of nuclease free water and 2.2 mL was also added to the lysis buffer. The lysis buffer
requires protection from light and must be used before the 6 month expiration date.
Manual RNA extraction using a spin column
Samples were combined with equal portions of lysis buffer, vortexed for 5 seconds, and
allowed to incubate at room temperature for 10 minutes. Molecular grade ethanol (100%) was
then added with a ratio of two times the sample volume. Samples were vortexed for 5 seconds
and transferred to an E.Z.N.A. Hibind RNA spin column (Omega Bio-tek; Norcross, GA), taking
care not to touch the membrane located within the column. The spin columns were then
centrifuged for 1 minute at 13,000 rpm in a bench top microcentrifuge and the filtrate was
discarded. To each column, 500 µL of 75% molecular grade ethanol was then added to wash the
spin columns. After centrifugation and discarding the filtrate, a dry spin was conducted to
remove any residual ethanol on the columns. The spin columns were placed in new 1.5 mL
tubes and 50 µL of RNAse-free H2O was added. The columns were centrifuged again at 13,000
rpm for 1 minute to elute the RNA from the columns. RNA was stored at -80°C until future use.
Concentration of Norwalk virus by mucins using alternatives to magnetic bead methods.
Muco-concentration by polyethylene glycol (PEG) Precipitation:
Porcine gastric mucins were hydrated overnight in milli-Q H2O to a concentration of either 20
mg/mL (2% w/v) or 200 mg/mL (20% w/v). In a 1.5 mL tube, 100 µL of PGM, heat-treated
saliva or water (no mucin controls) was pipetted into 900 µL of glycine buffer (pH 7.0).
Approximately 10,000 genome copies of virus derived from a native GI.1 stool suspension was
seeded into triplicate samples of each mucus suspension or control. Each sample was then mixed
with 10% PEG 10,000 MW (Sigma Aldrich; St. Louis, MO) containing 0.3 mM NaCl (Sigma
23
Aldrich; St. Louis, MO) and incubated at room temperature for 4 hours on a hula mixer to
dissolve the PEG and NaCl. Following incubation, the PEG was precipitated by centrifugation at
9,000 x g for 30 minutes. A 100 µL portion of the supernatant was retained for RNA extraction
before discarding the remaining portion. The pellet was then re-suspended in 1 mL of deionized
H2O. A 100 µL portion of the re-suspended pellet was retained for RNA extraction.
Muco-concentration by particle membrane filtration:
Hydrated PGMs (2-20%), heat-treated saliva or water (no-mucus controls) were added to glycine
buffer (pH 7) at ratios of 1:10. Approximately 10,000 genome copies of virus derived from a
native GI.1 stool suspension was seeded into triplicate samples of each mucus suspension or
control sample. Samples were incubated for 45 minutes using a hula mixer at room temperature
to capture viruses in the network of mucins in the PGM and saliva samples. After incubation,
the samples were very slowly (passage of 1 mL over 15 minutes) syringe-filtered using a 0.2 µm
filter (VWR International North America, Radnor, PA). A 100 µL portion of the filtrate was
retained for RNA extraction. Then, 500 µL of lysis buffer was applied to the filter and pushed
through the filter slowly over the course of 10 minutes to extract viral RNA collecting on the
membrane. An equal portion of 100% ethanol was applied to the syringe filter and collected
with the expelled lysis buffer. A 100 µL portion of this sample (herein referred to as the
“residue”) was retained for RNA extraction. In some experiments, 10% PEG 10,000 with 0.3 M
NaCl was also included during virus-binding experiments using 20% PGM to see if the PEG
could enhance virus retention on the membrane filters.
Determination of PBS inhibition during heat-release
Previous items in the literature suggest a possibility that PBS may inhibit RT-qPCR by
binding Mg2+
. For each of the three buffers tested (0.1 M PBS (pH 7.4) (Ambion; Grand Island,
24
NY), 50 mM Tris (pH 7.6) (Invitrogen; Grand Island, NY), and nuclease-free H2O (Thermo
Scientific; Logan, UT), 1 µL of GI.1 stool supernatant (2 x 10⁷
genome copies/ml) was added to
49 µL of buffer in 1.5 mL tubes. RNA was heat-released at 99ºC for 5 min. 10-fold serial
dilutions were made and each was compared to a GI.1 standard curve in triplicate. A one log
difference (indicated by a 3.3 change in CT value) indicated presence of inhibition, whereas
differences in Ct values less than 3.3 were considered non-inhibitory.
Determination of PGM inhibition
To determine whether or not 20% or 2% (w/v) PGM caused inhibition of RT-PCR, RNA-
extracts from these samples and samples from experiments containing 0% PGM (glycine buffer
only) were examined. A GII NoV-specific monoplex RT-qPCR assay was set up except using 1
µL less H2O per reaction in the master mix. Portions of 1 µL of each sample (20%, 2% or 0%
PGM) were placed in each of duplicate wells. In addition, 1 µL of GII.4 RNA transcript
obtained from the Gastroenteritis and Respiratory Virus Laboratory Branch at the CDC was also
added to each well. Three positive controls (containing 1 µL of GII RNA transcript, and 1 µL of
RNase-free water) and 1 negative control (water only) were included on each plate. Real-time
RT-qPCR was performed using GII-specific primers and probes (Cog 2F and 2R, and Ring 2
(Cy5)). The CT values of PGM-containing samples and Glycine buffer only samples were
compared to an average of the CT values obtained from the 3 GII-positive control samples to
determine whether or not inhibition was present in the samples. A one log difference (indicated
by a 3.3 change in CT value) indicated presence of inhibitory substances in the sample, whereas
differences in Ct values less than 3.3 were considered non-inhibitory.
25
CHAPTER 4
RESULTS
Determination of the viral concentration in the inoculum
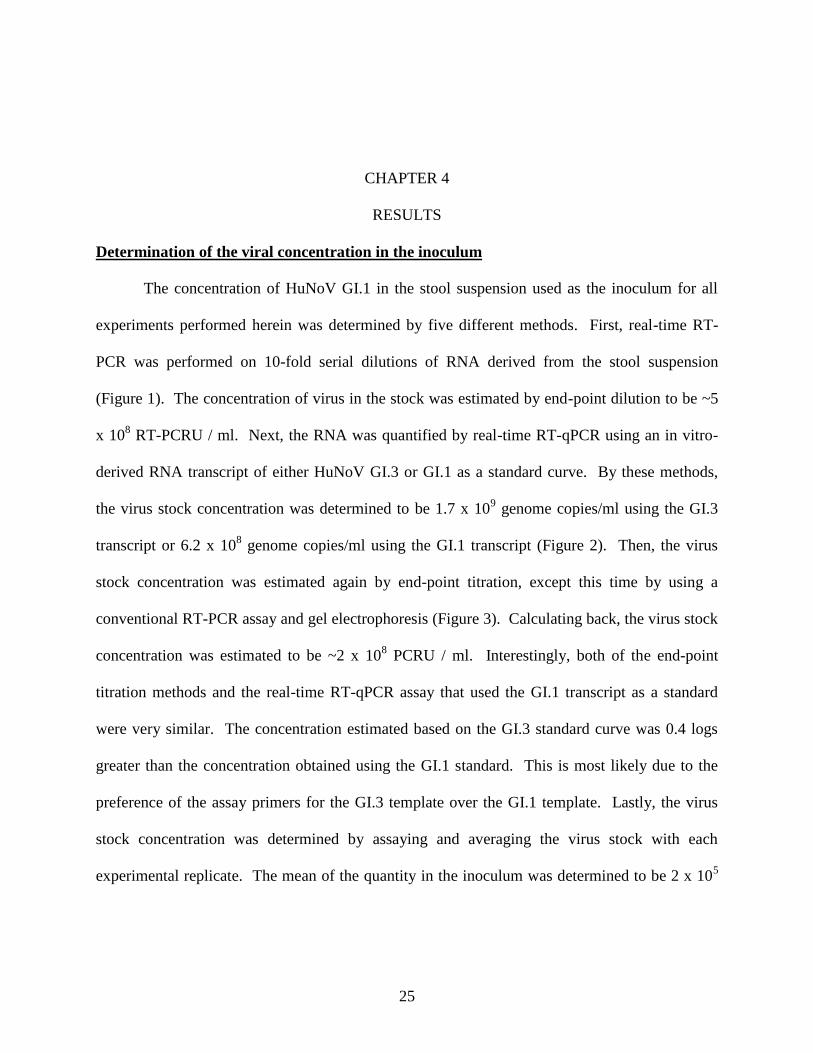
The concentration of HuNoV GI.1 in the stool suspension used as the inoculum for all
experiments performed herein was determined by five different methods. First, real-time RT-
PCR was performed on 10-fold serial dilutions of RNA derived from the stool suspension
(Figure 1). The concentration of virus in the stock was estimated by end-point dilution to be ~5
x 108 RT-PCRU / ml. Next, the RNA was quantified by real-time RT-qPCR using an in vitro-
derived RNA transcript of either HuNoV GI.3 or GI.1 as a standard curve. By these methods,
the virus stock concentration was determined to be 1.7 x 10⁹ genome copies/ml using the GI.3
transcript or 6.2 x 10⁸ genome copies/ml using the GI.1 transcript (Figure 2). Then, the virus
stock concentration was estimated again by end-point titration, except this time by using a
conventional RT-PCR assay and gel electrophoresis (Figure 3). Calculating back, the virus stock
concentration was estimated to be ~2 x 10⁸ PCRU / ml. Interestingly, both of the end-point
titration methods and the real-time RT-qPCR assay that used the GI.1 transcript as a standard
were very similar. The concentration estimated based on the GI.3 standard curve was 0.4 logs
greater than the concentration obtained using the GI.1 standard. This is most likely due to the
preference of the assay primers for the GI.3 template over the GI.1 template. Lastly, the virus
stock concentration was determined by assaying and averaging the virus stock with each
experimental replicate. The mean of the quantity in the inoculum was determined to be 2 x 10⁵
26
genome copies per µl (or 2 x 10⁸ genome copies per ml). Since this value was also very similar
to the values obtained by ¾ of the other methods, this value was considered the most accurate.
Recovery of GI.1 virus from common buffers using functionalized magnetic beads
The ability of porcine gastric mucin (PGM)- and monoclonal antibody (mAB)-coated
magnetic beads to capture and recover HuNoV GI.1 from a variety of elution buffers that are
commonly used in food virology was investigated in order to determine whether or not the
ligand-coated magnetic beads could be used in combination with a food virology elution
procedure. The assay limit of detection (LOD) was thus determined for each functionalized bead
type in the context of each elution buffer. Also, ligand-coated beads were compared to uncoated
beads to assure that the ligands were responsible for virus recovery and the virus was not binding
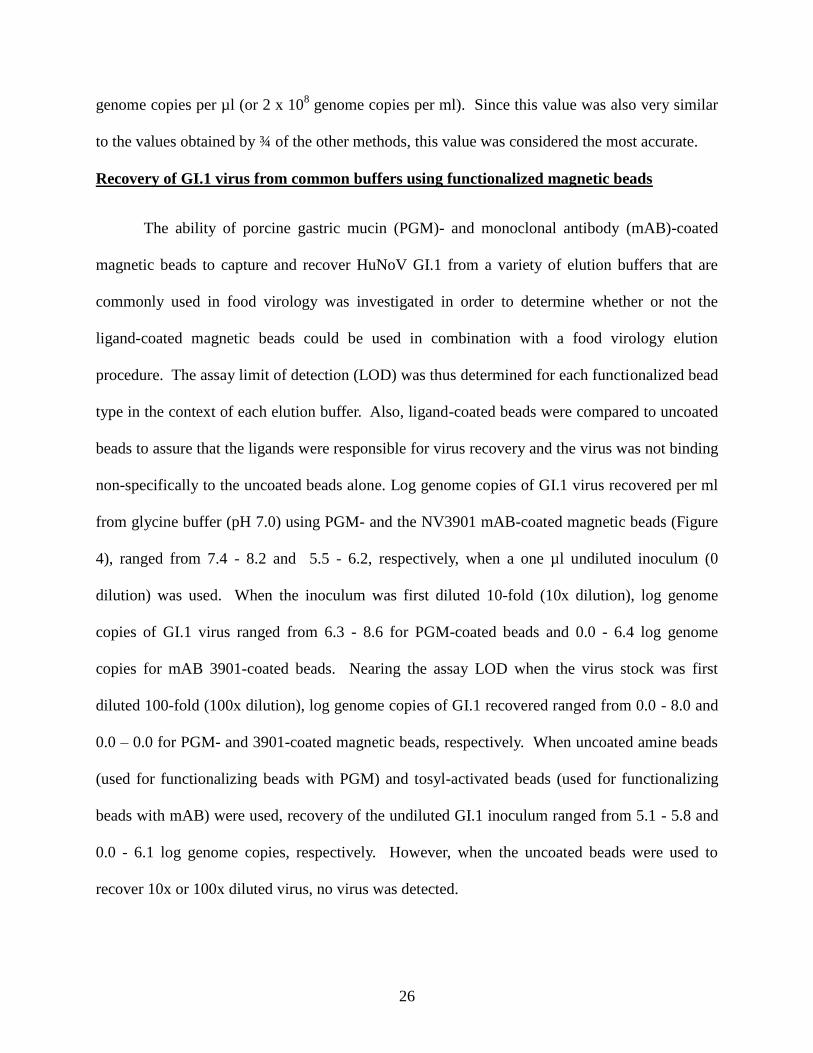
non-specifically to the uncoated beads alone. Log genome copies of GI.1 virus recovered per ml
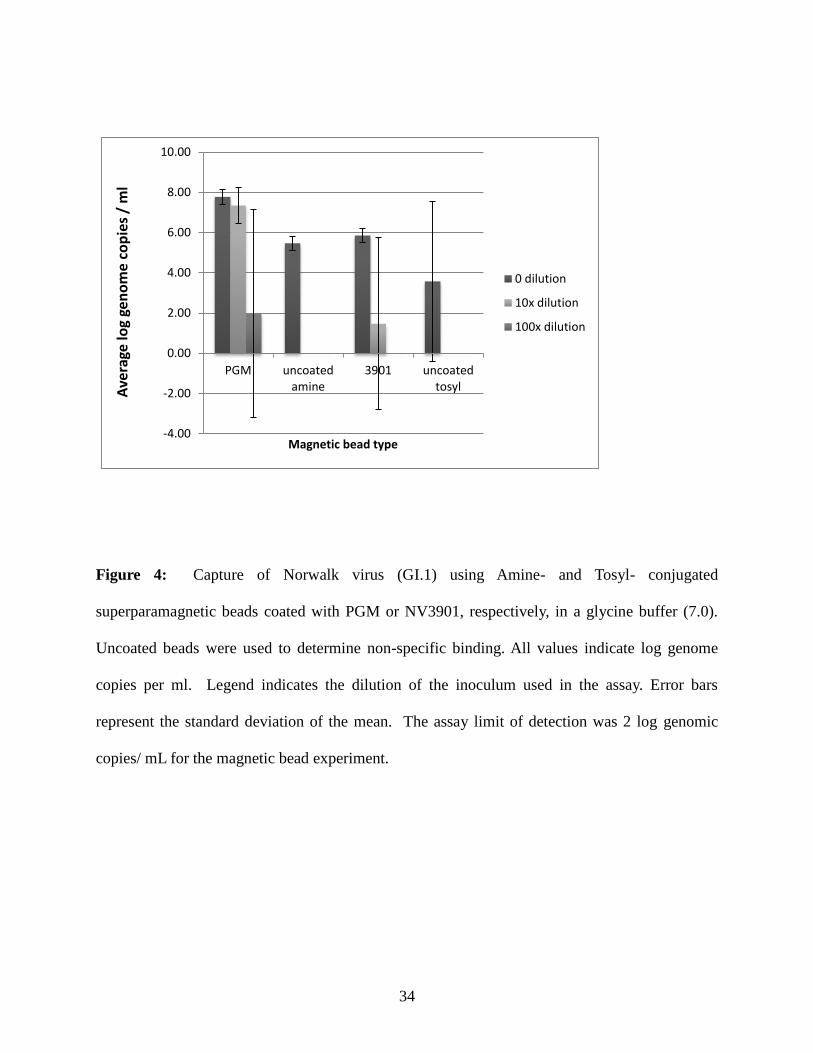
from glycine buffer (pH 7.0) using PGM- and the NV3901 mAB-coated magnetic beads (Figure
4), ranged from 7.4 - 8.2 and 5.5 - 6.2, respectively, when a one µl undiluted inoculum (0
dilution) was used. When the inoculum was first diluted 10-fold (10x dilution), log genome
copies of GI.1 virus ranged from 6.3 - 8.6 for PGM-coated beads and 0.0 - 6.4 log genome
copies for mAB 3901-coated beads. Nearing the assay LOD when the virus stock was first
diluted 100-fold (100x dilution), log genome copies of GI.1 recovered ranged from 0.0 - 8.0 and
0.0 – 0.0 for PGM- and 3901-coated magnetic beads, respectively. When uncoated amine beads
(used for functionalizing beads with PGM) and tosyl-activated beads (used for functionalizing
beads with mAB) were used, recovery of the undiluted GI.1 inoculum ranged from 5.1 - 5.8 and
0.0 - 6.1 log genome copies, respectively. However, when the uncoated beads were used to
recover 10x or 100x diluted virus, no virus was detected.
27
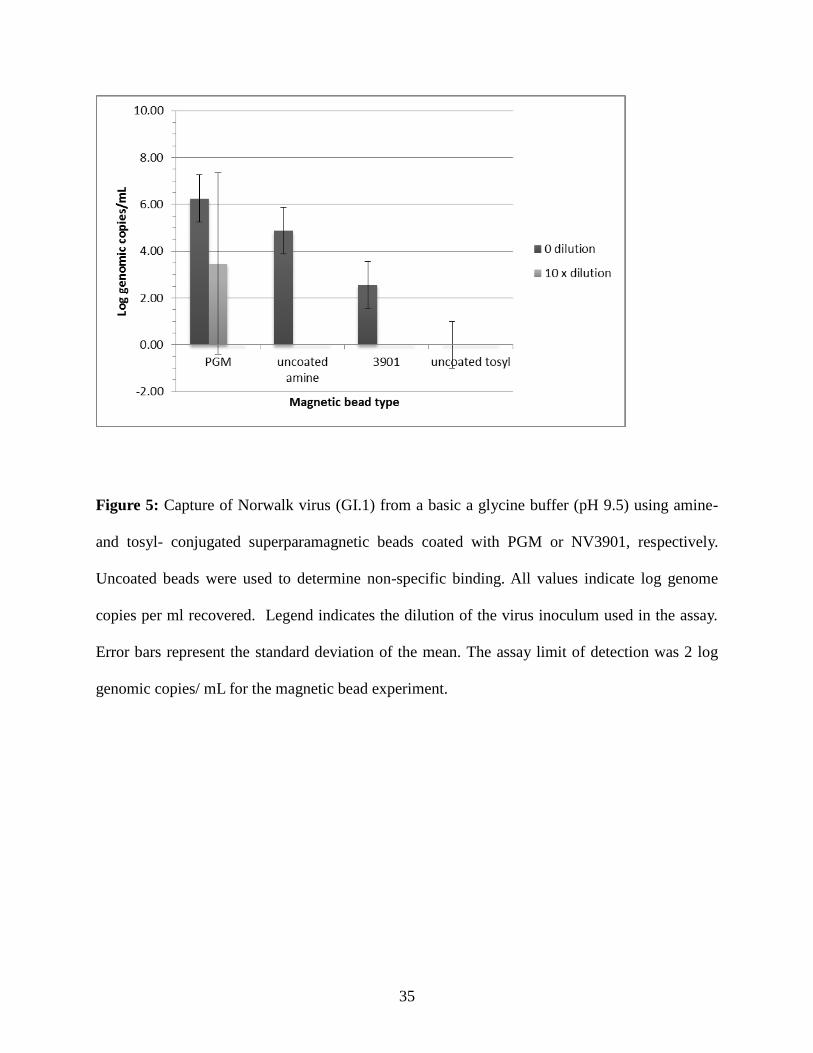
Less GI.1 norovirus was recovered from a basic pH glycine buffer (pH 9.5) by PGM-
coated and NV3901-coated beads (Figure 5), at all dilutions of the inoculum tested [0 or 10x
dilutions (100x was not tested due to poor recovery when tested in Glycine 7.0)]. PGM-coated
beads outperformed NV3901-coated beads, with recoveries ranging from 5.6 - 7.2 and 0.0 - 5.8
log genome copies / ml recovered when undiluted and 10x diluted inoculums were used. For
NV3901-coated beads, recovery of the undiluted inoculum ranged from 0.0 - 5.2 log genome
copies / ml but no virus could be detected when the 10x diluted inoculum was used. Only
uncoated amine beads produced a virus recovery range of 4.1 - 6.7 log genome copies / ml when
the undiluted stool suspension was used; all other dilutions yielded no virus recovery, similar to
uncoated tosyl-activated at all inoculum concentrations tested.
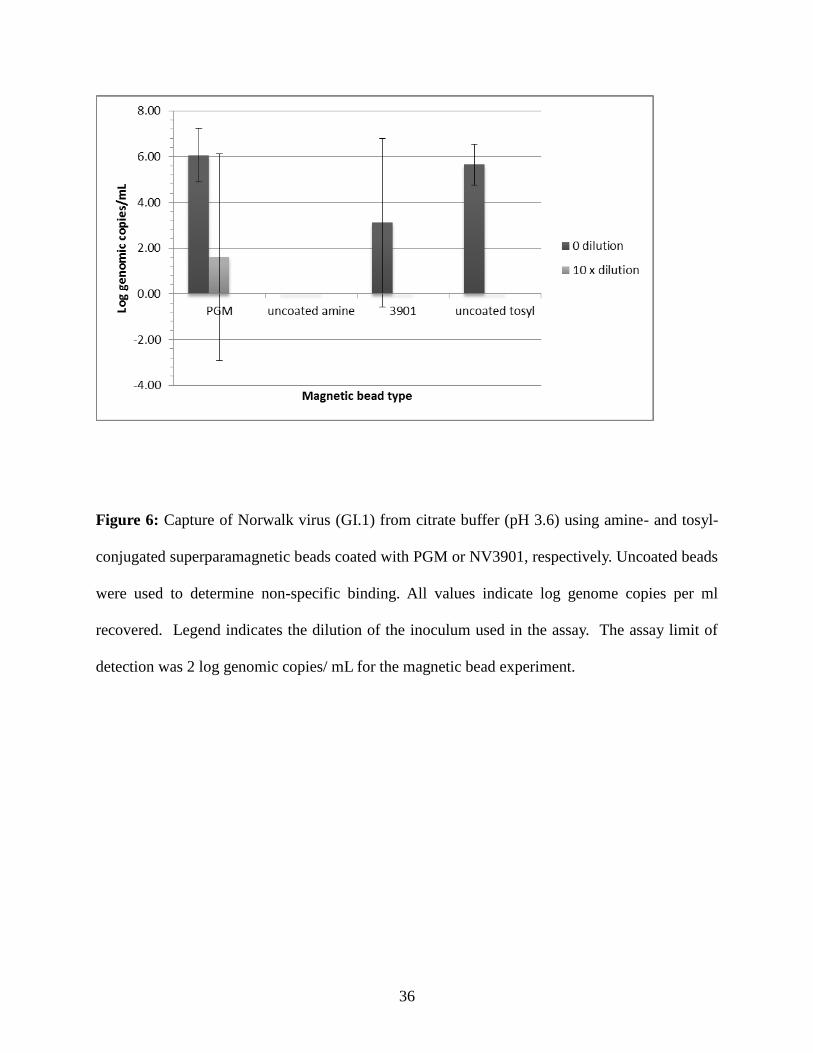
In citrate buffer (pH 3.6) (Figure 6), PGM-coated beads provided a recovery range for
GI.1 virus of 5.3 - 7.4 log genome copies / ml for the undiluted inoculum and 0.0 - 6.4 log
genome copies / ml for the 10x diluted inoculum, while virus recovery using NV3901-coated
beads ranged from 0.0 - 6.1 log genome copies / ml for the undiluted and 0.0 log genome copies /
ml for the 10x diluted inoculum. Uncoated amine beads did not recover virus at any dilution.
Uncoated tosyl beads recovered virus only when the undiluted inoculum was used (range 4.7 -
6.4 genome copies / ml), but the average number of viruses detected using the uncoated tosyl
beads was greater than the average recovered using the NV3901- coated beads.
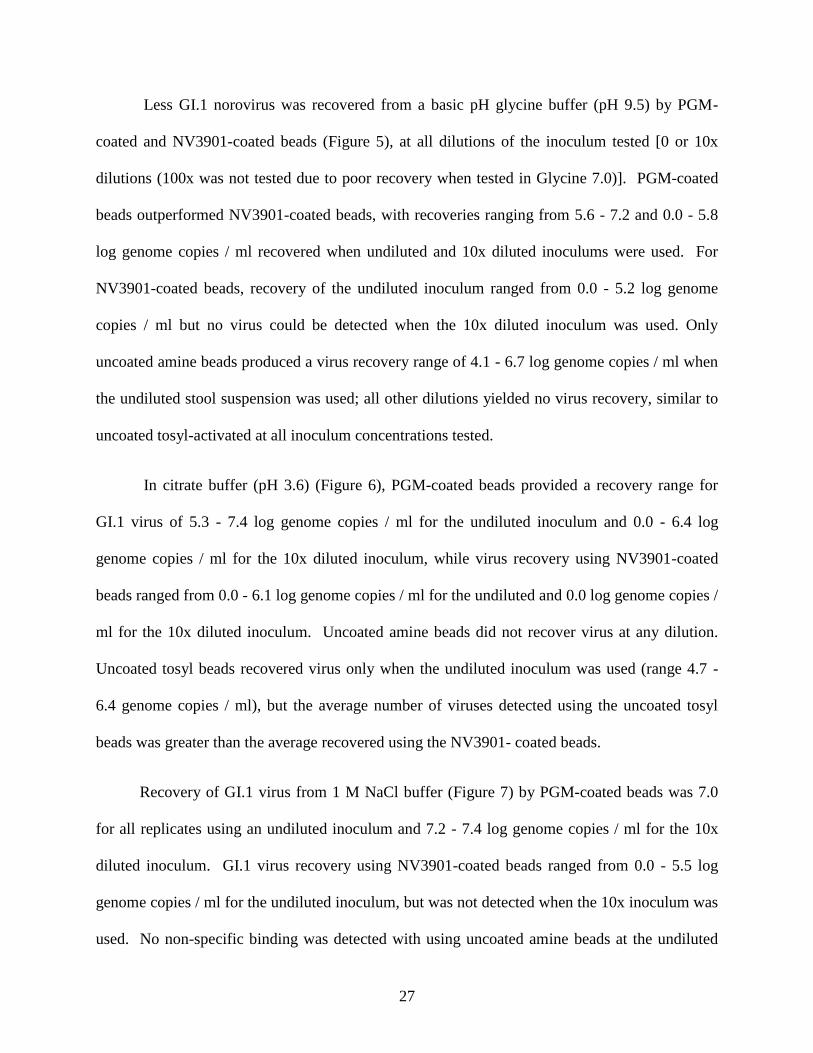
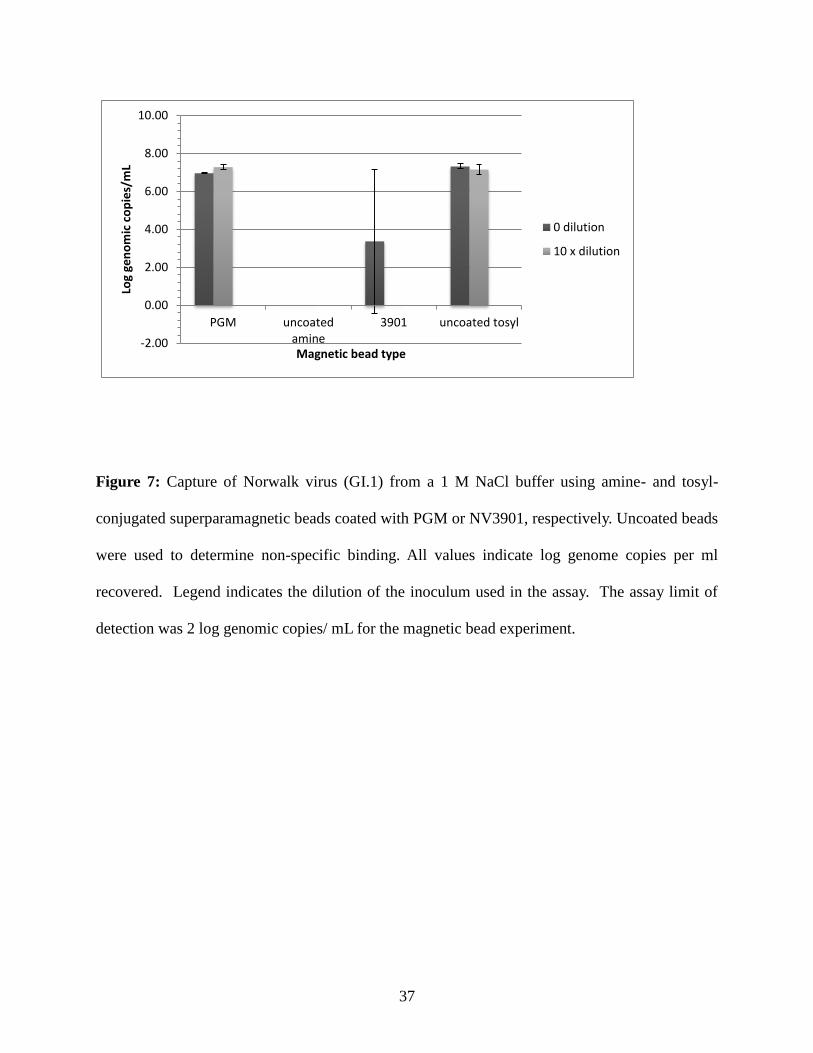
Recovery of GI.1 virus from 1 M NaCl buffer (Figure 7) by PGM-coated beads was 7.0
for all replicates using an undiluted inoculum and 7.2 - 7.4 log genome copies / ml for the 10x
diluted inoculum. GI.1 virus recovery using NV3901-coated beads ranged from 0.0 - 5.5 log
genome copies / ml for the undiluted inoculum, but was not detected when the 10x inoculum was
used. No non-specific binding was detected with using uncoated amine beads at the undiluted
28
and 10x diluted inoculum levels, but the uncoated tosyl- beads recovered 7.2 - 7.4 log genome
copies / ml from the undiluted inoculum and 7.0 - 7.4 log genome copies / ml from the 10x
diluted inoculum.
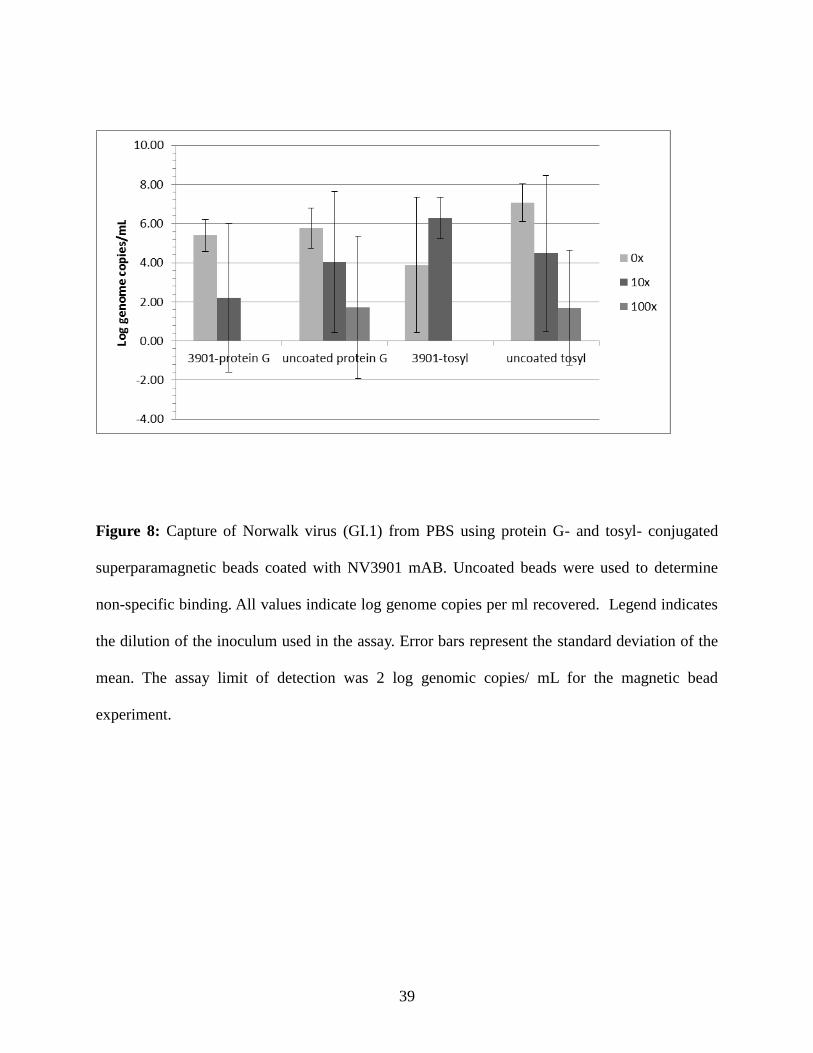
The tosyl activated beads bind in the Fab region of the antibody and the protein G beads
bind the Fc or “tail” region. Binding of the Fab region may cause steric hindrance that prohibits
viral binding to the surface. To rule out the possibility that the NV3901 mAB was either not
being presented in the correct orientation on the magnetic beads, or it was damaged in the
process of conjugating it on the tosyl-activated beads; the assay was repeated using protein G
coated magnetic beads. Unlike the coating process for tosyl-activated beads, mild buffering
conditions were used to coat mAB in the correct orientation on the surface of protein G beads.
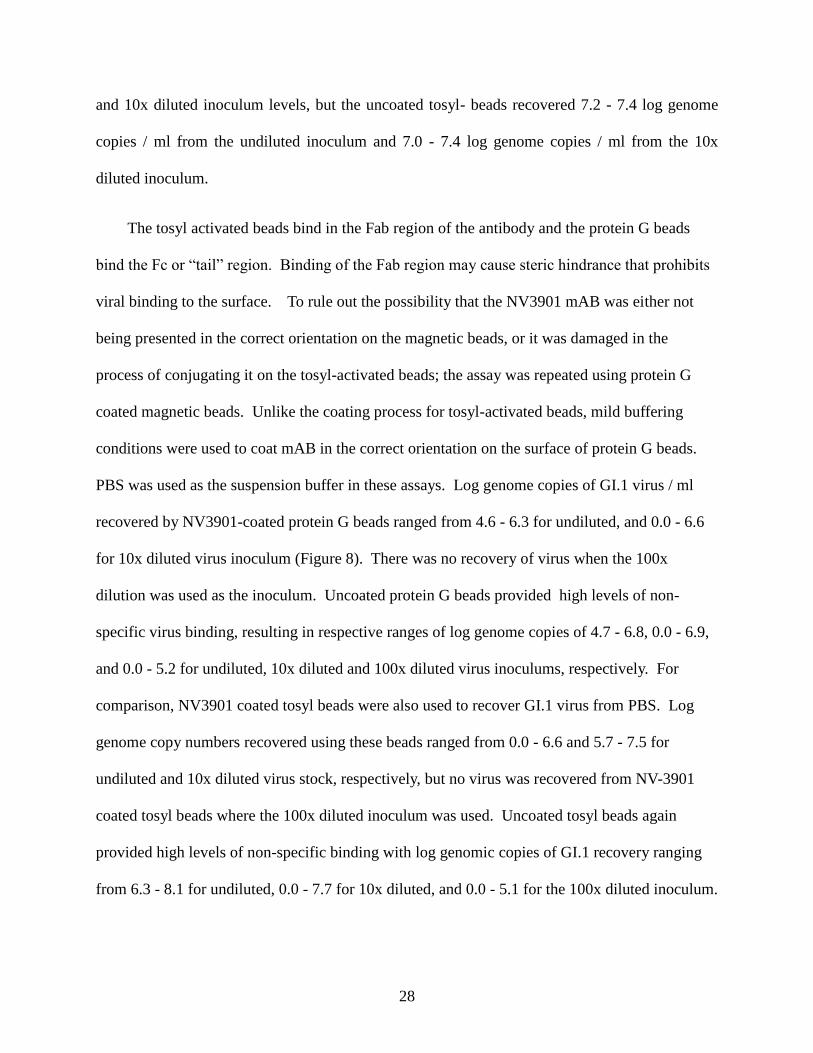
PBS was used as the suspension buffer in these assays. Log genome copies of GI.1 virus / ml
recovered by NV3901-coated protein G beads ranged from 4.6 - 6.3 for undiluted, and 0.0 - 6.6
for 10x diluted virus inoculum (Figure 8). There was no recovery of virus when the 100x
dilution was used as the inoculum. Uncoated protein G beads provided high levels of non-
specific virus binding, resulting in respective ranges of log genome copies of 4.7 - 6.8, 0.0 - 6.9,
and 0.0 - 5.2 for undiluted, 10x diluted and 100x diluted virus inoculums, respectively. For
comparison, NV3901 coated tosyl beads were also used to recover GI.1 virus from PBS. Log
genome copy numbers recovered using these beads ranged from 0.0 - 6.6 and 5.7 - 7.5 for
undiluted and 10x diluted virus stock, respectively, but no virus was recovered from NV-3901
coated tosyl beads where the 100x diluted inoculum was used. Uncoated tosyl beads again
provided high levels of non-specific binding with log genomic copies of GI.1 recovery ranging
from 6.3 - 8.1 for undiluted, 0.0 - 7.7 for 10x diluted, and 0.0 - 5.1 for the 100x diluted inoculum.
29
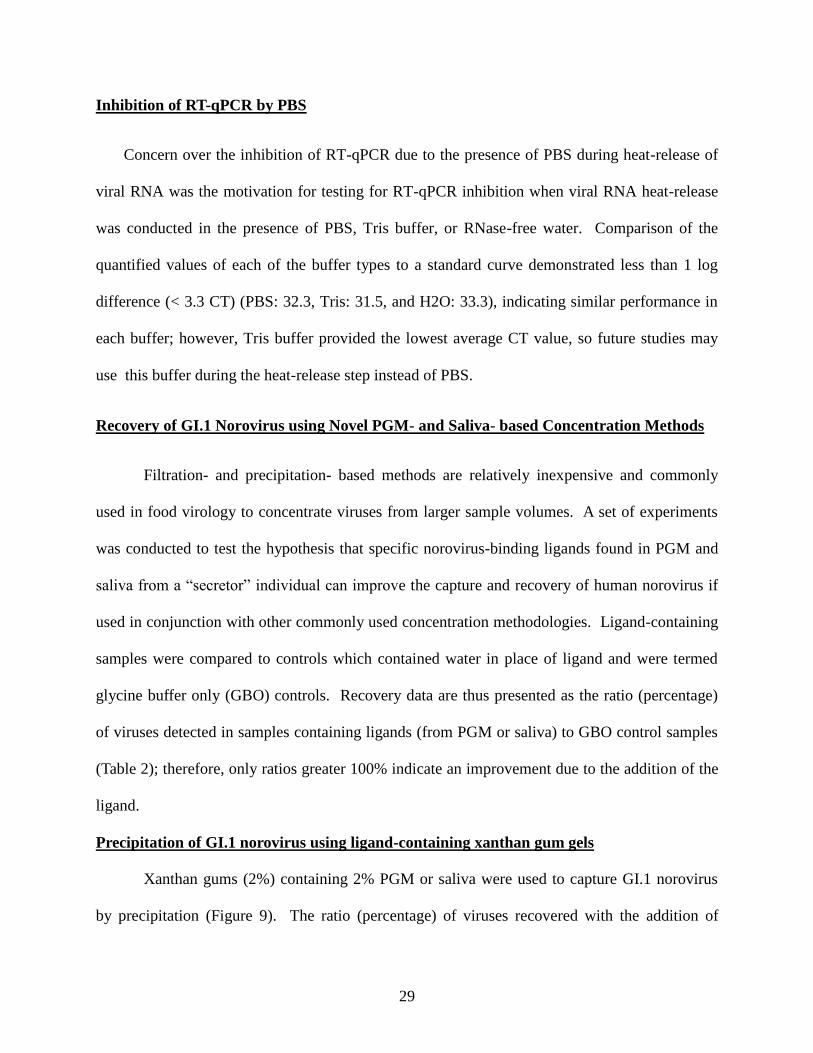
Inhibition of RT-qPCR by PBS
Concern over the inhibition of RT-qPCR due to the presence of PBS during heat-release of
viral RNA was the motivation for testing for RT-qPCR inhibition when viral RNA heat-release
was conducted in the presence of PBS, Tris buffer, or RNase-free water. Comparison of the
quantified values of each of the buffer types to a standard curve demonstrated less than 1 log
difference (< 3.3 CT) (PBS: 32.3, Tris: 31.5, and H2O: 33.3), indicating similar performance in
each buffer; however, Tris buffer provided the lowest average CT value, so future studies may
use this buffer during the heat-release step instead of PBS.
Recovery of GI.1 Norovirus using Novel PGM- and Saliva- based Concentration Methods
Filtration- and precipitation- based methods are relatively inexpensive and commonly
used in food virology to concentrate viruses from larger sample volumes. A set of experiments
was conducted to test the hypothesis that specific norovirus-binding ligands found in PGM and
saliva from a “secretor” individual can improve the capture and recovery of human norovirus if
used in conjunction with other commonly used concentration methodologies. Ligand-containing
samples were compared to controls which contained water in place of ligand and were termed
glycine buffer only (GBO) controls. Recovery data are thus presented as the ratio (percentage)
of viruses detected in samples containing ligands (from PGM or saliva) to GBO control samples
(Table 2); therefore, only ratios greater 100% indicate an improvement due to the addition of the
ligand.
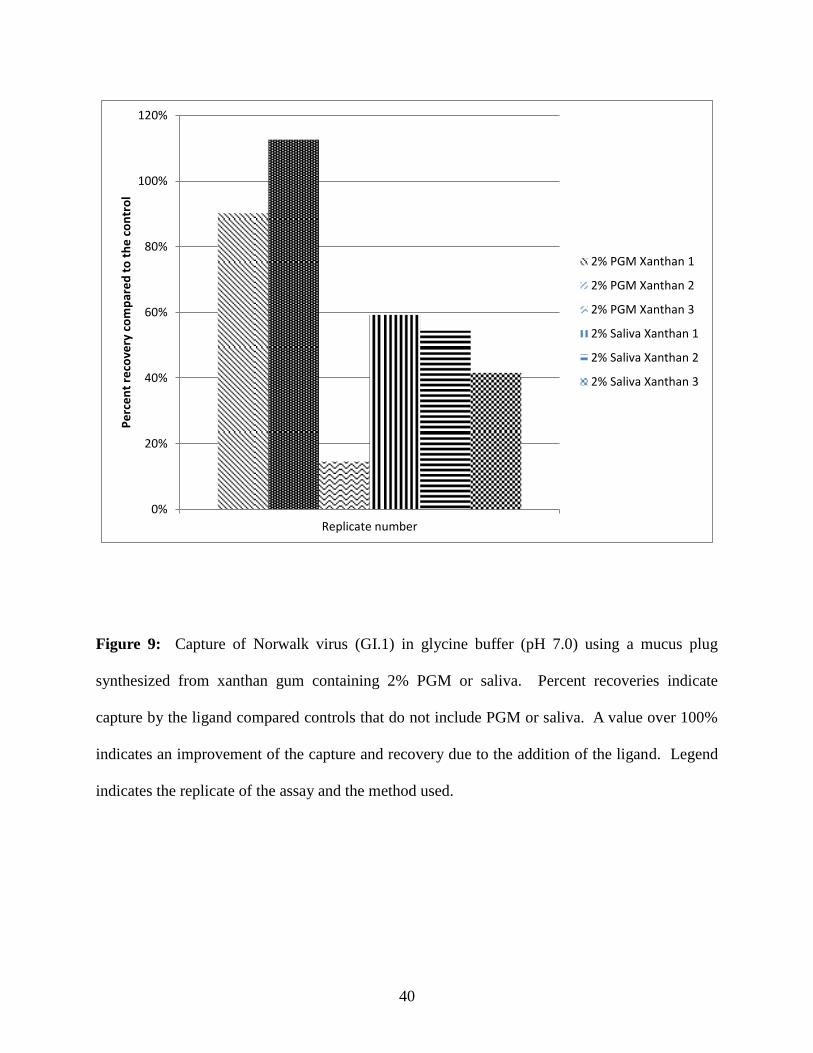
Precipitation of GI.1 norovirus using ligand-containing xanthan gum gels
Xanthan gums (2%) containing 2% PGM or saliva were used to capture GI.1 norovirus
by precipitation (Figure 9). The ratio (percentage) of viruses recovered with the addition of
30
ligand as compared to the no ligand controls ranged from 15% - 113% for the PGM-containing
gel plugs and from 42 - 59% for saliva-containing gel plugs. All three experimental replicates
resulted in recovery ratios near or less than 100%, indicating virus precipitation by xanthan gum-
containing plugs was not improved by the addition of PGM or saliva.
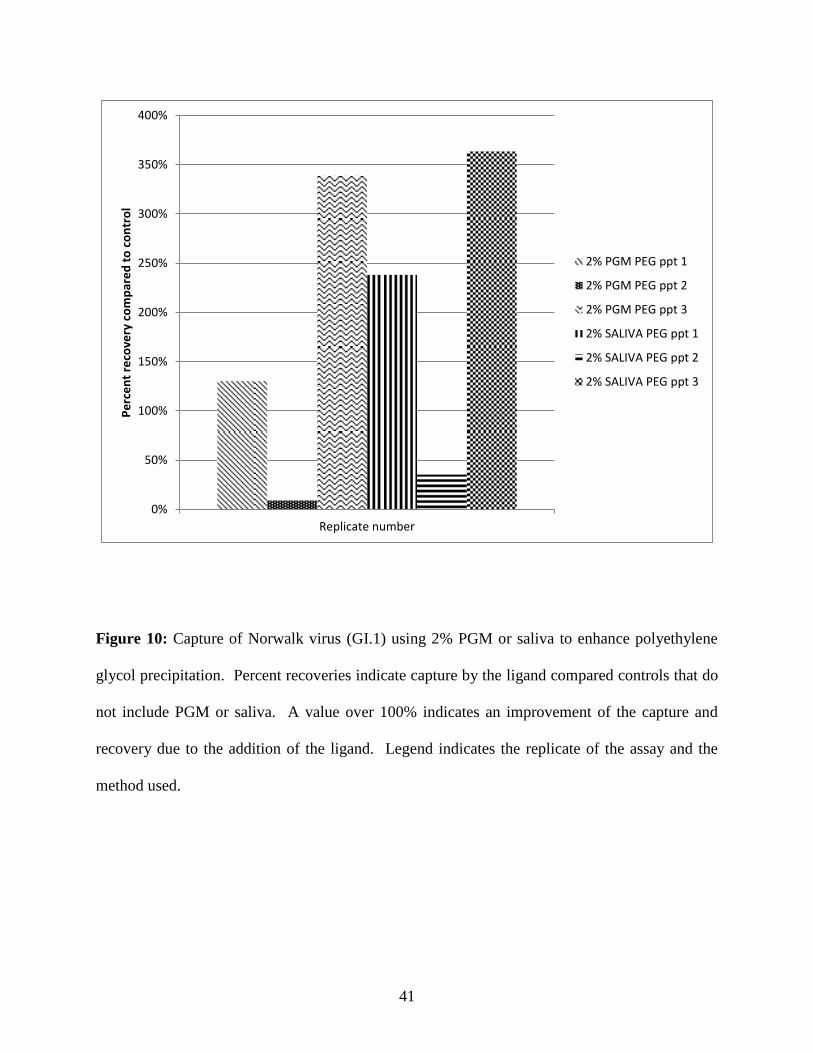
Precipitation of GI.1 norovirus using polyethylene glycol and ligands from PGM or saliva
Polyethylene glycol (MW 10,000) 10% (w/v) precipitation was performed in the presence
of 2% PGM or saliva and without the addition of ligand (control samples) (Figure 10). For
samples containing PGM, the ratio of recovery due to the ligand ranged from 9 - 339%.
Similarly, samples containing 2% saliva and precipitated by PEG resulted in a range of recovery
ratios from 35 - 364%. Results were highly variable for this set of experiments; in replicate
three, the addition of ligands increased the amount of virus that could be recovered by PEG
precipitation. However, in replicate two, the opposite was observed; the addition of PGM and
saliva appeared to decrease the amount of virus recovered by PEG precipitation.
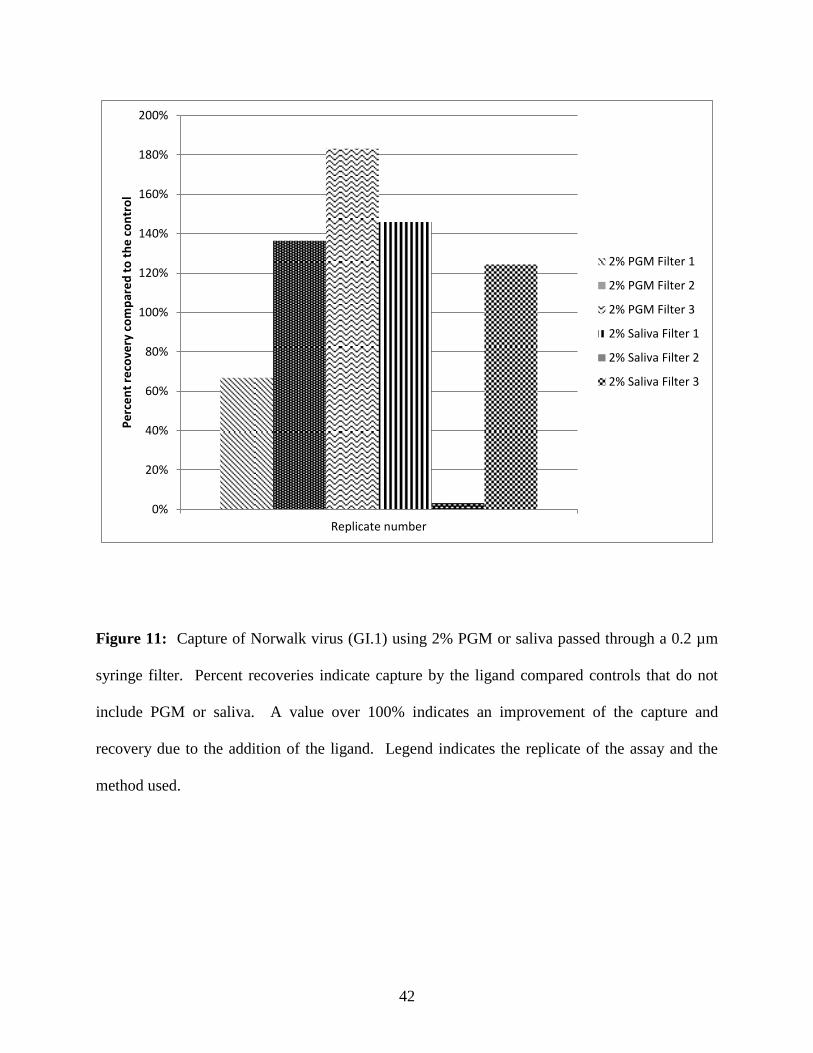
Filtration of GI.1 norovirus using ligands from PGM or saliva
When used in conjunction with a 0.2 µm filter, 2% PGM provided a 67-183% recovery
and 2% saliva yielded results that were more varied, ranging from 3-146% (Figure 11). PGM
provided higher recovery than saliva in 2 of 3 replicates tested and the results were more
consistent and reproducible.
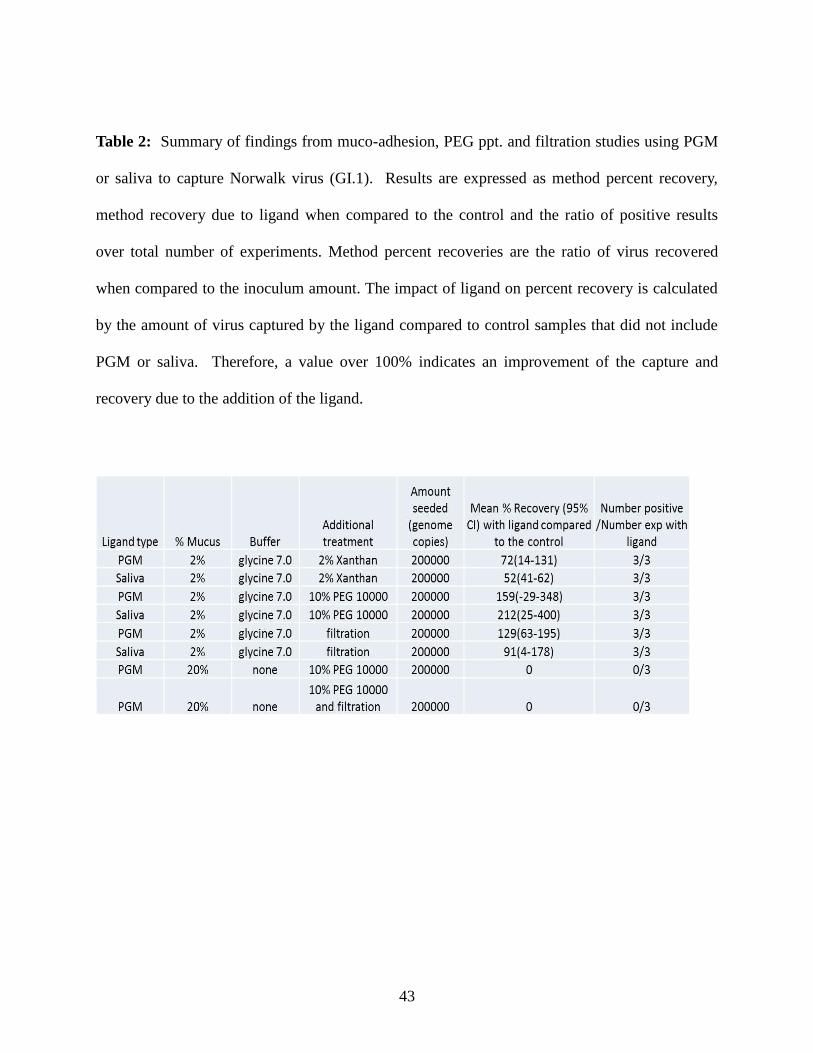
Impact of increasing PGM concentration and combining recovery methods
To determine if an increase in PGM concentration was beneficial to viral recovery, the PGM
concentration was increased from 2%-20%. The filter assay was retested with this higher
concentration of PGM. In addition to increasing the concentration alone, the higher PGM
31
concentration was combined with 10% PEG 10,000 to determine if a combination of these two
methods would promote recovery. Performing these assays in the presence of increased PGM
concentration, yielded negative results for each of three replicates of each assay type (20% PGM
with 10% PEG 10000 as well as 20% PGM with the 0.2 µm filter). Presence of RT-PCR
inhibitors in the samples was investigated as a cause of the negative results. However, with the
exception of one sample containing both 2% PGM and 10% PEG, RT-PCR inhibition was not a
concern.
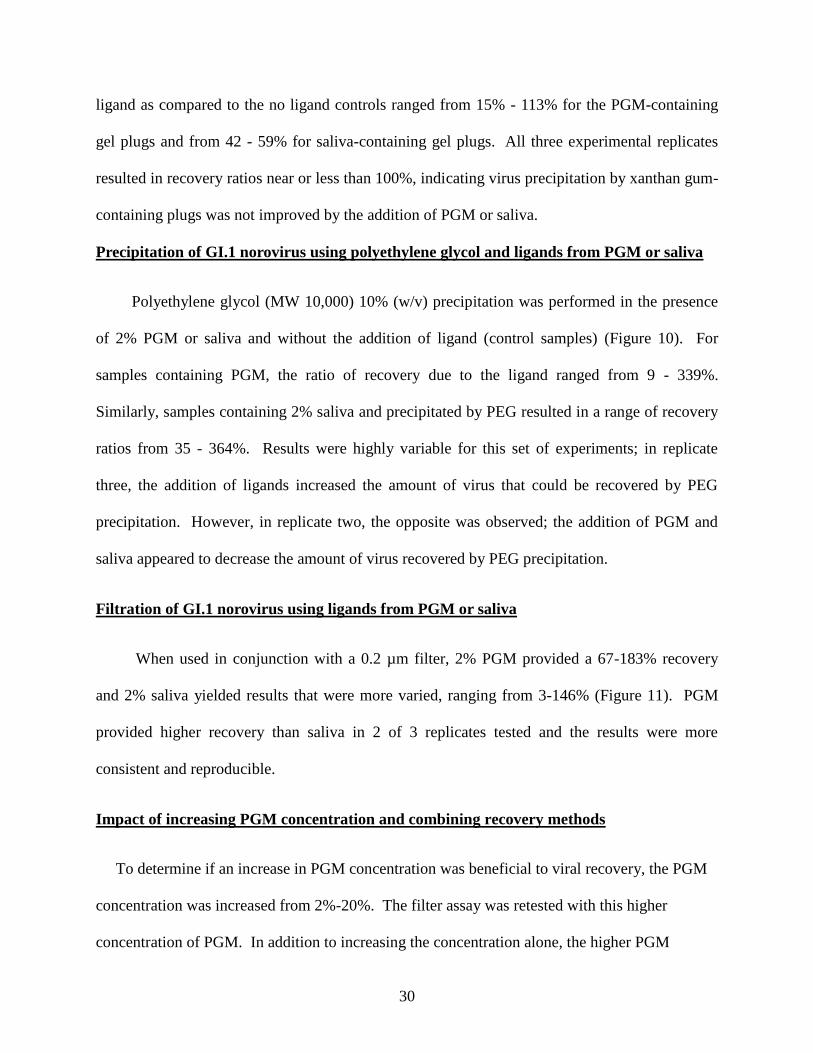
Figure 1: End-point titration and real-time RT-PCR amplification of RNA from the GI.1
positive stool suspension used in the experiments described herein. Ct (cycle threshold) values
where the change in fluorecence (Delta Rn) crosses a threshold (separating signal from
background noise) for the 10-fold serial diluted (10-1
to 10-7
from left to right) RNA is depicted.
32
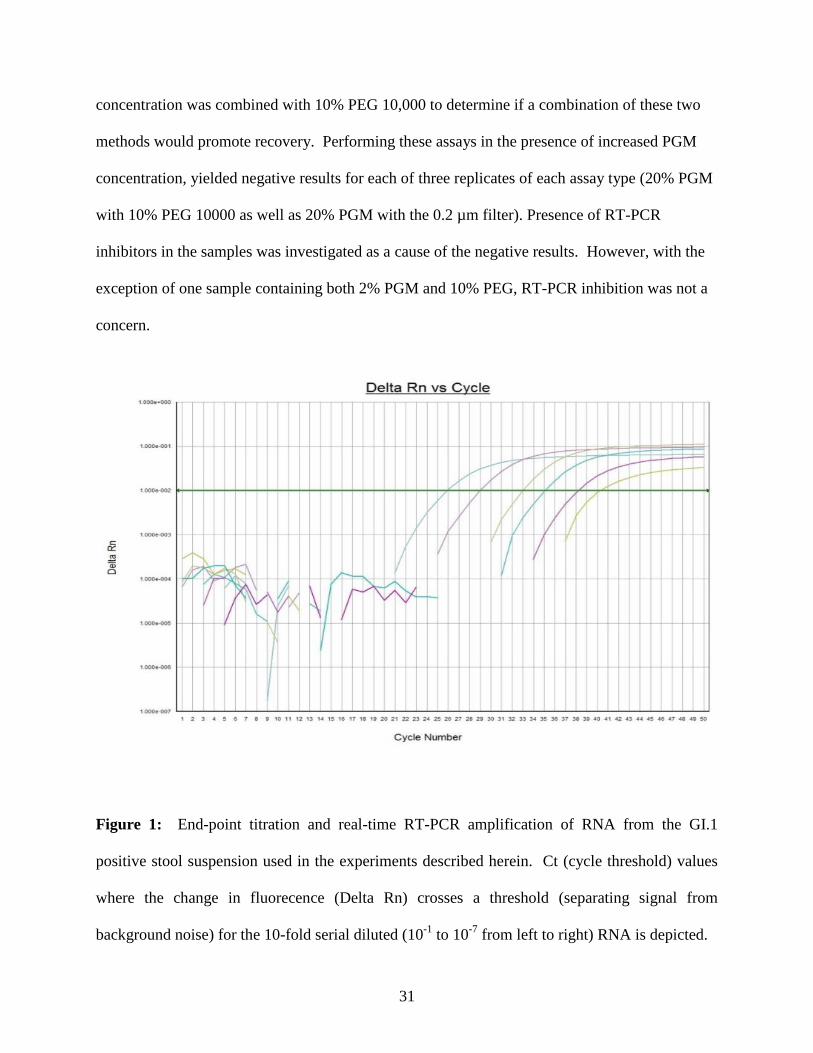
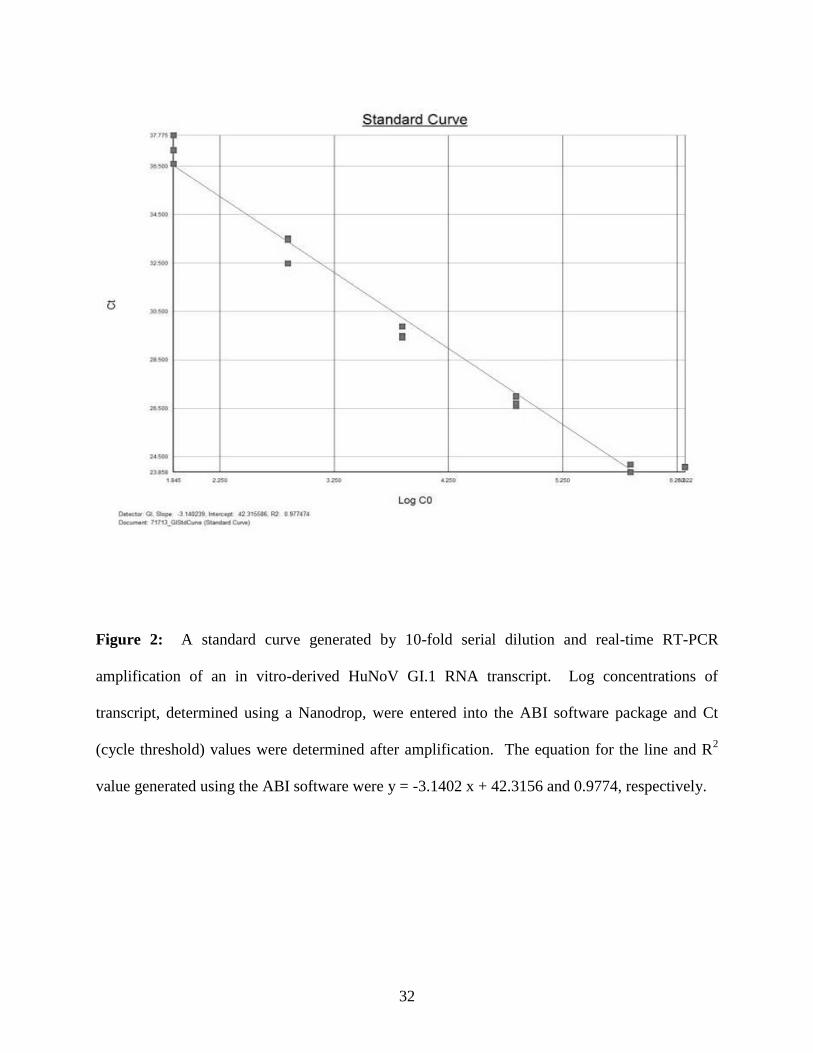
Figure 2: A standard curve generated by 10-fold serial dilution and real-time RT-PCR
amplification of an in vitro-derived HuNoV GI.1 RNA transcript. Log concentrations of
transcript, determined using a Nanodrop, were entered into the ABI software package and Ct
(cycle threshold) values were determined after amplification. The equation for the line and R2
value generated using the ABI software were y = -3.1402 x + 42.3156 and 0.9774, respectively.
33
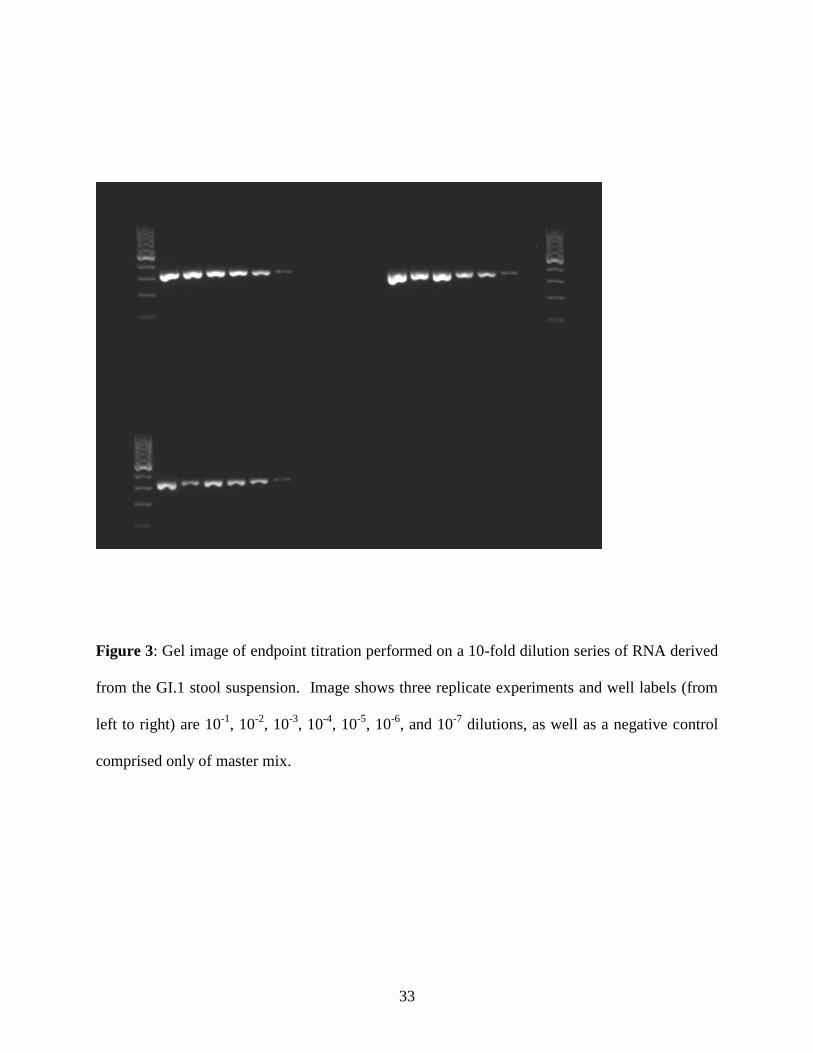
Figure 3: Gel image of endpoint titration performed on a 10-fold dilution series of RNA derived
from the GI.1 stool suspension. Image shows three replicate experiments and well labels (from
left to right) are 10-1
, 10-2
, 10-3
, 10-4
, 10-5
, 10-6
, and 10-7
dilutions, as well as a negative control
comprised only of master mix.
34
-4.00
-2.00
0.00
2.00
4.00
6.00
8.00
10.00
PGM uncoatedamine
3901 uncoatedtosylA
vera
ge lo
g ge
no
me
co
pie
s /
ml
Magnetic bead type
0 dilution
10x dilution
100x dilution
Figure 4: Capture of Norwalk virus (GI.1) using Amine- and Tosyl- conjugated
superparamagnetic beads coated with PGM or NV3901, respectively, in a glycine buffer (7.0).
Uncoated beads were used to determine non-specific binding. All values indicate log genome
copies per ml. Legend indicates the dilution of the inoculum used in the assay. Error bars
represent the standard deviation of the mean. The assay limit of detection was 2 log genomic
copies/ mL for the magnetic bead experiment.
35
Figure 5: Capture of Norwalk virus (GI.1) from a basic a glycine buffer (pH 9.5) using amine-
and tosyl- conjugated superparamagnetic beads coated with PGM or NV3901, respectively.
Uncoated beads were used to determine non-specific binding. All values indicate log genome
copies per ml recovered. Legend indicates the dilution of the virus inoculum used in the assay.
Error bars represent the standard deviation of the mean. The assay limit of detection was 2 log
genomic copies/ mL for the magnetic bead experiment.
36
Figure 6: Capture of Norwalk virus (GI.1) from citrate buffer (pH 3.6) using amine- and tosyl-
conjugated superparamagnetic beads coated with PGM or NV3901, respectively. Uncoated beads
were used to determine non-specific binding. All values indicate log genome copies per ml
recovered. Legend indicates the dilution of the inoculum used in the assay. The assay limit of
detection was 2 log genomic copies/ mL for the magnetic bead experiment.
37
-2.00
0.00
2.00
4.00
6.00
8.00
10.00
PGM uncoatedamine
3901 uncoated tosyl
Log
gen
om
ic c
op
ies/
mL
Magnetic bead type
0 dilution
10 x dilution
Figure 7: Capture of Norwalk virus (GI.1) from a 1 M NaCl buffer using amine- and tosyl-
conjugated superparamagnetic beads coated with PGM or NV3901, respectively. Uncoated beads
were used to determine non-specific binding. All values indicate log genome copies per ml
recovered. Legend indicates the dilution of the inoculum used in the assay. The assay limit of
detection was 2 log genomic copies/ mL for the magnetic bead experiment.
38
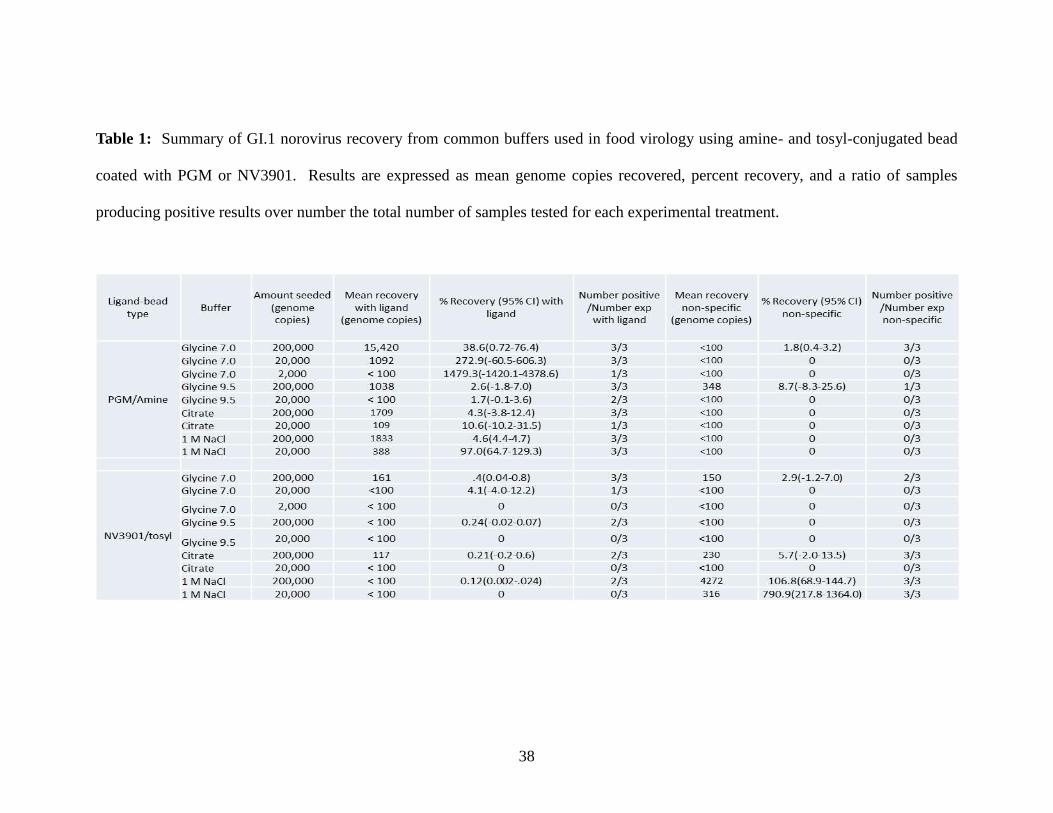
Table 1: Summary of GI.1 norovirus recovery from common buffers used in food virology using amine- and tosyl-conjugated bead
coated with PGM or NV3901. Results are expressed as mean genome copies recovered, percent recovery, and a ratio of samples
producing positive results over number the total number of samples tested for each experimental treatment.
39
Figure 8: Capture of Norwalk virus (GI.1) from PBS using protein G- and tosyl- conjugated
superparamagnetic beads coated with NV3901 mAB. Uncoated beads were used to determine
non-specific binding. All values indicate log genome copies per ml recovered. Legend indicates
the dilution of the inoculum used in the assay. Error bars represent the standard deviation of the
mean. The assay limit of detection was 2 log genomic copies/ mL for the magnetic bead
experiment.
40
0%
20%
40%
60%
80%
100%
120%
Replicate number
Pe
rce
nt
reco
very
co
mp
are
d t
o t
he
co
ntr
ol
2% PGM Xanthan 1
2% PGM Xanthan 2
2% PGM Xanthan 3
2% Saliva Xanthan 1
2% Saliva Xanthan 2
2% Saliva Xanthan 3
Figure 9: Capture of Norwalk virus (GI.1) in glycine buffer (pH 7.0) using a mucus plug
synthesized from xanthan gum containing 2% PGM or saliva. Percent recoveries indicate
capture by the ligand compared controls that do not include PGM or saliva. A value over 100%
indicates an improvement of the capture and recovery due to the addition of the ligand. Legend
indicates the replicate of the assay and the method used.
41
0%
50%
100%
150%
200%
250%
300%
350%
400%
Replicate number
Pe
rce
nt
reco
very
co
mp
are
d t
o c
on
tro
l
2% PGM PEG ppt 1
2% PGM PEG ppt 2
2% PGM PEG ppt 3
2% SALIVA PEG ppt 1
2% SALIVA PEG ppt 2
2% SALIVA PEG ppt 3
Figure 10: Capture of Norwalk virus (GI.1) using 2% PGM or saliva to enhance polyethylene
glycol precipitation. Percent recoveries indicate capture by the ligand compared controls that do
not include PGM or saliva. A value over 100% indicates an improvement of the capture and
recovery due to the addition of the ligand. Legend indicates the replicate of the assay and the
method used.
42
0%
20%
40%
60%
80%
100%
120%
140%
160%
180%
200%
Replicate number
Pe
rce
nt
reco
very
co
mp
are
d t
o t
he
co
ntr
ol
2% PGM Filter 1
2% PGM Filter 2
2% PGM Filter 3
2% Saliva Filter 1
2% Saliva Filter 2
2% Saliva Filter 3
Figure 11: Capture of Norwalk virus (GI.1) using 2% PGM or saliva passed through a 0.2 µm
syringe filter. Percent recoveries indicate capture by the ligand compared controls that do not
include PGM or saliva. A value over 100% indicates an improvement of the capture and
recovery due to the addition of the ligand. Legend indicates the replicate of the assay and the
method used.
43
Table 2: Summary of findings from muco-adhesion, PEG ppt. and filtration studies using PGM
or saliva to capture Norwalk virus (GI.1). Results are expressed as method percent recovery,
method recovery due to ligand when compared to the control and the ratio of positive results
over total number of experiments. Method percent recoveries are the ratio of virus recovered
when compared to the inoculum amount. The impact of ligand on percent recovery is calculated
by the amount of virus captured by the ligand compared to control samples that did not include
PGM or saliva. Therefore, a value over 100% indicates an improvement of the capture and
recovery due to the addition of the ligand.
44
CHAPTER 5
DISCUSSION
Quantification of the viral inoculum was determined using five separate methods and
results were compared. Four of five methods yielded similar results, but the use of the GI.3b
standard resulted in a titer that was 0.4 to 1 log greater in value than the titers estimated by other
methods or calculated by using the GI.1 standard. The value of 2 x 10⁸ genome copies per ml,
generated by averaging the virus stock calculations determined with each experiment and after
end-point titration of the virus stock, was adopted for the stock concentration, as it was
considered to be the most accurate estimate.
In determining the limit of detection (LOD) of viral recovery using ligand-coated
functionalized magnetic beads, it was observed that both an increase and decrease of pH
decreased binding of the virus to the PGM- or mAB-coated functionalized magnetic beads. The
lack of improvement by a decrease in pH is in direct contrast to a previous study that showed an
increase in viral binding to PGM-conjugated magnetic beads when using citrate buffer (pH 3.0-
6.0) when compared to neutral pH.97
The isoelectric point (pI) of GI.1 Norwalk virus is 5.5-
6.5115
and the pI of PGM is 2-3116
, meaning that in a buffer matrix at a pH of 3.6, the virus would
become positively charged and the PGM would remain negatively charged, thus causing an
attraction of oppositely charged particles which may increase virus recovery.117
There is also
evidence that citrate acts as a fucose molecular mimic by binding to the receptor-binding pocket
of the norovirus capsid.118
If this is the case, citrate would serve to effectively block viral
binding to the HBGA-containing PGM-coated magnetic beads. Although Tian et al (2010) also
45
used citrate buffer when conducting the low pH buffer experiments described above, the authors
also used carboxyl-derivatized beads instead of the amine-conjugated beads that were used in the
experiments described herein. Therefore, it is possible that the blocking aspects of citrate buffer
were overwhelmed by an increase in non-specific binding to the carboxyl groups on the beads. It
is also worth noting that although ELISA results indicated a clear increase in GI.1 VLP binding
to PGM-coated beads in the low pH buffer, the increase in GI.1 virus binding to these beads was
minimal (approximately a 1 CT value difference).97
Differences in the behavior of GI.1 virus
and its VLPs binding to PGM are therefore likely.
PGM-coated amine beads and NV3901-coated tosylactivated beads in the context of
glycine 7.0 demonstrated the highest levels of viral recovery and lowest detection limit, but also
provided high levels of non-specific binding on both bead types. PGM-coated amine beads in
the context of 1 M NaCl PBS, on the other hand, consistently demonstrated a low detection limit
with little to no non-specific binding. This indicates that future assays should be performed in a
neutral pH buffer and depending on the objectives of the recovery procedure, either glycine
buffer (pH 7) or the 1 M NaCl PBS buffer can be used.
Non-specific binding was problematic in many cases. This type of non-specific
adsorption of the virus to the functional groups (tosyl, amine or protein G) of the beads, varied
depending on the buffer used. Tosyl-activated beads provided more non-specific binding than
did amine-linked beads in all buffer types tested. The highest level of non-specific binding to
tosyl-activated beads was found when using 1 M NaCl in PBS in both the 0 and 10x dilutions of
the inoculum. Because 1 M NaCl typically disrupts the electrostatic virus-surface interaction,
this is not what was expected. Amine-conjugated beads provided non-specific virus binding in
the undiluted inoculum in the context of glycine buffer at both pH 7.0 and pH 9.5. This is also
46
not what was expected, as typically, the high protein content of glycine buffer with 3% beef
extract increases competitive binding and, therefore, viral elution off of surfaces.
Overall, PGM- coated beads out-performed NV3901- coated beads for recovering GI.1
norovirus in all buffers tested. PGM-coated beads demonstrated consistent recovery of both 0
and 10x diluted inoculum in all buffer matrices and demonstrated recovery of 100x dilution in
glycine (7.0). Although NV3901-coated beads had recovery of 0 and 10x diluted inoculum in 1
M NaCl, the recovery was limited to the 0 dilution of the inoculum in all other matrices. This is
likely due to the broader specificity of binding sites found in the HBGA-containing PGM
compared to the mAB and is important to consider in future work with various genotypes. PGM
was added to the beads at a concentration of 60 µg/ mg of beads and NV3901 was added at 20
µg/ mg of beads. This is important to note as having a higher concentration of binding sites
available may have increased the recovery by PGM versus that of NV3901. It is also possible
that there were inhibitors such as interfering proteins or carbohydrates still present from the
stool-derived GI.1 sample that competitively bound to the antibody, but not to the PGM.
Another consideration is that mutations could have accumulated in the capsid protein of the GI.1
virus using as the inoculum, thereby limiting its interaction with the hyper-specific mAB, but not
the PGM. Because the monoclonal antibody (NV-3901) was selected by using a Norwalk virus
VLP, it would be possible to compare the sequence of the Norwalk virus derived from the stool
samples to the sequence of nucleic acids encoding the VLP in the recombinant baculovirus
vector. The mAB NV3901 binding site has been mapped119
therefore, mutations present in that
region can easily be determined.
Since it was possible that the mAB NV3901 was not displayed on the tosyl-activated
beads in an orientation that was conducive to viral binding, protein G-coated beads were
47
investigated as an alternative. According to the manufacturer of the tosyl-activated beads
(Dynal), the sulphonyl esters found on the bead bind with the more hydrophobic Fab region of
the antibody. This differs from the binding that occurs in the Fc region of the protein G beads.
Binding at the Fab region shortens the length of the antibody that is presented and may not allow
as much flexibility in its presentation. Binding at the Fc region may allow for greater flexibility
in presentation, and therefore less steric hindrance created by binding viruses.
The lower LOD was 2 x10⁴ genome copies (average of three replications) for each
NV3901-coated protein G beads and NV3901-coated tosyl-activated beads. Non-specific
binding, however, was problematic with both bead types recovering approximately 1.7 log
genomic copies of the 100x dilution. Antibody orientation presentation is an important aspect to
consider in future investigations.
Exploration of other bead and/or buffer-types could prove useful in further method
optimization. Adjustment of pH and/or protein and ionic concentration could aid in driving
virus-ligand interactions and increase viral recovery. It is possible that through the commercial
processing of PGMs that there is degradation in some of the HBGA binding sites120
. PGMs that
are extracted under non-denaturing conditions have more responsive gel-forming properties than
commercially derived PGMs which are extracted under denaturing conditions121
. Therefore,
future experiments could be conducted with PGMs harvested from pig stomachs treated with
protease inhibitors in lieu of those that are commercially processed.
Based on findings in literature122
, it is possible that the phosphates present in the PBS
used to suspend the virus-bound beads prior to RNA heat-release, may sequester the divalent
cations (Mg2+
) that are necessary for the RT-qPCR reaction, making them unavailable in the
48
reaction. An assay was designed to investigate RT-PCR inhibition caused by PBS, when
compared to Tris buffer and nuclease-free water. It was determined that PBS demonstrated less
than a 1 log or 3.3 CT value difference when compared to water and was not considered
inhibitory; however, Tris buffer was slightly less inhibitory (1/2 log) when compared to PBS.
HBGA-containing PGM and saliva were added to other methodologies that are often used
during virus concentration or purification procedures to see if their addition could improve the
recovery of viruses using these methods. For example, a polyethylene Glycol (PEG)
precipitation method using 10% w/v PEG 10,000 molecular weight (MW) was used because it
was previously optimized using glycine and 3% beef extract.114
Either PGM or saliva was added
during the PEG dissolution step to see if it could improve virus precipitation once centrifuged.
Saliva with PEG precipitation yielded the highest percentage of recovery of all the novel assays
(PGM yielded second highest), but also displayed the most variability.
Other novel methods were also explored. Xanthan gum, which is used as a thickening
agent in food processing, was mixed with PGM or saliva for the muco-adhesion assay
experiments. The purpose of this was to see if a thick mucus-like substance containing HBGAs
could be created that would bind norovirus and could be easily precipitated with slow-speed
centrifugation. Xanthan gum, unlike other gums (e.g. Guar gum), is stable at a neutral pH and
therefore does not need to be dissolved into solution in an acidic pH environment in order to
achieve the desired viscosity. Because glycine pH 7.0 yielded the most consistent results with
the bead assays, all novel PGM and saliva assays were performed in this buffer. PGM or saliva
with xanthan gum contributed the least amount of improvement due to the addition of the ligand
when compared to the other novel methods tested.
49
Typically, ultra-filters are used rather than the 0.2 µm membrane filters used in this study
to concentrate norovirus from a liquid sample. This is because the viral particles are ~ 27-35 nm,
so typically the filter would allow the viral particle through. However, it was hypothesized that
PGM or saliva added to the samples prior to membrane filtration would surround the viral
particle via mucin interaction and would cause the particle to get trapped in the filter. Although
PGM and saliva both resulted in three of three positive replicates, PGM out-performed saliva by
having a 48% positive impact due to the addition of the ligand versus a 16% impact by saliva.
This may be attributed to the viscosity of PGM versus that of saliva in limiting the passage of
virus through the filter.
Overall, an addition of PGM and saliva to PEG precipitation yielded the most promising
results. There was an expectation that an increase of PGM concentration would increase viral
recovery and this was not the case as the assay yielded negative results in all three replicates.
Based on this data, testing was performed to determine if PGM was inhibitory and it was
determined that it was not.
There was an improvement due to the addition of PGM in all novel assays; although, this
improvement was not consistently demonstrated between replicates. Increasing PGM
concentration appears to have a negative effect on viral recovery, however; further testing may
need to be performed to determine the ideal concentration of mucins since inhibition has been
ruled out. In addition, PGM-coated beads out-performed NV3901-coated beads in all buffer
matrices tested. Based on this data, PGM appears to be a promising medium for viral recovery.
50
CHAPTER 6
CONCLUSIONS
This study is an important step in the development of low-cost, sensitive norovirus
detection methods. Since ultimately the goal of this line of investigation was to develop methods
for norovirus detection in food, it was important that all experiments were conducted with
elution buffers that are commonly used in Food Virology. PGM-coated beads proved to be the
most versatile and most compatible, out-performing the mAB-coated beads in nearly all buffer
matrices tested. However, the PGM-coated beads proved to be most compatible with the neutral
pH buffers, glycine buffer (pH 7.0) and the 1 M NaCl PBS buffer. Increasing and decreasing pH
had a negative effect on recovery (approximately a 2-log reduction in the undiluted inoculum),
but PGM-coated beads continued to out-perform mAB-coated beads in these matrices. Non-
specific binding was problematic, especially for uncoated tosyl-activated beads in the context of
1 M NaCl. Due to the possibility that antibody presentation by mAB-coated tosylated beads
could have created steric hindrance during virus attachment, protein-G beads coated with NV-
3901 were also investigated. Protein G beads performed slightly better than the tosyl-activated
beads (5.4 log recovery for protein G and 3.89 recovery in tosyl activated beads); although, LOD
was not improved using the protein G beads.
Unbound PGM and saliva appeared to enhance capture and recovery of human norovirus
when used in conjunction with PEG precipitation or membrane filtration; however, further
optimization is needed as reproducibility was problematic. Changes in mucus concentration,
molecular weight and percentage of PEG, or changes in filter size may all have a positive impact
on viral recovery using novel methods and will be considerations in future work. It is also
51
recommended that future work should be performed with native PGMs (extracted under non-
denaturing conditions) as these carbohydrates retain their gel-forming properties.
While Norwalk virus binding to PGM-coated beads proved to be more reliable than when
using the mAB-coated beads, the limit of detection (2 x 10^3 genomic copies) was still higher
than desired since the number of virus particles required to cause infection is as low as 10
particles. The novel assays explored in this experiment were even less effective and less
repeatable for Norwalk virus capture. It is therefore necessary to continue method optimization
and development and decrease the assay limit of detection in order to make it an effective means
of detection of norovirus during an outbreak investigation. In conclusion, the ligand-based
assays investigated in this study demonstrate potential as rapid and cost-effective means of
recovering and concentrating norovirus from food and water samples, as they are compatible
with buffers commonly used in food virology. Future work need be directed toward lowering the
assay limit of detection and expansion to include other norovirus genotypes.
52
REFERENCES
1. Patel, M. M., Hall, A. J., Vinje, J. & Parashara, U. D. (2009). Noroviruses: A
comprehensive review. Journal of Clinical Virology 44, 1-8.
2. Hale, A. D., Tanaka, T. N., Kitamoto, N., Ciarlet, M., Jiang, X., Takeda, N., Brown, D.
W. G. & Estes, M. K. (2000). Identification of an epitope common to genogroup 1
"Norwalk-like viruses". Journal of Clinical Microbiology 38, 1656-1660.
3. Cannon, J. L. & Vinje, J. (2008). Histo-Blood Group Antigen Assay for Detecting
Noroviruses in Water. Applied and Environmental Microbiology 74, 6818-6819.
4. Tian, P., Jiang, X., Zhong, W. M., Jensen, H. M., Brandl, M., Bates, A. H.,
Engelbrektson, A. L. & Mandrell, R. (2007). Binding of recombinant norovirus like
particle to histo-blood group antigen on cells in the lumen of pig duodenum. Research in
Veterinary Science 83, 410-418.
5. Green, K. Y. (2008). Noroviruses and Sapoviruses. In Encyclopedia of Virology
(Regenmortel, B. W. J. M. a. M. H. V. v., ed.), Vol. 3, pp. 438-445. Oxford Press.
6. Adler, J. L. & Zickl, R. (1969). WINTER VOMITING DISEASE. Journal of Infectious
Diseases 119, 668-&.
7. Kapikian, A. Z., Wyatt, R. G., Dolin, R., Thornhil.Ts, Kalica, A. R. & Chanock, R. M.
(1972). VISUALIZATION BY IMMUNE ELECTRON-MICROSCOPY OF A 27-NM
PARTICLE ASSOCIATED WITH ACUTE INFECTIOUS NONBACTERIAL
GASTROENTERITIS. Journal of Virology 10, 1075-1081.
8. Kapikian, A. Z. (2000). The discovery of the 27-nm Norwalk virus: An historic
perspective. Journal of Infectious Diseases 181, S295-S302.
9. Thornhill, T. S., Wyatt, R. G., Kalica, A. R., Dolin, R., Chanock, R. M. & Kapikian, A.
Z. (1977). DETECTION BY IMMUNE ELECTRON-MICROSCOPY OF 26-NM TO
27-NM VIRUSLIKE PARTICLES ASSOCIATED WITH 2 FAMILY OUTBREAKS
OF GASTROENTERITIS. Journal of Infectious Diseases 135, 20-27.
10. Dolin, R., Reichman, R. C., Roessner, K. D., Tralka, T. S., Schooley, R. T., Gary, W. &
Morens, D. (1982). DETECTION BY IMMUNE ELECTRON-MICROSCOPY OF THE
SNOW MOUNTAIN AGENT OF ACUTE VIRAL GASTROENTERITIS. Journal of
Infectious Diseases 146, 184-189.
11. Wang, J. X., Jiang, X., Madore, H. P., Gray, J., Desselberger, U., Ando, T., Seto, Y.,
Oishi, I., Lew, J. F., Green, K. Y. & Estes, M. (1994). SEQUENCE DIVERSITY OF
SMALL, ROUND-STRUCTURED VIRUSES IN THE NORWALK VIRUS GROUP.
Journal of Virology 68, 5982-5990.
12. Scipioni, A., Mauroy, A., Vinje, J. & Thiry, E. (2008). Animal noroviruses. Veterinary
Journal 178, 32-45.
13. Mead, P. S., Slutsker, L., Dietz, V., McCaig, L. F., Bresee, J. S., Shapiro, C., Griffin, P.
M. & Tauxe, R. V. (2000). Food-related illness and death in the United States (Reprinted
from Emerging Infectious Diseases). Journal of Environmental Health 62, 9-18.
14. Patel, M. M., Widdowson, M. A., Glass, R. I., Akazawa, K., Vinje, J. & Parashar, U. D.
(2008). Systematic literature review of role of noroviruses in sporadic gastroenteritis.
Emerging Infectious Diseases 14, 1224-1231.
53
15. Scallan, E., Hoekstra, R. M., Angulo, F. J., Tauxe, R. V., Widdowson, M. A., Roy, S. L.,
Jones, J. L. & Griffin, P. M. (2011). Foodborne Illness Acquired in the United States-
Major Pathogens. Emerging Infectious Diseases 17, 7-15.
16. Green, K. Y. (2007). Caliciviridae: The Noroviruses. Fields Virology, Lippincott
Williams and Wilkins, Philadelphia, PA, USA.
17. Fankhauser, R. L., Noel, J. S., Monroe, S. S., Ando, T. & Glass, R. I. (1998). Molecular
epidemiology of "Norwalk-like viruses" in outbreaks of gastroenteritis in the united
states. Journal of Infectious Diseases 178, 1571-1578.
18. McCarthy, M., Estes, M. K. & Hyams, K. C. (2000). Norwalk-like virus infection in
military forces: Epidemic potential, sporadic disease, and the future direction of
prevention and control efforts. Journal of Infectious Diseases 181, S387-S391.
19. Thornton, S. A., Sherman, S. S., Farkas, T., Zhong, W. M., Torres, P. & Jiang, X. (2005).
Gastroenteritis in US Marines during Operation Iraqi Freedom. Clinical Infectious
Diseases 40, 519-525.
20. Hansen, S., Stamm-Balderjahn, S., Zuschneid, I., Behnke, M., Ruden, H., Vonberg, R. P.
& Gastmeier, P. (2007). Closure of medical departments during nosocomial outbreaks:
data from a systematic analysis of the literature. Journal of Hospital Infection 65, 348-
353.
21. Rohayem, J. (2009). Norovirus seasonality and the potential impact of climate change.
Clinical Microbiology and Infection 15, 524-527.
22. Teunis, P. F. M., Moe, C. L., Liu, P., Miller, S. E., Lindesmith, L., Baric, R. S., Le
Pendu, J. & Calderon, R. L. (2008). Norwalk virus: How infectious is it? Journal of
Medical Virology 80, 1468-1476.
23. Centers for Disease Control and Prevention. (2002) Outbreaks of gastroenteritis
associated with noroviruses on cruise ships -- United States. MMWR 51, 1112-1115.
24. Centers for Disease Control and Prevention. (2006) Norovirus outbreak associated with
ill food-service workers -- Michigan, January-February 2006. MMWR 56, 1212-1216.
25. Centers for Disease Control and Prevention. (2008) Norovirus outbreak in an
elementary school -- District of Columbia, February 2007. MMWR 56, 1340-1343.
26. Atmar, R. L., Opekun, A. R., Gilger, M. A., Estes, M. K., Crawford, S. E., Neill, F. H. &
Graham, D. Y. (2008). Norwalk virus shedding after experimental human infection.
Emerging Infectious Diseases 14, 1553-1557.
27. Patterson, T., Hutchings, P. & Plamer, S. (1993). OUTBREAK OF SRSV
GASTROENTERITIS AT AN INTERNATIONAL-CONFERENCE TRACED TO
FOOD HANDLED BY A POSTSYMPTOMATIC CATERER. Epidemiology and
Infection 111, 157-162.
28. Rockx, B., de Wit, M., Vennema, H., Vinje, J., de Bruin, E., van Duynhoven, Y. &
Koopmans, M. (2002). Natural history of human Calicivirus infection: A prospective
cohort study. Clinical Infectious Diseases 35, 246-253.
29. Estes, M. K., Prasad, B. V. V. & Atmar, R. L. (2006). Noroviruses everywhere: has
something changed? Current Opinion in Infectious Diseases 19, 467-474.
30. Kirkwood, C. D. & Streitberg, R. (2008). Calicivirus shedding in children after recovery
from diarrhoeal disease. Journal of Clinical Virology 43, 346-348.
31. Murata, T., Katsushima, N., Mizuta, K., Muraki, Y., Hongo, S. & Matsuzaki, Y. (2007).
Prolonged norovirus shedding in infants <= 6 months of age with gastroenteritis.
Pediatric Infectious Disease Journal 26, 46-49.
54
32. Sakai, Y., Nakata, S., Honma, S., Tatsumi, M., Numata-Kinoshita, K. & Chiba, S. (2001).
Clinical severity of Norwalk virus and Sapporo virus gastroenteritis in children in
Hokkaido, Japan. Pediatric Infectious Disease Journal 20, 849-853.
33. Lopman, B. A., Adak, G. K., Reacher, M. H. & Brown, D. W. G. (2003). Two
epidemiologic patterns of Norovirus outbreaks: Surveillance in England and Wales,
1992-2000. Emerging Infectious Diseases 9, 71-77.
34. Okada, M., Tanaka, T., Oseto, M., Takeda, N. & Shinozaki, K. (2006). Genetic analysis
of noroviruses associated with fatalities in healthcare facilities. Archives of Virology 151,
1635-1641.
35. Gallimore, C. I., Lewis, D., Taylor, C., Cant, A., Gennery, A. & Gray, J. J. (2004).
Chronic excretion of a norovirus in a child with cartilage hair hypoplasia (CHH). Journal
of Clinical Virology 30, 196-204.
36. Gallimore, C. I., Taylor, C., Gennery, A. R., Cant, A. J., Galloway, A., Iturriza-Gomara,
M. & Gray, J. J. (2006). Environmental monitoring for gastroenteric viruses in a pediatric
primary immunodeficiency unit. Journal of Clinical Microbiology 44, 395-399.
37. Kaufman, S. S., Chatterjee, N. K., Fuschino, M. E., Magid, M. S., Gordon, R. E., Morse,
D. L., Herold, B. C., LeLeiko, N. S., Tschernia, A., Florman, S. S., Gondolesi, G. E. &
Fishbein, T. M. (2003). Calicivirus enteritis in an intestinal transplant recipient. American
Journal of Transplantation 3, 764-768.
38. Morotti, R. A., Kaufman, S. S., Fishbein, T. M., Chatterjee, N. K., Fuschino, M. E.,
Morse, D. L. & Magid, M. S. (2004). Calicivirus infection in pediatric small intestine
transplant recipients: Pathological considerations. Human Pathology 35, 1236-1240.
39. Westhoff, T. H., Vergoulidou, M., Loddenkemper, C., Schwartz, S., Hofmann, J.,
Schneider, T., Zidek, W. & van der Giet, M. (2009). Chronic norovirus infection in renal
transplant recipients. Nephrology Dialysis Transplantation 24, 1051-1053.
40. Fankhauser, R. L., Monroe, S. S., Noel, J. S., Humphrey, C. D., Bresee, J. S., Parashar,
U. D., Ando, T. & Glass, R. I. (2002). Epidemiologic and molecular trends of "Norwalk-
like viruses" associated with outbreaks of gastroenteritis in the United States. Journal of
Infectious Diseases 186, 1-7.
41. Glass, R. I., Noel, J., Ando, T., Fankhauser, R., Belliot, G., Mounts, A., Parashar, U. D.,
Bresee, J. S. & Monroe, S. S. (2000). The epidemiology of enteric caliciviruses from
humans: A reassessment using new diagnostics. Journal of Infectious Diseases 181,
S254-S261.
42. Chan, M. C. W., Sung, J. J. Y., Lam, R. K. Y., Chan, P. K. S., Lee, N. L. S., Lai, R. W.
M. & Leung, W. K. (2006). Fecal viral load and norovirus-associated gastroenteritis.
Emerging Infectious Diseases 12, 1278-1280.
43. Parrino, T. A., Schreiber, D. S., Trier, J. S., Kapikian, A. Z. & Blacklow, N. R. (1977).
CLINICAL IMMUNITY IN ACUTE GASTROENTERITIS CAUSED BY NORWALK
AGENT. New England Journal of Medicine 297, 86-89.
44. Wyatt, R. G., Dolin, R., Blacklow, N. R., Dupont, H. L., Buscho, R. F., Thornhil.Ts,
Kapikian, A. Z. & Chanock, R. M. (1974). COMPARISON OF 3 AGENTS OF ACUTE
INFECTIOUS NONBACTERIAL GASTROENTERITIS BY CROSS-CHALLENGE IN
VOLUNTEERS. Journal of Infectious Diseases 129, 709-714.
45. Duizer, E., Kroneman, A., Siebenga, J., Verhoef, L., Vennema, H., Koopmans, M.
(2008). Typing Database for Noroviruses. Eurosurveillance 13.
55
46. Vega, E., Barclay, L., Gregoricus, N., Williams, K., Lee, D. & Vinje, J. (2011). Novel
Surveillance Network for Norovirus Gastroenteritis Outbreaks, United States. Emerging
Infectious Diseases 17, 1389-1395.
47. Zheng, D. P., Ando, T., Fankhauser, R. L., Beard, R. S., Glass, R. I. & Monroe, S. S.
(2006). Norovirus classification and proposed strain nomenclature. Virology 346, 312-
323.
48. Sugieda, M. & Nakajima, S. (2002). Viruses detected in the caecum contents of healthy
pigs representing a new genetic cluster in genogroup II of the genus 'Norwalk-like
viruses'. Virus Research 87, 165-172.
49. Ando, T., Noel, J. S. & Fankhauser, R. L. (2000). Genetic classification of "Norwalk-like
viruses". Journal of Infectious Diseases 181, S336-S348.
50. Wobus, C. E., Thackray, L. B. & Virgin, H. W. (2006). Murine norovirus: a model
system to study norovirus biology and pathogenesis. Journal of Virology 80, 5104-5112.
51. Martella, V., Campolo, M., Lorusso, E., Cavicchio, P., Camero, M., Bellacicco, A. L.,
Decaro, N., Elia, G., Greco, G., Corrente, M., Desario, C., Arista, S., Banyai, K.,
Koopmans, M. & Buonavoglia, C. (2007). Norovirus in captive lion cub (Panthera leo).
Emerging Infectious Diseases 13, 1071-1073.
52. Martella, V., Lorusso, E., Decaro, N., Elia, G., Radogna, A., D'Abramo, M., Desario, C.,
Cavalli, A., Corrente, M., Camero, M., Germinario, C. A., Banyai, K., Di Martino, B.,
Marsilio, F., Carmichael, L. E. & Buonavoglia, C. (2008). Detection and molecular
characterization of a canine norovirus. Emerging Infectious Diseases 14, 1306-1308.
53. Morillo, S. G. & Sampaio Tavares Timenetsky, M. d. C. (2011). Norovirus: an overview.
Revista Da Associacao Medica Brasileira 57, 462-467.
54. Green, K. Y., Ando, T., Balayan, M. S., Berke, T., Clarke, I. N., Estes, M. K., Matson, D.
O., Nakata, S., Neill, J. D., Studdert, M. J. & Thiel, H. J. (2000). Taxonomy of the
caliciviruses. Journal of Infectious Diseases 181, S322-S330.
55. Vinje, J. & Koopmans, M. P. G. (2000). Simultaneous detection and genotyping of
"norwalk-like viruses" by oligonucleotide array in a reverse line blot hybridization
format. Journal of Clinical Microbiology 38, 2595-2601.
56. Gallimore, C. I., Green, J., Lewis, D., Richards, A. F., Lopman, B. A., Hale, A. D., Eglin,
R., Gray, J. J. & Brown, D. W. G. (2004). Diversity of noroviruses cocirculating in the
North of England from 1998 to 2001. Journal of Clinical Microbiology 42, 1396-1401.
57. Tu, E. T. V., Nguyen, T., Lee, P., Bull, R. A., Musto, J., Hansman, G., White, P. A.,
Rawlinson, W. D. & McIver, C. J. (2007). Norovirus GII.4 strains and outbreaks,
Australia. Emerging Infectious Diseases 13, 1128-1130.
58. Friesema, I. H. M., Vennema, H., Heijne, J. C. M., de Jager, C. M., Teunis, P. F. M., van
der Linde, R., Duizer, E. & van Duynhoven, Y. (2009). Differences in clinical
presentation between norovirus genotypes in nursing homes. Journal of Clinical Virology
46, 341-344.
59. Hardy, M. E. (2005). Norovirus protein structure and function. Fems Microbiology
Letters 253, 1-8.
60. Ettayebi, K. & Hardy, M. E. (2003). Norwalk virus nonstructural protein p48 forms a
complex with the SNARE regulator VAP-A and prevents cell surface expression of
vesicular stomatitis virus G protein. Journal of Virology 77, 11790-11797.
56
61. Sharp, T. M., Guix, S., Katayama, K., Crawford, S. E. & Estes, M. K. (2010). Inhibition
of Cellular Protein Secretion by Norwalk Virus Nonstructural Protein p22 Requires a
Mimic of an Endoplasmic Reticulum Export Signal. Plos One 5.
62. Prasad, B. V. V., Hardy, M. E., Dokland, T., Bella, J., Rossmann, M. G. & Estes, M. K.
(1999). X-ray crystallographic structure of the Norwalk virus capsid. Science 286, 287-
290.
63. Strong, D. W., Thackray, L. B., Smith, T. J. & Virgin, H. W. (2012). Protruding Domain
of Capsid Protein Is Necessary and Sufficient To Determine Murine Norovirus
Replication and Pathogenesis In Vivo. Journal of Virology 86, 2950-2958.
64. Bok, K., Abente, E. J., Realpe-Quintero, M., Mitra, T., Sosnovtsev, S. V., Kapikian, A. Z.
& Green, K. Y. (2009). Evolutionary Dynamics of GII.4 Noroviruses over a 34-Year
Period. Journal of Virology 83, 11890-11901.
65. Karst, S. M. (2010). Pathogenesis of Noroviruses, Emerging RNA Viruses. Viruses-Basel
2, 748-781.
66. Bull, R. A. & White, P. A. (2011). Mechanisms of GII.4 norovirus evolution. Trends in
Microbiology 19, 233-240.
67. Donaldson, E. F., Lindesmith, L. C., Lobue, A. D. & Baric, R. S. (2010). Viral shape-
shifting: norovirus evasion of the human immune system. Nature Reviews Microbiology
8, 231-241.
68. Altmann, F., Staudacher, E., Wilson, I. B. H. & Marz, L. (1999). Insect cells as hosts for
the expression of recombinant glycoproteins. Glycoconjugate Journal 16, 109-123.
69. Kost, T. A. & Condreay, J. P. (1999). Recombinant baculoviruses as expression vectors
for insect and mammalian cells. Current Opinion in Biotechnology 10, 428-433.
70. Bertolotti-Ciarlet, A., White, L. J., Chen, R., Prasad, B. V. V. & Estes, M. K. (2002).
Structural requirements for the assembly of Norwalk virus-like particles. Journal of
Virology 76, 4044-4055.
71. Bertolotti-Ciarlet, A., Crawford, S. E., Hutson, A. M. & Estes, M. K. (2003). The 3 ' end
of Norwalk virus mRNA contains determinants that regulate the expression and stability
of the viral capsid protein VP1: a novel function for the VP2 protein. Journal of Virology
77, 11603-11615.
72. Sosnovtsev, S. V., Belliot, G., Chang, K. O., Onwudiwe, O. & Green, K. Y. (2005).
Feline calicivirus VP2 is essential for the production of infectious virions. Journal of
Virology 79, 4012-4024.
73. Marionneau, S., Cailleau-Thomas, A., Rocher, J., Le Moullac-Vaidye, B., Ruvoen, N.,
Clement, M. & Le Pendu, J. (2001). ABH and Lewis histo-blood group antigens, a model
for the meaning of oligosaccharide diversity in the face of a changing world. Biochimie
83, 565-573.
74. Ravn, V. & Dabelsteen, E. (2000). Tissue distribution of histo-blood group antigens.
Apmis 108, 1-28.
75. Watkins, W. M. (1999). A half century of blood-group antigen research some personal
recollections. Trends in Glycoscience and Glycotechnology 11, 391-411.
76. Kelly, R. J., Rouquier, S., Giorgi, D., Lennon, G. G. & Lowe, J. B. (1995). SEQUENCE
AND EXPRESSION OF A CANDIDATE FOR THE HUMAN SECRETOR BLOOD-
GROUP ALPHA(1,2)FUCOSYLTRANSFERASE GENE (FUT2) - HOMOZYGOSITY
FOR AN ENZYME-INACTIVATING NONSENSE MUTATION COMMONLY
57
CORRELATES WITH THE NON-SECRETOR PHENOTYPE. Journal of Biological
Chemistry 270, 4640-4649.
77. Lindesmith, L., Moe, C., Marionneau, S., Ruvoen, N., Jiang, X., Lindbland, L., Stewart,
P., LePendu, J. & Baric, R. (2003). Human susceptibility and resistance to Norwalk virus
infection. Nature Medicine 9, 548-553.
78. Hutson, A. M., Atmar, R. L. & Estes, M. K. (2004). Norovirus disease: changing
epidemiology and host susceptibility factors. Trends in Microbiology 12, 279-287.
79. Hutson, A. M., Atmar, R. L., Marcus, D. M. & Estes, M. K. (2003). Norwalk virus-like
particle hemagglutination by binding to H histo-blood group antigens. Journal of
Virology 77, 405-415.
80. Rockx, B. H. G., Vennema, H., Hoebe, C., Duizer, E. & Koopmans, M. P. G. (2005).
Association of histo-blood group antigens and susceptibility to norovirus infections.
Journal of Infectious Diseases 191, 749-754.
81. Harrington, P. R., Lindesmith, L., Yount, B., Moe, C. L. & Baric, R. S. (2002). Binding
of Norwalk virus-like particles to ABH histo-blood group antigens is blocked by antisera
from infected human volunteers or experimentally vaccinated mice. Journal of Virology
76, 12335-12343.
82. Huang, P. W., Farkas, T., Zhong, W. M., Thornton, S., Morrow, A. L. & Xi, J. (2005).
Norovirus and histo-blood group antigens: Demonstration of a wide spectrum of strain
specificities and classification of two major binding groups among multiple binding
patterns. Journal of Virology 79, 6714-6722.
83. Tan, M., Xia, M., Chen, Y. T., Bu, W. M., Hegde, R. S., Meller, J., Li, X. M. & Jiang, X.
(2009). Conservation of Carbohydrate Binding Interfaces - Evidence of Human HBGA
Selection in Norovirus Evolution. Plos One 4.
84. Huang, P. W., Farkas, T., Marionneau, S., Zhong, W. M., Ruvoen-Clouet, N., Morrow,
A. L., Altaye, M., Pickering, L. K., Newburg, D. S., LePendu, J. & Jiang, X. (2003).
Noroviruses bind to human ABO, Lewis, and secretor histo-blood group antigens:
Identification of 4 distinct strain-specific patterns. Journal of Infectious Diseases 188, 19-
31.
85. Shirato, H., Ogawa, S., Ito, H., Sato, T., Kameyama, A., Narimatsu, H., Zheng, X. F.,
Miyamura, T., Wakita, T., Ishii, K. & Takeda, N. (2008). Noroviruses Distinguish
between Type 1 and Type 2 Histo-Blood Group Antigens for Binding. Journal of
Virology 82, 10756-10767.
86. Le Pendu, J., Ruvoen-Clouet, N., Kindberg, E. & Svensson, L. (2006). Mendelian
resistance to human norovirus infections. Seminars in Immunology 18, 375-386.
87. Johnson, P. C., Mathewson, J. J., Dupont, H. L. & Greenberg, H. B. (1990). MULTIPLE-
CHALLENGE STUDY OF HOST SUSCEPTIBILITY TO NORWALK
GASTROENTERITIS IN UNITED-STATES ADULTS. Journal of Infectious Diseases
161, 18-21.
88. Baron, R. C., Greenberg, H. B., Cukor, G. & Blacklow, N. R. (1984). SEROLOGICAL
RESPONSES AMONG TEENAGERS AFTER NATURAL EXPOSURE TO
NORWALK VIRUS. Journal of Infectious Diseases 150, 531-534.
89. Blacklow, N. R., Cukor, G., Bedigian, M. K., Echeverria, P., Greenberg, H. B., Schreiber,
D. S. & Trier, J. S. (1979). IMMUNE-RESPONSE AND PREVALENCE OF
ANTIBODY TO NORWALK ENTERITIS VIRUS AS DETERMINED BY
RADIOIMMUNOASSAY. Journal of Clinical Microbiology 10, 903-909.
58
90. Cukor, G., Nowak, N. A. & Blacklow, N. R. (1982). IMMUNOGLOBULIN-M
RESPONSES TO THE NORWALK VIRUS OF GASTROENTERITIS. Infection and
Immunity 37, 463-468.
91. Cannon, J. L., Lindesmith, L. C., Donaldson, E. F., Saxe, L., Baric, R. S. & Vinje, J.
(2009). Herd Immunity to GII.4 Noroviruses Is Supported by Outbreak Patient Sera.
Journal of Virology 83, 5363-5374.
92. Lindesmith, L., Moe, C., LePendu, J., Frelinger, J. A., Treanor, J. & Baric, R. S. (2005).
Cellular and humoral immunity following Snow Mountain virus challenge. Journal of
Virology 79, 2900-2909.
93. Siebenga, J. J., Vennema, H., Zheng, D. P., Vinje, J., Lee, B. E., Pang, X. L., Ho, E. C.
M., Lim, W., Choudekar, A., Broor, S., Halperin, T., Rasool, N. B. G., Hewitt, J.,
Greening, G. E., Jin, M., Duan, Z. J., Lucero, Y., O'Ryan, M., Hoehne, M., Schreier, E.,
Ratcliff, R. M., White, P. A., Iritani, N., Reuter, G. & Koopmans, M. (2009). Norovirus
Illness Is a Global Problem: Emergence and Spread of Norovirus GII.4 Variants, 2001-
2007. Journal of Infectious Diseases 200, 802-812.
94. Donaldson, E. F., Lindesmith, L. C., Lobue, A. D. & Baric, R. S. (2008). Norovirus
pathogenesis: mechanisms of persistence and immune evasion in human populations.
Immunological Reviews 225, 190-211.
95. Lindesmith, L. C., Donaldson, E. F., Lobue, A. D., Cannon, J. L., Zheng, D. P., Vinje, J.
& Baric, R. S. (2008). Mechanisms of GII.4 norovirus persistence in human populations.
Plos Medicine 5, 269-290.
96. Tian, P., Engelbrektson, A. & Mandrell, R. (2008). Two-log increase in sensitivity for
detection of norovirus in complex samples by concentration with porcine gastric mucin
conjugated to magnetic beads. Applied and Environmental Microbiology 74, 4271-4276.
97. Tian, P., Yang, D., Jiang, X., Zhong, W., Cannon, J. L., Burkhardt, W., 3rd, Woods, J.
W., Hartman, G., Lindesmith, L., Baric, R. S. & Mandrell, R. (2010). Specificity and
kinetics of norovirus binding to magnetic bead-conjugated histo-blood group antigens. J
Appl Microbiol 109, 1753-62.
98. Tian, P., Yang, D. & Mandrell, R. (2011). A simple method to recover Norovirus from
fresh produce with large sample size by using histo-blood group antigen-conjugated to
magnetic beads in a recirculating affinity magnetic separation system (RCAMS).
International Journal of Food Microbiology 147, 223-227.
99. Stals, A., Baert, L., Van Coillie, E. & Uyttendaele, M. (2012). Extraction of food-borne
viruses from food samples: A review. International Journal of Food Microbiology 153,
1-9.
100. Sim, S. L., He, T., Tscheliessnig, A., Mueller, M., Tan, R. B. H. & Jungbauer, A. (2012).
Protein precipitation by polyethylene glycol: A generalized model based on
hydrodynamic radius. Journal of Biotechnology 157, 315-319.
101. Boom, R., Sol, C. J. A., Salimans, M. M. M., Jansen, C. L., Wertheimvandillen, P. M. E.
& Vandernoordaa, J. (1990). RAPID AND SIMPLE METHOD FOR PURIFICATION
OF NUCLEIC-ACIDS. Journal of Clinical Microbiology 28, 495-503.
102. Atmar, R. L., Neill, F. H. & Le Guyader, F. S. (2011). Detection of Human Caliciviruses
in Fecal Samples by RT-PCR. In Diagnostic Virology Protocols, Second Edition
(Stephenson, J. R. & Warnes, A., eds.), Vol. 665, pp. 39-50.
59
103. Arya, M., Shergill, I. S., Williamson, M., Gommersall, L., Arya, N. & Patel, H. R. H.
(2005). Basic principles of real-time quantitative PCR. Expert Review of Molecular
Diagnostics 5, 209-219.
104. Rolfe, K. J., Parmar, S., Mururi, D., Wreghitt, T. G., Jalal, H., Zhang, H. & Curran, M. D.
(2007). An internally controlled, one-step, real-time RT-PCR assay for norovirus
detection and genogrouping. Journal of Clinical Virology 39, 318-321.
105. Turcios, R. M., Widdowson, M. A., Sulka, A. C., Mead, P. S. & Glass, R. I. (2006).
Reevaluation of epidemiological criteria for identifying outbreaks of acute gastroenteritis
due to norovirus: United States, 1998-2000. Clinical Infectious Diseases 42, 964-969.
106. Lopman, B. A., Reacher, M. H., Vipond, I. B., Sarangi, J. & Brown, D. W. G. (2004).
Clinical manifestation of norovirus gastroenteritis in health care settings. Clinical
Infectious Diseases 39, 318-324.
107. Biel, S. S. & Gelderblom, H. R. (1999). Diagnostic electron microscopy is still a timely
and rewarding method. Journal of Clinical Virology 13, 105-119.
108. Kirby, A., Gurgel, R. Q., Dove, W., Vieira, S. C. F., Cunliffe, N. A. & Cuevas, L. E.
(2010). An evaluation of the RIDASCREEN and IDEIA enzyme immunoassays and the
RIDAQUICK immunochromatographic test for the detection of norovirus in faecal
specimens. Journal of Clinical Virology 49, 254-257.
109. Rabenau, H. F., Sturmer, M., Buxbaum, S., Walczok, A., Preiser, W. & Doerr, H. W.
(2003). Laboratory diagnosis of norovirus: Which method is the best? Intervirology 46,
232-238.
110. Burton-MacLeod, J. A., Kane, E. M., Beard, R. S., Hadley, L. A., Glass, R. I. & Ando, T.
(2004). Evaluation and comparison of two commercial enzyme-linked immunosorbent
assay kits for detection of antigenically diverse human noroviruses in stool samples.
Journal of Clinical Microbiology 42, 2587-2595.
111. de Bruin, E., Duizer, E., Vennema, H. & Koopmans, M. P. G. (2006). Diagnosis of
Norovirus outbreaks by commercial ELISA or RT-PCR. Journal of Virological Methods
137, 259-264.
112. Kojima, S., Kageyama, T., Fukushi, S., Hoshino, F. B., Shinohara, M., Uchida, K.,
Natori, K., Takeda, N. & Katayama, K. (2002). Genogroup-specific PCR primers for
detection of Norwalk-like viruses. Journal of Virological Methods 100, 107-114.
113. Kageyama, T., Kojima, S., Shinohara, M., Uchida, K., Fukushi, S., Hoshino, F. B.,
Takeda, N. & Katayama, K. (2003). Broadly reactive and highly sensitive assay for
Norwalk-like viruses based on real-time quantitative reverse transcription-PCR. Journal
of Clinical Microbiology 41, 1548-1557.
114. Kim, H. Y., Kwak, I. S., Hwang, I. G. & Ko, G. (2008). Optimization of methods for
detecting norovirus on various fruit. Journal of Virological Methods 153, 104-110.
115. Goodridge, L., Goodridge, C., Wu, J. Q., Griffiths, M. & Pawliszyn, J. (2004). Isoelectric
point determination of norovirus virus-like particles by capillary Isoelectric focusing with
whole column imaging detection. Analytical Chemistry 76, 48-52.
116. Bansil, R., Stanley, H. E. & Lamont, J. T. (1995). MUCIN BIOPHYSICS. Annual
Review of Physiology 57, 635-657.
117. Bansil, R. & Turner, B. S. (2006). Mucin structure, aggregation, physiological functions
and biomedical applications. Current Opinion in Colloid & Interface Science 11, 164-
170.
60
118. Hansman, G. S., Shahzad-ul-Hussan, S., McLellan, J. S., Chuang, G. Y., Georgiev, I.,
Shimoike, T., Katayama, K., Bewley, C. A. & Kwong, P. D. (2012). Structural Basis for
Norovirus Inhibition and Fucose Mimicry by Citrate. Journal of Virology 86, 284-292.
119. Hardy, M. E., Tanaka, T. N., Kitamoto, N., White, L. J., Ball, J. M., Jiang, X. & Estes,
M. K. (1996). Antigenic mapping of the recombinant Norwalk virus capsid protein using
monoclonal antibodies. Virology 217, 252-261.
120. Waigh, T. A., Papagiannopoulos, A., Voice, A., Bansil, R., Unwin, A. P., Dewhurst, C.
D., Turner, B. & Afdhal, N. (2002). Entanglement coupling in porcine stomach mucin.
Langmuir 18, 7188-7195.
121. Celli, J., Gregor, B., Turner, B., Afdhal, N. H., Bansil, R. & Erramilli, S. (2005).
Viscoelastic properties and dynamics of porcine gastric mucin. Biomacromolecules 6,
1329-1333.
122. Bessetti, J. An Introduction to PCR Inhibitors (ProMega Corporation).