Embed Size (px)
Citation preview

Measures of Effective Teaching (MET)project
November 2011

z
2
What does it take to build better feedback & evaluation systems? (and why start there, anyway?)

3

4

5
6

7

Trustworthiness Tests
8
1. Face Validity – Do teachers recognize the observation instrument and other
measures as reflecting qualities of practice they value?
2. Coherence – Do the measures match your district’s theory of instruction?
3. Predictive Validity – Do scores on your measures correlate with outcomes that you
value, such as gains in student learning?
4. Scoring Reliability – If a different rater had been assigned to the observation or the
assessment, would the score be the same?

9

Multiple Measures of Teaching Effectiveness
10

Knowledge for Teaching
11

12
The MET Project research
How well can …
• Student Perception Surveys
• Structured Classroom Observations
• Pedagogical Content Knowledge Test
• Student Outcomes
… produce valid & reliable measures of teaching?
+
+
+

Preliminary Finding #1
13

Student Perceptions
14
Care
Control
Clarify
Challenge
Captivate
Confer
TestPrep
Consolidate
Care
• My teacher makes me feel that s/he really cares about me
• My teacher seems to know if something is bothering me
• My teacher really tries to understand how students feel about things
Control
• Students in this class treat the teacher with respect
• My classmates behave the way the teacher wants them to
• Our class stays busy and doesn’t waste time
Clarify
• If you don’t understand something , my teacher explains it a different way.
• My teacher knows when the class understands, and when we do not.
• My teacher has several good ways to explain each topic that we cover in the class.
Challenge
• My teacher asks students to explain more about the answers they give.
• My teacher doesn’t let people give up when the work gets hard.
• In this class, we learn to correct our mistakes.
Captivate
• My teacher makes learning enjoyable • My teacher makes learning interesting • I like the way we learn in this class
Confer
• My teacher wants us to share our thoughts • Students get to decide how activities are done in
this class
Consolidate
• My teacher takes the time to summarize what we learn each day
• The comments that I get on my work in this class help me understand how to improve
TestPrep
• I have learned a lot this year about [the state test] • Getting ready for [the state ] test takes a lot of
time in our class

Student Perceptions
Top 5 Correlations
15
Survey Statement Category Rank
1
2
3
4
5
• Students in this class treat the teacher with respect
• My classmates behave the way my teacher wants them to
Control
Control
Control • Our class stays busy and doesn’t waste time
Challenge • In this class, we learn a lot every day
Challenge • In this class, we learn to correct our mistakes
33 • I have learned a lot this year about [the state test] Test Prep
34 • Getting ready for [the state test] takes a lot of time in our class Test Prep

Preliminary Finding #2
16

Teacher Impact: Real or Random?
17
•For each teacher, calculate VAM using ONE class of students from ‘09-’10 school year
• Identify top and bottom quartile on VAM Heads or Tails
•For elementary teachers, RECALCULATE VAM using LAST year’s students (‘08-’09 school year)
•For secondary teachers, RECALCULATE VAM using DIFFERENT students from another class (same course, same year)
Flip Again
•Compare RECALCULATED VAM scores to see if differences in student performance persist. Compare

18
Students with Most Effective Teachers
Learn More in School
19

MET Logical Sequence
20
Measures predict
Measures combine
Measures fairly reflect teacher
Effective Teaching Index
Teaching Effectiveness Dashboard
Research Use
Measures reliable
Measures improve
effectiveness
?
Measures stable under pressure

21

Observation System Design
22
Establish ACCURATE
DATA LINKAGES
Define EXPECTATIONS
FOR TEACHERS
Ensure OBSERVER ACCURACY
Ensure RELIABLITY OF
RESULTS
Determine ALIGNMENT
WITH OUTCOMES & other measures
Quality Information
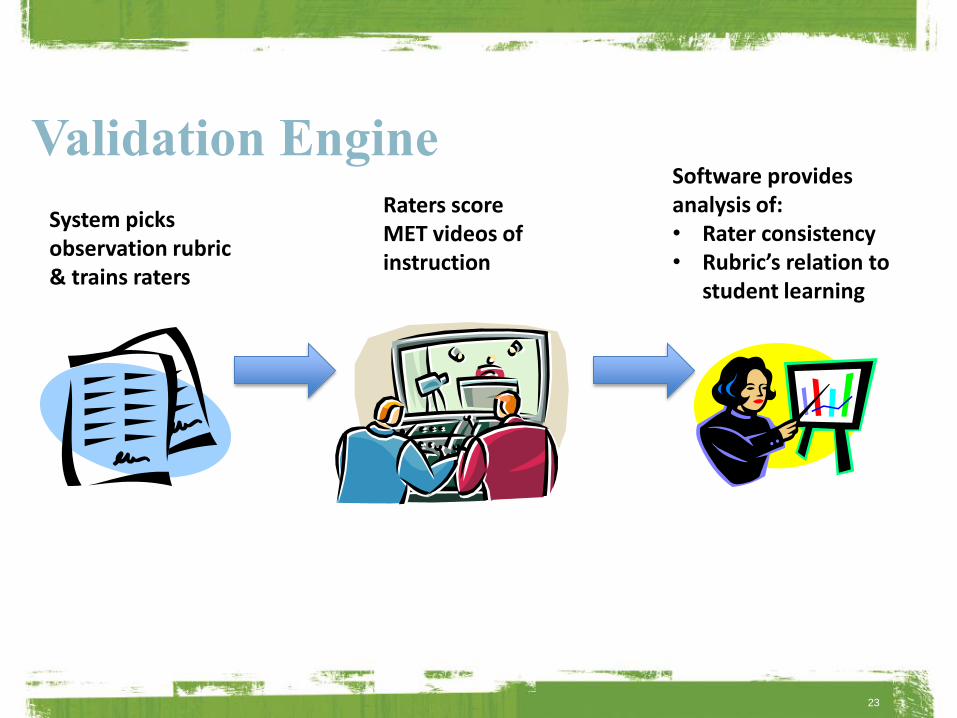
Validation Engine
23
System picks observation rubric & trains raters
Raters score MET videos of instruction
Software provides analysis of: • Rater consistency • Rubric’s relation to
student learning

Rater Training & Consistency: building trust
• Calibrate • Refine
• Test • Train
Video examples for anchor points
Rater certification: Don’t pass, don’t rate
Periodic tuning: Out of
tune, don’t rate
Adjustments to observation
framework based on data
Ensuring Reliable Observations
24

25

Video validation
26
Instrument Developer
• Classroom Assessment Scoring System, CLASS University of Virginia
• Framework for Teaching Charlotte Danielson
• Mathematical Quality of Instruction (MQI) University of Michigan
• Protocol for Language Arts Teaching Observation (PLAT0) Pam Grossman
Natl Math & Sci Initiative
• Quality Science Teaching (QST) Stanford University
• National Board for Professional Teaching Standards NBPTS
• UTeach Observation Protocol (UTOP)

27

The Measures of
Effective Teaching Project
Two school years: 2009–10 and 2010–11
>100,000 students
Grades 4–8: ELA and Math
High School: ELA I, Algebra I and Biology
Participating Teachers
28

The MET Project
The Bill & Melinda Gates Foundation launched the Measures of Effective Teaching (MET)
project in fall 2009 to test new approaches to measuring effective teaching. The project’s goal is
to help build fair and reliable systems for teacher observation and feedback to help teachers
improve and administrators make better personnel decisions. With funding from the foundation,
the data collection and analysis are being led by researchers from academic institutions,
nonprofit organizations, and several private firms and are being carried out in seven urban
school districts.
Our primary collaborator include: • Mark Atkinson, Teachscape
• Nancy Caldwell, Westat
• Ron Ferguson, Harvard University
• Drew Gitomer, Educational Testing Service
• Eric Hirsch, New Teacher Center
• Dan McCaffrey, RAND
• Roy Pea, Stanford University
• Geoffrey Phelps, Educational Testing Service
• Rob Ramsdell, Cambridge Education
• Doug Staiger, Dartmouth College
Other key contributors include: • Joan Auchter, National Board for Professional
Teaching Standards
• Charlotte Danielson, The Danielson Group
• Pam Grossman, Stanford University
• Bridget Hamre, University of Virginia
• Heather Hill, Harvard University
• Sabrina Laine, American Institutes for Research
• Catherine McClellan, Educational Testing Service
• Denis Newman, Empirical Education
• Raymond Pecheone, Stanford University
• Robert Pianta, University of Virginia
• Morgan Polikoff, University of Southern California
• Steve Raudenbush, University of Chicago
• John Winn, National Math and Science Initiative
Research Partners
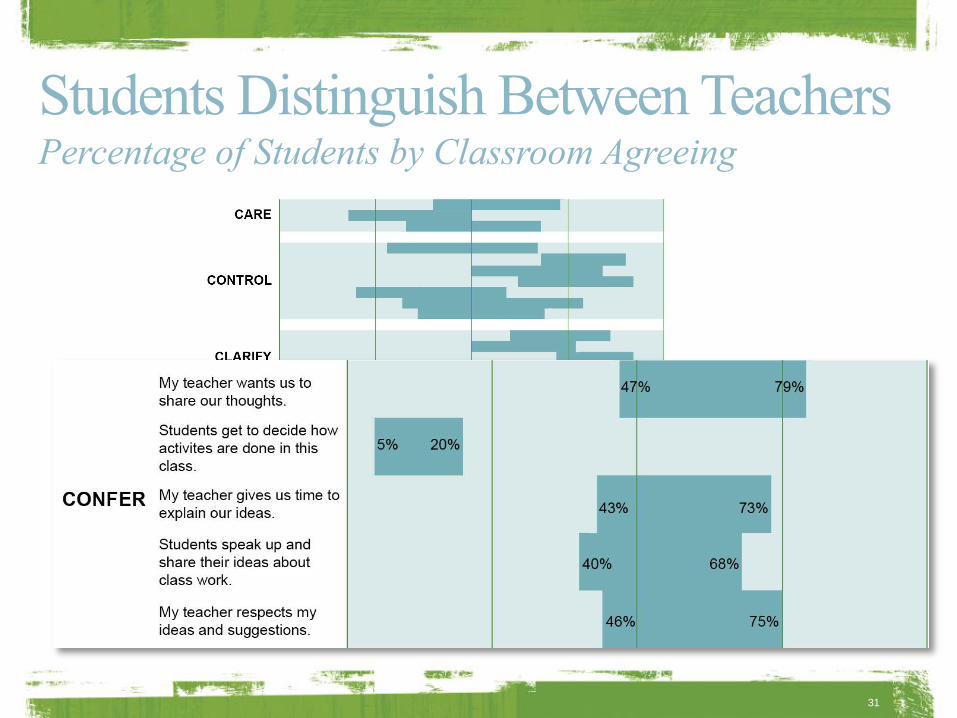
31
Students Distinguish Between Teachers Percentage of Students by Classroom Agreeing

Still more… 1. Many short observations vs. fewer longer. 2. Weighting: How much weight to attach to each component? (Spring 2012) 3. 2nd Year Randomization: Did combined measures control for the relevant student characteristics? (Spring 2012)
32


Diff. Between Top and Bottom Quartile
01
23
4
De
nsity
-.4 -.3 -.2 -.1 0 .1 .2 .3 .4Teacher Value Added
Top and bottom quartile based on student perceptions
Top and bottom quartile based on student perceptions and value added
34
![What is pedagogical linguistics? - dickhudson.com€¦ · Web view[For Pedagogical Linguistics, vol 1] Towards a pedagogical linguistics. Richard Hudson. Abstract. Pedagogical linguistics](https://img.pdfslide.net/doc/110x75/5e21169c6214331e050a7d69/what-is-pedagogical-linguistics-web-viewfor-pedagogical-linguistics-vol-1.jpg)