Embed Size (px)
Citation preview
NRC Region II Visit
October 24, 2008

Progress Energy Overview
Nuclear Leadership Team
Fleet Organizational Changes
Nuclear PerformanceRecent accomplishmentsCurrent challenges
NRC Management Insights
Agenda
2

Progress Energy
~ 3.1 million customersProgress Energy Carolinas
~ 1.4 million customers12,400 megawatts of generation2007 Energy Mix – 44% nuclear
Progress Energy Florida~ 1.7 million customers9,400 megawatts of generation2007 Energy Mix – 18% nuclear
3
Progress Energy service territory in green

Hydro1%
Coal35%
Gas/Oil44%
Nuclear20%
Progress Energy Year-End 2007
4
Coal47%
Gas/Oil18%
Nuclear35%
Capability Mix (MWs) Generation Mix (MWHs)
Hydro
<1%

Progress Energy’s Balanced Solution
5
New Nuclear Plants33,000
4,000
5,000
6,000
7,000
8,000
9,000
10,000
2008
2011
2016
2017
2019
2020
Planned nuclear generation capacity - MWs
6
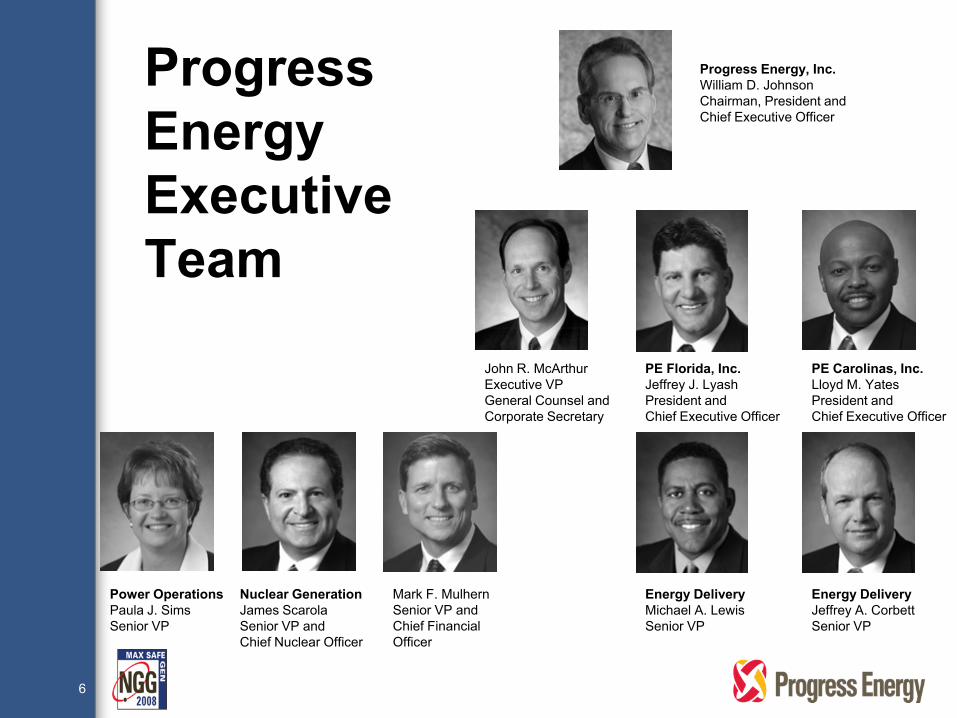
Progress Energy Executive Team
Progress Energy, Inc.William D. JohnsonChairman, President andChief Executive Officer
Mark F. MulhernSenior VP andChief Financial Officer
John R. McArthurExecutive VPGeneral Counsel and Corporate Secretary
PE Carolinas, Inc.Lloyd M. YatesPresident andChief Executive Officer
PE Florida, Inc.Jeffrey J. LyashPresident andChief Executive Officer
Nuclear GenerationJames ScarolaSenior VP andChief Nuclear Officer
Power OperationsPaula J. SimsSenior VP
Energy DeliveryMichael A. LewisSenior VP
Energy DeliveryJeffrey A. CorbettSenior VP

Nuclear Generation Team
7
Ben WaldrepVP-BNP
Chris BurtonVP-HNP
Danny RoderickVP-New Plants
Joe DonahueVP-Engineering
Dale YoungVP-CR3
Tom WaltVP-RNP
TBDVP-Oversight
Jim ScarolaSenior VP and CNO
Bob DuncanVP-Nuclear Operations

Operational Excellence and SafetyNew emergency sirens for all stations with battery backupNRC B.5.b implementation and inspections at all four sitesSuccessful force-on-force drills at RNP and CR3 (2nd round)Fire protection modificationsContainment sump projectsSAMG diesels at BNPCharging Safety Injection Pump transfer switch at HNPINPO Excellence at HNP and RNP
Strategic ActionsSubmitted Harris and Levy COLAsLicense renewalOrganizational changes
8
Accomplishments
New Position - VP of Nuclear OperationsAccelerate fleet alignmentAccelerate organizational learningImprove fleet performanceGain efficiencies and synergies
New Position – VP of Nuclear OversightProvide greater independenceImprove transparency of organizationGreater consistency in processes
Two additional board members with nuclear experience
Changes in external oversight committees
New positions in Chief Engineering Section
Workforce strategy
9
Organizational Changes and Personnel

Fleet Workforce Strategy5 year staffing plans proactively address attritionSupport for local universities, community colleges, and technical schoolsTraining programs, including multiple license classesKnowledge transfer and retention programsLeadership development and succession Rotation of senior and middle managers within fleetDiversity outreachDedicated recruiting staff
10
Staffing/Personnel Development

Vacancy Reductions:BNP reduced from 81 to 30 CR3 reduced from 20 to 15HNP reduced from 30 to 11RNP reduced from 40 to 14
11
Staffing
8 413 7
138
8 17
0
10
20
BNP CR3 HNP RNP
Initial License Classes
RO SRO
30 15 17 315
3 79
0204060
BNP CR3 HNP RNP
Staff Increases
Ops Training

12
Nuclear GenerationOrganization
Chief Nuclear Officer
VP – RNP VP – HNP VP – CR3 VP – BNP VP – NPC VP – NuclearOversight
VP – Nuclear Operations
Fleet Operations
Work Management
Training
Protective Services
Workforce Strategy
Continuous Business
Excellence
Fleet Support Services
Business Operations
HR
VP – Nuclear Engineering
Engineering
Fuels
Project Management
M&CS
NIT

Individual unit performance
Fleet performance
Fleet functional area opportunities
Missing top quartile benchmarks
13
What’s The Concern?
A transformation is needed in order to develop and sustain a top quartile
performing fleet again

Fleet standardization model. Through standardization comes efficiency and consistency. Standardize at industry best practices.
Immediate Focus AreasCommon Conduct of Operations for each functional areaFleet Alignment ManualChange Management Plan
14
Fleet Nuclear Operations Model
Governance Oversight Support Perform

New Model
“Action Team” Mission: Industry best practices at all site locations Governance, Oversight, Support, Perform
15
BNP CR3 HNP RNP
Fleet Functional Area Manager
Action Team Chair is Fleet Functional Area Manager
15

Standardization
Centralization
2009 – 2011 Planning Linkage
Lean Projects/Tools
16
NGG Fleet Improvements

External Oversight Structure
17
NSRC NSOC
Chair -VP Auditing
External Consultants(One From Each
Site)President PEC President PEF
CEO/BOARDCNO
CNOSite Vice President
Chair -VP Oversight
External Consultant
Ex-Regulator
External ConsultantEx-Utility/Licensee
NGG Peer Site VP

External Oversight Structure
18
BNPEx-Regulator
Southern CompanyHNP VP
CR3Ex-Regulator
OconeeBNP VP
HNPEx-Regulator
INPORNP VP
RNPEx-Regulator
DukeCR3 VP
2 Ex-RegulatorsINPODuke
Lloyd Yates – President PECJeff Lyash – President PEF
Nuclear Safety Review Committees
Nuclear Safety Oversight Committee

Provide Greater IndependenceNuclear Oversight VP reports directly to CNOOversight managers no longer report to Site VPMore direct line of communication from “Control Room to Board Room”
Improve Transparency of Organization
Greater Consistency In ProcessesCoordination of assessments
19
NGG Internal Oversight Changes - Objectives

NGG Oversight Structure - New
20
Vice President Nuclear
Oversight
Mgr-Brunswick NOS
Mgr-Crystal River NOS
(Typical)
Supervisor -Quality Control
Receipt Inspector
QC Inspector
Mgr-HarrisNOS
Mgr-Robinson NOS
Mgr-Corporate NOS
Superintendent -Oversight
Superintendent -Vendor Quality
SupervisorEmployee Concerns
Mgr-New Plant NOS
New ReportingAlignment New Position
Chief Nuclear Officer
Superintendent -NOS

21
Nuclear EngineeringOrganization
Joe Donahue VP Nuclear Engineering
George Attarian General Manager
Nuclear Engineering
Mgr Nuclear Design Engineering
Mgr Nuclear Technical Services
Mgr Nuclear Systems
Performance
Mgr Probabilistic Safety Assessment
John Siphers Manager Nuclear Fuel and Safety
Analysis
John Ferguson Manager Materials
Services
Michael Heath Supervisor License
Renewal
VacantGeneral Manager
NGG Projects
•Improve design rigor•Fleet efficiencyenhancements
•Equipment reliability•Component engineers•Engineering programs
•System performance•Key engineering industryresponses

Industry IssuesGSI-191 - Assessment of Debris Accumulation on PWR Sump PerformanceGL 2008-01 - Managing Gas Accumulation in Emergency Core Cooling, Decay Heat Removal and Containment Spray Systems
Plant PerformanceEquipment reliabilityRisk reduction
Engineering OrganizationEngineering alignment and performanceEngineering staffing
22
Fleet Engineering Focus

AREVA fuelTransitioning from GE to AREVA at BNPHigh Thermal Performance Fuel at PWRs
FME program and control
Reactivity management
Sound fuel inspections
Strict reactor maneuvering controls
23
Fuel Performance
HNP is a pilot plant for NFPA-805Submitted license amendment request in May 2008
Implement by December 2010
Submittal schedule for other plants
CR3 – 1Q 2010
RNP – 3Q 2010
BNP – 3Q 2011
Industry leadership
24
Fire Protection

CR3 & HNP: Completed Alloy 600 mitigation of pressurizer
CR3: Replacing steam generators in 2009
RNP: Current status
BNP: Inspecting dissimilar metal welds earlier than scheduled at both units due to operating experience
Industry leadership
25
Reactor Coolant System Materials

26
Brunswick Nuclear PlantBen Waldrep
Vice President

27
Barry DavisManager -Eng
Steve HowardManager - Ops
Annette PopeManager - Maint.
Hall WallManager - O & S
Jerry JohnsonManager- E&RC
Mike WilliamsManager -Training
John TitringtonManager - NAS
Mike AnnaconeDirector – Site Operations
Ed Wills Plant General Manager
Leadership TeamBen WaldrepVice President
Phyllis MentelManager - NSS
In position greater than 2 years
In position 1 - 2 years
In position less than 1 year
John BeckerSupt – Major Proj
Randy IveyRecovery Manager
Paul DubrouilletSupv - Plant Support Group
Jerry FatkinManager –Human Performance

BNP1 NRC Performance Indicators
28
Cornerstone/Barrier Current Value
Indicator Color(Margin in Green)
Industry Quartile
Unplanned Scrams 0.0 100% 1st
Unplanned Scrams with Complications 0.0 100% 1st
Unplanned Power Changes 0.0 100% 1st
MSPI-AC Power 4.90 E-08 95% Not Applicable
MSPI – HPCI Injection 2.80 E-07 72% Not Applicable
MSPI – Heat Removal-RCIC -3.60 E-08 104% Not Applicable
MSPI – RHR -5.60 E-07 156% Not Applicable
MSPI – Service Water System – SW 3.70 E-07 63% Not Applicable
Safety System Function Failures 2.00 67% 3rd
RCS Activity 0.000 100% 1st
RCS Leakage 14.00% 72% 4th
ERO Drill/Exercise Performance 97.0 % 70% 2nd
ERO Drill Participation 100.0% 100% 1st
ERO Alert & Notification System 99.9% 98% 1st
Occupational Exposure Control 0.00 100% 1st
RETS/ODCM Effluents 0 100% 1st
28

BNP2 NRC Performance IndicatorsCornerstone/Barrier Current
ValueIndicator Color
(Margin in Green)Industry Quartile
Unplanned Scrams 0.8 73% 3rd
Unplanned Scrams with Complications 0.0 100% 1st
Unplanned Power Changes 0.8 87% 2nd
MSPI-AC Power 2.40 E-08 98% Not Applicable
MSPI – HPCI Injection 1.70 E-07 83% Not Applicable
MSPI – Heat Removal-RCIC -2.00 E-09 100% Not Applicable
MSPI – RHR -4.40 E-07 144% Not Applicable
MSPI – Service Water System – SW -1.40 E-07 114% Not Applicable
Safety System Function Failures 2.00 67% 3rd
RCS Activity 1.700% 96.6% 4th
RCS Leakage 10.00% 80% 3rd
ERO Drill/Exercise Performance 97.0% 70% 2nd
ERO Drill Participation 100.0% 100% 1st
ERO Alert & Notification System 99.9% 98% 1st
Occupational Exposure Control 0.00 100% 1st
RETS/ODCM Effluents 0 100% 1st
29
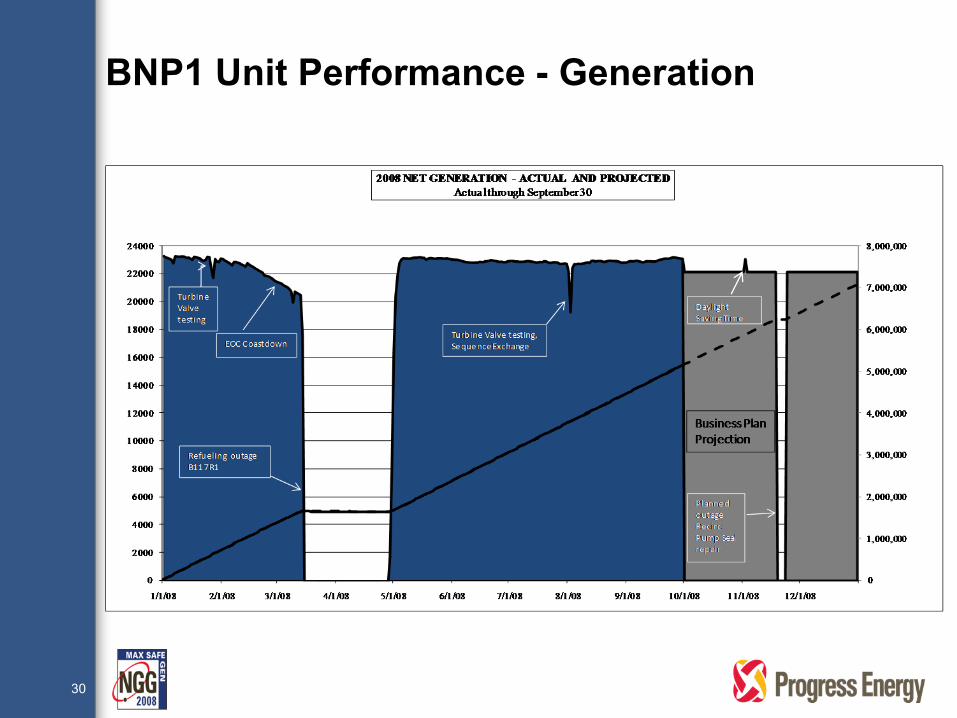
BNP1 Unit Performance - Generation
30

BNP2 Unit Performance - Generation
31

BNP1 Unit Performance – Capability Factor
93.24 92.6590.27
89.20 89.56 89.01
84
86
88
90
92
94
96
2003 2004 2005 2006 2007 2008 YE
BNP-1 Top Quartile Median
3224 month operating cycle32

BNP2 Unit Performance – Capability Factor
93.53 93.17
90.32
86.55 87.55
91.35
84
86
88
90
92
94
96
2003 2004 2005 2006 2007 2008 YE
BNP-2 Top Quartile Median
3324 month operating cycle33

BNP1 Unit Performance - INPO Index
97.9690.18 89.31 86.73 89.63 91.15
60
70
80
90
100
2003 2004 2005 2006 2007 2008 YE
BNP-1 Top Quartile Median
34
2008 Year-To-Date: 93.74
Historical INPO Index data is based on current Index calculation34

BNP2 Unit Performance - INPO Index
91.71 92.80
80.70
67.28
82.19
94.58
60
70
80
90
100
2003 2004 2005 2006 2007 2008 YE
BNP-2 Top Quartile Median
35
2008 Year-To-Date: 77.59
Historical INPO Index data is based on current Index calculation35

STEP 2010 Improvement Plan progress
Corrective Action Program improvements
Permanent sodium hypochlorite system
Once through ventilation
Leadership Academy training
Equipment ReliabilityNo Load disconnect switchesCondenser upgradesLarge Pump and Motor programPM program/single point vulnerability projects/RRILLegacy FME actions
36
2008 Accomplishments

SAMG diesels
Service Water System reliability improvements
EDG reliability improvements
B.5.b. implementation and inspection
Emergency siren replacement
37
2008 Accomplishments

Emergency diesel generator reliability
Tritium (stabilization pond project)
STEP 2010 Improvement Plan
CAP and Human Performance improvements
Service water system reliability improvements
Major Projects implementation
Permanent SAMG diesels
NRC EP graded exercise (11/18/08)
38
2008/2009 Initiatives & Challenges

39
Crystal River Nuclear Plant Dale Young
Vice President

40
Steve CahillManager- Eng
Chuck MorrisManager - Ops
Bill BrewerManager - Maint.
Ivan WilsonManager - O & S
Lee HughesSupt - Chem
Mark RigsbySupt - RP
Russ HarveySupv - Plant Support Group
Rick HonsManager -Training
Phyllis DixonManager NAS
Jon A. FrankeDirector – Site Operations
Jim Holt Plant General Manager
Leadership TeamDale E. YoungVice President
VacantManager - NSS
In position greater than 2 years
In position 1 - 2 years
In position less than 1 year
Harold WalkerManager -Human Performance
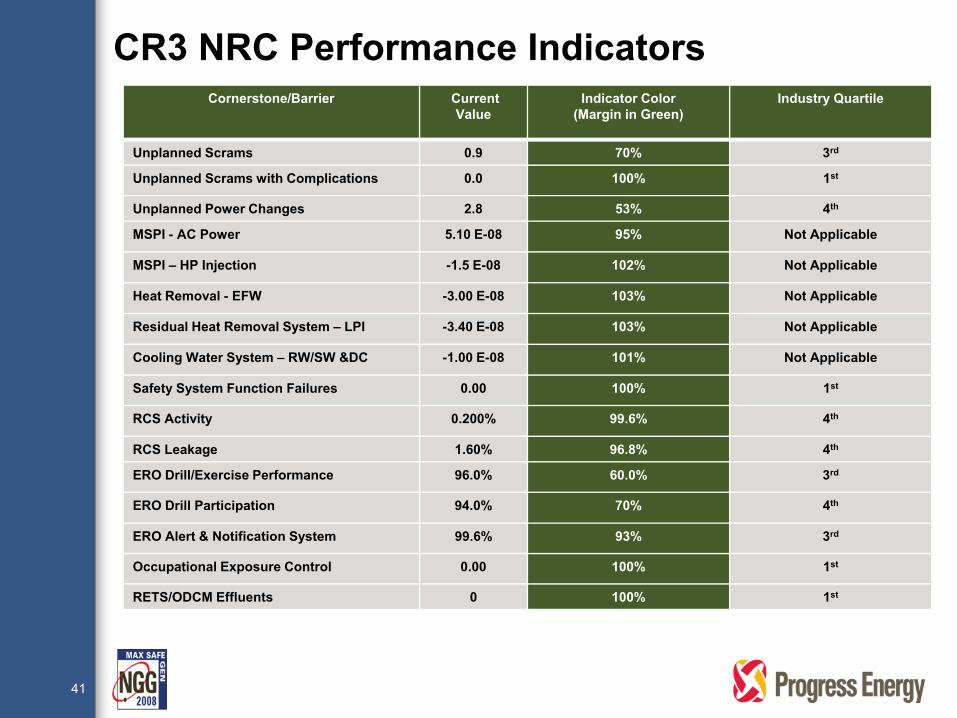
CR3 NRC Performance Indicators
41
Cornerstone/Barrier Current Value
Indicator Color(Margin in Green)
Industry Quartile
Unplanned Scrams 0.9 70% 3rd
Unplanned Scrams with Complications 0.0 100% 1st
Unplanned Power Changes 2.8 53% 4th
MSPI - AC Power 5.10 E-08 95% Not Applicable
MSPI – HP Injection -1.5 E-08 102% Not Applicable
Heat Removal - EFW -3.00 E-08 103% Not Applicable
Residual Heat Removal System – LPI -3.40 E-08 103% Not Applicable
Cooling Water System – RW/SW &DC -1.00 E-08 101% Not Applicable
Safety System Function Failures 0.00 100% 1st
RCS Activity 0.200% 99.6% 4th
RCS Leakage 1.60% 96.8% 4th
ERO Drill/Exercise Performance 96.0% 60.0% 3rd
ERO Drill Participation 94.0% 70% 4th
ERO Alert & Notification System 99.6% 93% 3rd
Occupational Exposure Control 0.00 100% 1st
RETS/ODCM Effluents 0 100% 1st
41

CR3 Plant Performance – Generation
42

CR3 Unit Performance – Capability Factor
93.99 94.0792.20
89.4591.20
90.72
84
86
88
90
92
94
96
2003 2004 2005 2006 2007 2008 YE
Perc
ent
CR3 Top Quartile Median
4324 month operating cycle43
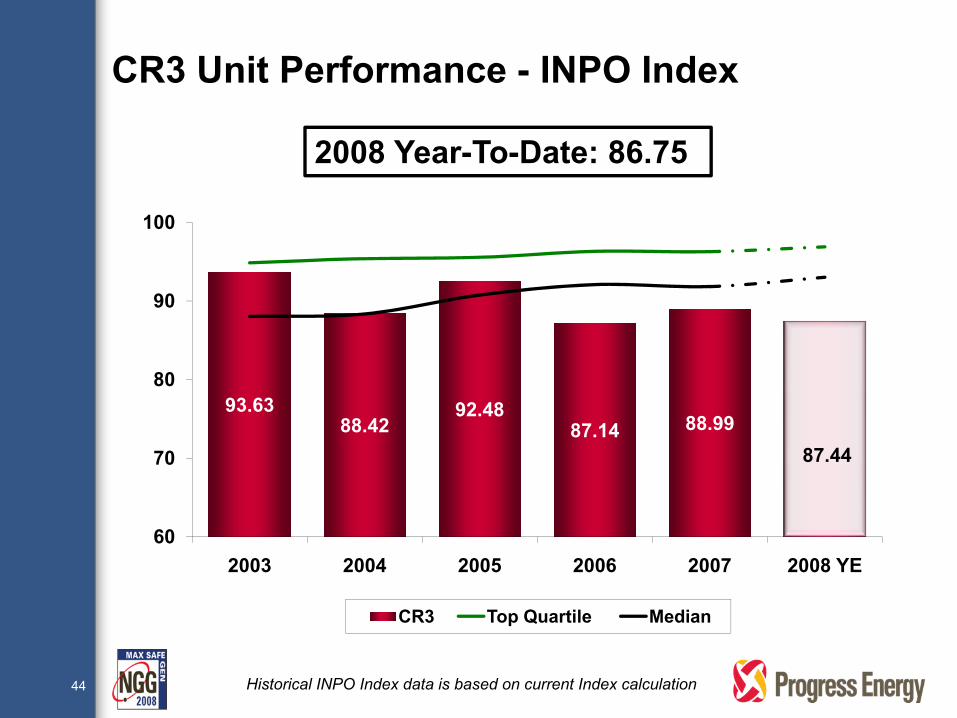
CR3 Unit Performance - INPO Index
93.6388.42
92.4887.14 88.99
87.44
60
70
80
90
100
2003 2004 2005 2006 2007 2008 YE
CR3 Top Quartile Median
44
2008 Year-To-Date: 86.75
Historical INPO Index data is based on current Index calculation44

RCP seal outage
Decay Heat Drop line mitigation
WANO Evaluation
Evaluated emergency preparedness exercise
INPO Technical Training accreditation
Force-on-Force exercise
B.5.b implementation and inspection
Emergency siren replacement
45
2008 Accomplishments

Human performance
Equipment reliability
Source term reduction
Steam Generator replacement/extended power uprate
License renewal
Workforce strategyLicense operator pipelineAging workforceNew plant
46
2008/2009 Initiatives & Challenges

47
Harris Nuclear PlantChris Burton
Vice President

Leadership Team Chris BurtonVice President
VacantDirector - Site Operations
Kym HarshawManager - NSS
Jim PierceManager - NAS (Acting)
GregKilpatrickManager -Training
John DillsManager - O&S
Sean O’ConnorManager -Engr
John DufnerManager - Maint
Scott SaundersManager - Ops
Mike RobinsonSupt - Envir & Chem
John WarnerSupv - Plant Support Group
Kelvin HendersonPlant General Manager
Brenda TysingerManager – Human Performance
In position greater than 2 years
In position 1 - 2 years
In position less than 1 year
Gregg SimmonsSupt - RP
48

HNP NRC Performance Indicators
49
Cornerstone/Barrier Current Value
Indicator Color(Margin in Green)
Industry Quartile
Unplanned Scrams 0.9 70% 3rd
Unplanned Scrams with Complications 0 100% 1st
Unplanned Power Changes 0.9 85% 3rd
MSPI-AC Power -3.50 E-07 135% Not Applicable
MSPI – HP Injection -3.20 E-09 100% Not Applicable
MSPI – Heat Removal – AFW -6.90 E-08 107% Not Applicable
MSPI – RHR – LPI -5.20 E-08 105% Not Applicable
MSPI – Cooling Water – ESW & CCW -2.00 E-07 120% Not Applicable
Safety System Function Failures 0.00 100% 1st
RCS Activity 0.000% 100% 1st
RCS Leakage 0.20% 99.6% 1st
ERO Drill/Exercise Performance 95.7% 57% 3rd
ERO Drill Participation 100.0% 100% 1st
ERO Alert & Notification System 99.4% 90% 3rd
Occupational Exposure Control 1.00 50% 4th
RETS/ODCM Effluents 0 100% 1st
49

HNP Unit Performance – Generation
50
0
1,000,000
2,000,000
3,000,000
4,000,000
5,000,000
6,000,000
7,000,000
8,000,000
9,000,000
0
2000
4000
6000
8000
10000
12000
14000
16000
18000
20000
22000
24000
1/1/08 2/1/08 3/1/08 4/1/08 5/1/08 6/1/08 7/1/08 8/1/08 9/1/08 10/1/08 11/1/08 12/1/08
2008 NET GENERATION - ACTUAL AND PROJECTEDActual through September 30
Turbine Valve testing
Condenser Expansion Joint failure
Daylight Saving Time
Business Plan Projection
Daylight Saving Time

HNP Plant Performance – Capability Factor
92.0389.89
92.91 91.88
94.6293.31
84
86
88
90
92
94
96
2003 2004 2005 2006 2007 2008 YE
HNP Top Quartile Median
5118 month operating cycle51

HNP Unit Performance - INPO Index
91.77 91.8399.91 99.81
95.6797.09
60
70
80
90
100
2003 2004 2005 2006 2007 2008 YE
HNP Top Quartile Median
52
2008 Year-To-Date: 97.09
Historical INPO Index data is based on current Index calculation52

Force-On-Force internal drills
INPO evaluation
B.5.b implementation and inspection
Emergency siren replacement
Maintenance backlog reduction
Fire Protection modifications
Charging Safety Injection Pump transfer switch
53
2008 Accomplishments

Equipment reliability
1RC-103
August forced outage
HNP CAP improvement plan
NFPA-805 transition
Operator exam development
Security performance
Single point vulnerability continuation
54
2008/2009 Initiatives & Challenges

55
Robinson Nuclear PlantTom Walt
Vice President

Leadership Team Tom WaltVice President
Eric McCartneyDirector - Site Operations
Chuck BaucomManager - NSS
Jan LucasManager -NAS
Koda Smith Manager -Training
Sandi BrownManager -O&S
Warren FarmerManager -Engr
Jack HuegelManager - Maint
Ken JonesManager -Ops
Ben WhiteSupt - Envir & Chem(interim)
Sharon WheelerSupv Plant Support Group
Ernie KapopoulosPlant General Manager
ErdalCabaSupt - MajorProjects
James NucklesManager –Human Performance
Joey RhodesSupt - RP
In position greater than 2 years
In position 1 - 2 years
In position less than 1 year56

RNP NRC Performance Indicators
57
Cornerstone/Barrier Current Value
Indicator Color(Margin in Green)
Industry Quartile
Unplanned Scrams 0 100% 1st
Unplanned Scrams with Complications 0 100% 1st
Unplanned Power Changes 0 100% 1st
MSPI - AC Power -1.70 E-07 117% Not Applicable
MSPI – HP Injection -3.80 E-08 104% Not Applicable
MSPI – Heat Removal – AFW 4.60 E-07 54% Not Applicable
MSPI – RHR – LP Injection 1.60 E-07 84% Not Applicable
MSPI – Cooling Water – CCW/SW 3.40 E-07 66% Not Applicable
Safety System Function Failures 0.00 100% 1st
RCS Activity 28.700% 42.6% 4th
RCS Leakage 0.20% 99.6% 1st
ERO Drill/Exercise Performance 95.1% 51% 3rd
ERO Drill Participation 98.5% 93% 3rd
ERO Alert & Notification System 99.9% 98% 1st
Occupational Exposure Control 0.00 100% 1st
RETS/ODCM Effluents 0 100% 1st
57

RNP Performance Summary - Generation
58
0
1,000,000
2,000,000
3,000,000
4,000,000
5,000,000
6,000,000
7,000,000
0
2000
4000
6000
8000
10000
12000
14000
16000
18000
20000
1/1/08 2/1/08 3/1/08 4/1/08 5/1/08 6/1/08 7/1/08 8/1/08 9/1/08 10/1/08 11/1/08 12/1/08
2008 NET GENERATION - ACTUAL AND PROJECTEDActual through September 30
Down power for RO-25RCS Cleanup
RO-25 Refuleing Outage37 day planned duration
Business Plan Projection
Valve testing

RNP Performance Summary - Capability Factor
93.3892.25 92.10 92.04 92.22 92.90
84
86
88
90
92
94
96
2003 2004 2005 2006 2007 2008 YE
RNP Top Quartile Median
5918 month operating cycle59
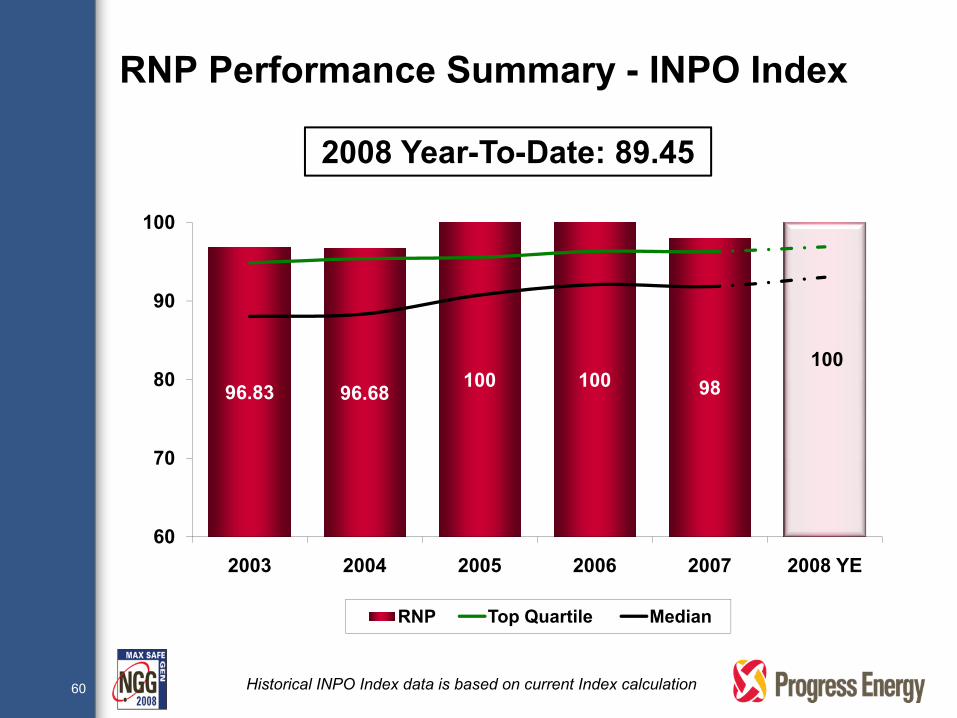
RNP Performance Summary - INPO Index
96.83 96.68 100 100 98100
60
70
80
90
100
2003 2004 2005 2006 2007 2008 YE
RNP Top Quartile Median
60
2008 Year-To-Date: 89.45
Historical INPO Index data is based on current Index calculation60

Force-on-Force exercise
Dry fuel storage campaign
INPO Evaluation
Collective radiation exposure
Chemistry performance
B.5.b implementation and inspection
Emergency siren replacement
61
2008 Accomplishments
Operations Training Accreditation RenewalAccrediting Board meeting (11/19)Focus on Training Excellence
Operations Initial TrainingDevelopment of NRC examinations
Fuel DefectZero by 2010
62
2008/2009 Initiatives & Challenges

Emergency Preparedness Graded ExerciseERO drill/exercise performance
Improving Safety System MarginsAuxiliary feedwater
Transition to Renewed Operating License in 2010
Self Evaluation Excellence
63
2008/2009 Initiatives & Challenges (Cont’d)
Continued focus on and commitment to operational excellence and safety
Committed to invest in current plants and expansion of nuclear generation
Open and transparent communication with stakeholders
Investing in people for today and the future
64
Progress Energy Nuclear Generation