Embed Size (px)
Citation preview
Building EfficiEnt citiEs: strEngthEning thE indian rEal EstatE MarkEt through codEs and incEntivEs
intErnational: india january 2014 issuE BriEf
supportEd in part By:
prEparEd By:administrative staff college of india andnatural resources defense council
© B
hask
ar d
eol
construction underway in greater noida, uttar pradesh, india
intErnational: india pagE 2Building EfficiEnt citiEs
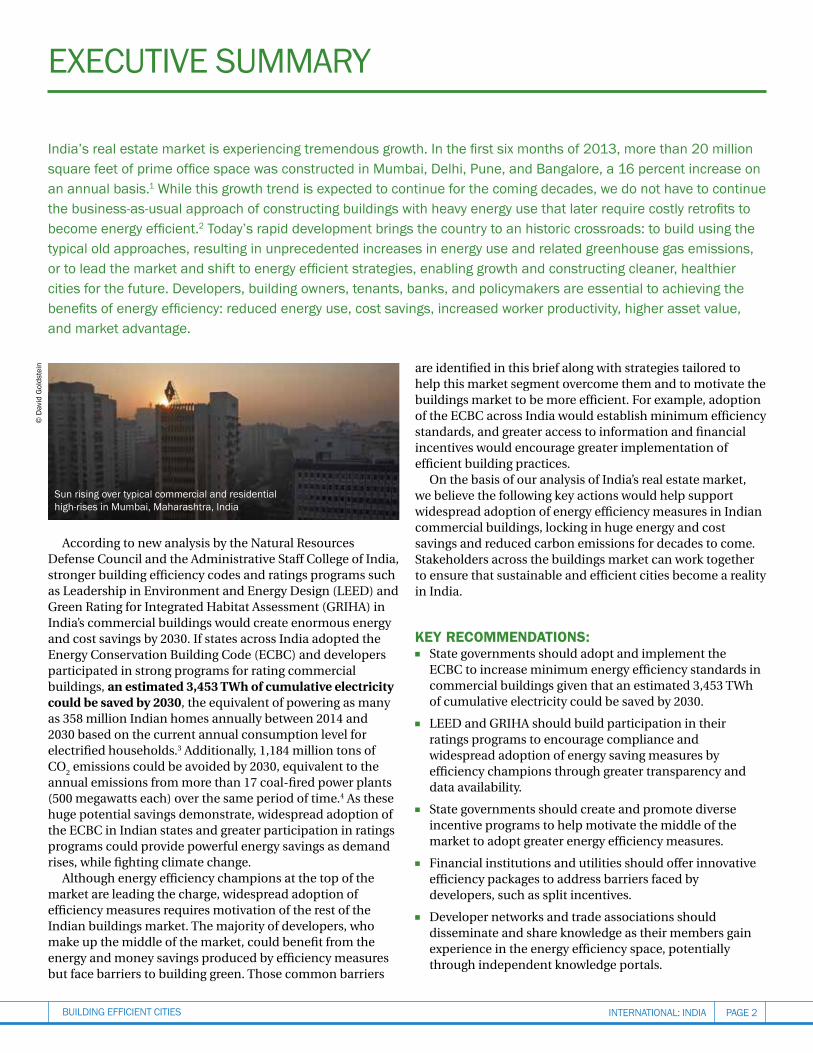
India’s real estate market is experiencing tremendous growth. In the first six months of 2013, more than 20 million square feet of prime office space was constructed in Mumbai, Delhi, Pune, and Bangalore, a 16 percent increase on an annual basis.1 While this growth trend is expected to continue for the coming decades, we do not have to continue the business-as-usual approach of constructing buildings with heavy energy use that later require costly retrofits to become energy efficient.2 Today’s rapid development brings the country to an historic crossroads: to build using the typical old approaches, resulting in unprecedented increases in energy use and related greenhouse gas emissions, or to lead the market and shift to energy efficient strategies, enabling growth and constructing cleaner, healthier cities for the future. Developers, building owners, tenants, banks, and policymakers are essential to achieving the benefits of energy efficiency: reduced energy use, cost savings, increased worker productivity, higher asset value, and market advantage.
According to new analysis by the Natural Resources Defense Council and the Administrative Staff College of India, stronger building efficiency codes and ratings programs such as Leadership in Environment and Energy Design (LEED) and Green Rating for Integrated Habitat Assessment (GRIHA) in India’s commercial buildings would create enormous energy and cost savings by 2030. If states across India adopted the Energy Conservation Building Code (ECBC) and developers participated in strong programs for rating commercial buildings, an estimated 3,453 TWh of cumulative electricity could be saved by 2030, the equivalent of powering as many as 358 million Indian homes annually between 2014 and 2030 based on the current annual consumption level for electrified households.3 Additionally, 1,184 million tons of CO
2 emissions could be avoided by 2030, equivalent to the
annual emissions from more than 17 coal-fired power plants (500 megawatts each) over the same period of time.4 As these huge potential savings demonstrate, widespread adoption of the ECBC in Indian states and greater participation in ratings programs could provide powerful energy savings as demand rises, while fighting climate change.
Although energy efficiency champions at the top of the market are leading the charge, widespread adoption of efficiency measures requires motivation of the rest of the Indian buildings market. The majority of developers, who make up the middle of the market, could benefit from the energy and money savings produced by efficiency measures but face barriers to building green. Those common barriers
are identified in this brief along with strategies tailored to help this market segment overcome them and to motivate the buildings market to be more efficient. For example, adoption of the ECBC across India would establish minimum efficiency standards, and greater access to information and financial incentives would encourage greater implementation of efficient building practices.
On the basis of our analysis of India’s real estate market, we believe the following key actions would help support widespread adoption of energy efficiency measures in Indian commercial buildings, locking in huge energy and cost savings and reduced carbon emissions for decades to come. Stakeholders across the buildings market can work together to ensure that sustainable and efficient cities become a reality in India.
Key Recommendations:n State governments should adopt and implement the
ECBC to increase minimum energy efficiency standards in commercial buildings given that an estimated 3,453 TWh of cumulative electricity could be saved by 2030.
n LEED and GRIHA should build participation in their ratings programs to encourage compliance and widespread adoption of energy saving measures by efficiency champions through greater transparency and data availability.
n State governments should create and promote diverse incentive programs to help motivate the middle of the market to adopt greater energy efficiency measures.
n Financial institutions and utilities should offer innovative efficiency packages to address barriers faced by developers, such as split incentives.
n Developer networks and trade associations should disseminate and share knowledge as their members gain experience in the energy efficiency space, potentially through independent knowledge portals.
ExEcutivE suMMary©
dav
id g
olds
tein
sun rising over typical commercial and residential high-rises in Mumbai, Maharashtra, India
intErnational: india Page 3Building EfficiEnt citiEs
BacKgRound: indian Buildings maRKet segmentsThe Indian buildings market includes a mix of developers. Some have taken advantage of energy efficiency benefits by building green buildings, while others have yet to understand building codes and the benefits of efficiency. Barriers and motivations also vary across the real estate market in India. In order to better understand the obstacles faced and incentives available to overcome them, it is helpful to divide the Indian buildings market into sectors. Several metrics can be used to define segments of the real estate market and to separate developers into the top, middle, or bottom:
n Financial capital and revenue: a developer’s gross annual revenue, sources of capital, revenue from tenants, return on investments, and risk profile
n Assets and property values: a developer’s overall assets and the value of the properties, based on building quality, location, and size
n Size of workforce: The number of staff and consultants employed by a developer
n Tenant characteristics: The length of residence and portion of properties occupied
n Energy: The annual energy consumption of a developer’s buildings portfolio
To identify barriers and incentives unique to different groups, the buildings market can be divided into three broad categories:
n The top: energy efficiency champions in the real estate sector
n The middle: the majority of the real estate market
n The bottom: the “unorganized sector”
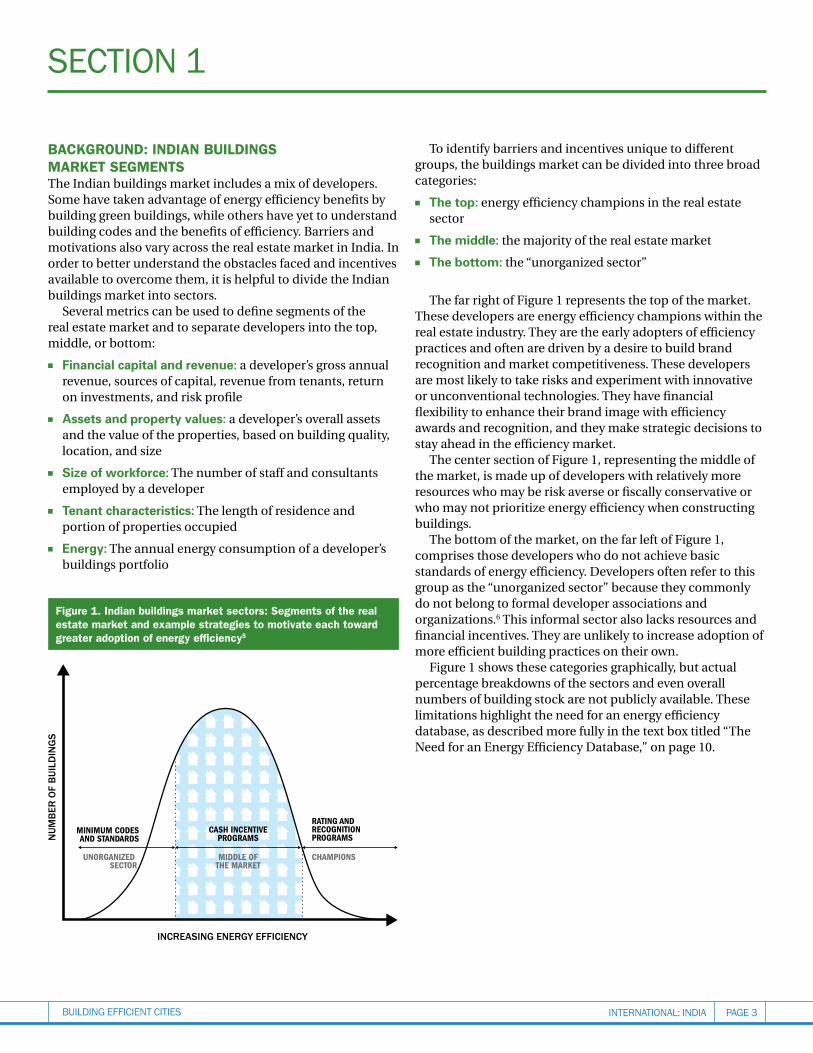
The far right of Figure 1 represents the top of the market. These developers are energy efficiency champions within the real estate industry. They are the early adopters of efficiency practices and often are driven by a desire to build brand recognition and market competitiveness. These developers are most likely to take risks and experiment with innovative or unconventional technologies. They have financial flexibility to enhance their brand image with efficiency awards and recognition, and they make strategic decisions to stay ahead in the efficiency market.
The center section of Figure 1, representing the middle of the market, is made up of developers with relatively more resources who may be risk averse or fiscally conservative or who may not prioritize energy efficiency when constructing buildings.
The bottom of the market, on the far left of Figure 1, comprises those developers who do not achieve basic standards of energy efficiency. Developers often refer to this group as the “unorganized sector” because they commonly do not belong to formal developer associations and organizations.6 This informal sector also lacks resources and financial incentives. They are unlikely to increase adoption of more efficient building practices on their own.
Figure 1 shows these categories graphically, but actual percentage breakdowns of the sectors and even overall numbers of building stock are not publicly available. These limitations highlight the need for an energy efficiency database, as described more fully in the text box titled “The Need for an Energy Efficiency Database,” on page 10.
sEction 1
Figure 1. indian buildings market sectors: segments of the real estate market and example strategies to motivate each toward greater adoption of energy efficiency5
20222020201820162014
NUM
BER
OF
BUIL
DIN
GS
INCREASING ENERGY EFFICIENCY
Business as Usual
40% ECBC, 5% Beyond
60% ECBC, 10% Beyond
60% ECBC, 10% Beyond—Improving ECBC
40% ECBC, 50% Beyond
CASH INCENTIVEPROGRAMS
MINIMUM CODESAND STANDARDS
RATING ANDRECOGNITION PROGRAMS
UNORGANIZED SECTOR
CHAMPIONSMIDDLE OFTHE MARKET
intErnational: india pagE 4Building EfficiEnt citiEs
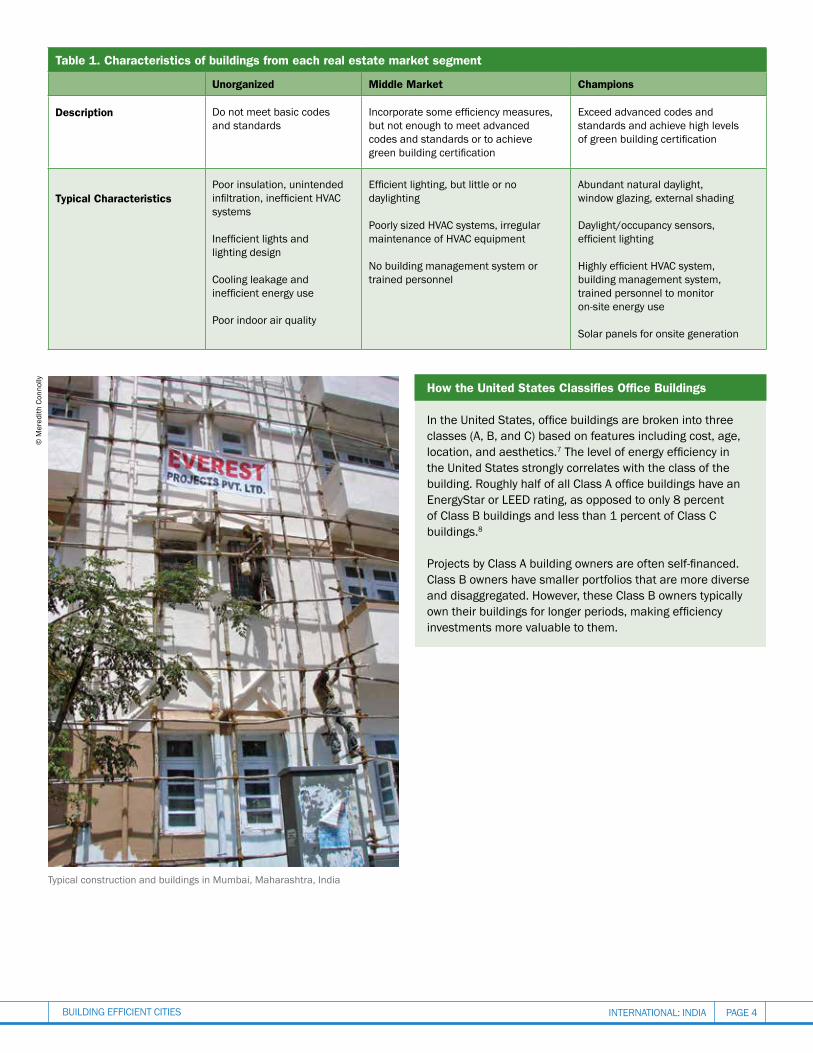
How the united states classifies office Buildings
In the United States, office buildings are broken into three classes (a, B, and C) based on features including cost, age, location, and aesthetics.7 The level of energy efficiency in the united states strongly correlates with the class of the building. Roughly half of all Class a office buildings have an Energystar or lEEd rating, as opposed to only 8 percent of Class B buildings and less than 1 percent of Class C buildings.8
Projects by Class a building owners are often self-financed. class B owners have smaller portfolios that are more diverse and disaggregated. however, these class B owners typically own their buildings for longer periods, making efficiency investments more valuable to them.
table 1. characteristics of buildings from each real estate market segment
unorganized middle market champions
description Do not meet basic codes and standards
Incorporate some efficiency measures, but not enough to meet advanced codes and standards or to achieve green building certification
Exceed advanced codes and standards and achieve high levels of green building certification
typical characteristicspoor insulation, unintended infiltration, inefficient HVaC systems
Inefficient lights and lighting design
cooling leakage and inefficient energy use
poor indoor air quality
efficient lighting, but little or no daylighting
poorly sized hvac systems, irregular maintenance of hvac equipment
No building management system or trained personnel
abundant natural daylight, window glazing, external shading
daylight/occupancy sensors, efficient lighting
Highly efficient HVaC system, building management system, trained personnel to monitor on-site energy use
solar panels for onsite generation
© M
ered
ith c
onno
lly
Typical construction and buildings in Mumbai, Maharashtra, India
intErnational: india pagE 5Building EfficiEnt citiEs
How to motivate india’s Buildings maRKet to incRease eneRgy eFFiciencyThe characteristics defining each segment of India’s real estate market require strategies tailored to encourage adoption of energy efficiency measures.
Efficiency champions: Members of this group require recognition and rewards for their efforts since brand visibility, leadership, and market competitiveness are their key drivers. Developers from this segment exceed energy code requirements and use innovative efficiency products. Greater use of rating systems that recognize sustainable and efficient buildings, such as LEED and GRIHA, is a key way to increase energy efficiency.9 Examples of efficiency champions include Godrej & Boyce and Infosys.
Middle market developers: To be motivated to institute more efficient building practices, this segment needs access to financial incentives and information and the adoption of minimum standards that level out the playing field. As the largest sector, this group is well positioned to catalyze change. Middle market developers have enough capital to accept longer payback periods, and their portfolios have more opportunities for improvement as compared with the top segment. It is critical that the middle market developers work with the top of the market to help state governments effectively develop and implement an energy efficiency building code framework and compliance structure.
Bottom-of-the-market participants: This segment requires awareness and the adoption of minimum efficiency codes and standards. Compliance with building energy codes
can eliminate inefficiencies and encourage developers to move to energy saving practices. Implementing equipment component standards, building energy ratings, and energy disclosure policies will make efficient products cheaper and more accessible to the broader market.
a closer look at india’s codes & standards
energy conservation Building code (ecBc): Developed by the Bureau of energy efficiency (Bee), the eCBC prescribes a minimum standard for energy use in new buildings and major retrofits.10 The load requirement for buildings to comply is 100 kW or 120 kilovolt-amps (kVa), which means that both commercial and high-rise residential buildings (approximately five stories or higher) come under the code’s purview. The eCBC establishes minimum requirements for energy efficient building design and construction. The code is voluntary at the national level, and the Ministry of Urban Development and state governments are responsible for its implementation and enforcement. Two states have fully adopted the code as mandatory, while several states are working toward making the eCBC operational for new construction and major retrofits.
leadership in energy and environmental design (leed): LeeD is an internationally recognized green building rating system.11 LeeD verifies that a building was designed and built using improved performance strategies, including energy savings, water efficiency, and carbon dioxide emissions reduction. LeeD India is the localized version of the international rating system and is administered by the Indian green Building Council (IgBC). according to IgBC, projects that comply with the eCBC also qualify for LeeD India ratings, provided they are equivalent to aSHRae standards. To continually improve efficiency, LeeD should strengthen its standards to encourage compliance beyond the eCBC as states adopt codes and the eCBC is improved.
green Rating for integrated Habitat assessment (gRiHa): gRIHa is the national rating system for green building design, developed and implemented by The energy and Resources Institute (TeRI) and the Ministry of New and Renewable energy (MnrE).12 If buildings contain fully air-conditioned interiors, eCBC compliance is mandatory for gRIHa ratings. If buildings are naturally ventilated, eCBC compliance is required only for the systems and equipment installed within the building. all new central government and public sector buildings are to comply with the requirements of at least three-star gRIHa ratings.13 like lEEd, the gRIHa standard should also be strengthened as codes are improved.
For more information on India’s building efficiency policies and programs, see NRDC’s report Constructing Change: Accelerating Energy Efficiency in India’s Buildings Market, October 2012, available at www.nrdc.org/international/files/india-constructing-change-report.pdf.
© M
ered
ith c
onno
lly
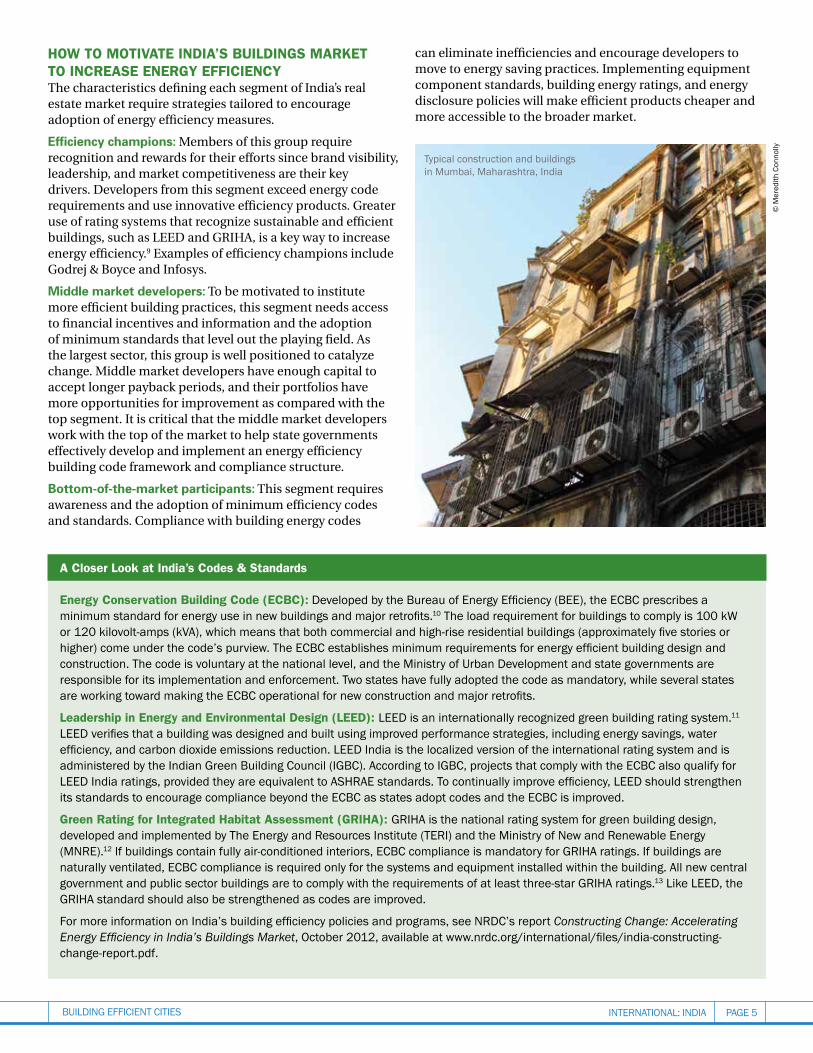
Typical construction and buildings in Mumbai, Maharashtra, India
intErnational: india Page 6Building EfficiEnt citiEs
looKing aHead: How stRongeR eFFiciency Building codes and Ratings PRogRams can save eneRgy use By 2030Stronger building efficiency codes in commercial buildings and greater participation in ratings programs such as LEED and GRIHA would create enormous energy and cost savings by 2030, according to a new analysis conducted by NRDC and ASCI.14 If states across India adopted the ECBC
sEction 2
and developers participated in strong programs for rating commercial buildings, an estimated 3,453 TWh of cumulative electricity could be saved by 2030, the equivalent of powering as many as 358 million Indian homes annually between 2014 and 2030 based on the current annual consumption level for electrified households. Additionally, 1,184 million tons of CO
2
emissions could be avoided by 2030, an amount equivalent to the annual emissions from more than 17 coal-fired power plants (500 megawatts each) over the same time period.
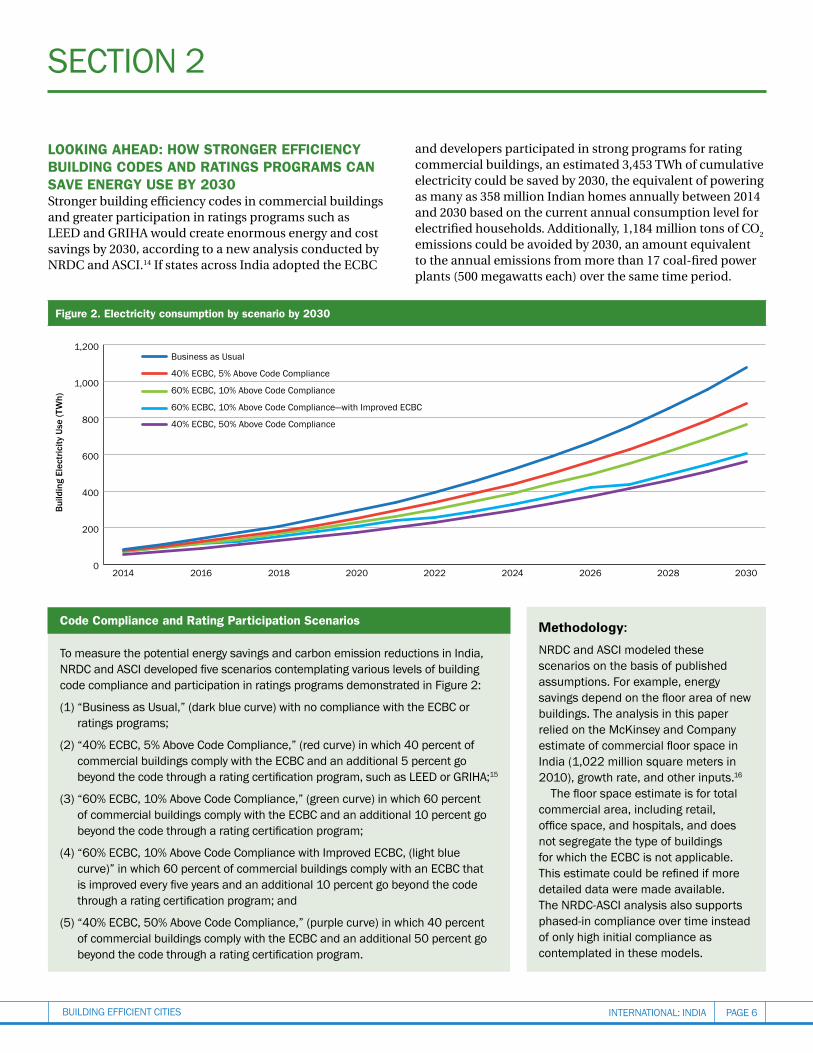
Figure 2. electricity consumption by scenario by 2030
code compliance and Rating Participation scenarios
To measure the potential energy savings and carbon emission reductions in India, NRDC and aSCI developed five scenarios contemplating various levels of building code compliance and participation in ratings programs demonstrated in figure 2:
(1) “Business as Usual,” (dark blue curve) with no compliance with the eCBC or ratings programs;
(2) “40% eCBC, 5% above Code Compliance,” (red curve) in which 40 percent of commercial buildings comply with the eCBC and an additional 5 percent go beyond the code through a rating certification program, such as LeeD or gRIHa;15
(3) “60% eCBC, 10% above Code Compliance,” (green curve) in which 60 percent of commercial buildings comply with the eCBC and an additional 10 percent go beyond the code through a rating certification program;
(4) “60% eCBC, 10% above Code Compliance with Improved eCBC, (light blue curve)” in which 60 percent of commercial buildings comply with an eCBC that is improved every five years and an additional 10 percent go beyond the code through a rating certification program; and
(5) “40% eCBC, 50% above Code Compliance,” (purple curve) in which 40 percent of commercial buildings comply with the eCBC and an additional 50 percent go beyond the code through a rating certification program.
Methodology:
nrdc and asci modeled these scenarios on the basis of published assumptions. for example, energy savings depend on the floor area of new buildings. The analysis in this paper relied on the Mckinsey and company estimate of commercial floor space in india (1,022 million square meters in 2010), growth rate, and other inputs.16
The floor space estimate is for total commercial area, including retail, office space, and hospitals, and does not segregate the type of buildings for which the eCBC is not applicable. This estimate could be refined if more detailed data were made available. The NRDC-aSCI analysis also supports phased-in compliance over time instead of only high initial compliance as contemplated in these models.
0
200
400
600
800
1000
1200
203020282026202420222020201820162014
0
200
400
600
800
1,000
1,200
203020282026202420222020201820162014
Build
ing
Elec
tric
ity U
se (T
Wh)
Business as Usual
40% ECBC, 5% Above Code Compliance
60% ECBC, 10% Above Code Compliance
60% ECBC, 10% Above Code Compliance—with Improved ECBC
40% ECBC, 50% Above Code Compliance
intErnational: india pagE 7Building EfficiEnt citiEs
The detailed analysis of code compliance and ratings programs in Figure 2 demonstrates:
savings through minimal effort (see red curve in Figure 2): If just 40 percent of commercial Indian buildings complied with the ECBC and 5 percent exceeded the ECBC through ratings programs, 1,254 TWh of electricity would be saved cumulatively within 17 years. In other words, by 2030, minimal ECBC compliance across India could save the amount of cumulative energy needed to power more than 130 million households in India per year over that time period. Additionally, this level of code compliance and ratings program participation could avoid 430 million tons of CO
2 emissions by 2030, equivalent to the annual carbon
emissions produced by 6.5 coal-fired power plants (500 MW each) for the next 17 years.
savings through widespread adoption of codes and Ratings Programs (see purple curve in Figure 2): Savings increase dramatically if more Indian buildings comply with the minimum efficiency code. If 40 percent of commercial buildings complied with the ECBC and 50 percent exceed the code through ratings programs, India would lock in 3,453 TWh of cumulative electricity savings by 2030, the equivalent of powering as many as 358 million Indian homes annually over that time period. Also, 1,184 million tons of CO
2 emissions savings could be locked in by 2030, an amount
equivalent to the annual emissions from 18 coal-fired power plants (500 megawatts each) over the same period of time.
state snapshot—andhra Pradesh: Looking to one specific state, Andhra Pradesh, minimal code compliance by commercial buildings (40 percent ECBC, 5 percent beyond) translates into 86 TWh of cumulative energy saved by 2030,
© B
hask
ar d
eol
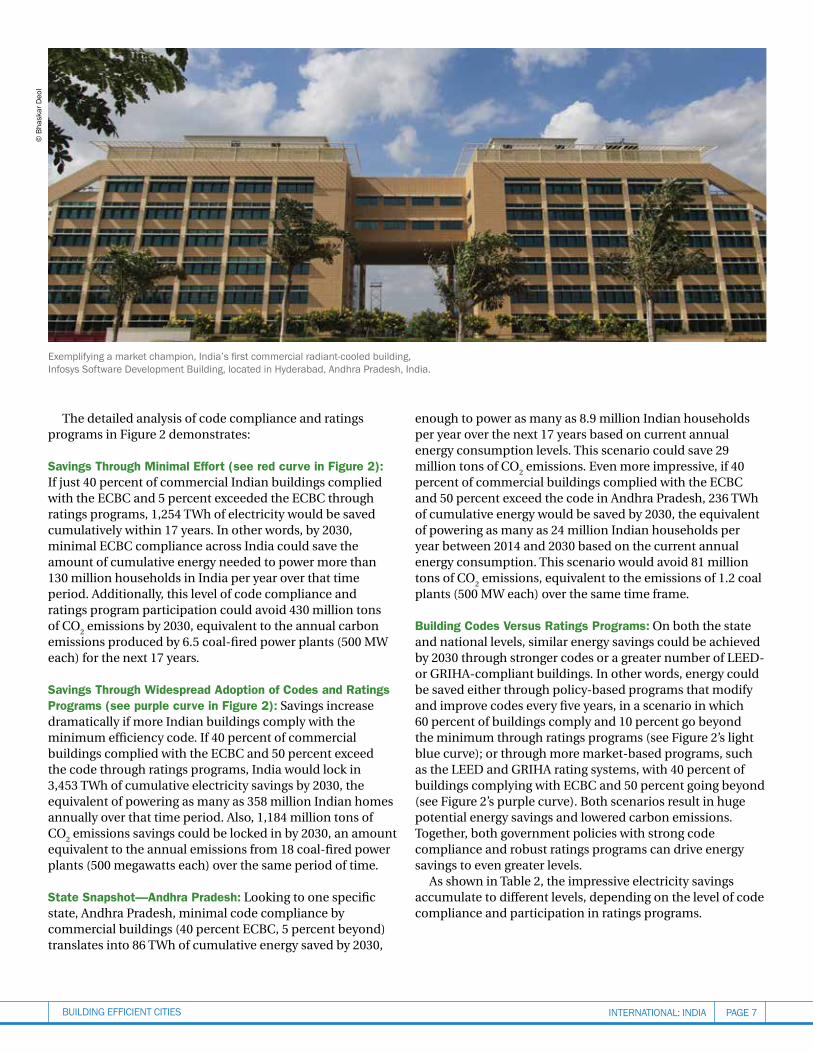
exemplifying a market champion, India’s first commercial radiant-cooled building, Infosys Software Development Building, located in Hyderabad, andhra Pradesh, India.
enough to power as many as 8.9 million Indian households per year over the next 17 years based on current annual energy consumption levels. This scenario could save 29 million tons of CO
2 emissions. Even more impressive, if 40
percent of commercial buildings complied with the ECBC and 50 percent exceed the code in Andhra Pradesh, 236 TWh of cumulative energy would be saved by 2030, the equivalent of powering as many as 24 million Indian households per year between 2014 and 2030 based on the current annual energy consumption. This scenario would avoid 81 million tons of CO
2 emissions, equivalent to the emissions of 1.2 coal
plants (500 MW each) over the same time frame.
Building codes versus Ratings Programs: On both the state and national levels, similar energy savings could be achieved by 2030 through stronger codes or a greater number of LEED- or GRIHA-compliant buildings. In other words, energy could be saved either through policy-based programs that modify and improve codes every five years, in a scenario in which 60 percent of buildings comply and 10 percent go beyond the minimum through ratings programs (see Figure 2’s light blue curve); or through more market-based programs, such as the LEED and GRIHA rating systems, with 40 percent of buildings complying with ECBC and 50 percent going beyond (see Figure 2’s purple curve). Both scenarios result in huge potential energy savings and lowered carbon emissions. Together, both government policies with strong code compliance and robust ratings programs can drive energy savings to even greater levels.
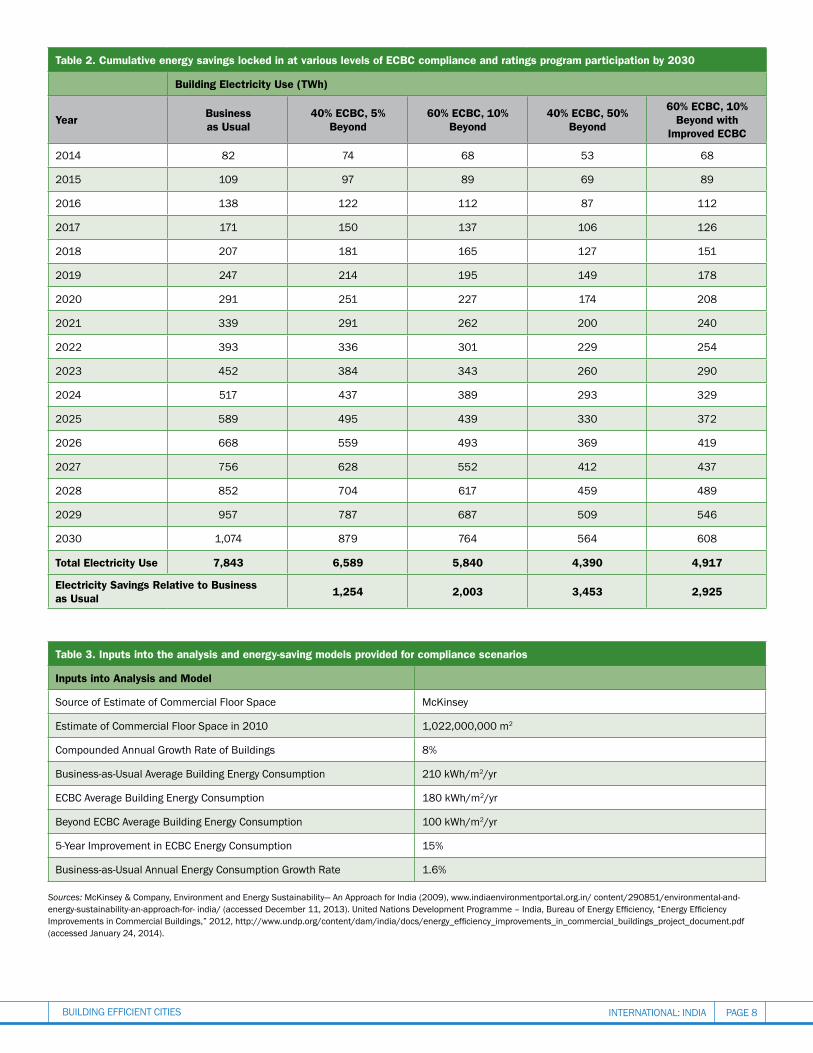
As shown in Table 2, the impressive electricity savings accumulate to different levels, depending on the level of code compliance and participation in ratings programs.
intErnational: india pagE 8Building EfficiEnt citiEs
table 2. cumulative energy savings locked in at various levels of ecBc compliance and ratings program participation by 2030
Building electricity use (twh)
year Business as usual
40% ecBc, 5% Beyond
60% ecBc, 10% Beyond
40% ecBc, 50% Beyond
60% ecBc, 10% Beyond with
improved ecBc
2014 82 74 68 53 68
2015 109 97 89 69 89
2016 138 122 112 87 112
2017 171 150 137 106 126
2018 207 181 165 127 151
2019 247 214 195 149 178
2020 291 251 227 174 208
2021 339 291 262 200 240
2022 393 336 301 229 254
2023 452 384 343 260 290
2024 517 437 389 293 329
2025 589 495 439 330 372
2026 668 559 493 369 419
2027 756 628 552 412 437
2028 852 704 617 459 489
2029 957 787 687 509 546
2030 1,074 879 764 564 608
total electricity use 7,843 6,589 5,840 4,390 4,917
electricity savings Relative to Business as usual
1,254 2,003 3,453 2,925
table 3. inputs into the analysis and energy-saving models provided for compliance scenarios
inputs into analysis and model
source of Estimate of commercial floor space Mckinsey
Estimate of commercial floor space in 2010 1,022,000,000 m2
compounded annual growth rate of Buildings 8%
Business-as-Usual average Building energy Consumption 210 kWh/m2/yr
EcBc average Building Energy consumption 180 kWh/m2/yr
Beyond EcBc average Building Energy consumption 100 kWh/m2/yr
5-Year Improvement in eCBC energy Consumption 15%
Business-as-Usual annual energy Consumption growth Rate 1.6%
Sources: McKinsey & Company, environment and energy Sustainability— an approach for India (2009), www.indiaenvironmentportal.org.in/ content/290851/environmental-and-energy-sustainability-an-approach-for- india/ (accessed December 11, 2013). United Nations Development Programme – India, Bureau of energy efficiency, “energy efficiency Improvements in Commercial Buildings,” 2012, http://www.undp.org/content/dam/india/docs/energy_efficiency_improvements_in_commercial_buildings_project_document.pdf (accessed january 24, 2014).
intErnational: india pagE 9Building EfficiEnt citiEs
BaRRieRs Faced By middle maRKet develoPeRsDespite the enormous potential energy savings that efficiency provides, developers in the middle of the market generally have not adopted measures to reap these benefits. Recognizing barriers to adoption and identifying potential solutions are the next steps needed to move the Indian buildings market toward broader implementation of energy efficiency. In our discussions with more than 500 developers across India, we found that developers encounter the following common barriers to adopting energy efficient practices:
n up-front costs: Developers are concerned about the recovery of the higher up-front costs of an energy efficient project. Many are unaware of the relatively short payback period of these costs, as demonstrated in case studies of energy efficient buildings.17
n split incentives: Developers often rent their buildings to tenants who pay the utility bills. In these arrangements, the developer incurs the costs of an efficiency measure, but the tenant benefits from the lower utility bills.
n limited inducements: Incentive programs that encourage investments in efficiency from government and financial institutions are not widely known or available.
SeCTION 3
n lack of information: Developers are hesitant to upgrade from familiar products and methods without easy access to information about efficiency measures. A perceived lack of access to experts exacerbates this lack of information.
solutions to oveRcome BaRRieRsAlthough efficiency barriers are well known and commonly encountered, there are several tools at developers’ disposal with which to overcome them. The following measures address these barriers and enable developers to take full advantage of the cost and energy savings available through efficient practices.
n advancing efficiency through codes: Comprehensive codes such as the ECBC provide developers with well-formed guidelines to use in constructing buildings in an efficient, cost-saving manner while leveling the playing field for all developers.
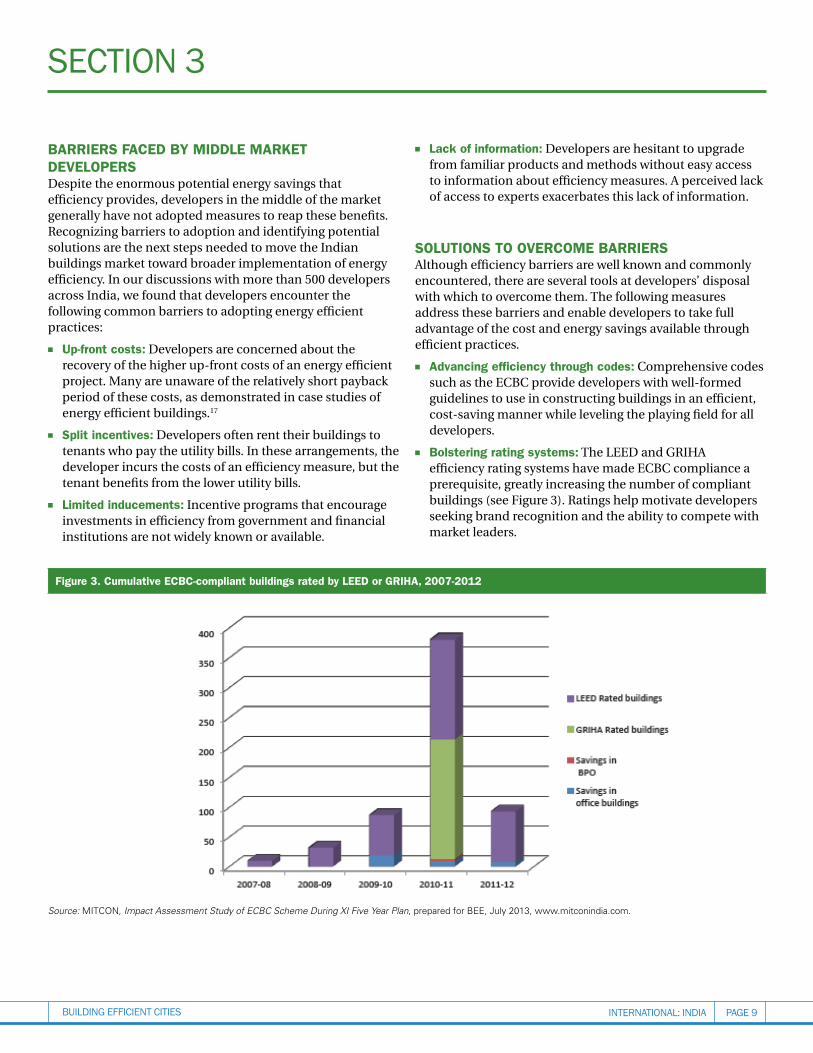
n Bolstering rating systems: The LEED and GRIHA efficiency rating systems have made ECBC compliance a prerequisite, greatly increasing the number of compliant buildings (see Figure 3). Ratings help motivate developers seeking brand recognition and the ability to compete with market leaders.
Figure 3. cumulative ecBc-compliant buildings rated by leed or gRiHa, 2007-2012
Source: MITCON, Impact Assessment Study of ECBC Scheme During XI Five Year Plan, prepared for BEE, July 2013, www.mitconindia.com.
intErnational: india pagE 10Building EfficiEnt citiEs
n addressing split incentives: “Green leases” address the problem of split incentives by allowing the owner to recover energy efficiency investments through higher rent, in exchange for lower tenant energy costs.18 Utilities can also provide on-bill financing, where upgrades are financed by the utility and payments are attached to a fixed electricity bill. Financial institutions can create innovative financing packages to reduce the upfront cost and monetize energy efficiency savings as well.
n sharing success stories: Developer networks and trade organizations can create and showcase case studies of top-of-the-market efficient buildings and encourage the sharing of efficiency opportunities, strategies, and resources among members.19
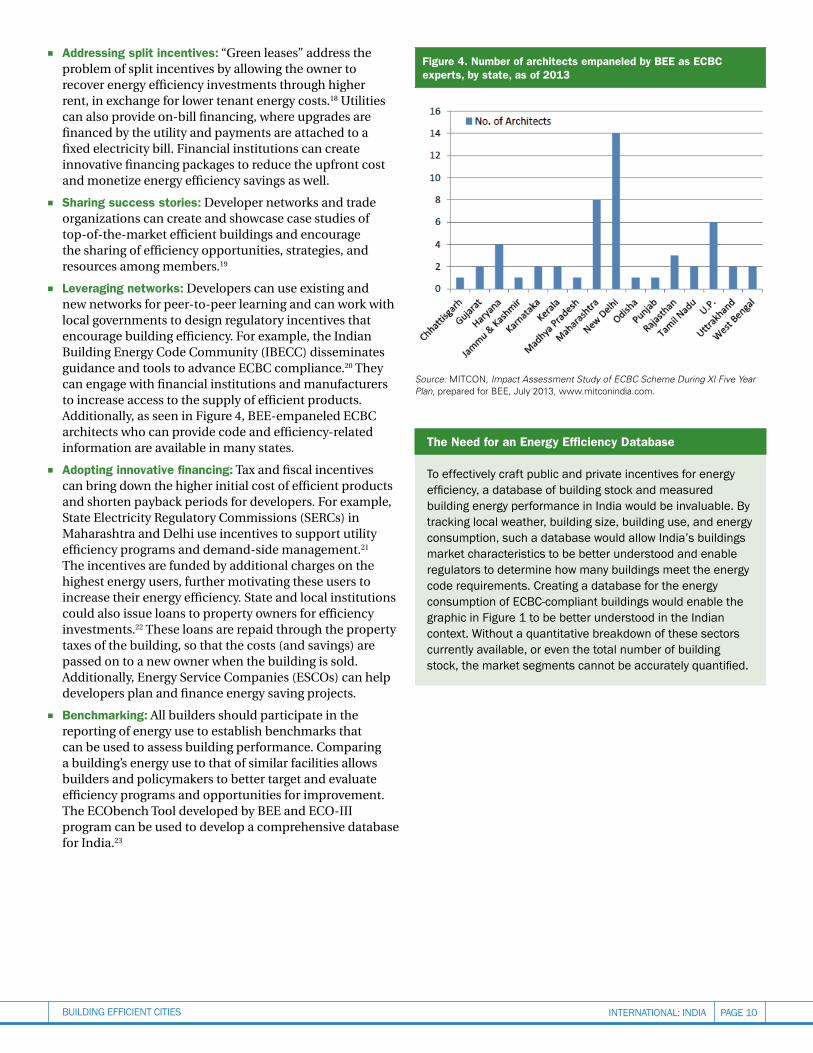
n leveraging networks: Developers can use existing and new networks for peer-to-peer learning and can work with local governments to design regulatory incentives that encourage building efficiency. For example, the Indian Building Energy Code Community (IBECC) disseminates guidance and tools to advance ECBC compliance.20 They can engage with financial institutions and manufacturers to increase access to the supply of efficient products. Additionally, as seen in Figure 4, BEE-empaneled ECBC architects who can provide code and efficiency-related information are available in many states.
n adopting innovative financing: Tax and fiscal incentives can bring down the higher initial cost of efficient products and shorten payback periods for developers. For example, State Electricity Regulatory Commissions (SERCs) in Maharashtra and Delhi use incentives to support utility efficiency programs and demand-side management.21 The incentives are funded by additional charges on the highest energy users, further motivating these users to increase their energy efficiency. State and local institutions could also issue loans to property owners for efficiency investments.22 These loans are repaid through the property taxes of the building, so that the costs (and savings) are passed on to a new owner when the building is sold. Additionally, Energy Service Companies (ESCOs) can help developers plan and finance energy saving projects.
n Benchmarking: All builders should participate in the reporting of energy use to establish benchmarks that can be used to assess building performance. Comparing a building’s energy use to that of similar facilities allows builders and policymakers to better target and evaluate efficiency programs and opportunities for improvement. The ECObench Tool developed by BEE and ECO-III program can be used to develop a comprehensive database for India.23
the need for an energy efficiency database
To effectively craft public and private incentives for energy efficiency, a database of building stock and measured building energy performance in India would be invaluable. By tracking local weather, building size, building use, and energy consumption, such a database would allow India’s buildings market characteristics to be better understood and enable regulators to determine how many buildings meet the energy code requirements. Creating a database for the energy consumption of eCBC-compliant buildings would enable the graphic in Figure 1 to be better understood in the Indian context. Without a quantitative breakdown of these sectors currently available, or even the total number of building stock, the market segments cannot be accurately quantified.
Figure 4. number of architects empaneled by Bee as ecBc experts, by state, as of 2013
Source: MITCON, Impact Assessment Study of ECBC Scheme During XI Five Year Plan, prepared for BEE, July 2013, www.mitconindia.com.
intErnational: india pagE 11Building EfficiEnt citiEs
Planyc and energystar’s Portfolio manager
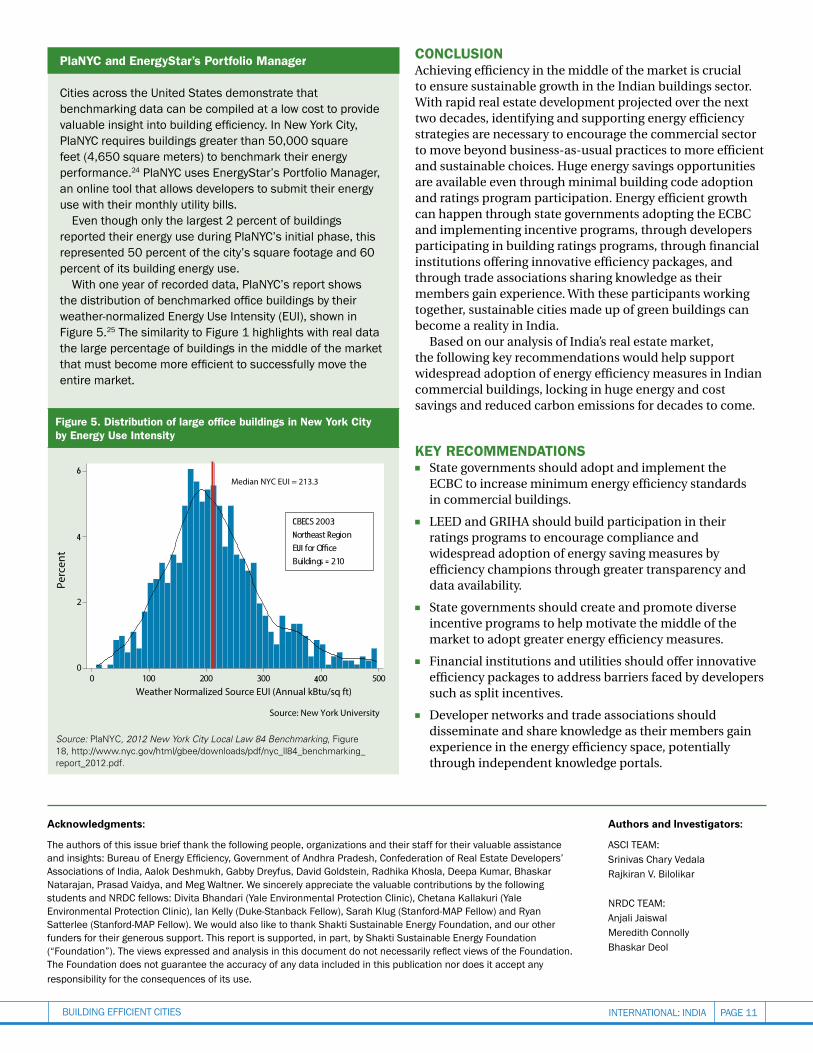
cities across the united states demonstrate that benchmarking data can be compiled at a low cost to provide valuable insight into building efficiency. In New York City, PlaNYC requires buildings greater than 50,000 square feet (4,650 square meters) to benchmark their energy performance.24 planyc uses Energystar’s portfolio Manager, an online tool that allows developers to submit their energy use with their monthly utility bills. even though only the largest 2 percent of buildings reported their energy use during planyc’s initial phase, this represented 50 percent of the city’s square footage and 60 percent of its building energy use. With one year of recorded data, planyc’s report shows the distribution of benchmarked office buildings by their weather-normalized energy Use Intensity (eUI), shown in figure 5.25 the similarity to figure 1 highlights with real data the large percentage of buildings in the middle of the market that must become more efficient to successfully move the entire market.
conclusion Achieving efficiency in the middle of the market is crucial to ensure sustainable growth in the Indian buildings sector. With rapid real estate development projected over the next two decades, identifying and supporting energy efficiency strategies are necessary to encourage the commercial sector to move beyond business-as-usual practices to more efficient and sustainable choices. Huge energy savings opportunities are available even through minimal building code adoption and ratings program participation. Energy efficient growth can happen through state governments adopting the ECBC and implementing incentive programs, through developers participating in building ratings programs, through financial institutions offering innovative efficiency packages, and through trade associations sharing knowledge as their members gain experience. With these participants working together, sustainable cities made up of green buildings can become a reality in India.
Based on our analysis of India’s real estate market, the following key recommendations would help support widespread adoption of energy efficiency measures in Indian commercial buildings, locking in huge energy and cost savings and reduced carbon emissions for decades to come.
Key Recommendationsn State governments should adopt and implement the
ECBC to increase minimum energy efficiency standards in commercial buildings.
n LEED and GRIHA should build participation in their ratings programs to encourage compliance and widespread adoption of energy saving measures by efficiency champions through greater transparency and data availability.
n State governments should create and promote diverse incentive programs to help motivate the middle of the market to adopt greater energy efficiency measures.
n Financial institutions and utilities should offer innovative efficiency packages to address barriers faced by developers such as split incentives.
n Developer networks and trade associations should disseminate and share knowledge as their members gain experience in the energy efficiency space, potentially through independent knowledge portals.
Figure 5. distribution of large office buildings in new york city by energy use intensity
Source: PlaNYC, 2012 New York City Local Law 84 Benchmarking, Figure 18, http://www.nyc.gov/html/gbee/downloads/pdf/nyc_ll84_benchmarking_report_2012.pdf.
Authors and Investigators:
asci tEaM: srinivas chary vedala rajkiran v. Bilolikar
nrdc tEaM: anjali jaiswalMeredith connollyBhaskar deol
0
2
Perc
ent
0 100 200 300 00 500
urrent eat r rmali ed Source tu sq ft
Median E 213.3
BE S 2003 ort east egion
E for O�ce Buildings 210
Figure 18: Histogram of O�ce Building EUIs
Median NYC EUI = 213.3
Perc
ent
Weather Normalized Source EUI (Annual kBtu/sq ft)
Source: New York University
Acknowledgments:
The authors of this issue brief thank the following people, organizations and their staff for their valuable assistance and insights: Bureau of energy efficiency, government of andhra Pradesh, Confederation of Real estate Developers’ associations of India, aalok Deshmukh, gabby Dreyfus, David goldstein, Radhika Khosla, Deepa Kumar, Bhaskar Natarajan, Prasad Vaidya, and Meg Waltner. We sincerely appreciate the valuable contributions by the following students and nrdc fellows: divita Bhandari (yale Environmental protection clinic), chetana kallakuri (yale environmental Protection Clinic), Ian Kelly (Duke-Stanback Fellow), Sarah Klug (Stanford-MaP Fellow) and Ryan Satterlee (Stanford-MaP Fellow). We would also like to thank Shakti Sustainable energy Foundation, and our other funders for their generous support. This report is supported, in part, by Shakti Sustainable energy Foundation (“Foundation”). The views expressed and analysis in this document do not necessarily reflect views of the Foundation. The Foundation does not guarantee the accuracy of any data included in this publication nor does it accept any responsibility for the consequences of its use.
intErnational: india pagE 12Building EfficiEnt citiEs
EndnotEs1 CBRE, Key Cities Across India Witness Supply of Over 20 mn. sq.ft. of Prime Office Space in the First Half of 2013, July 9, 2013, http://www.cbre.co.in/research/Pages/indiareports.aspx, (accessed July 30, 2013).
2 Kumar, Satish et al., Developing an Energy Conservation Building Code Implementation Strategy in India, 2010 ACEEE Summer Study on Energy Efficiency in Building, www.aceee.org/files/proceedings/2010/data/papers/2174.pdf (accessed July 30, 2013).
3 The average annual household energy consumption for electrified households in India in 2011 was 567 kWh/household. See GOI Central Electricity Authority, “All India Electricity Statistics, General Review 2012 (Containing Data for 2010-11),” p. 144, Table 9.1 (2012); 2011 Census of India, “Figures at a Glance,” http://www.censusindia.gov.in/2011census/PCA/PCA_Highlights/pca_highlights_file/India/5Figures_at_glance.pdf (accessed January 14, 2014); World Bank, Residential Consumption of Electricity in India, p. 8 Table 4, (2008): http://moef.nic.in/sites/default/files/Residentialpowerconsumption.pdf (accessed January 14, 2014). An alternate source finds that the average household electricity consumption was 778 kWh/household in 2011. See World Energy Council, Energy Efficiency Indicators, www.wec-indicators.enerdata.eu/ world.php (accessed January 14, 2014).
4 See Clean Energy Resources: Greenhouse Gas Equivalencies Calculator, EPA, www.epa.gov/cleanenergy/energy-resources/calculator. html (accessed December 11, 2013).
5 P. Vaidya et al., Transforming the Building Energy Efficiency Market in India: Lessons from the USA, 2010 ACEE Summer Study on Energy Efficiency in Buildings, Figure 2 (p. 353), www.aceee.org/files/proceedings/2010/data/papers/2029.pdf (accessed July 9, 2013). This is a variation of the Rogers Adoption Curve, which plots the adoption of a technology (in this case energy efficiency) versus time. The resulting bell curve can be broken into five sections in order of earliest to latest adoption: Innovators, Early Adopters, Early Majority, Late Majority, and Laggards. For example, see ACEEE, Market Transformation, aceee.org/portal/market-transformation (accessed December 12, 2013).
6 Workshop held in Hyderabad in November 2011; workshop held in Gujarat in September 2010. See details at: switchboard.nrdc.org/blogs/ajaiswal/building_efficiency_in_hyderab_1.html (accessed December 11, 2013).
7 Casey Bell et al., Financing for Multi-Tenant Building Efficiency: Why This Market Is Underserved and What Can Be Done to Reach It, ACEEE, Aug 2013 (pp. 4-5).
8 Ibid. at Appendix A (p. 32).
9 USGBC, About LEED, July 25, 2012, www.usgbc.org/articles/about-leed (accessed July 15, 2013). GRIHA, GRIHA Rating, www.grihaindia.org/index.php?option=com_content&view=article&id=87 (accessed August 1, 2013).
10 BEE and USAID ECO-III, Energy Conservation Building Code User Guide, July 2009, www.beeindia.in/ (accessed December 13, 2013).
11 IGBC, LEED India, www.igbc.in/site/igbc/testigbc.jsp?desc=22905&event=22869 (accessed December 13, 2013).
12 GRIHA India website, www.grihaindia.org/#&home (accessed December 13, 2013).
13 Press Information Bureau, Government of India, New Government Buildings Must Have at Least 3-Star Rating, Ministry of New and Renewable Energy, 4 January 2010, pib.nic.in/newsite/erelease.aspx?relid=56601 (accessed 13 December 2013).
14 NRDC and ASCI conducted this analysis based on discussion with the Indian Planning Commission and other experts on energy efficiency. The developed model is based on the United Kingdom’s project on low-carbon pathways and models, www.lowcarbonpathways.org.uk/ (accessed December 11, 2013). The Stanford University MAP Program and the Yale Environmental Protection Clinic also participated in the development of the analysis.
15 The Bureau of Energy Efficiency’s Energy Performance Index (EPI) measures energy consumed per unit of built area per year (kWh/m2/year). Currently, the EPI for commercial buildings in India ranges from 200–400 kWh/m2/year. Buildings that adopt energy efficiency measures have been found to reduce EPI to 180 kWh/m2/year and are considered ECBC compliant; energy champions demonstrate superior building performance of 100 kWh/m2/year or less. See Sanjay Seth, “Bee Star Rating for Buildings: An Initiative to Promote Energy Efficiency in Buildings,” Akshay Urja 4, no. 5 (April 2011), www.mnre.gov.in/file-manager/akshay-urja/march-april-2011/EN/index.htm (accessed 11 December 2013).
16 McKinsey & Company, Environment and Energy Sustainability—An Approach for India (2009), www.indiaenvironmentportal.org.in/content/290851/environmental-and-energy-sustainability-an-approach-for-india/ (accessed December 11, 2013). Alternative sources for commercial floor area estimates include Laurence Berkeley National Laboratory, ECO-III, Climateworks, and UNDP. See, e,g., Satish Kumar et al., Developing an Energy Conservation Building Code Implementation Strategy in India, ECO-III, 2010, www.beeindia.in/schemes/documents/ecbc/eco3/ecbc/Total%20Commercial%20Floor%20Space%20Estimates%20for%20India-%20Report%20No.1030.pdf (accessed December 11, 2013).
17 See, e.g., NRDC, ASCI, Saving Energy and Money: Case Study of the Energy-Efficiency Retrofit of the Godrej Bhavan Building in Mumbai, April 2013, www.nrdc.org/international/india/energy-retrofit-godrej-bhavan.asp (accessed December 11, 2013).
18 Studies have shown that tenants pay 5% to 9% higher rent for EnergyStar-labeled buildings while paying 13% lower utility bills, and pay 16% higher rent for LEED buildings. See Gary Pivo and Jeffrey D. Fisher, “Income, Value, and Returns in Socially Responsible Office Properties,” Journal of Real Estate Research (July-September 2010): 256, www.u.arizona.edu/~gpivo/PIVO%20FISHER%20RPI%20Feb%2010.pdf (accessed July 16, 2013); J. Wiley, J. Benefield, and K. Johnson, “Green Design and the Market for Commercial Office Space,” Journal of Real Estate Finance and Economics (July 30, 2008): 229, datapro.fiu.edu/campusedge/files/articles/johnsonk1590.pdf (accessed July 16, 2013).
19 For examples, see our case study on the Godrej Bhavan Building in Mumbai (NRDC, Saving Money and Energy, April 2013, www.nrdc.org/international/india/energy-retrofit-godrej-bhavan.asp (accessed December 13, 2013) and the high-performing building case study on the Spectral Services Consultants Corporate Office in Noida (Daylight with Less Heat, American Society of Heating, Refrigeration and Air-Conditioning Engineers, Fall 2008, www.hpbmagazine.org/File%20Library/Case%20Studies/Fall%202008/Spectral.pdf (accessed December 13, 2013).
20 Indian Building Energy Code Community (IBECC), http://www.ibecc.in/ (accessed January 24, 2013).
21 Maharashtra Electricity Regulatory Commission (MERC), Promotion of Energy Efficiency & DSM by Maharashtra Electricity Regulatory Commission, November 2006, www.esmap.org/sites/esmap.org/files/PR_PromotionOf_EE_Nov20.06.pdf (accessed December 13, 2013). Delhi Electricity Regulatory Commission (DERC), Draft DERC (Demand Side Management Implementation Framework) Regulations, 2012, www.derc.gov.in/Main%20Page%20Matter/Draft%20DERC%20(Demand%20Side%20Management%20Implementation%20Framework)%20Regulations,%202012.pdf (accessed December 13, 2013).
22 Center for Sustainable Energy, Property Assessed Clean Energy (PACE) Programs, www.energycenter.org/policy/property-assessed-clean-energy-pace (accessed December 13, 2013).
23 ECO-III, ECObench: Building Energy Benchmarking, www.eco3.org/ECObench/ (accessed December 13, 2013).
24 PlaNYC, New York City Local Law 84 Benchmarking Report, August 2012, www.nyc.gov/html/gbee/downloads/pdf/nyc_ll84_benchmarking_report_2012.pdf (accessed December 13, 2013).
25 EUI is a measurement of energy used per square foot per year.

natural Resources defense council
40 West 20th streetnew york, ny 10011212 727-2700Fax 212 727-1773
Beijingchicagolos angeleslivingstonsan franciscoWashington
www.nrdc.org
administrative staff college of india
Bella vistaRaj Bhavan Road, Khairatabad,Hyderabad - 500 082,India+91-40-66533000Fax +91-40-23312954
www.asci.org.in