Embed Size (px)
Citation preview

,,,,S’
GAO United States Gener$ Accounting Office L?7la?& Report to the Secretary of Defense
PROCUREMENT 1
DOD Can Use Economic Production Data More Effectively~
GAO/:
129126 s

--- United States General Accounting Office Waehiugton, D.C. 20548
National Security and International Affairs Division B.221206
January 28,1986
The Honorable Caspar W. Weinberger The Secretary of Defense
Dear Mr. Secretary:
As part of our review of the Department of Defense’s (DOD'S) develop- ment and implementation of the Defense Acquisition Improvement Pro- gram, also known as the “Carlucci Initiatives,” for the Chairman of the Senate Committee on Governmental Affairs, we examined DOD'S develop- ment and use of economic production rate information for major weapon systems. In general, an economic production rate is the level of produc- tion which results in the most effective and efficient use of existing manufacturing plants and facilities. This is our report on that part of our review.
The Deputy Secretary of Defense instituted the Defense Acquisition Improvement Program on April 30, 1981, to streamline the overall acquisition process and to procure weapon systems more economically. In June 1983, the Deputy Secretary established a high-level management working group to oversee efforts under the initiative to procure weapon systems at more economic rates. To make more effective and efficient use of existing manufacturing plants and facilities, the group defined an economic procurement range between minimum and maximum rates, Subsequently, the Office of the Secretary of Defense (OSD) began moni- toring the use of economic production rates on 50 selected systems during the budgeting process. These 50 systems do not include many major weapon systems being procured by DOD.
In conducting our review, we analyzed economic production data reported by the military services, and interviewed DODperSOnnel respon- sible for using the data. Our work was performed in accordance with generally accepted government auditing standards.
Economic production rate data is one of several important factors to be considered in making major system procurement decisions. Other factors include such things as total force requirements, affordability, or whether a system is experiencing technical difficulties whidh would pre- clude full-scale production. While other factors clearly influence deci- sions, comparing weapon systems unit costs at various alternative production levels provides data which helps promote more efficient defense procurement.
Page 1 GAO/NSLADM-37 Economic Production Data
B-221206
In analyzing the use of economic production data wit,hin DOD, we found that the military services are inconsistently reporting the data, and that economic production data have limited visibility in the budgeting pro- cess. These problems have limited the usefulness of economic produc- tion data as a budgeting tool.
The services are reporting economic production rate data inconsistently because OSD has not clearly defined what data should be reported or established formal, written criteria for selecting weapon systems to include in the reporting process. Moreover, OSD does not routinely require the services to develop and provide, as part of the budgeting process, unit cost data at various production levels. When the services have reported such data for a specific purpose, the data have been reported inconsistently and on a limited basis. (See app. I for additional discussion.)
I
Conclusions We believe that economic production data should be reported consist- ently for all appropriate major weapon systems to enhance the useful- ness of this information for making program comparisons and funding decisions in the budgeting process. At a minimum, we believe the infor- mation reported for these weapon systems should include budget year unit costs, consistently determined, at the planned buy and at the min- imum and maximum points of the economic production range. In addi- tion, DODshould establish written criteria for reviewing and selecting major weapons to be included in the reporting process.
Recommendations We recommend that the Secretary of Defense
. specifically define what economic production data the services are to * report, including defined unit cost data at alternative procurement rates and
. establish formal, written criteria for periodically reviewing and selecting weapon systems to be included in the economic production rate reporting process.
,Agency Comments We provided a draft of this report to DOD for its review and comment, We subsequently met with DOD officials and obtained their oral com- ments on the draft. While generally agreeing with our findings and rec- ommendations, DOD officials disagreed with a proposal in our draft that economic production rate data be collected on all systems included in
Page 2 GAO/NSIAD.S0-27 Economic Production Data

“_““-*.“-.------- -- ---
B.221206
DOD'S Selected Acquisition Reports. We also proposed in our draft that once this was accomplished, the economic production rate data be used in making funding decisions involving these systems. uouofficials stated that some systems, such as ships, which are included in the Selected Acquisition Reports, are not that sensitive to changes in production rates. We agreed, and therefore, modified our recommendations to call for the establishment of criteria for periodically reviewing and selecting weapon systems for which economic production rate data would be collected.
As you know, 31 USC. 720 requires the head of a federal agency to submit a written statement on actions taken on our recommendations to the House Committee on Government Operations and the Senate Com- mittee on Governmental Affairs not later than 60 days after the date of the report and to the House and Senate Committees on Appropriations with the agency’s first request for appropriations made more than 60 days after the date of the report.
We are sending copies of this report to the Chairmen, House and Senate Committees on Armed Services and Appropriations, House Committee on Government Operations, and Senate Committees on the Budget and Governmental Affairs; the Director, Office of Management and Budget; and to the Secretaries of the Air Force, Army, and Navy.
Sincerely yours,
Frank C. Conahan Director
Page 3 GAO/N9 IADM-37 Economic Production Data
--- . . . ---a--.-
’ Analysis of the Use of Economic Production Rates Within DOD
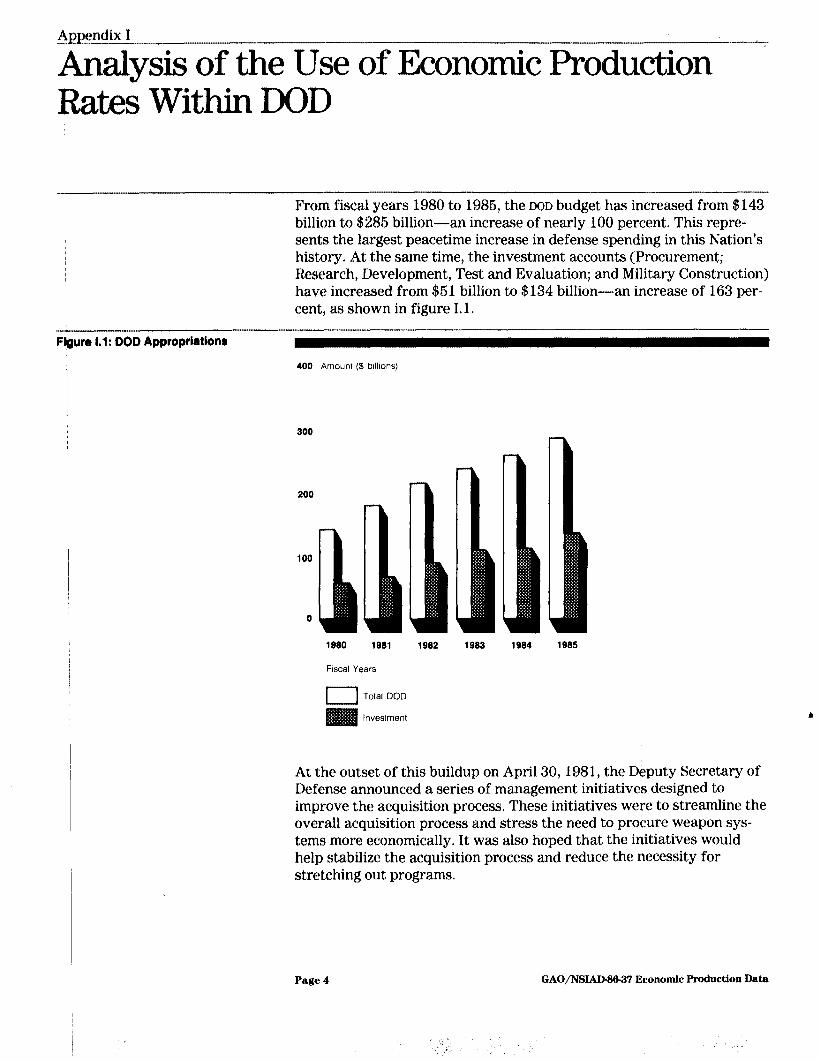
From fiscal years 1980 to 1986, the DOD budget has increased from $143 billion to $286 billion-an increase of nearly 100 percent. This repre- sents the largest peacetime increase in defense spending in this Nation’s history. At the same time, the investment accounts (Procurement; Research, Development, Test and Evaluation; and Military Construction) have increased from $61 billion to $134 billion-an increase of 163 per- cent, as shown in figure 1.1.
F&w 1.1: DOD Appropriation8
400 Amount ($ bullions)
300
:
1980 1981 1982 1983 1984 1985
Fecal Years
I Total DOD
Investment
At the outset of this buildup on April 30, 1981, the Deputy Secretary of Defense announced a series of management initiatives designed to improve the acquisition process, These initiatives were to streamline the overall acquisition process and stress the need to procure weapon sys- tems more economically. It was also hoped that the initiatives would help stabilize the acquisition process and reduce the necessity for stretching out programs.
Page 4 GAO/NSIAD-W37 Economic Production Data

Appendix I Analyrb of the Use of Economic Production It&es WitNn DOD
DOD Betti Corn:
One of the management initiatives focused specifically on procuring weapon systems at more economic production rates (EPRS). As an indica- tion of its importance, the Deputy Secretary of Defense established a high-level management working group in June 1983 to oversee efforts under this initiative. This group had two major functions-to define EPRS and to increase their visibility in the budgeting process. Our anal- ysis focused on what has been achieved since 1981 under this specific initiative. We found that OSD has not provided adequate guidance to the military services for computing EPRS, which has led to inconsistently reported production data within and among the military services. In addition, DOD is providing limited visibility to economic production data in the budgeting process. These problems have limited the usefulness of economic production data as a budgeting tool,
Needs to Provide Defining the EPR is necessary for comparing proposed production rates
2’
:
Guidance for of major weapon systems and making funding trade-offs in the budgeting process. In general, EPRS are intended to assure effective and
uting EPRs efficient use of existing manufacturing plants and facilities. More specif- ically, the working group defined an economical production range between minimum and maximum EPRS. The minimum rate is the point “where further reduction in quantity incurs an inordinate increase, in unit cost with an unacceptable return on investment.” Conversely, the maximum rate “occurs just before the existing or planned plant capacity, tooling or test equipment are exceeded.” This concept is illus- trated in figure 1.2.
Page 6 GAO/NSIADW-97 Economic Production Data

AppmdSx I Analyrb of the Use of Economic Production Rater within DOD
Figure 1.2: Relationahlp Between Unlt Cortr and Quantlty Produced
Unit Cost
Quantity Produced
Minimum Maximum EPR EPR
OSD does not routinely require the military services to develop and pro- vide, as part of the budget process, unit cost data for weapon systems at various production levels. The services, however, did develop this type of information in response to a January 1986 request from Senator Sam Nunn of the Senate Armed Services Committee. Senator Nunn requested information on the fiscal year 1986 planned buy an4 unit costs and quantities at the minimum EPR and various other levels, up to the max- imum EPR for 47 major weapon systems. a
The military services and program offices within the military services are not consistently determining EPRS because the DOD definition of these rates does not specifically state what costs should be included in deter- mining the rates. Some program offices use unit procurement costs while others use unit “fly-away” costs, which include fewer cost elements than unit procurement costs. In addition, neither the Air Force nor the Army used the same unit cost definition for all of their programs. We believe inconsistently developed data limits their use in the budgeting process for making program comparisons and funding trade-offs. The examples discussed below illustrate the inconsistencies we noted in pro- duction rate data reported by the military services.
Page 0 GAO/NSIAD-Ml-37 Economic Production Data

Appendix1 Analysis of the Use of Economic Production RatmWIthhDOD
. The Army generally reported unit procurement costs-the weapon’s basic component parts, peculiar support equipment, and initial spare parts-associated with various production rates of major weapon sys- tems. However, the Army did not consistently report unit procurement costs. For example, costs reported by the Army for the Division Air Defense (DIVAD) gun excluded spares. The Army reported a unit cost of $4.87 million for the maximum EPR, or $530,000 less than the unit pro- curement cost of $6.40 million in the December 1984 Selected Acquisi- tion Report (SAR),' which includes initial spares. In another instance involving the ‘IVW 2 missile, the Army’s reported fiscal year 1986 unit costs did not include all of the subsystems. While the Army reported that the unit cost for the planned buy was $7,200, we determined that the unit procurement cost for the fiscal year 1986 planned buy was $14,000. This difference occurred because the Army’s estimate did not include all subsystems associated with the planned buy.
. The Navy and the Air Force report aircraft unit costs differently. The Navy reports fly-away costs; the Air Force reports fly-away costs for some aircraft and unit procurement costs for other aircraft, Fly-away unit costs exclude peculiar support equipment, initial spares, and certain manufacturer’s nonrecurring costs such as tooling costs. The Navy’s F-14 aircraft illustrates the magnitude of the difference in these costs- the unit recurring fly-away cost for the planned buy of 18 aircraft in fiscal year 1986 was $34.3 million, or $12.9 million less than the unit procurement cost of $47.2 million.
The lack of DOD guidance on computing EPRS can lead to large variations in reported minimum economic production quantities, as shown in the following example.
. The Navy reported different minimum EPRS for three major weapon sys- tems within a period of a few weeks. On April 24, 1985, the Assistant Secretary for Shipbuilding and Logistics reported data to OSD for responding to Senator Nunn’s request. The information psovided by the Office of the Chief of Naval Operations, on April 3, 1986, to the Navy’s Office of Legislative Affairs for responding to this request contained dif- ferent results, as shown in table I. 1 for the HARM missile, Sidewinder missile, and Sparrow missile.
*The BARS provide a summary of key cost, schedule, and technical information for major weapon systems.
Page7 GAO/NSIADM-3 7Econo&ProductionData

Appendix I Analysis of the Use of Eco110tic Production Rates Within DOD
Table 1.1: EPR Data Reported by the Navy
System HARM
Sidewinder Sparrow
Minimum EPRs April 3, April 24,
1985 1985 - 3,240 3,696 - 4,800 2,400
3,000 1,200
In discussing what should or should not be included in unit production costs, an official in one of the Navy’s cost estimating offices told us that system unit cost data reported with economic production data should be consistent from program to program. The official said that using fly- away costs to include manufacturers’ tooling costs are probably the most appropriate costs because such costs are very sensitive to changes in production rates on a year-to-year basis. Including other costs, such as peculiar support equipment (e.g., support vehicles) and initial spares, are inappropriate because they are generally produced as additions to the basic weapon. We believe that to maximize the benefits to be achieved by using economic production data, the services and OSD must agree on what costs should or should not be included in unit production costs.
/
EpRs Limited Visibility In addition to defining EPRS, the working group’s other major function
iri the Budgeting Pkocess
was to increase the visibility of EPRS in the budgeting process. The working group set out to increase the visibility of EPRS by selecting 60 weapon systems to monitor throughout the budgeting process. These systems include 37 major weapon systems reported in the December 1984 SARs and 13 other systems of special interest to DOD management. In early 1984, the working group disbanded and transferred this activity to OSD as part of its budget review functions.
We found that OSD has not established formal, written criteria for reviewing and selecting weapon systems on which to collect EPR data. We believe that such guidance would help assure effective use of eco- nomic production data in the budgeting process.
&D’s Progress in Funding For the systems identified by the working group, DOD has made some h$jor Systems at EPRs is progress in funding them at more economic rates, as shown in figure 1.3.
Ulncertain ”
/, 1
Page 8 GAO/NSIAD-S6-37 Economic Production Data

Appendix I Analysie of the Use of Economic Production Rates Within DOD
Flgurf 1.3: DOD Progress in Funding 50 Systemsa At or Above Mlnimum EPR, Fiscal Years 1984 Through 1988 Fwal Years
0. 50
Percent of Systems Funded At or Above Mlnimum EPR
100
Estimate
BE~~l~de~ those systems of the 50 (6 in fiscal years 1984 and 1985 and 7 in fiscal year 1966) without procurement appropriations for the fiscal years indicated.
bGenerally based on fiscal year 1985 minimum EPR data, except in those few cases in which fiscal year 1964 data were available. According to an OSD official, the EPA data generally changed little from year- to-year.
cFiscal year 1986 data taken from the Conference Report on 6 1160, DOD Authorization Act, 1986.
DOD's overall progress in funding major systems at EPRS is UnCeI+tain for several reasons as discussed below.
l The 60 systems OSD is monitoring exclude many major systems because OSD has not required the military services to report EPR data on all major A systems. OSD collects EPR data on 37 of the 99 major systems reported in the December 1984 SARs. This leaves 62 major systems for which OSD is not routinely collecting EPR data. Consequently, we could not determine DOD'S progress for all major systems.
. DOD'S estimates of cost savings associated with EPRS are not reduced by costs incurred when some major systems are funded below economic rates to provide funding for other systems at more economic rates. For example, an early internal working group report dated November 17, 1983, stated that preliminary fiscal year 1985 budget submittals had reduced quantity buys on 26 programs below earlier plans, which could increase the total cost of these programs by $3.5 billion. The report fur- ther stated that an estimated savings of $2.6 billion reported in DOD's
Page 9 GAO/NSIAD-8837 Economic Production Data

Appendix 1 . .
Analynla of the Use of Economic production Rates Within DOD
May 1983 Economies and Efficiencies Report did not offset the $3.5 bil- lion Consequently, the net savings could be nonexistent.
. We could not compare DOD’S progress since fiscal year 1983 to that before this period because the military services were not collecting and reporting EPR data to OSD under the established definitions before November 1983. Such a comparison would have been beneficial in assessing DOD’S accomplishments in the period of high defense spending beginning in fiscal year 1980, in relation to results in the lower level of defense spending before fiscal year 1980.
. DOD’S target dates for achieving minimum EPRS on some of the major sys- tems being monitored are in the future. Therefore, they remain esti- mates subject to change.
The chairman of the high-level working group told us that DOD needs to make more progress in funding major systems at EPRS. We agree and while some progress has been made, many of the 50 monitored systems were below the minimum EPR in either fiscal year 1984 or fiscal year 1986. In addition, only 43 of the 50 systems are scheduled to be in pro- duction in fiscal year 1986. Based on the Conference Report for the 1986 DOD Authorization Act, 17 of these 43 systems are below the minimum EPR for fiscal year 1986. (See app. 11.) Defense Acquisition Improvement Program status reports have stated that to make progress in funding major systems at EPRS, DOD must continue its efforts to limit the number of major systems new starts, and cancel lower priority major programs. The Defense Acquisition Improvement Program’s April 1984 report stated that in the past DOD has typically stretched out programs and reduced quantity buys for major systems rather than cancel lower pri- ority programs to stay within budget ceilings. These stretch-outs and quantity reductions have frustrated DOD’S efforts to achieve more prog- ress in funding major systems at EPRS.
onomic Production Data %
We have reported in the past that EPRS should be used as one of the C E3e Useful in the major factors in funding programs.2 We believe that comparing weapon
B
y
dgeting Process system unit costs at various alternative production levels can assist decisionmakers in assessing the budgetary and economic effect of these alternatives. However, such an assessment for individual weapon sys- tems must also consider a variety of other factors, such as total force requirements, or whether the system is experiencing technical problems that would preclude full-scale production.
2Defense Budget Increases: How Well Are They Planned and S.e? (PLRD82-62, Apr. 13, 1982), p. 24.
Page 10 GAO/NS -7 Economic Production Data
‘,

Appendix I ---
Analysis of the Use of Economic Production Rates Within DOD
Economic production data can highlight the relationships between cost and quantities in the acquisition process. This data will show that decreasing production quantities will reduce the overall budget, but will generally result in paying a higher price for each of the fewer units. Buying fewer units costs more for each unit because the manufacturer increases unit costs to recover the costs incurred for equipment and facilities regardless of quantities produced. On the other hand, increasing production quantities will increase the overall budget, but will generally result in a lower price for each unit. Table I.2 for the Army’s M-l tank illustrates these cost quantity relationships.
Tablejl.2: M-l Tank Coat Quantity Com~arlronr (costs in millions)
Quantity
Unit procurement cost
Total procurement cost
Py 1999 Oth;,twrement levela Planned buy Max EPR
840 720 1,080 $2.65 $2.81 $2,44
$2,226 $2,023 $2,635
Increasing the fiscal year 1986 planned buy of 840 to 1,080 increases the total M-l procurement cost from $2,226 million to $2,636 million, or a difference of $409 million. The unit procurement cost, however, declines from $2.66 million to $2.44 million, or $210,000. A decrease from the planned buy to 720 units reduces the total procurement cost to $2,023 million, but increases the unit cost to $2.81 million.
Comparing the magnitude of change in unit costs between the planned buy and alternative procurement levels also identifies the economies and diseconomies associated with these buys. For example, weapon sys- tems having a large percentage difference between unit costs at alterna- tive procurement levels will have significant diseconomies associated with planned buys below higher alternative buys. Conversely, when the percentage differences are small, no significant economies are available in buying at higher alternative quantities. The Army’s Stinger missile and the Air Force’s IIR Maverick missile illustrate these relationships as shown in table 1.3.
Page 11 GAO/NSLAD-S&37 Economic Production Data
..,: :. .* :
Appendix I Analysis of the Use of Economic Production Rates Within DOD
Tab@ 1.3: Comparisons of ENmated UnitlCostr at Various Procurement Levbir
(thousands of dollars) -- .---~ --_.. -~~ ~. Difference between min and max EPR
Unit Procurement Costs (quantities) Percent of Planned buy Min EPR Max EPR Dollars min EPR
Stinger $89 $118 $69 $49 42 (3,439) (1,500) WOO) --. ---
IIR Maverick $144 $67 $65 $2 3 --- (3,500) (12,000) (16,800)------
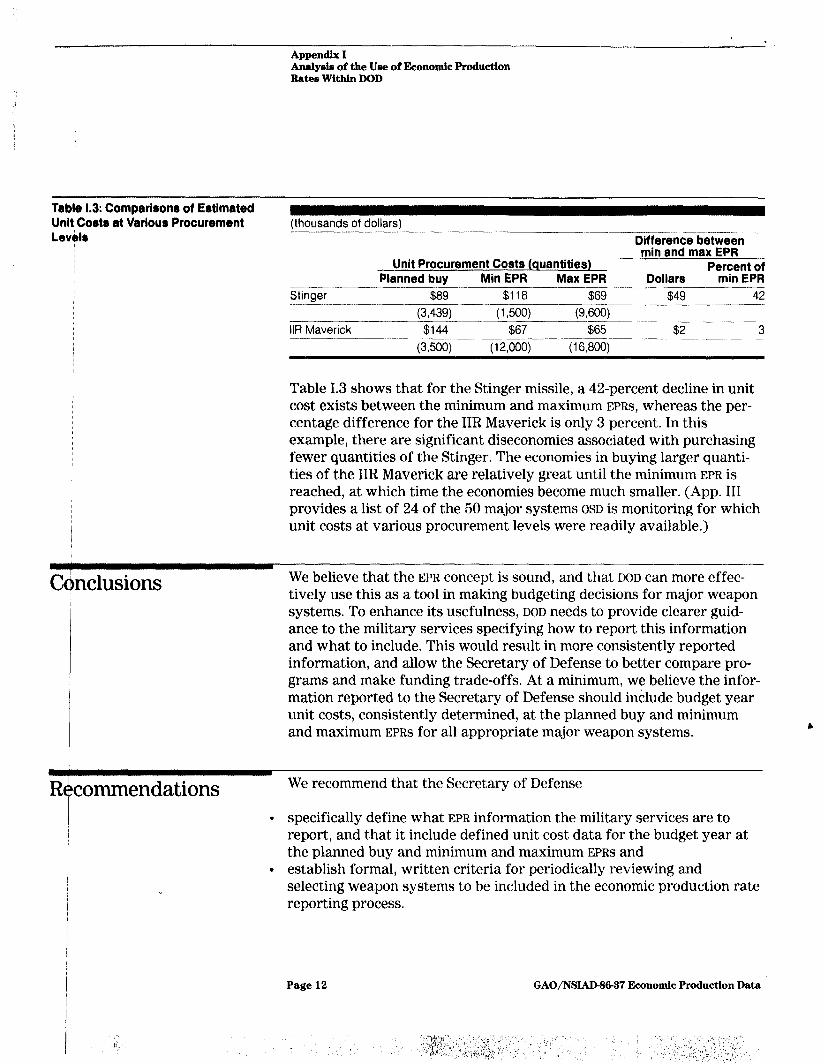
Table I.3 shows that for the Stinger missile, a 42-percent decline in unit cost exists between the minimum and maximum EPRS, whereas the per- centage difference for the IIR Maverick is only 3 percent. In this example, there are significant diseconomies associated with purchasing fewer quantities of the Stinger. The economies in buying larger quanti- ties of the IIR Maverick are relatively great until the minimum EPR is reached, at which time the economies become much smaller. (App. III provides a list of 24 of the 50 major systems OSD is monitoring for which unit costs at various procurement levels were readily available.)
I
I
khclusions We believe that the EPR concept is sound, and that DOD can more effec- tively use this as a tool in making budgeting decisions for major weapon systems. To enhance its usefulness, DOD needs to provide clearer guid- ance to the military services specifying how to report this information and what to include. This would result in more consistently reported information, and allow the Secretary of Defense to better compare pro- grams and make funding trade-offs. At a minimum, we believe the infor- mation reported to the Secretary of Defense should include budget year unit costs, consistently determined, at the planned buy and minimum and maximum EPRS for all appropriate major weapon systems. b
commendations We recommend that the Secretary of Defense
. specifically define what EPR information the military services are to report, and that it include defined unit cost data for the budget year at the planned buy and minimum and maximum EPRS and
. establish formal, written criteria for periodically reviewing and selecting weapon systems to be included in the economic production rate reporting process.
Page 12 GAO/NSIAD-M-37 Economic Production Data

Appendix II -
Systemsa Funded Eklow Minimum EPR From F’iscal Years 1984 Through 1986
Either One of the Two Years-FYs 1984 or 1985 Navy - 13 __..- -- MK-48 Toroedob Harooon Missileb
HARM Missileb Sparrow Missileb
Sidewinder Missileb -- --
Phoenix Missileb - Tomahawk Missileb - P-3C Aircraft
SH-60B Helicopter --- CH-53E Helicopterb
-___ Laser Maverick Missileb
MK-15 Gun System
Harrier AV8B Aircraft ..- -.._- ..----_-- Armv - 5 EH/UH-6OA Helicopterb __~~ Copperhead Projectileb
M-9 Earthmoverb
Air Force - 7
~-
M-l 09 Howitzerb FAASV Vehicleb
F-15 Aircraftb
T-46A NGT Trainer
KC-1OA Aircraftb
IIR Maverick Missile’)
Laser Bomb Guidance GBU-15 Bomb
B-1 B Aircraft _____ Conference Report on DOD Authorization Act, 1986 ____.... -~-.-.--- Navv - 9 HARM Missile MK-15 Gun System
E-6A Aircraft
M-88 Al Recovery Vehicle
Air Force - 5
MK-46 Toroedo
--
MK-46 Torpedo
Tomahawk Missile
-_____
Army. 3
Peacekeeoer MX Missile
FAASV Vehicle
P-3C Aircraft
SH-GOB Helicopter Laser Maverick Missile
M-9 Earthmover
F-l 5 Aircraft
T-46A NGT Trainer IIR Maverick Missile
HH-GOD/E Helicopter
%cludes only the 50 systems monitored by OSD.
blndicates those systems (17) below the minimum EPR for both FY 1984 and FY 1985.
Page 13 GAO/NS IAD4M-37 Economic Production Data

Appendix III -_
Comparison of FY 1986 Estimati Unit Costs at Various Procurement Levels for a Sample of Major Weapon Systems
Dol!lars in millions
SyCtem# Army: AH&I Helicopter
tJHl60 Helicopter _ Copperhead Projectile -+~_-_“l_“_.._.____---.- Hellfire Missile
_ J between unit cost at min and max EPR
Unit Procurement Costs Percent of Planned buy Min EPR Max EPR Dollars min EPR
$9.81 $11.99 $9.53 $2.46 21 5.58 5.72 5.57 0.15 3
0.034 0.038 0.034 0.004 11
0.038 0.036 0.035 0.001 -3 M-1 Tank %%~issile _- _-.--_-- - ..-. _-~-~
Gun DIVAD
TOY 2 Missile i@S i Rockets
M%S Launchers i-------....----
Nab:. -- AVi8B Aircraft --I----.--
-____ E-,$ Aircraft -t-.-.---.--- EA 6B Aircraft _-- I- F-1,4A/D Aircraft ?$,-18A Aircraft -
St-&GOB Helicopter --. ..- P-&
-- Aircraft
-,- CH53E Helicopter .-.-,.- __-. -..-.---- Al Force: B-BiiiGir- I--
-.-
2.65 2.81 2.44 0.37 13 0.089 0.118 0.069 0.049 -7 4.8?c 51.36~ 4.07= 0.49 9
0.0072c 0.0073c 0.0071c 0.0002 3 (4 0.0075 0.0067 0.0008 11
- 63 1.90 1.82 0.08 4 --
16.6 18.0 15.5 02.5 14
35.3 35.3 30.7 04.6 13
23.5 26.4 21.7 04.7 18
34.3 37.0 25.3 11.7 32 21.2 21.2 20.4 0.8 4
14.0b 13.2 11.3 1.9 14
36.2b 30.7 26.3 4.4 14 .__ 14.5 15.3 14.2 1.1 7
162.4 218.0 162.4 55.6 26
32.5b 27.8 27.1 0.7 3 15.3 16.41 14.13 2.28 14
0.144b 0.067 0.065 0.002 3 40.6 55.3 40.6 14.7 27 A
5.5b 4.0 3.8 0.2 5
BOf the 50 systems OSD monitors, the above unit cost data was available for only these 24 systems. We recognize that the unit costs shown here are not consistently developed on each system, but we pre- sent them in this table as an indicator of how economic production rate data can be used.
bSelow minimum EPR.
CThese figures exclude certain costs normally included in unit procurement costs. (See p. 7.)
dCost not readily available.
eFlyaway costs
Page 14 GAO/NSIADM-37 Economic Production Data

Requests for copies of GAO reports should be sent to:
US. General Accounting Office Post Office Box 6016 Gaithersburg, Maryland 20877
Telephone 202-276-6241
The first five copies of each report are free. Additional copies are $2.00 each,
There is a 25% discount on orders for 100 or more copies~mailed to a single address,
Orders must be prepaid by cash or by check or money order made out to the Superintendent of Documents.

United States General Accounting Office W&shington, DC. 20648
Official Business P&x&y for Private Use $300
Y


![On the Automated Synthesis of Enterprise Integration ...Enterprise Integration Patterns [17] (EIP) so as to deal with a form of choreography adaptation. Specif-ically, distributed](https://img.pdfslide.net/doc/110x75/5f709e66b186323b0804d512/on-the-automated-synthesis-of-enterprise-integration-enterprise-integration.jpg)


![A Sensorimotor Approach to the Treatment …psychrights.org/Research/Digest/CriticalThinkRxCites/...Sensorimotor psychotherapy [31,32] is an approach developed to specif ically address](https://img.pdfslide.net/doc/110x75/5edb08a609ac2c67fa68b3be/a-sensorimotor-approach-to-the-treatment-sensorimotor-psychotherapy-3132.jpg)


![WELCOME! [deerwalk.edu.np]...WELCOME! Welcome to the second issue of Deerwalker. Deerwalker is a student-led magazine specif-ically aimed at providing platform to the stu-dents of](https://img.pdfslide.net/doc/110x75/60afbbfb0becfb136623beaa/welcome-welcome-welcome-to-the-second-issue-of-deerwalker-deerwalker.jpg)