Embed Size (px)
Citation preview
NSSE Working Student Study
Assessment Day PresentationOffice of Assessment
Fitchburg State College
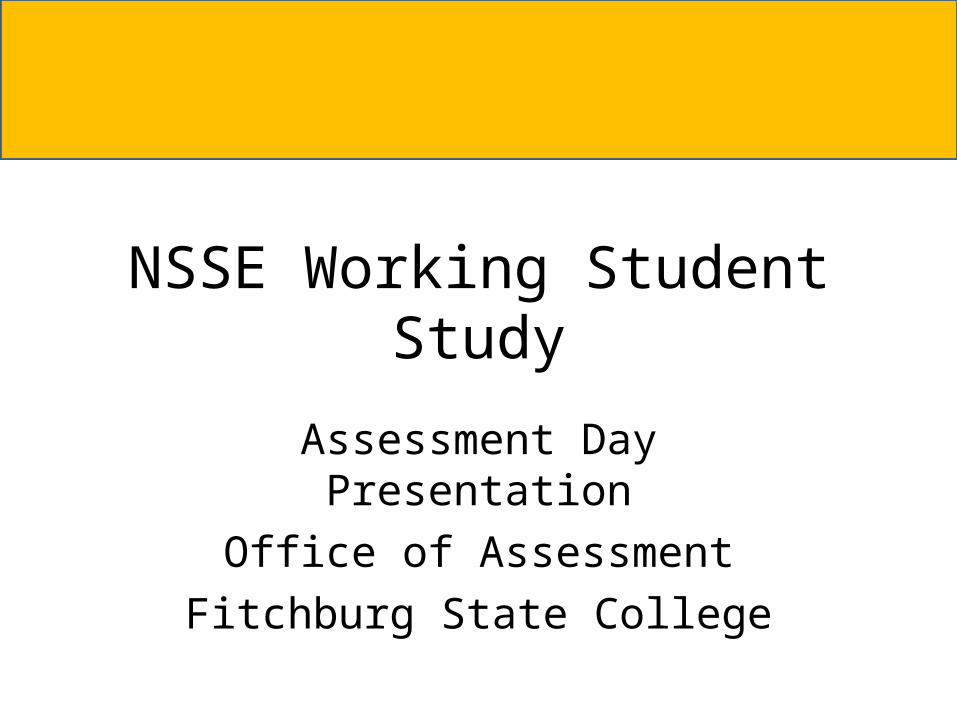
Background – January NSSE Report
Comparison Groups
Question Benchmark Percent of students who...Fitchburg
StateNE Public Masters
Ntnl Public
Masters
USA NSSE 2009
Seniors
2d. LAC
Said courses emphasized making judgments about the value of information 69% 74% 74% 74%
3a. LAC
Read more than 10 assigned books or book-length packs of readings 30% 36% 32% 35%
3c. LACWrote at least one paper or report of 20 pages or more 42% 53% 47% 50%
3d. LAC
Wrote more than 4 papers or reports between 5 and 19 pages 42% 49% 41% 46%
7e. EEECompleted foreign language coursework 18% 33% 31% 41%
Lowest Performing Items Compared to Peers
Follow-on Discussion
• FSC students seem to have heavy work schedules … are they unique that way?
• How does working impact student engagement self-reports?
Methodology
• “Special Work Analysis” ordered from NSSE.• Item responses controlled by answer to
Question 9c, “Hours worked per week off-campus.)
• Item frequencies, percent frequencies, means, standard deviations generated for New England Public Masters (NEPM) peer group.
• FSC data generated from College data file.
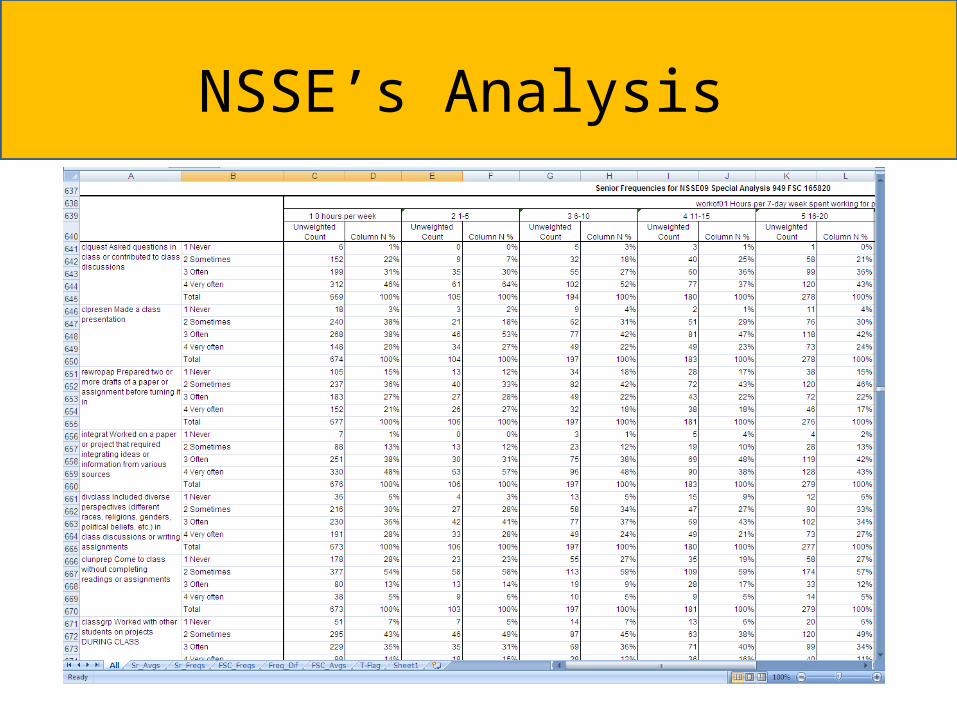
NSSE’s Analysis
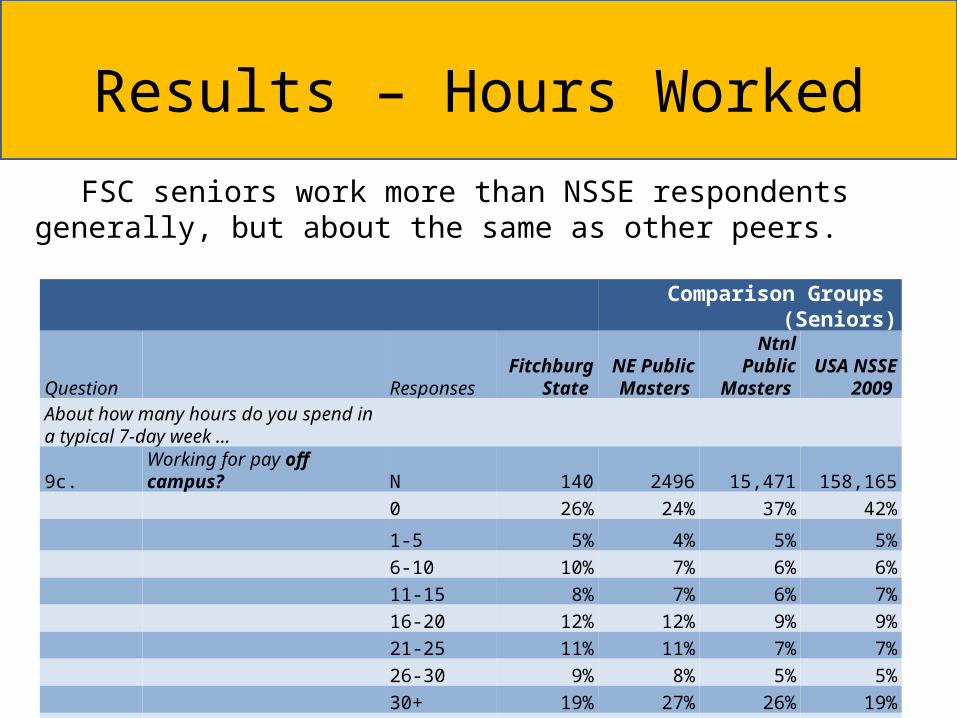
Results – Hours Worked
FSC seniors work more than NSSE respondents generally, but about the same as other peers.
Comparison Groups (Seniors)
Question ResponsesFitchburg
State NE Public Masters
Ntnl Public Masters
USA NSSE 2009
About how many hours do you spend in a typical 7-day week …
9c. Working for pay off campus? N 140 2496 15,471 158,1650 26% 24% 37% 42%
1-5 5% 4% 5% 5%6-10 10% 7% 6% 6%11-15 8% 7% 6% 7%16-20 12% 12% 9% 9%21-25 11% 11% 7% 7%26-30 9% 8% 5% 5%30+ 19% 27% 26% 19%Mean 15.6 17.7 15.0 12.6
NSSE “Benchmark” Scores
• Scaled scores combining inputs from many items– LAC – Level of Academic Challenge– ACL – Active and Collaborative Learning– SFI – Student-Faculty Interaction– SCE – Supportive Campus Environment– EEE – Enriching Educational Experiences
LAC – Level of Academic Challenge
• Spent appropriate time preparing for class• Reported broad scope and appropriate depth of
resources used• Reported many and challenging required papers and
reports• Reported perceptions of high intellectual and
academic priorities
ACL – Active /Collaborative Learning
• Asked questions or contributed to discussions• Made presentations• Worked with other students in or out of class• Tutored or taught other students• Participated in community-based projects as
part of a course• Discussed course-related ideas outside of class

SFI – Student-Faculty Interaction
• Discussed grades/assignments with instructor• Discussed career plans with faculty or advisor• Discussed ideas from course with faculty out
of class• Worked with faculty on other activities
(committees, research, etc.)• Received prompt feedback from faculty on
academic performance
SCE – Supportive Campus Environment
• Reported available/helpful academic support• Reported non-academic support (work,
family, etc.)• Reported campus social activities• Reported good relationships with other
students, faculty members, administration, and staff
EEE – Enriching Educational Experiences
• Talked with students holding different beliefs, opinions, and values
• Talked with students of different races ethnicities, in and out of class
• Used technology to enhance academics• Participated in internships, service learning,
study abroad, co-curricular activities, capstone experiences, etc.
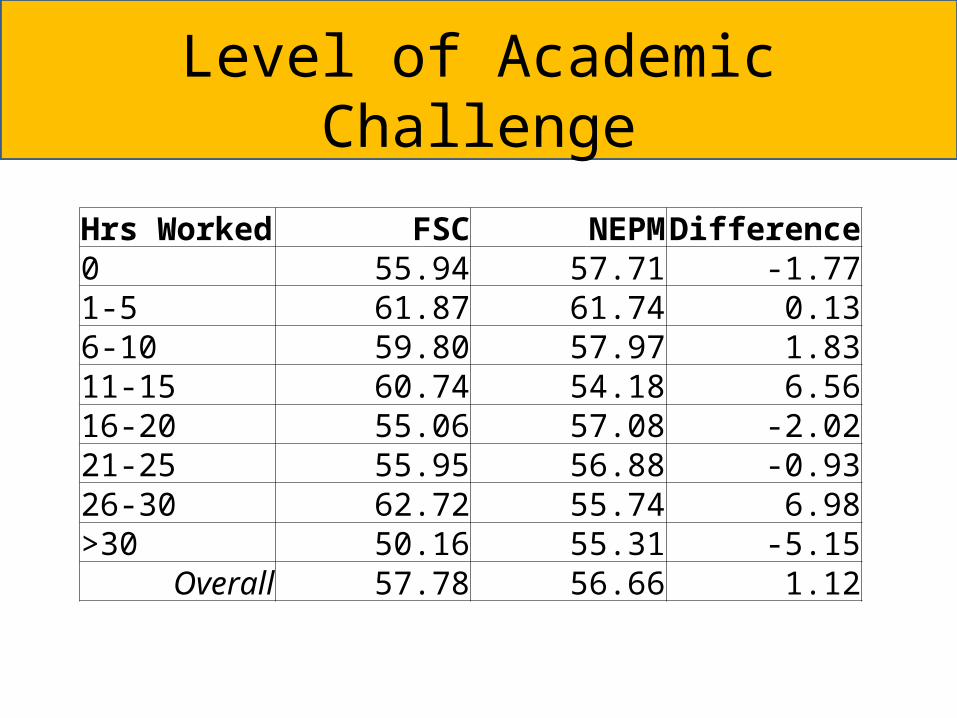
Level of Academic Challenge
Hrs Worked FSC NEPM Difference0 55.94 57.71 -1.771-5 61.87 61.74 0.136-10 59.80 57.97 1.8311-15 60.74 54.18 6.5616-20 55.06 57.08 -2.0221-25 55.95 56.88 -0.9326-30 62.72 55.74 6.98>30 50.16 55.31 -5.15
Overall 57.78 56.66 1.12
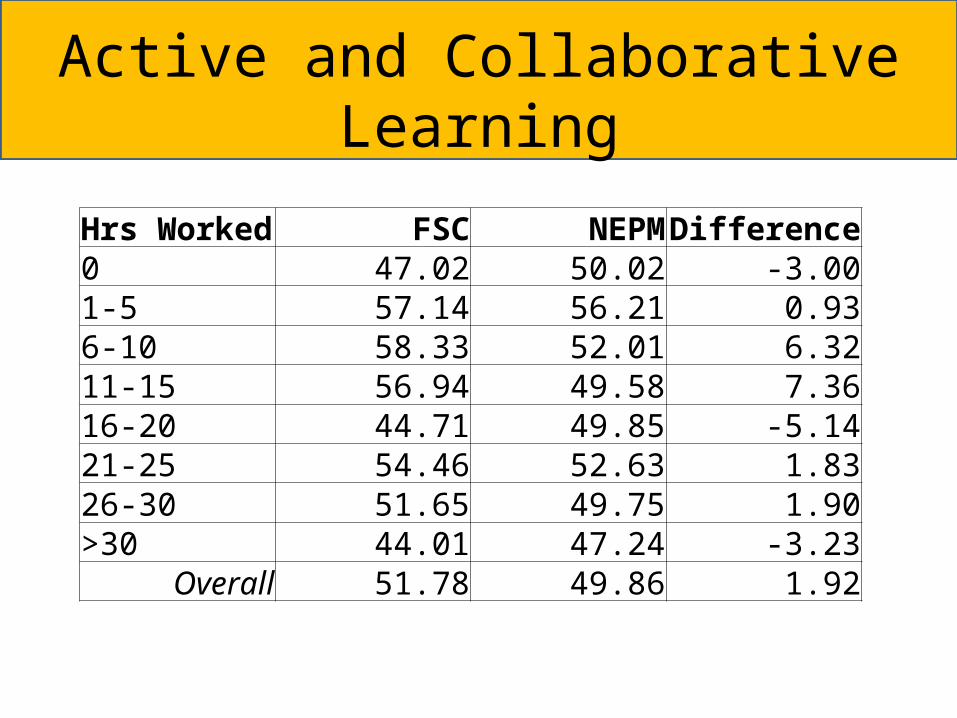
Active and Collaborative Learning
Hrs Worked FSC NEPM Difference0 47.02 50.02 -3.001-5 57.14 56.21 0.936-10 58.33 52.01 6.3211-15 56.94 49.58 7.3616-20 44.71 49.85 -5.1421-25 54.46 52.63 1.8326-30 51.65 49.75 1.90>30 44.01 47.24 -3.23
Overall 51.78 49.86 1.92
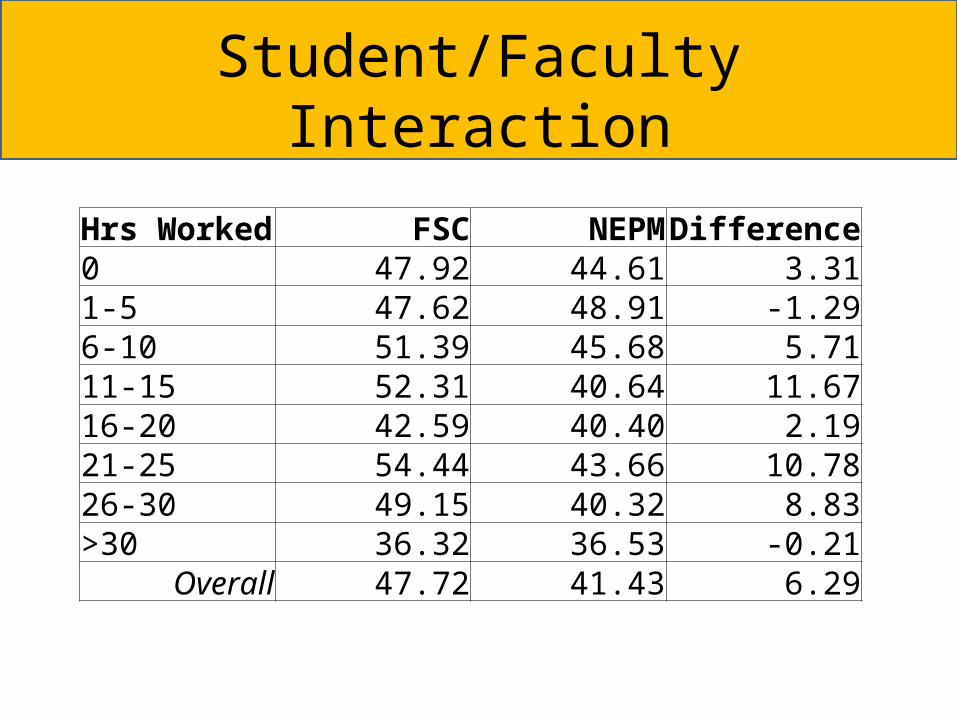
Student/Faculty Interaction
Hrs Worked FSC NEPM Difference0 47.92 44.61 3.311-5 47.62 48.91 -1.296-10 51.39 45.68 5.7111-15 52.31 40.64 11.6716-20 42.59 40.40 2.1921-25 54.44 43.66 10.7826-30 49.15 40.32 8.83>30 36.32 36.53 -0.21
Overall 47.72 41.43 6.29
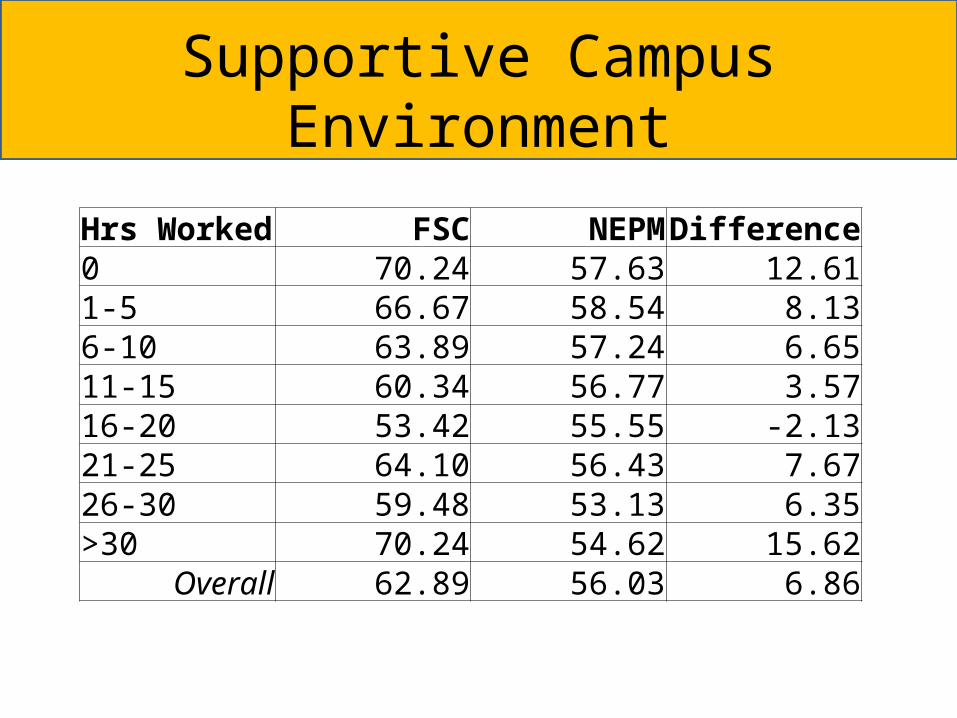
Supportive Campus Environment
Hrs Worked FSC NEPM Difference0 70.24 57.63 12.611-5 66.67 58.54 8.136-10 63.89 57.24 6.6511-15 60.34 56.77 3.5716-20 53.42 55.55 -2.1321-25 64.10 56.43 7.6726-30 59.48 53.13 6.35>30 70.24 54.62 15.62
Overall 62.89 56.03 6.86
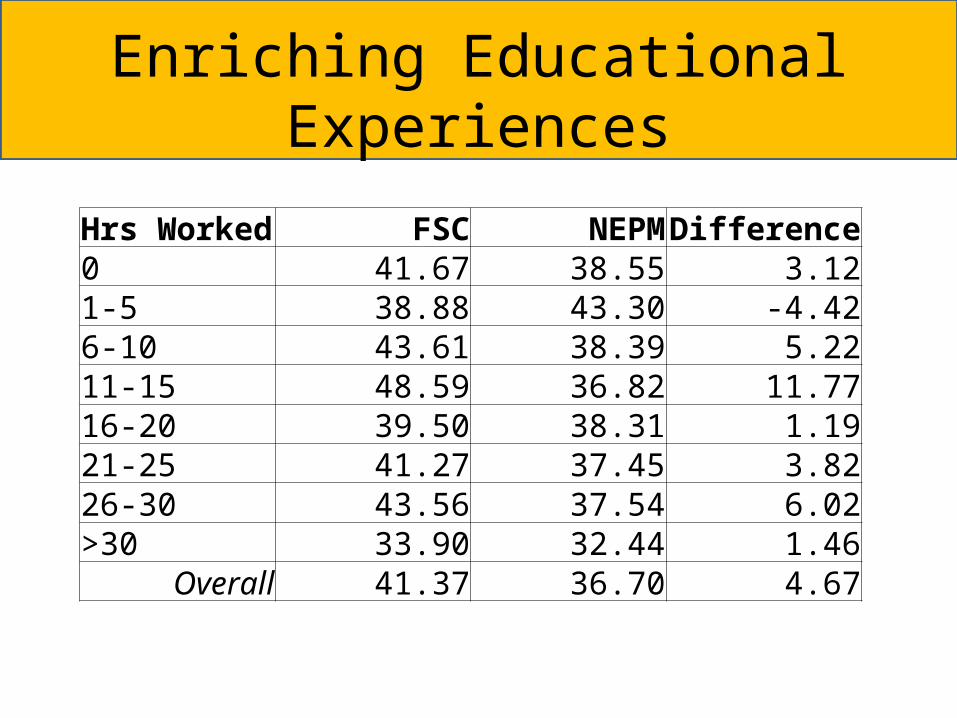
Enriching Educational Experiences
Hrs Worked FSC NEPM Difference0 41.67 38.55 3.121-5 38.88 43.30 -4.426-10 43.61 38.39 5.2211-15 48.59 36.82 11.7716-20 39.50 38.31 1.1921-25 41.27 37.45 3.8226-30 43.56 37.54 6.02>30 33.90 32.44 1.46
Overall 41.37 36.70 4.67
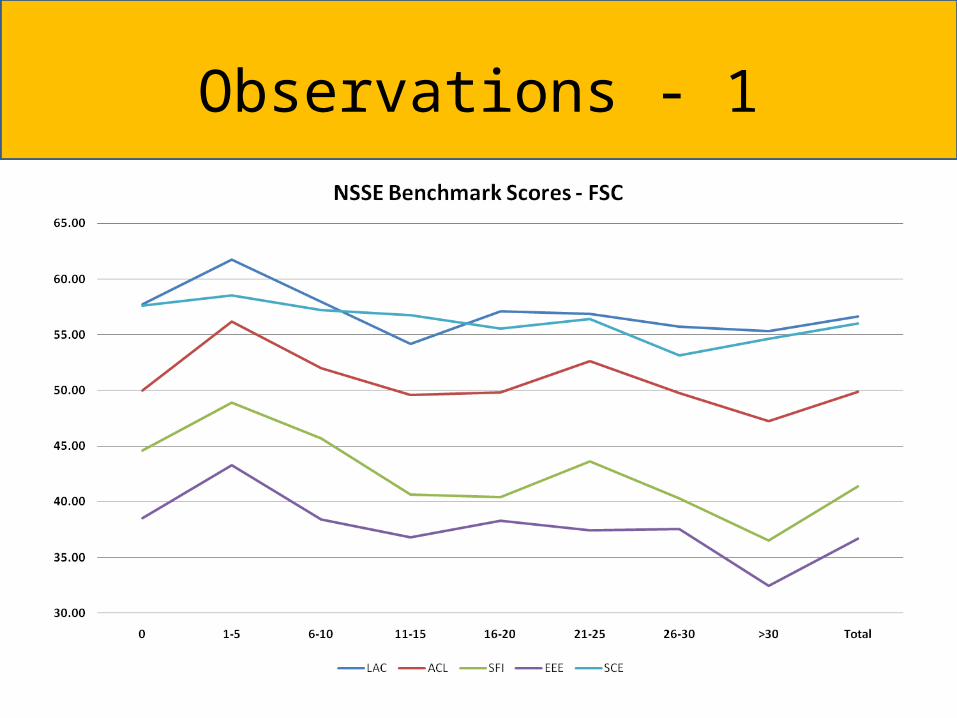
Observations - 1
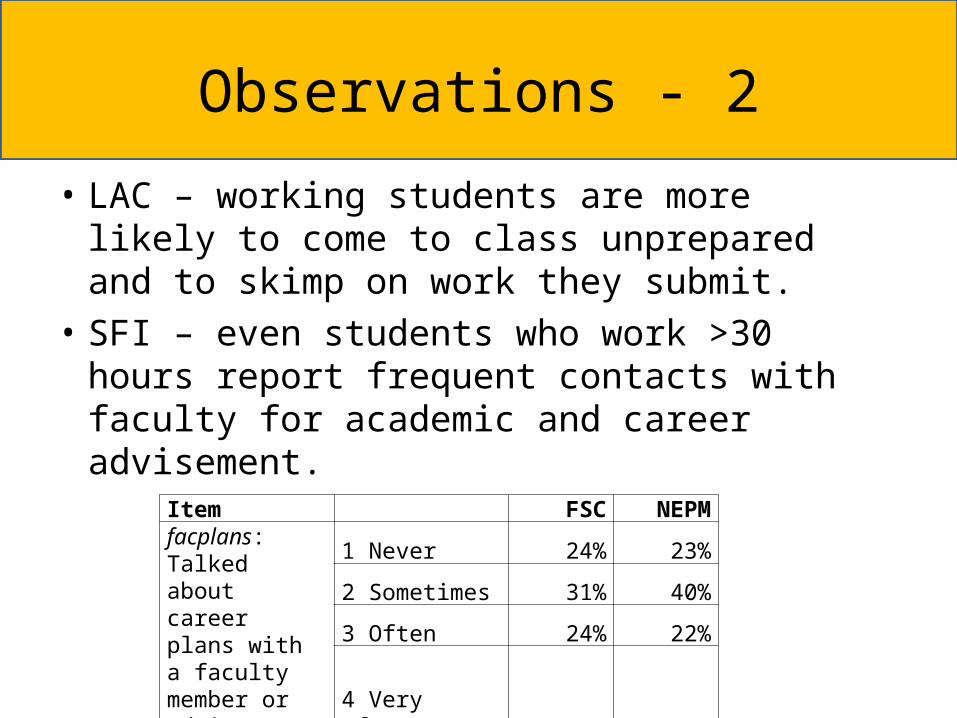
Observations - 2
• LAC – working students are more likely to come to class unprepared and to skimp on work they submit.
• SFI – even students who work >30 hours report frequent contacts with faculty for academic and career advisement.
Item FSC NEPMfacplans: Talked about career plans with a faculty member or advisor
1 Never 24% 23%
2 Sometimes 31% 40%
3 Often 24% 22%
4 Very often 21% 15%
Observations - 3
• SCE –FSC’s working students report more strongly favorable interactions with administrators than NEPM peers. They also place more faith in FSC’s support for their academic success, non-academic (e.g., life skill) success, and social success.
Observations - 4
• EEE – students working <20 hours are more likely than NEPM peers to be interns. They are much LESS likely to take foreign languages or study abroad.
Questions?