Embed Size (px)
Citation preview

Research Internship Report
prepared by
HADI
Supervisor: Prof Jinn-Guey Lay; Miss Rohan
Department of Geography, College of Science, National Taiwan University
A. Purpose
The purpose of this report is to document the tasks have been completed as of 24
July 2012 as instructed by Miss Rohan. This report is structured into four
sections: section B summarizes the tasks completed, section C elaborates in detail
the procedure in each task, section D presents the results of the analysis, and
finally section E concludes and gives recommendation for further analysis.
B. Summary
Major tasks accomplished include: (1) Conversion of land use vector model to
raster model; (2) Divide the land use map into two sub-study areas: the “basin”
subarea and the “SW1” (Southwest) subarea (see fig 1); (2) Map and calculate
land use change/transition for the two sub-study areas, for three periods
considered: year 1980-1995, 1995-2008, and 1980-2008; (3) Produce land use
change matrix in to show areas undergoing land cover change for each transition,
and percentage distribution of change from one land use category to other
categories; and (4) Map the urbanization, deforestation, and afforestation trend.
1 Named Southwest because it is in the SW part of Yang Ming Shan.
C. Methodology and Detail Procedure
All of the data processing and analysis was done using ArcGIS 10 and Ms Excel.
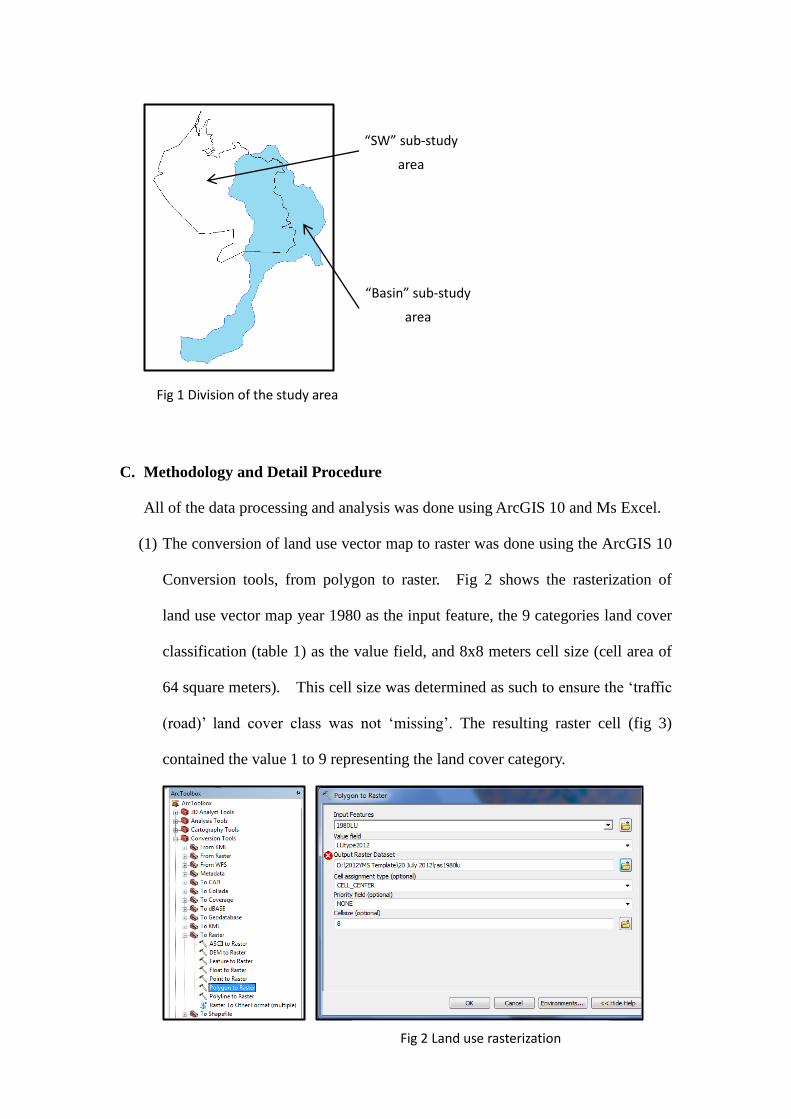
(1) The conversion of land use vector map to raster was done using the ArcGIS 10
Conversion tools, from polygon to raster. Fig 2 shows the rasterization of
land use vector map year 1980 as the input feature, the 9 categories land cover
classification (table 1) as the value field, and 8x8 meters cell size (cell area of
64 square meters). This cell size was determined as such to ensure the ‘traffic
(road)’ land cover class was not ‘missing’. The resulting raster cell (fig 3)
contained the value 1 to 9 representing the land cover category.
“SW” sub-study
area
“Basin” sub-study
area
Fig 2 Land use rasterization
Fig 1 Division of the study area
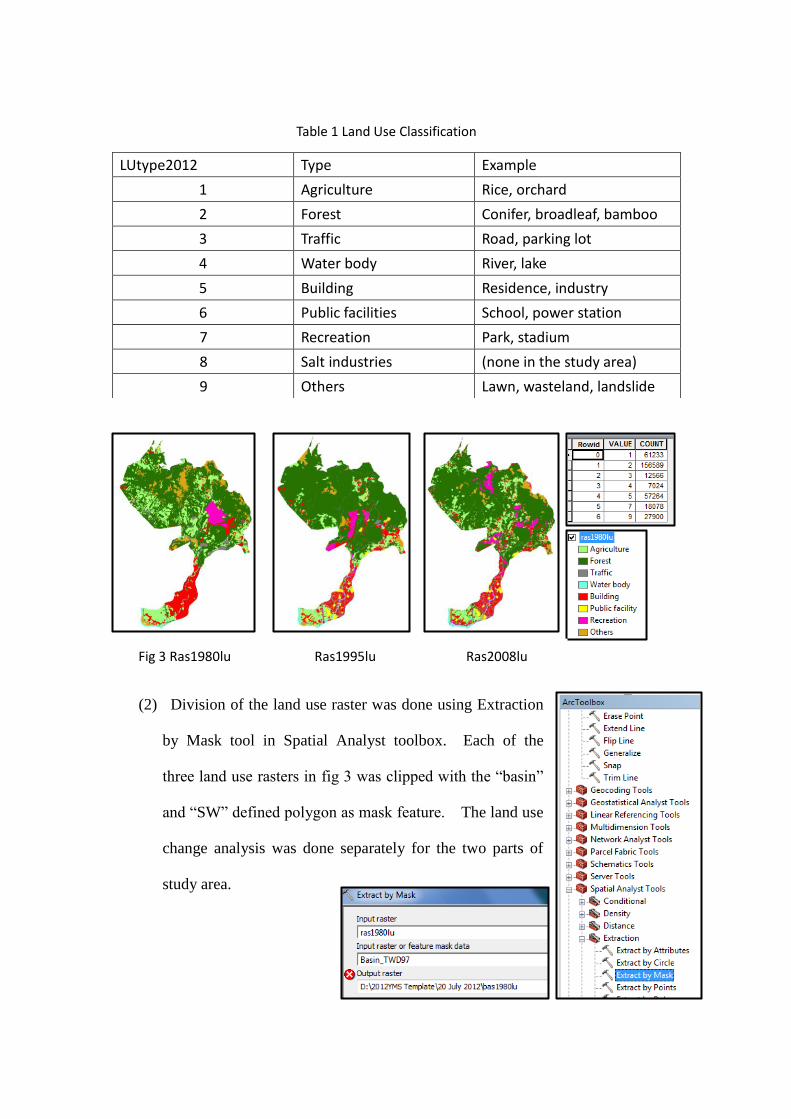
(2) Division of the land use raster was done using Extraction
by Mask tool in Spatial Analyst toolbox. Each of the
three land use rasters in fig 3 was clipped with the “basin”
and “SW” defined polygon as mask feature. The land use
change analysis was done separately for the two parts of
study area.
LUtype2012 Type Example
1 Agriculture Rice, orchard
2 Forest Conifer, broadleaf, bamboo
3 Traffic Road, parking lot
4 Water body River, lake
5 Building Residence, industry
6 Public facilities School, power station
7 Recreation Park, stadium
8 Salt industries (none in the study area)
9 Others Lawn, wasteland, landslide
Table 1 Land Use Classification
Fig 3 Ras1980lu Ras1995lu Ras2008lu
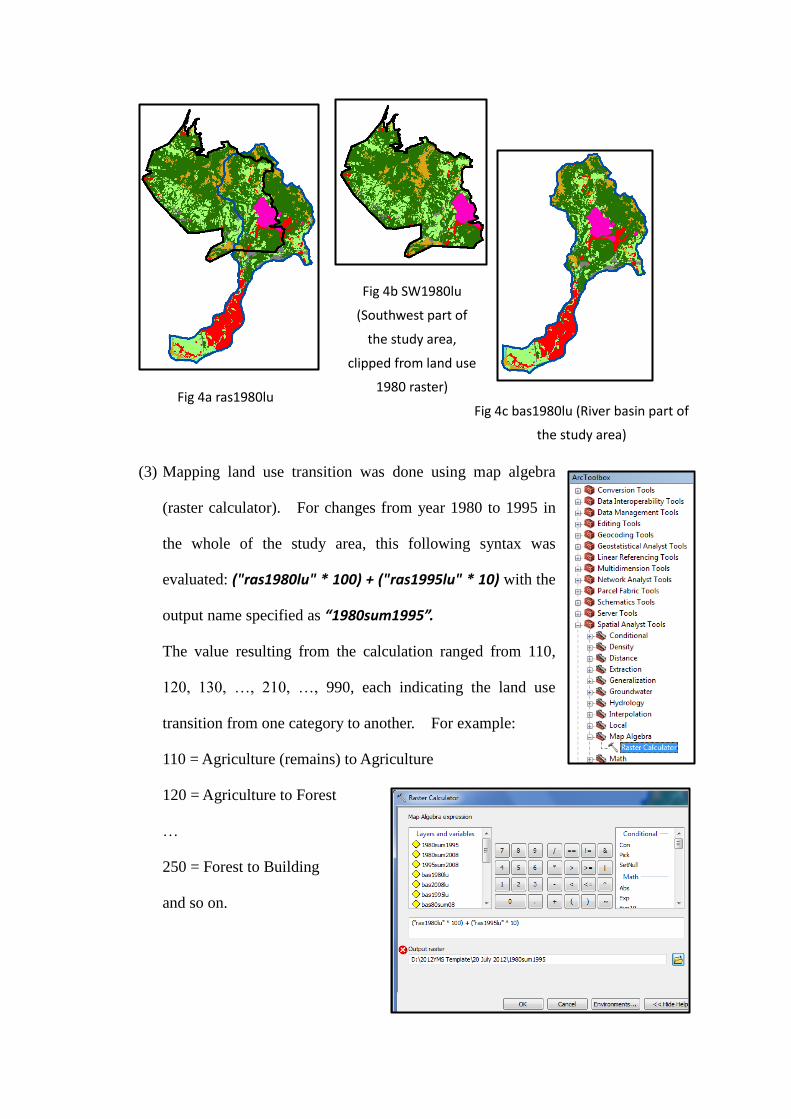
(3) Mapping land use transition was done using map algebra
(raster calculator). For changes from year 1980 to 1995 in
the whole of the study area, this following syntax was
evaluated: ("ras1980lu" * 100) + ("ras1995lu" * 10) with the
output name specified as “1980sum1995”.
The value resulting from the calculation ranged from 110,
120, 130, …, 210, …, 990, each indicating the land use
transition from one category to another. For example:
110 = Agriculture (remains) to Agriculture
120 = Agriculture to Forest
…
250 = Forest to Building
and so on.
Fig 4a ras1980lu
Fig 4b SW1980lu
(Southwest part of
the study area,
clipped from land use
1980 raster)
Fig 4c bas1980lu (River basin part of
the study area)
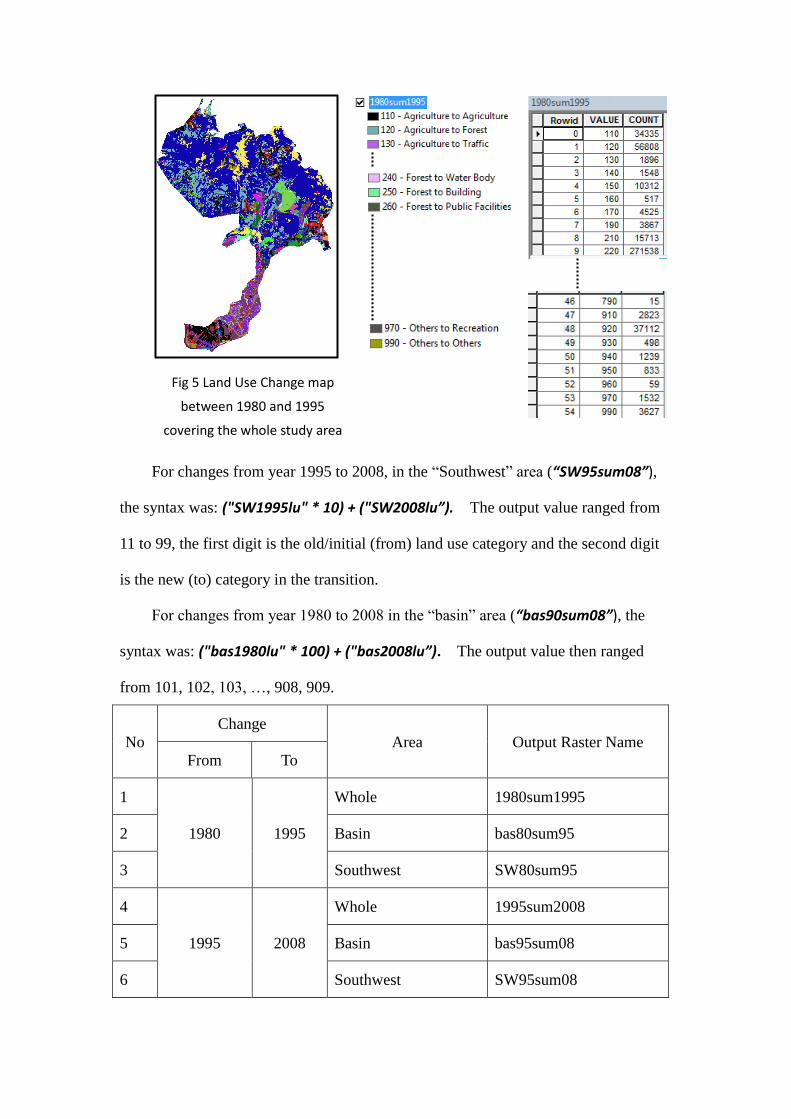
For changes from year 1995 to 2008, in the “Southwest” area (“SW95sum08”),
the syntax was: ("SW1995lu" * 10) + ("SW2008lu”). The output value ranged from
11 to 99, the first digit is the old/initial (from) land use category and the second digit
is the new (to) category in the transition.
For changes from year 1980 to 2008 in the “basin” area (“bas90sum08”), the
syntax was: ("bas1980lu" * 100) + ("bas2008lu”). The output value then ranged
from 101, 102, 103, …, 908, 909.
No
Change
Area Output Raster Name
From To
1
1980 1995
Whole 1980sum1995
2 Basin bas80sum95
3 Southwest SW80sum95
4
1995 2008
Whole 1995sum2008
5 Basin bas95sum08
6 Southwest SW95sum08
Fig 5 Land Use Change map
between 1980 and 1995
covering the whole study area
7
1980 2008
Whole 1980sum2008
8 Basin bas80sum08
9 Southwest SW80sum08
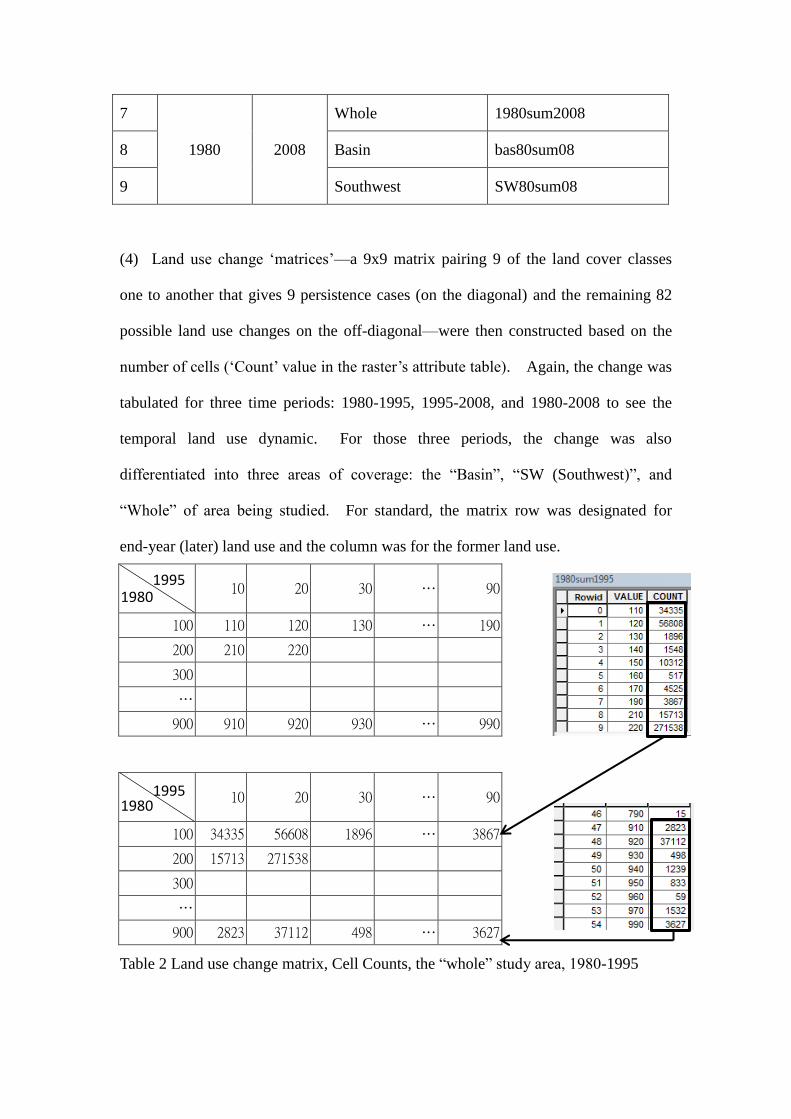
(4) Land use change ‘matrices’—a 9x9 matrix pairing 9 of the land cover classes
one to another that gives 9 persistence cases (on the diagonal) and the remaining 82
possible land use changes on the off-diagonal—were then constructed based on the
number of cells (‘Count’ value in the raster’s attribute table). Again, the change was
tabulated for three time periods: 1980-1995, 1995-2008, and 1980-2008 to see the
temporal land use dynamic. For those three periods, the change was also
differentiated into three areas of coverage: the “Basin”, “SW (Southwest)”, and
“Whole” of area being studied. For standard, the matrix row was designated for
end-year (later) land use and the column was for the former land use.
10 20 30 … 90
100 110 120 130 … 190
200 210 220
300
…
900 910 920 930 … 990
10 20 30 … 90
100 34335 56608 1896 … 3867
200 15713 271538
300
…
900 2823 37112 498 … 3627
Table 2 Land use change matrix, Cell Counts, the “whole” study area, 1980-1995
1995 1980
1980 1995

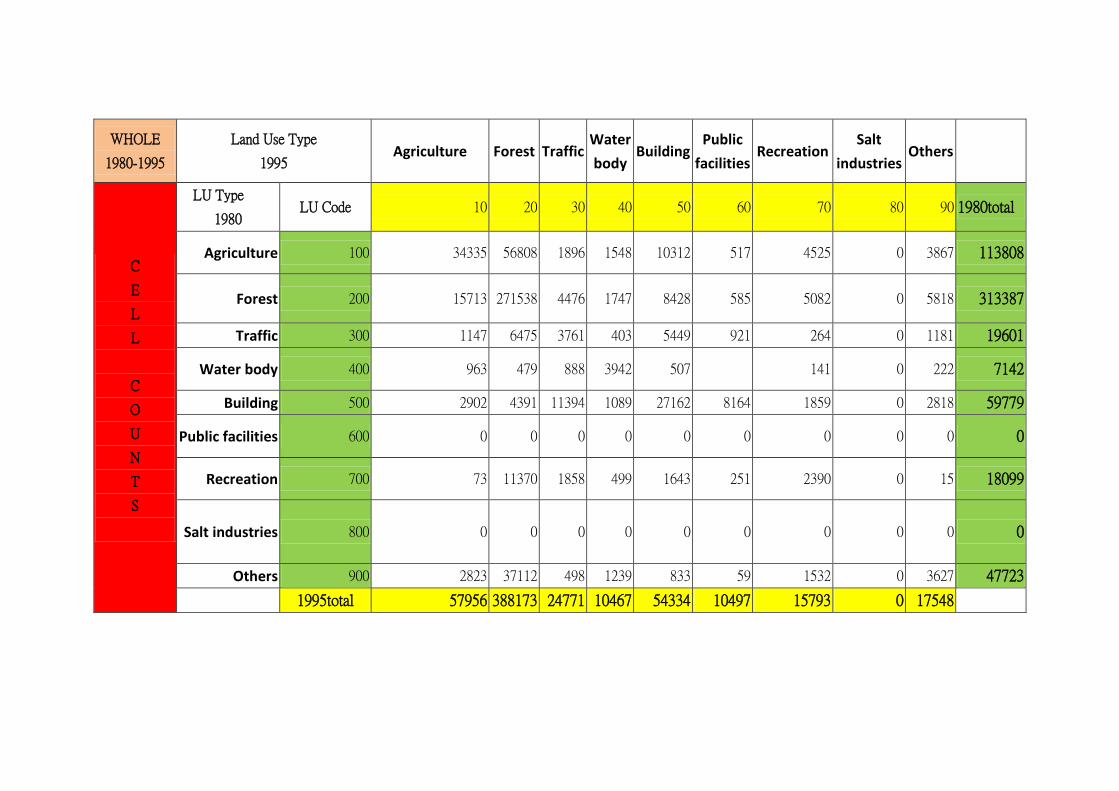
From cell counts, area of change was calculated by simply multiplying the count
value with the cell size, which is 0.000064 sq km. In table 2, area of cell ‘110’
(agriculture remains agriculture) is (34335 x 0.000064) = 2.19744 sq km. The
distribution of change was also broken down as percentage area (proportion) of a land
use type that converted to each of the other 8 land use types. In table 2, for row
‘100’, % Area of cell ‘110’ is (2.19744 / 7.2837122) x 100. The full land use change
tables and matrices was presented in section D.
(5) Mapping urbanization, deforestation, and afforestation. This task was easily
done again with the help of raster calculator. Here, urbanization was defined as land
use change from non-urban-classified to urban-classified, with urban land use
includes3 traffic (land use code 3), building (5), public facilities (6), and recreation
(7). To make it easier, the land use map was reclassified into ‘urban’ and ‘non-urban’
using ‘Reclassify’ tool in Spatial Analyst. Urban land use types (3, 5, 6, and 7) were
2 Total area of agriculture land use in 1980, see table 3.
3 There may be different definition of urbanisation, and hence different classification of land use
types into urban areas.
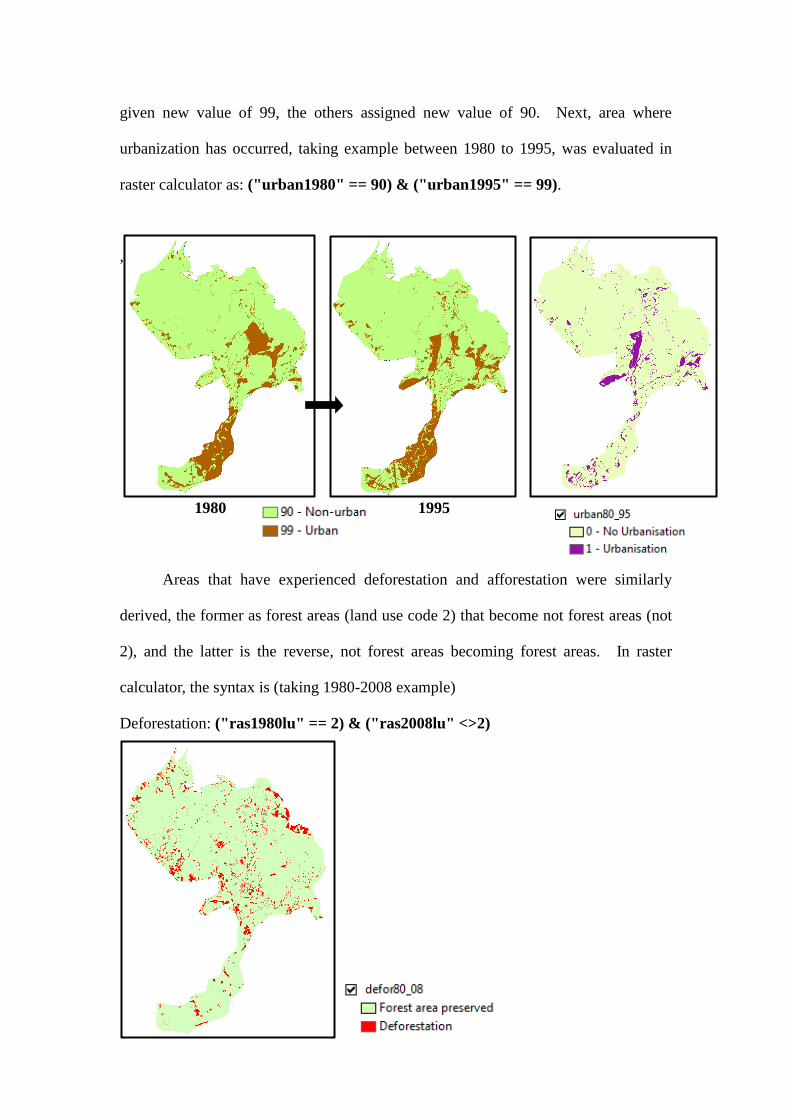
given new value of 99, the others assigned new value of 90. Next, area where
urbanization has occurred, taking example between 1980 to 1995, was evaluated in
raster calculator as: ("urban1980" == 90) & ("urban1995" == 99).
,
1980 1995
Areas that have experienced deforestation and afforestation were similarly
derived, the former as forest areas (land use code 2) that become not forest areas (not
2), and the latter is the reverse, not forest areas becoming forest areas. In raster
calculator, the syntax is (taking 1980-2008 example)
Deforestation: ("ras1980lu" == 2) & ("ras2008lu" <>2)

Afforestation: ("ras1980lu" <>2) & ("ras2008lu" == 2)
D. Results and Preliminary Discussion
(1) Land use change in the “WHOLE” (“Basin” and “SW” combined) of
study area.
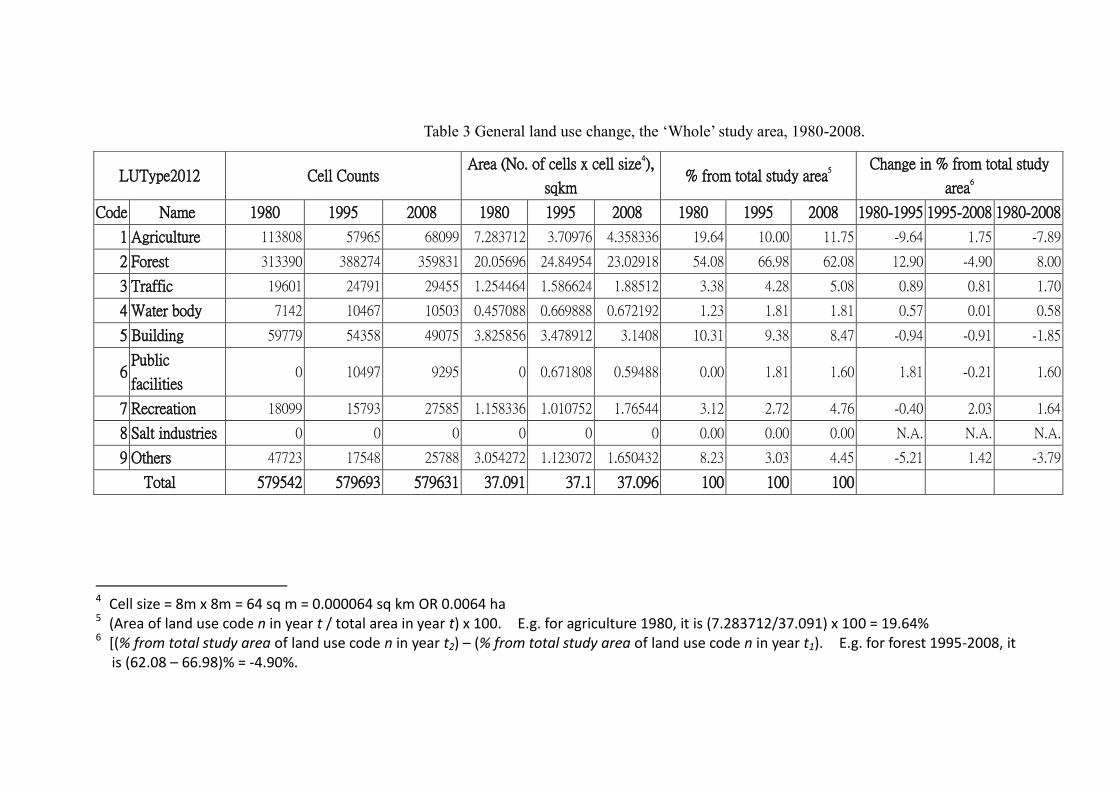
Table 3 General land use change, the ‘Whole’ study area, 1980-2008.
4 Cell size = 8m x 8m = 64 sq m = 0.000064 sq km OR 0.0064 ha 5 (Area of land use code n in year t / total area in year t) x 100. E.g. for agriculture 1980, it is (7.283712/37.091) x 100 = 19.64% 6 [(% from total study area of land use code n in year t2) – (% from total study area of land use code n in year t1). E.g. for forest 1995-2008, it
is (62.08 – 66.98)% = -4.90%.
LUType2012 Cell Counts Area (No. of cells x cell size4),
sqkm % from total study area5
Change in % from total study
area6
Code Name 1980 1995 2008 1980 1995 2008 1980 1995 2008 1980-1995 1995-2008 1980-2008
1 Agriculture 113808 57965 68099 7.283712 3.70976 4.358336 19.64 10.00 11.75 -9.64 1.75 -7.89
2 Forest 313390 388274 359831 20.05696 24.84954 23.02918 54.08 66.98 62.08 12.90 -4.90 8.00
3 Traffic 19601 24791 29455 1.254464 1.586624 1.88512 3.38 4.28 5.08 0.89 0.81 1.70
4 Water body 7142 10467 10503 0.457088 0.669888 0.672192 1.23 1.81 1.81 0.57 0.01 0.58
5 Building 59779 54358 49075 3.825856 3.478912 3.1408 10.31 9.38 8.47 -0.94 -0.91 -1.85
6 Public
facilities 0 10497 9295 0 0.671808 0.59488 0.00 1.81 1.60 1.81 -0.21 1.60
7 Recreation 18099 15793 27585 1.158336 1.010752 1.76544 3.12 2.72 4.76 -0.40 2.03 1.64
8 Salt industries 0 0 0 0 0 0 0.00 0.00 0.00 N.A. N.A. N.A.
9 Others 47723 17548 25788 3.054272 1.123072 1.650432 8.23 3.03 4.45 -5.21 1.42 -3.79
Total 579542 579693 579631 37.091 37.1 37.096 100 100 100
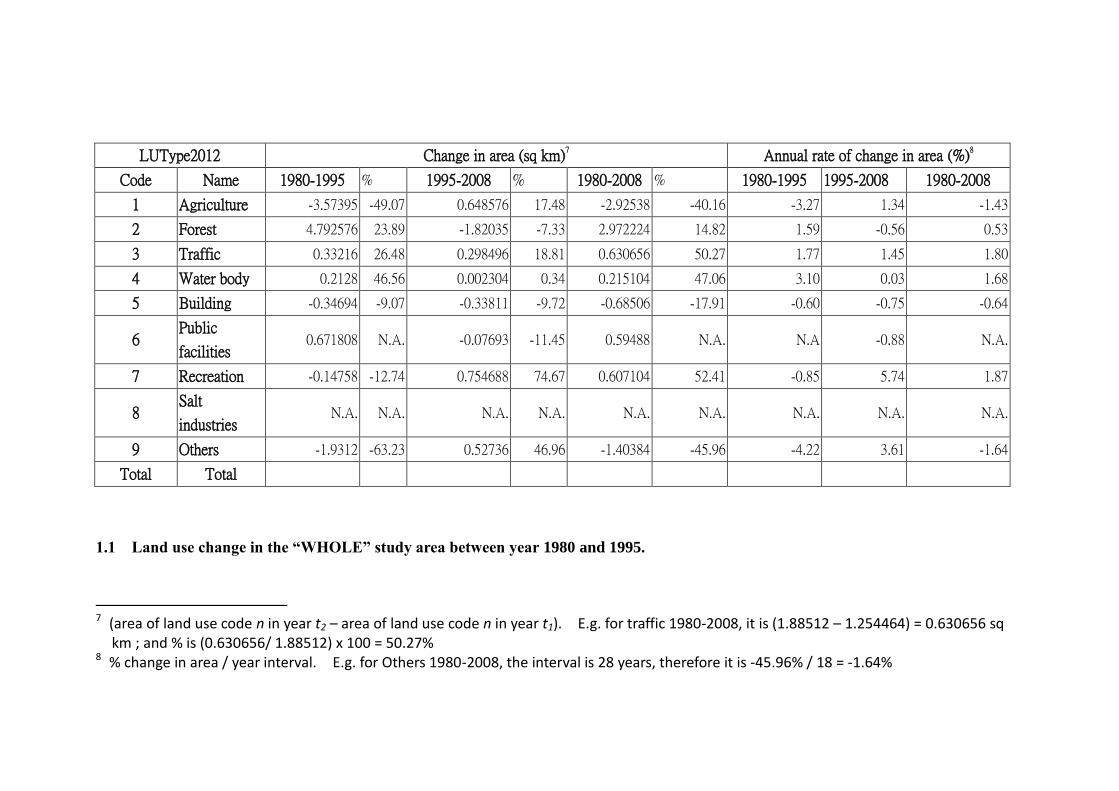
LUType2012 Change in area (sq km)7 Annual rate of change in area (%)8
Code Name 1980-1995 % 1995-2008 % 1980-2008 % 1980-1995 1995-2008 1980-2008
1 Agriculture -3.57395 -49.07 0.648576 17.48 -2.92538 -40.16 -3.27 1.34 -1.43
2 Forest 4.792576 23.89 -1.82035 -7.33 2.972224 14.82 1.59 -0.56 0.53
3 Traffic 0.33216 26.48 0.298496 18.81 0.630656 50.27 1.77 1.45 1.80
4 Water body 0.2128 46.56 0.002304 0.34 0.215104 47.06 3.10 0.03 1.68
5 Building -0.34694 -9.07 -0.33811 -9.72 -0.68506 -17.91 -0.60 -0.75 -0.64
6 Public
facilities 0.671808 N.A. -0.07693 -11.45 0.59488 N.A. N.A -0.88 N.A.
7 Recreation -0.14758 -12.74 0.754688 74.67 0.607104 52.41 -0.85 5.74 1.87
8 Salt
industries N.A. N.A. N.A. N.A. N.A. N.A. N.A. N.A. N.A.
9 Others -1.9312 -63.23 0.52736 46.96 -1.40384 -45.96 -4.22 3.61 -1.64
Total Total
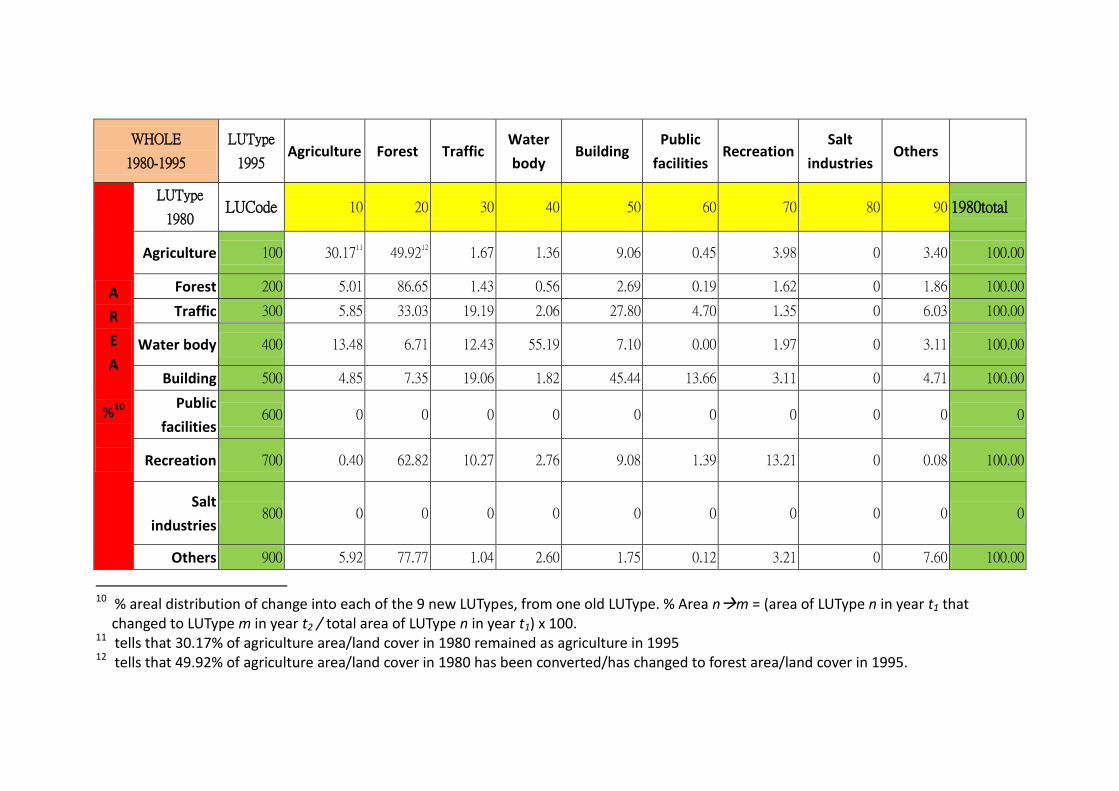
1.1 Land use change in the “WHOLE” study area between year 1980 and 1995.
7 (area of land use code n in year t2 – area of land use code n in year t1). E.g. for traffic 1980-2008, it is (1.88512 – 1.254464) = 0.630656 sq
km ; and % is (0.630656/ 1.88512) x 100 = 50.27% 8 % change in area / year interval. E.g. for Others 1980-2008, the interval is 28 years, therefore it is -45.96% / 18 = -1.64%
WHOLE
1980-1995
Land Use Type
1995 Agriculture Forest Traffic
Water
body Building
Public
facilities Recreation
Salt
industries Others
C
E
L
L
C
O
U
N
T
S
LU Type
1980 LU Code 10 20 30 40 50 60 70 80 90 1980total
Agriculture 100 34335 56808 1896 1548 10312 517 4525 0 3867 113808
Forest 200 15713 271538 4476 1747 8428 585 5082 0 5818 313387
Traffic 300 1147 6475 3761 403 5449 921 264 0 1181 19601
Water body 400 963 479 888 3942 507 141 0 222 7142
Building 500 2902 4391 11394 1089 27162 8164 1859 0 2818 59779
Public facilities 600 0 0 0 0 0 0 0 0 0 0
Recreation 700 73 11370 1858 499 1643 251 2390 0 15 18099
Salt industries 800 0 0 0 0 0 0 0 0 0 0
Others 900 2823 37112 498 1239 833 59 1532 0 3627 47723
1995total 57956 388173 24771 10467 54334 10497 15793 0 17548

WHOLE
1980-1995
LUType
1995 Agriculture Forest Traffic
Water
body Building
Public
facilities Recreation
Salt
industries Others
A
R
E
A
S
Q
K
M9
LUType
1980 LUCode 10 20 30 40 50 60 70 80 90 1980total
Agriculture 100 2.19744 3.63571 0.12134 0.09907 0.65997 0.03309 0.28960 0 0.24749 7.28371
Forest 200 1.00563 17.37843 0.28646 0.11181 0.53939 0.03744 0.32525 0 0.37235 20.05677
Traffic 300 0.07341 0.41440 0.24070 0.02579 0.34874 0.05894 0.01690 0 0.07558 1.25446
Water body 400 0.06163 0.03066 0.05683 0.25229 0.03245 0.00000 0.00902 0 0.01421 0.45709
Building 500 0.18573 0.28102 0.72922 0.06970 1.73837 0.52250 0.11898 0 0.18035 3.82586
Public
facilities 600 0 0 0 0 0 0 0 0 0.00000 0.00000
Recreation 700 0.00467 0.72768 0.11891 0.03194 0.10515 0.01606 0.15296 0 0.00096 1.15834
Salt
industries 800 0 0 0 0 0 0 0 0 0 0
Others 900 0.18067 2.37517 0.03187 0.07930 0.05331 0.00378 0.09805 0 0.23213 3.05427
1995total 3.70918 24.84307 1.58534 0.66989 3.47738 0.67181 1.01075 0 1.12307
9 (Cell Counts) x 0.000064 sq km.
WHOLE
1980-1995
LUType
1995 Agriculture Forest Traffic
Water
body Building
Public
facilities Recreation
Salt
industries Others
A
R
E
A
%10
LUType
1980 LUCode 10 20 30 40 50 60 70 80 90 1980total
Agriculture 100 30.1711 49.92
12 1.67 1.36 9.06 0.45 3.98 0 3.40 100.00
Forest 200 5.01 86.65 1.43 0.56 2.69 0.19 1.62 0 1.86 100.00
Traffic 300 5.85 33.03 19.19 2.06 27.80 4.70 1.35 0 6.03 100.00
Water body 400 13.48 6.71 12.43 55.19 7.10 0.00 1.97 0 3.11 100.00
Building 500 4.85 7.35 19.06 1.82 45.44 13.66 3.11 0 4.71 100.00
Public
facilities 600 0 0 0 0 0 0 0 0 0 0
Recreation 700 0.40 62.82 10.27 2.76 9.08 1.39 13.21 0 0.08 100.00
Salt
industries 800 0 0 0 0 0 0 0 0 0 0
Others 900 5.92 77.77 1.04 2.60 1.75 0.12 3.21 0 7.60 100.00
10 % areal distribution of change into each of the 9 new LUTypes, from one old LUType. % Area nm = (area of LUType n in year t1 that
changed to LUType m in year t2 / total area of LUType n in year t1) x 100. 11 tells that 30.17% of agriculture area/land cover in 1980 remained as agriculture in 1995 12 tells that 49.92% of agriculture area/land cover in 1980 has been converted/has changed to forest area/land cover in 1995.
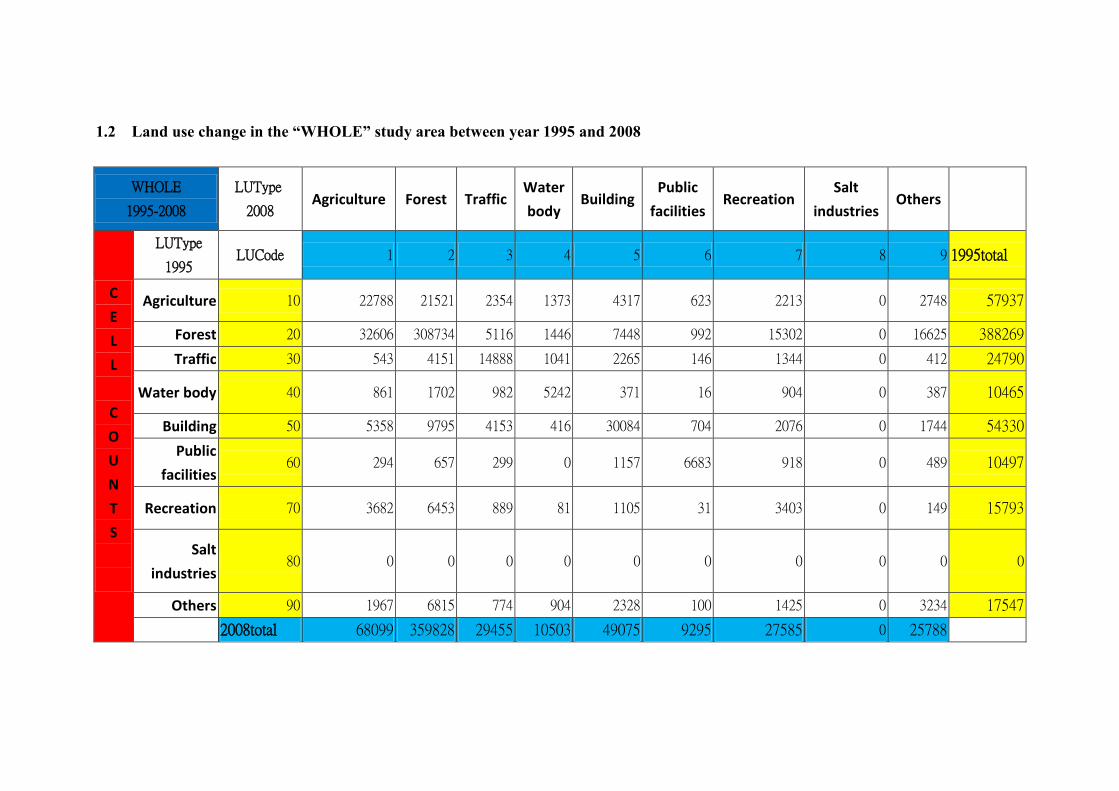
1.2 Land use change in the “WHOLE” study area between year 1995 and 2008
WHOLE
1995-2008
LUType
2008 Agriculture Forest Traffic
Water
body Building
Public
facilities Recreation
Salt
industries Others
C
E
L
L
C
O
U
N
T
S
LUType
1995 LUCode 1 2 3 4 5 6 7 8 9 1995total
Agriculture 10 22788 21521 2354 1373 4317 623 2213 0 2748 57937
Forest 20 32606 308734 5116 1446 7448 992 15302 0 16625 388269
Traffic 30 543 4151 14888 1041 2265 146 1344 0 412 24790
Water body 40 861 1702 982 5242 371 16 904 0 387 10465
Building 50 5358 9795 4153 416 30084 704 2076 0 1744 54330
Public
facilities 60 294 657 299 0 1157 6683 918 0 489 10497
Recreation 70 3682 6453 889 81 1105 31 3403 0 149 15793
Salt
industries 80 0 0 0 0 0 0 0 0 0 0
Others 90 1967 6815 774 904 2328 100 1425 0 3234 17547
2008total 68099 359828 29455 10503 49075 9295 27585 0 25788

WHOLE
1995-2008
LUType
2008 Agriculture Forest Traffic
Water
body Building
Public
facilities Recreation
Salt
industries Others
A
R
E
A
S
Q
K
M
LUType
1995 LUCode 1 2 3 4 5 6 7 8 9 1995total
Agriculture 10 1.45843 1.37734 0.15066 0.08787 0.27629 0.03987 0.14163 0 0.17587 3.70797
Forest 20 2.08678 19.75898 0.32742 0.09254 0.47667 0.06349 0.97933 0 1.06400 24.84922
Traffic 30 0.03475 0.26566 0.95283 0.06662 0.14496 0.00934 0.08602 0 0.02637 1.58656
Water body 40 0.05510 0.10893 0.06285 0.33549 0.02374 0.00102 0.05786 0 0.02477 0.66976
Building 50 0.34291 0.62688 0.26579 0.02662 1.92538 0.04506 0.13286 0 0.11162 3.47712
Public
facilities 60 0.01882 0.04205 0.01914 0 0.07405 0.42771 0.05875 0 0.03130 0.67181
Recreation 70 0.23565 0.41299 0.05690 0.00518 0.07072 0.00198 0.21779 0 0.00954 1.01075
Salt
industries 80 0 0 0 0 0 0 0 0 0 0
Others 90 0.12589 0.43616 0.04954 0.05786 0.14899 0.00640 0.09120 0 0.20698 1.12301
2008total 4.35834 23.02899 1.88512 0.67219 3.14080 0.59488 1.76544 0 1.65043

WHOLE
1995-2008
LUType
2008 Agriculture Forest Traffic
Water
body Building
Public
facilities Recreation
Salt
industries Others
%
A
R
E
A
LUType
1995 LUCode 1 2 3 4 5 6 7 8 9 1995total
Agriculture 10 39.33 37.15 4.06 2.37 7.45 1.08 3.82 0 4.74 100.00
Forest 20 8.40 79.52 1.32 0.37 1.92 0.26 3.94 0 4.28 100.00
Traffic 30 2.19 16.74 60.06 4.20 9.14 0.59 5.42 0 1.66 100.00
Water body 40 8.23 16.26 9.38 50.09 3.55 0.15 8.64 0 3.70 100.00
Building 50 9.86 18.03 7.64 0.77 55.37 1.30 3.82 0 3.21 100.00
Public
facilities 60 2.80 6.26 2.85 0.00 11.02 63.67 8.75 0 4.66 100.00
Recreation 70 23.31 40.86 5.63 0.51 7.00 0.20 21.55 0 0.94 100.00
Salt
industries 80 0 0 0 0 0 0 0 0 0 0
Others 90 11.21 38.84 4.41 5.15 13.27 0.57 8.12 0 18.43 100.00

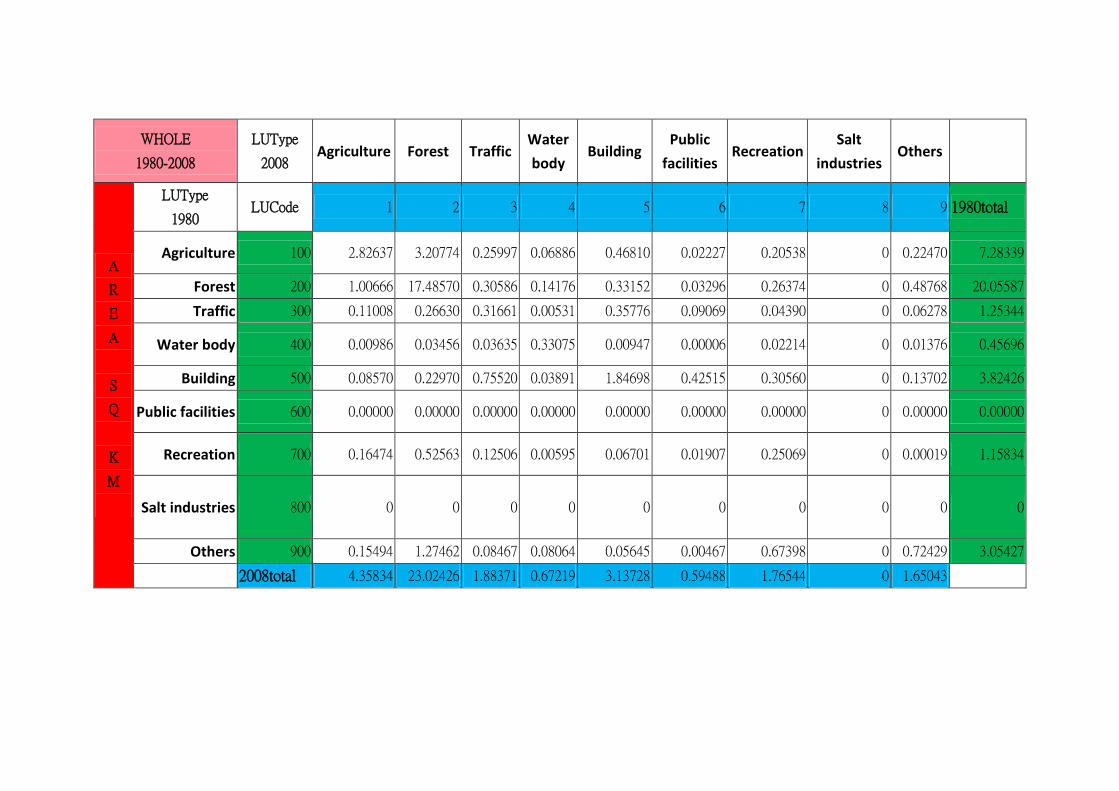
1.3 Land use change in the “WHOLE” study area between year 1980 and 2008.
WHOLE
1980-2008
LUType
2008 Agriculture Forest Traffic
Water
body Building
Public
facilities Recreation
Salt
industries Others
C
E
L
L
C
O
U
N
T
S
LUType
1980 LUCode 1 2 3 4 5 6 7 8 9 1980total
Agriculture 100 44162 50121 4062 1076 7314 348 3209 0 3511 113803
Forest 200 15729 273214 4779 2215 5180 515 4121 0 7620 313373
Traffic 300 1720 4161 4947 83 5590 1417 686 0 981 19585
Water body 400 154 540 568 5168 148 1 346 0 215 7140
Building 500 1339 3589 11800 608 28859 6643 4775 0 2141 59754
Public facilities 600 0 0 0 0 0 0 0 0 0 0
Recreation 700 2574 8213 1954 93 1047 298 3917 0 3 18099
Salt industries 800 0 0 0 0 0 0 0 0 0 0
Others 900 2421 19916 1323 1260 882 73 10531 0 11317 47723
2008total 68099 359754 29433 10503 49020 9295 27585 0 25788
WHOLE
1980-2008
LUType
2008 Agriculture Forest Traffic
Water
body Building
Public
facilities Recreation
Salt
industries Others
A
R
E
A
S
Q
K
M
LUType
1980 LUCode 1 2 3 4 5 6 7 8 9 1980total
Agriculture 100 2.82637 3.20774 0.25997 0.06886 0.46810 0.02227 0.20538 0 0.22470 7.28339
Forest 200 1.00666 17.48570 0.30586 0.14176 0.33152 0.03296 0.26374 0 0.48768 20.05587
Traffic 300 0.11008 0.26630 0.31661 0.00531 0.35776 0.09069 0.04390 0 0.06278 1.25344
Water body 400 0.00986 0.03456 0.03635 0.33075 0.00947 0.00006 0.02214 0 0.01376 0.45696
Building 500 0.08570 0.22970 0.75520 0.03891 1.84698 0.42515 0.30560 0 0.13702 3.82426
Public facilities 600 0.00000 0.00000 0.00000 0.00000 0.00000 0.00000 0.00000 0 0.00000 0.00000
Recreation 700 0.16474 0.52563 0.12506 0.00595 0.06701 0.01907 0.25069 0 0.00019 1.15834
Salt industries 800 0 0 0 0 0 0 0 0 0 0
Others 900 0.15494 1.27462 0.08467 0.08064 0.05645 0.00467 0.67398 0 0.72429 3.05427
2008total 4.35834 23.02426 1.88371 0.67219 3.13728 0.59488 1.76544 0 1.65043

WHOLE
1980-2008
LUType
2008 Agriculture Forest Traffic
Water
body Building
Public
facilities Recreation
Salt
industri
es
Others
%
A
R
E
A
LUType
1980 LUCode 1 2 3 4 5 6 7 8 9 1980total
Agriculture 100 38.81 44.04 3.57 0.95 6.43 0.31 2.82 0 3.09 100.00
Forest 200 5.02 87.18 1.53 0.71 1.65 0.16 1.32 0 2.43 100.00
Traffic 300 8.78 21.25 25.26 0.42 28.54 7.24 3.50 0 5.01 100.00
Water
body 400 2.16 7.56 7.96 72.38 2.07 0.01 4.85 0 3.01 100.00
Building 500 2.24 6.01 19.75 1.02 48.30 11.12 7.99 0 3.58 100.00
Public
facilities 600 0 0 0 0 0 0 0 0 0 0
Recreation 700 14.22 45.38 10.80 0.51 5.78 1.65 21.64 0 0.02 100.00
Salt
industries 800 0 0 0 0 0 0 0 0 0 0
Others 900 5.07 41.73 2.77 2.64 1.85 0.15 22.07 0 23.71 100.0

(2) Land use change in ‘BASIN’ sub-study area.
LUType2012 Cell Counts Area (ha) % from total study area Change in % from total study
area
Code Name 1980 1995 2008 1980 1995 2008 1980 1995 2008 1980-1995 1995-2008 1980-2008
1 Agriculture 61233 45050 40964 391.89 288.32 262.17 17.98 13.22 12.03 -4.75 -1.20 -5.95
2 Forest 156589 189638 175873 1002.17 1213.68 1125.59 45.97 55.67 51.64 9.70 -4.03 5.67
3 Traffic 12566 22221 24633 80.42 142.21 157.65 3.69 6.52 7.23 2.83 0.71 3.54
4 Water body 7024 9229 9181 44.95 59.07 58.76 2.06 2.71 2.70 0.65 -0.01 0.63
5 Building 57264 45927 42394 366.49 293.93 271.32 16.81 13.48 12.45 -3.33 -1.03 -4.36
6 Public
facilities 0 10397 8656 0.00 66.54 55.40 0.00 3.05 2.54 3.05 -0.51 2.54
7 Recreation 18078 10623 19229 115.70 67.99 123.07 5.31 3.12 5.65 -2.19 2.53 0.34
8 Salt industries 0 0 0 N.A. N.A. N.A. 0.00 0.00 0.00 N.A. N.A. N.A.
9 Others 27900 7566 19660 178.56 48.42 125.82 8.19 2.22 5.77 -5.97 3.55 -2.42
Total 340654 340651 340590 2180.19 2180.17 2179.78 100 100 100
In the basin part of the study area, the three dominant land use types are, from the largest in terms of area, forest (45.97% of the basin area
in 1980), agriculture (17.98% in 1980) and building (16.81% in 1980), and they were still dominant in 2008. A trend of decreasing in area was
observable for agriculture, and, interestingly, building land cover. Agriculture area covered 17.98% of the total basin area in 1980, decreased
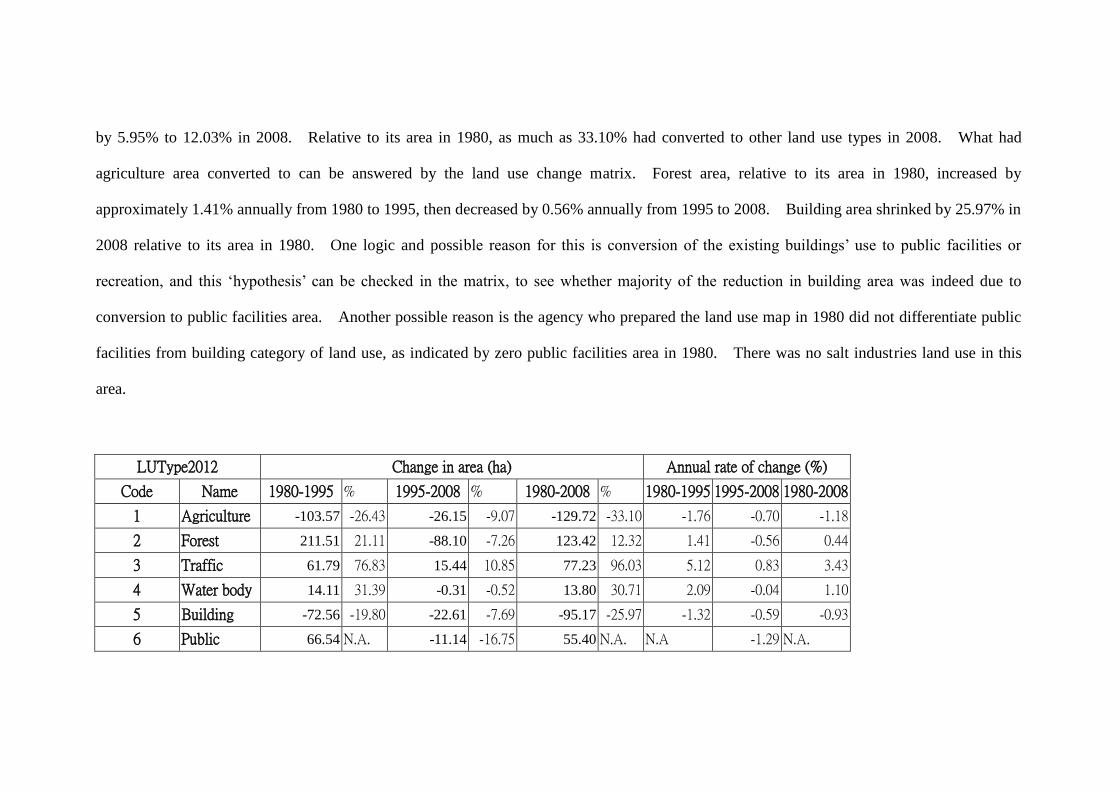
by 5.95% to 12.03% in 2008. Relative to its area in 1980, as much as 33.10% had converted to other land use types in 2008. What had
agriculture area converted to can be answered by the land use change matrix. Forest area, relative to its area in 1980, increased by
approximately 1.41% annually from 1980 to 1995, then decreased by 0.56% annually from 1995 to 2008. Building area shrinked by 25.97% in
2008 relative to its area in 1980. One logic and possible reason for this is conversion of the existing buildings’ use to public facilities or
recreation, and this ‘hypothesis’ can be checked in the matrix, to see whether majority of the reduction in building area was indeed due to
conversion to public facilities area. Another possible reason is the agency who prepared the land use map in 1980 did not differentiate public
facilities from building category of land use, as indicated by zero public facilities area in 1980. There was no salt industries land use in this
area.
LUType2012 Change in area (ha) Annual rate of change (%)
Code Name 1980-1995 % 1995-2008 % 1980-2008 % 1980-1995 1995-2008 1980-2008
1 Agriculture -103.57 -26.43 -26.15 -9.07 -129.72 -33.10 -1.76 -0.70 -1.18
2 Forest 211.51 21.11 -88.10 -7.26 123.42 12.32 1.41 -0.56 0.44
3 Traffic 61.79 76.83 15.44 10.85 77.23 96.03 5.12 0.83 3.43
4 Water body 14.11 31.39 -0.31 -0.52 13.80 30.71 2.09 -0.04 1.10
5 Building -72.56 -19.80 -22.61 -7.69 -95.17 -25.97 -1.32 -0.59 -0.93
6 Public 66.54 N.A. -11.14 -16.75 55.40 N.A. N.A -1.29 N.A.

facilities
7 Recreation -47.71 -41.24 55.08 81.01 7.37 6.37 -2.75 6.23 0.23
8 Salt
industries N.A. N.A. N.A. N.A. N.A. N.A. N.A. N.A. N.A.
9 Others -130.14 -72.88 77.40 159.85 -52.74 -29.53 -4.86 12.30 -1.05
Total
2.1 Land use change in “BASIN” sub-study area between 1980 and 1995
BASIN
1980-1995 1995 Agriculture Forest Traffic
Water
body Building
Public
facilities Recreation
Salt
industries Others
1980 CELL COUNTS 10 20 30 40 50 60 70 80 90 1980total
Agriculture 100 27691 17221 1543 1201 8901 515 2423 0 1738 61233
Forest 200 10553 131342 3435 1139 4837 577 3604 0 1099 156586
Traffic 300 809 3215 2907 351 3429 850 182 0 823 12566
Water body 400 906 463 888 3905 506 141 0 215 7024
Building 500 2776 3490 11302 1084 25973 8148 1679 0 2812 57264
Public
facilities 600 0 0 0 0 0 0 0 0 0 0
Recreation 700 73 11349 1858 499 1643 251 2390 0 15 18078
Salt
industries 800 0 0 0 0 0 0 0 0 0 0
Others 900 2242 22558 288 1050 638 56 204 0 864 27900
1995total 45050 189638 22221 9229 45927 10397 10623 0 7566
BASIN 1980-1995
AREA (ha)
Agriculture Forest Traffic Water
body Building
Public
facilities Recreation
Salt
industries Others
10 20 30 40 50 60 70 80 90 1980total
Agriculture 100 177.22 110.21 9.88 7.69 56.97 3.30 15.51 N.A. 11.12 391.89
Forest 200 67.54 840.59 21.98 7.29 30.96 3.69 23.07 N.A. 7.03 1002.15
Traffic 300 5.18 20.58 18.60 2.25 21.95 5.44 1.16 N.A. 5.27 80.42
Water body 400 5.80 2.96 5.68 24.99 3.24 0.00 0.90 N.A. 1.38 44.95
Building 500 17.77 22.34 72.33 6.94 166.23 52.15 10.75 N.A. 18.00 366.49
Public facilities 600 N.A. N.A. N.A. N.A. N.A. N.A. N.A. N.A. N.A. N.A.
Recreation 700 0.47 72.63 11.89 3.19 10.52 1.61 15.30 N.A. 0.10 115.70
Salt industries 800 N.A. N.A. N.A. N.A. N.A. N.A. N.A. N.A. N.A. N.A.
Others 900 14.35 144.37 1.84 6.72 4.08 0.36 1.31 N.A. 5.53 178.56
1995total 292.04 1213.68 142.21 59.07 293.93 66.54 67.99 N.A. 48.42 2180.17
Change in 1995 -103.57 211.51 61.79 14.11 -72.56 66.54 -47.71 N.A. -130.14

BASIN 1980-1995
AREA (%)
Agriculture Forest Traffic Water
body Building
Public
facilities Recreation
Salt
industries Others
10 20 30 40 50 60 70 80 90 1980total
Agriculture 100 45.22 28.12 2.52 1.96 14.54 0.84 3.96 N.A. 2.84 100.00
Forest 200 6.74 83.88 2.19 0.73 3.09 0.37 2.30 N.A. 0.70 100.00
Traffic 300 6.44 25.58 23.13 2.79 27.29 6.76 1.45 N.A. 6.55 100.00
Water body 400 12.90 6.59 12.64 55.60 7.20 0.00 2.01 N.A. 3.06 100.00
Building 500 4.85 6.09 19.74 1.89 45.36 14.23 2.93 N.A. 4.91 100.00
Public facilities 600 N.A. N.A. N.A. N.A. N.A. N.A. N.A. N.A. N.A. N.A.
Recreation 700 0.40 62.78 10.28 2.76 9.09 1.39 13.22 N.A. 0.08 100.00
Salt industries 800 N.A. N.A. N.A. N.A. N.A. N.A. N.A. N.A. N.A. N.A.
Others 900 8.04 80.85 1.03 3.76 2.29 0.20 0.73 N.A. 3.10 100.00
Change in 1995 -4.75 9.70 2.83 0.65 -3.33 3.05 -2.19 N.A. -5.97
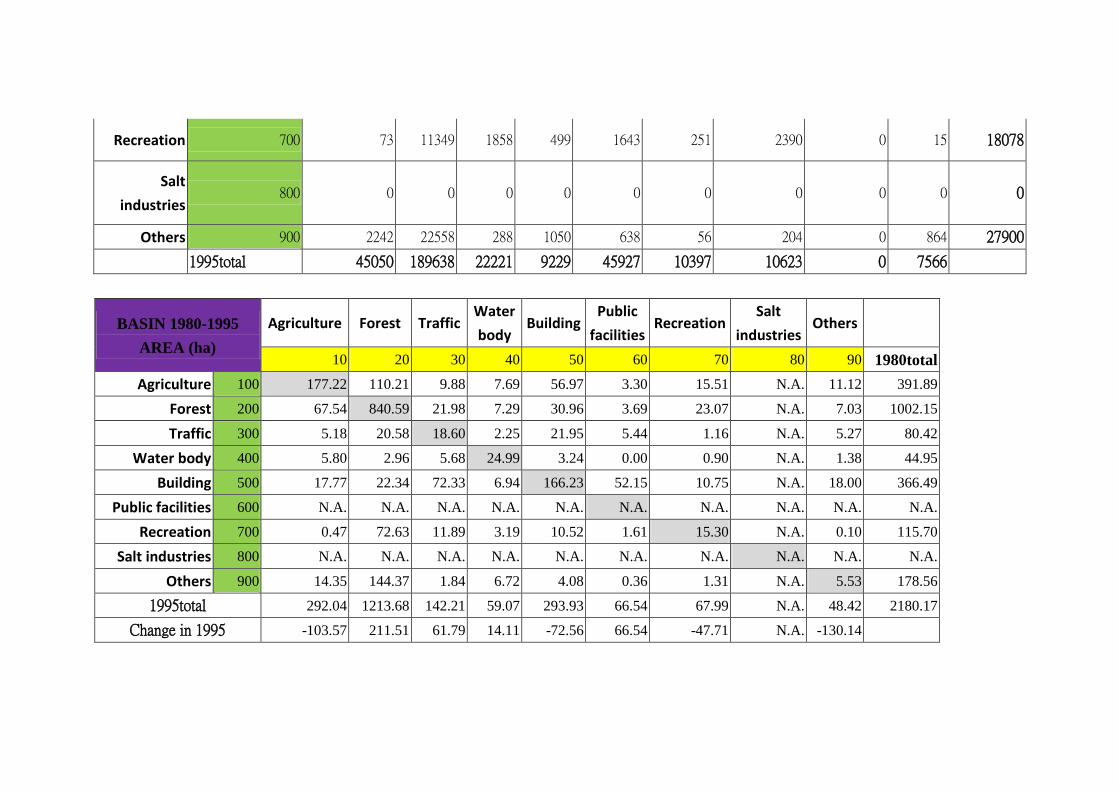
What is obvious from the above matrix is, assessing the change from 1980 to 1995, the highest proportion of building land use converted
to traffic (19.74%), followed by public facilities (14.23%). 83.88% of forest area remained forest, with the most dominant change (6.74%) was
into agriculture. Agriculture land use itself, had 28.12% of its area became forest and 14.54% became building. Another noticeable change
was 62.78% of recreation area in 1980 was classified as forest in 1995. Further investigation was also needed on why only 23.13% of traffic area
remained to be classified as traffic in 1995, with 25.58% became forest and 27.29% became building. The odd transition also appeared for
water body that with 44.40% (100-55.60) was classified as other land use types 1995, very likely owing to incorrect classification in 1980.

Was it the error in the agency who prepared and digitized the land use map, or much of the road existed in 1980 was closed in 1995? Looking at
recreation land use, 62.78% of it was classified as forest in 1995, possibly indicating the attempt by the Taiwan government to preserve the
virgin forest and stopped the recreational use.
2.2 Land use change in “BASIN” sub-study area between 1995 and 2008
BASIN
1995-2008 2008 Agriculture Forest Traffic
Water
body Building
Public
facilities Recreation
Salt
industries Others
1995 CELL COUNTS 1 2 3 4 5 6 7 8 9 1995total
Agriculture 10 19794 13607 1887 1227 3868 619 1411 0 2609 45022
Forest 20 12988 145529 2770 718 4916 511 9715 0 12486 189633
Traffic 30 302 3068 14014 1016 2133 142 1235 0 310 22220
Water body 40 719 1265 904 4950 291 10 720 0 369 9228
Building 50 4039 6722 3435 410 27476 653 1805 0 1359 45899
Public
facilities 60 293 651 299 1151 6597 918 0 488 10397
Recreation 70 2223 3879 710 74 734 31 2875 0 97 10623

Salt
industries 80 0 0 0 0 0 0 0 0 0 0
Others 90 606 1149 614 786 1825 93 550 0 1942 7565
2008total 40964 175870 24633 9181 42394 8656 19229 0 19660
BASIN 1995-2008
AREA (ha)
Agriculture Forest Traffic Water
body Building
Public
facilities Recreation
Salt
industries Others
1 2 3 4 5 6 7 8 9 1995total
Agriculture 10 126.68 87.08 12.08 7.85 24.76 3.96 9.03 N.A. 16.70 288.14
Forest 20 83.12 931.39 17.73 4.60 31.46 3.27 62.18 N.A. 79.91 1213.65
Traffic 30 1.93 19.64 89.69 6.50 13.65 0.91 7.90 N.A. 1.98 142.21
Water body 40 4.60 8.10 5.79 31.68 1.86 0.06 4.61 N.A. 2.36 59.06
Building 50 25.85 43.02 21.98 2.62 175.85 4.18 11.55 N.A. 8.70 293.75
Public facilities 60 1.88 4.17 1.91 0.00 7.37 42.22 5.88 N.A. 3.12 66.54
Recreation 70 14.23 24.83 4.54 0.47 4.70 0.20 18.40 N.A. 0.62 67.99
Salt industries 80 N.A. N.A. N.A. N.A. N.A. N.A. N.A. N.A. N.A. N.A.
Others 90 3.88 7.35 3.93 5.03 11.68 0.60 3.52 N.A. 12.43 48.42
2008total 262.17 1125.57 157.65 58.76 271.32 55.40 123.07 N.A. 125.82 2179.76
Change in 2008 -26.15 -88.10 15.44 -0.31 -22.61 -11.14 55.08 N.A. 77.40
BASIN 1995-2008
AREA (%)
Agriculture Forest Traffic Water
body Building
Public
facilities Recreation
Salt
industries Others
1 2 3 4 5 6 7 8 9 1995total
Agriculture 10 43.97 30.22 4.19 2.73 8.59 1.37 3.13 N.A. 5.79 100.00
Forest 20 6.85 76.74 1.46 0.38 2.59 0.27 5.12 N.A. 6.58 100.00
Traffic 30 1.36 13.81 63.07 4.57 9.60 0.64 5.56 N.A. 1.40 100.00
Water body 40 7.79 13.71 9.80 53.64 3.15 0.11 7.80 N.A. 4.00 100.00
Building 50 8.80 14.65 7.48 0.89 59.86 1.42 3.93 N.A. 2.96 100.00
Public facilities 60 2.82 6.26 2.88 0.00 11.07 63.45 8.83 N.A. 4.69 100.00
Recreation 70 20.93 36.52 6.68 0.70 6.91 0.29 27.06 N.A. 0.91 100.00
Salt industries 80 N.A. N.A. N.A. N.A. N.A. N.A. N.A. N.A. N.A. N.A.
Others 90 8.01 15.19 8.12 10.39 24.12 1.23 7.27 N.A. 25.67 100.00
Change in 2008 -1.20 -4.03 0.71 -0.01 -1.03 -0.51 2.53 N.A. 3.55
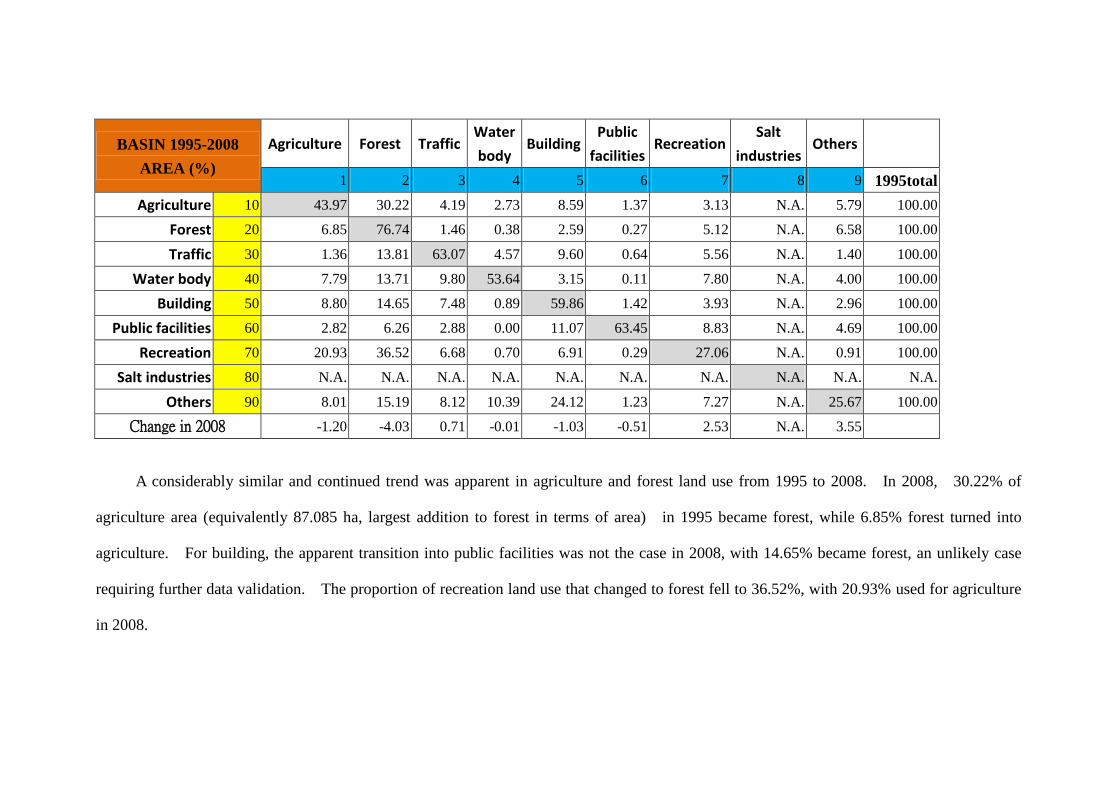
A considerably similar and continued trend was apparent in agriculture and forest land use from 1995 to 2008. In 2008, 30.22% of
agriculture area (equivalently 87.085 ha, largest addition to forest in terms of area) in 1995 became forest, while 6.85% forest turned into
agriculture. For building, the apparent transition into public facilities was not the case in 2008, with 14.65% became forest, an unlikely case
requiring further data validation. The proportion of recreation land use that changed to forest fell to 36.52%, with 20.93% used for agriculture
in 2008.
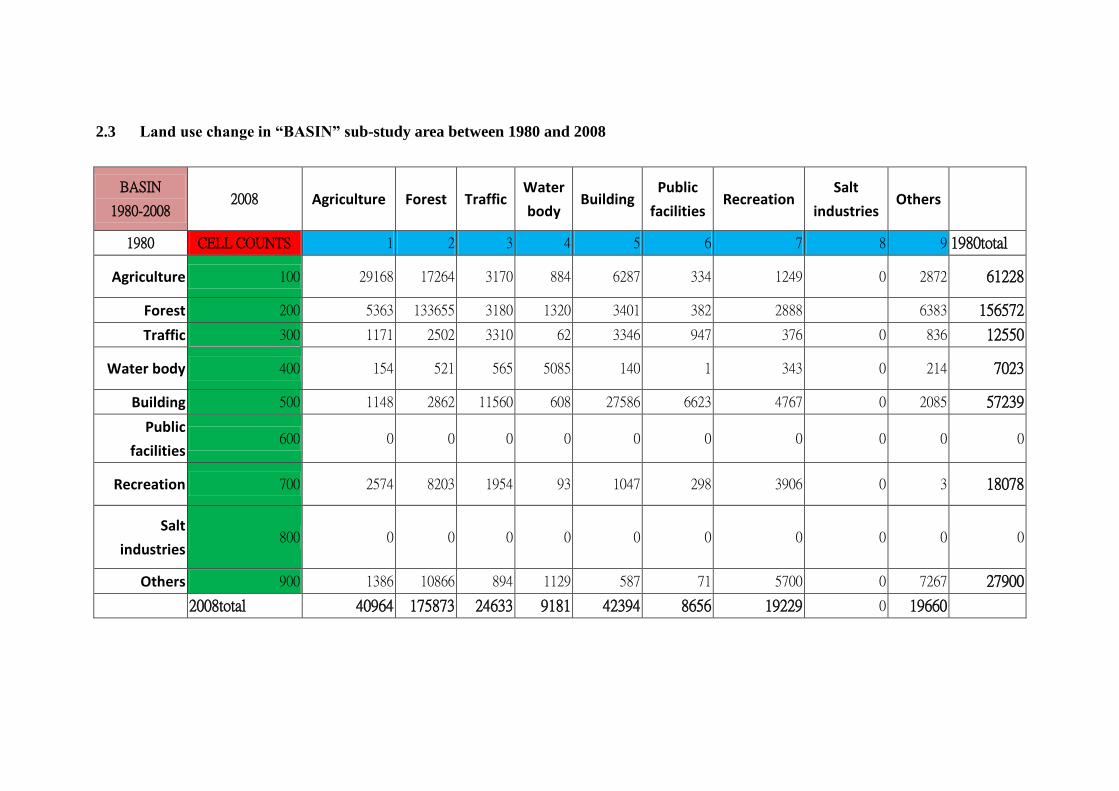
2.3 Land use change in “BASIN” sub-study area between 1980 and 2008
BASIN
1980-2008 2008 Agriculture Forest Traffic
Water
body Building
Public
facilities Recreation
Salt
industries Others
1980 CELL COUNTS 1 2 3 4 5 6 7 8 9 1980total
Agriculture 100 29168 17264 3170 884 6287 334 1249 0 2872 61228
Forest 200 5363 133655 3180 1320 3401 382 2888 6383 156572
Traffic 300 1171 2502 3310 62 3346 947 376 0 836 12550
Water body 400 154 521 565 5085 140 1 343 0 214 7023
Building 500 1148 2862 11560 608 27586 6623 4767 0 2085 57239
Public
facilities 600 0 0 0 0 0 0 0 0 0 0
Recreation 700 2574 8203 1954 93 1047 298 3906 0 3 18078
Salt
industries 800 0 0 0 0 0 0 0 0 0 0
Others 900 1386 10866 894 1129 587 71 5700 0 7267 27900
2008total 40964 175873 24633 9181 42394 8656 19229 0 19660

BASIN 1980-2008
AREA (ha)
Agriculture Forest Traffic Water
body Building
Public
facilities Recreation
Salt
industries Others
1 2 3 4 5 6 7 8 9 1980total
Agriculture 100 186.68 110.49 20.29 5.66 40.24 2.14 7.99 N.A. 18.38 391.86
Forest 200 34.32 855.39 20.35 8.45 21.77 2.44 18.48 N.A. 40.85 1002.06
Traffic 300 7.49 16.01 21.18 0.40 21.41 6.06 2.41 N.A. 5.35 80.32
Water body 400 0.99 3.33 3.62 32.54 0.90 0.01 2.20 N.A. 1.37 44.95
Building 500 7.35 18.32 73.98 3.89 176.55 42.39 30.51 N.A. 13.34 366.33
Public facilities 600 N.A. N.A. N.A. N.A. N.A. N.A. N.A. N.A. N.A. N.A.
Recreation 700 16.47 52.50 12.51 0.60 6.70 1.91 25.00 N.A. 0.02 115.70
Salt industries 800 N.A. N.A. N.A. N.A. N.A. N.A. N.A. N.A. N.A. N.A.
Others 900 8.87 69.54 5.72 7.23 3.76 0.45 36.48 N.A. 46.51 178.56
2008total 262.17 1125.59 157.65 58.76 271.32 55.40 123.07 N.A. 125.82 2179.78
Change in 2008 -129.72 123.42 77.23 13.80 -95.17 55.40 7.37 N.A. -52.74
BASIN 1980-2008
AREA (%)
Agriculture Forest Traffic Water
body Building
Public
facilities Recreation
Salt
industries Others
1 2 3 4 5 6 7 8 9 1980total
Agriculture 100 47.64 28.20 5.18 1.44 10.27 0.55 2.04 N.A. 4.69 100.00
Forest 200 3.43 85.36 2.03 0.84 2.17 0.24 1.84 N.A. 4.08 100.00
Traffic 300 9.33 19.94 26.37 0.49 26.66 7.55 3.00 N.A. 6.66 100.00
Water body 400 2.19 7.42 8.04 72.40 1.99 0.01 4.88 N.A. 3.05 100.00
Building 500 2.01 5.00 20.20 1.06 48.19 11.57 8.33 N.A. 3.64 100.00
Public facilities 600 N.A. N.A. N.A. N.A. N.A. N.A. N.A. N.A. N.A. N.A.
Recreation 700 14.24 45.38 10.81 0.51 5.79 1.65 21.61 N.A. 0.02 100.00
Salt industries 800 N.A. N.A. N.A. N.A. N.A. N.A. N.A. N.A. N.A. N.A.
Others 900 4.97 38.95 3.20 4.05 2.10 0.25 20.43 N.A. 26.05 100.00
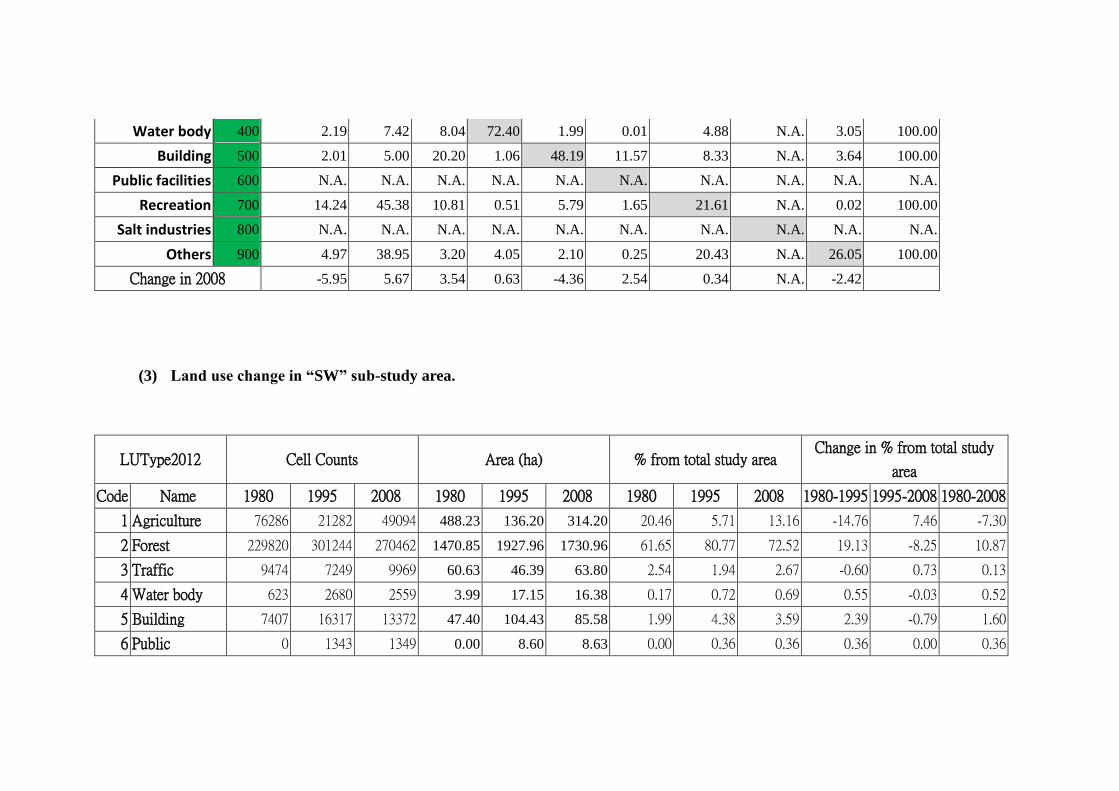
Change in 2008 -5.95 5.67 3.54 0.63 -4.36 2.54 0.34 N.A. -2.42
(3) Land use change in “SW” sub-study area.
LUType2012 Cell Counts Area (ha) % from total study area Change in % from total study
area
Code Name 1980 1995 2008 1980 1995 2008 1980 1995 2008 1980-1995 1995-2008 1980-2008
1 Agriculture 76286 21282 49094 488.23 136.20 314.20 20.46 5.71 13.16 -14.76 7.46 -7.30
2 Forest 229820 301244 270462 1470.85 1927.96 1730.96 61.65 80.77 72.52 19.13 -8.25 10.87
3 Traffic 9474 7249 9969 60.63 46.39 63.80 2.54 1.94 2.67 -0.60 0.73 0.13
4 Water body 623 2680 2559 3.99 17.15 16.38 0.17 0.72 0.69 0.55 -0.03 0.52
5 Building 7407 16317 13372 47.40 104.43 85.58 1.99 4.38 3.59 2.39 -0.79 1.60
6 Public 0 1343 1349 0.00 8.60 8.63 0.00 0.36 0.36 0.36 0.00 0.36
facilities
7 Recreation 16991 12662 18004 108.74 81.04 115.23 4.56 3.40 4.83 -1.16 1.43 0.27
8 Salt industries 0 0 0 N.A. N.A. N.A. 0.00 0.00 0.00 N.A. N.A. N.A.
9 Others 32206 10178 8144 206.12 65.14 52.12 8.64 2.73 2.18 -5.91 -0.55 -6.46
Total 372807 372955 372953 2385.96 2386.91 2386.90 100 100 100
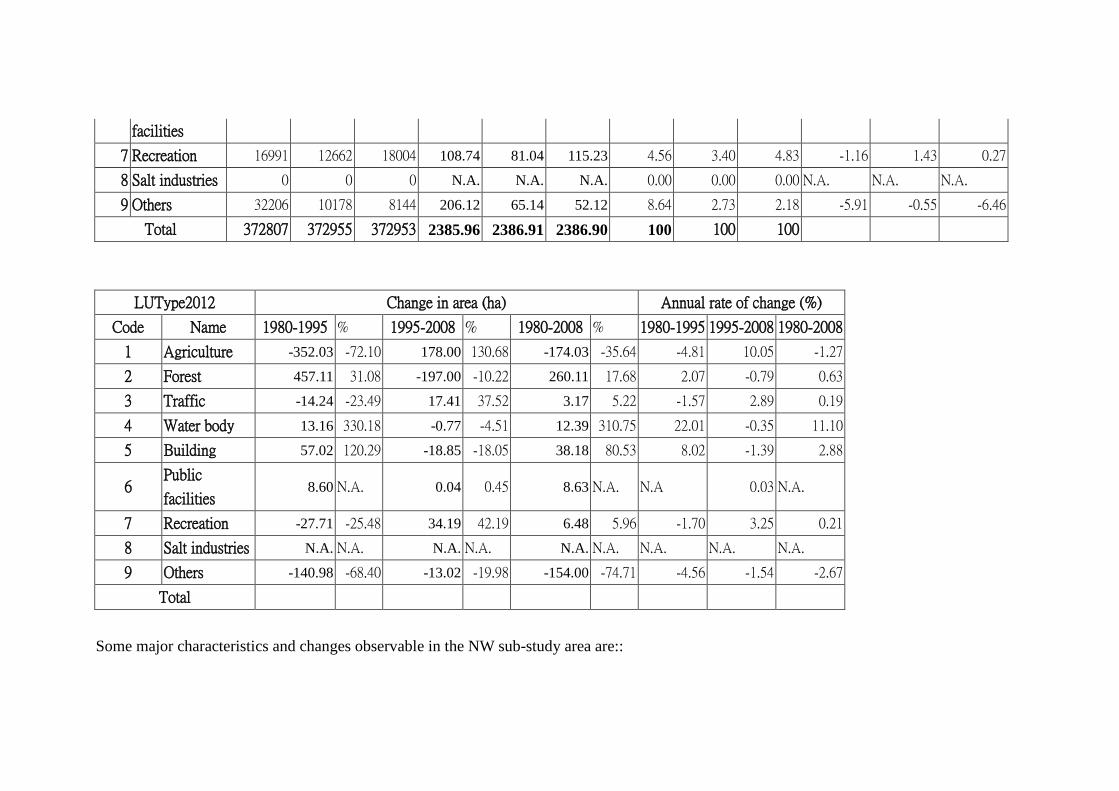
LUType2012 Change in area (ha) Annual rate of change (%)
Code Name 1980-1995 % 1995-2008 % 1980-2008 % 1980-1995 1995-2008 1980-2008
1 Agriculture -352.03 -72.10 178.00 130.68 -174.03 -35.64 -4.81 10.05 -1.27
2 Forest 457.11 31.08 -197.00 -10.22 260.11 17.68 2.07 -0.79 0.63
3 Traffic -14.24 -23.49 17.41 37.52 3.17 5.22 -1.57 2.89 0.19
4 Water body 13.16 330.18 -0.77 -4.51 12.39 310.75 22.01 -0.35 11.10
5 Building 57.02 120.29 -18.85 -18.05 38.18 80.53 8.02 -1.39 2.88
6 Public
facilities 8.60 N.A. 0.04 0.45 8.63 N.A. N.A 0.03 N.A.
7 Recreation -27.71 -25.48 34.19 42.19 6.48 5.96 -1.70 3.25 0.21
8 Salt industries N.A. N.A. N.A. N.A. N.A. N.A. N.A. N.A. N.A.
9 Others -140.98 -68.40 -13.02 -19.98 -154.00 -74.71 -4.56 -1.54 -2.67
Total
Some major characteristics and changes observable in the NW sub-study area are::
Forest occupied more than 60% of the NW sub-study area in 1980, 1995, and 2008. There was also no salt industries here.
Traffic (road development) was slower, its coverage increase very little from 2.54% in 1980 to 2.67% in 2008, compared to in “Basin”
sub-study area with 7.23% area developed for traffic use.
Building land use was not dominant, only represented 3.59% of the NW area in 2008, when compared to 12.45% in Basin area. Clearly
urbanization, possibly attributable to the road development, had been faster in the Basin area.
Agriculture land use saw its area initially decreased 72.10% (or 14.76 coverage loss of the NW area) from 1980 to 1995, then more than
doubled (130.68%, or 7.46% increase in NW area coverage) in 2008.
Forest coverage increased by 19.13% in 1995 from 1980, then decreased by 8.25% (or 10.22% relative to its area in 1995) in 2008.
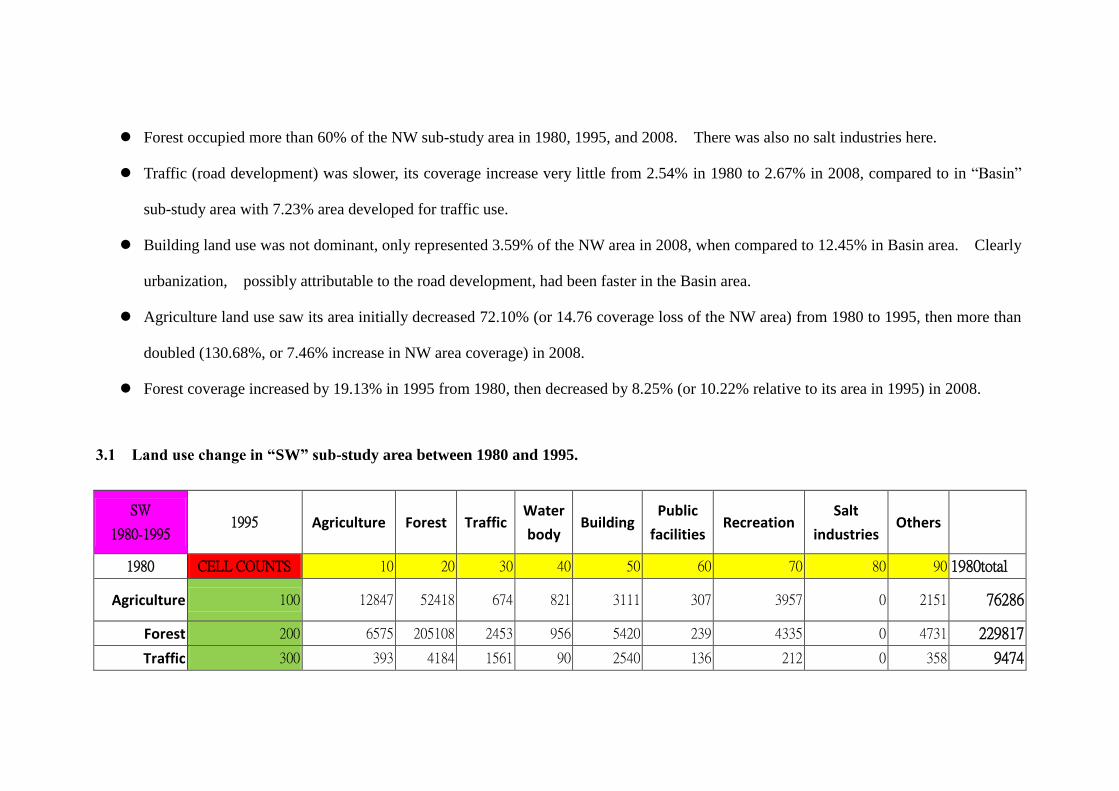
3.1 Land use change in “SW” sub-study area between 1980 and 1995.
SW
1980-1995 1995 Agriculture Forest Traffic
Water
body Building
Public
facilities Recreation
Salt
industries Others
1980 CELL COUNTS 10 20 30 40 50 60 70 80 90 1980total
Agriculture 100 12847 52418 674 821 3111 307 3957 0 2151 76286
Forest 200 6575 205108 2453 956 5420 239 4335 0 4731 229817
Traffic 300 393 4184 1561 90 2540 136 212 0 358 9474
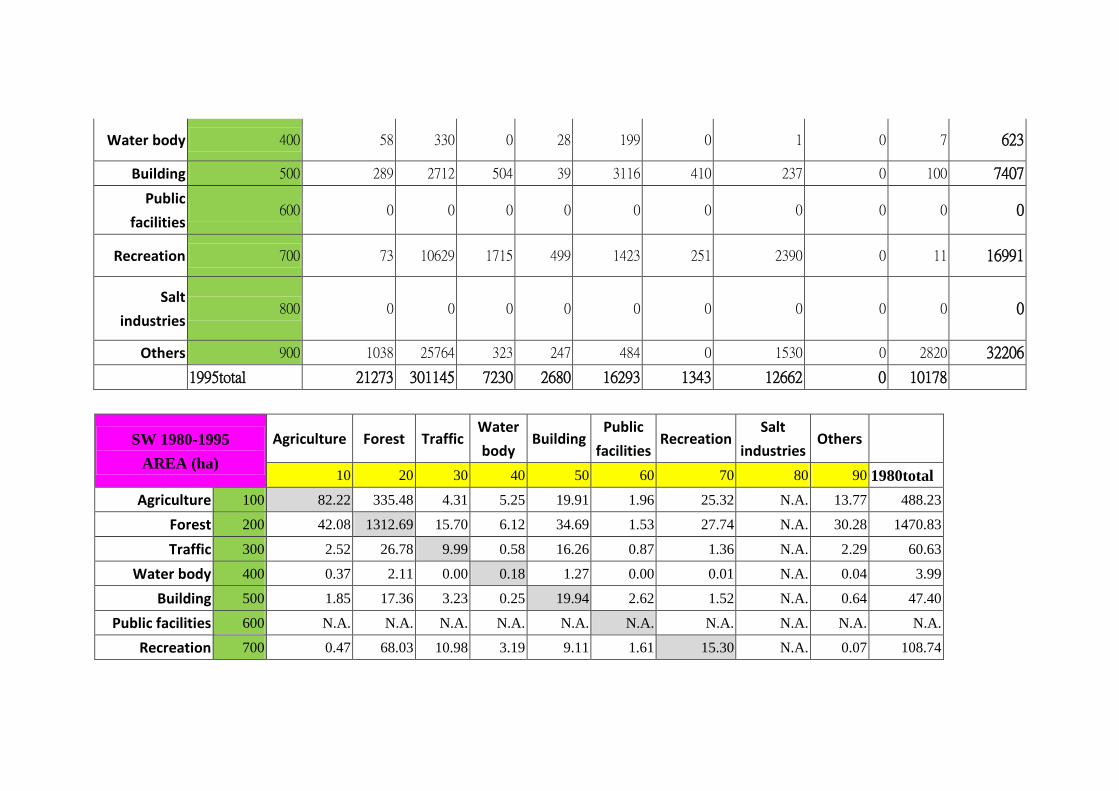
Water body 400 58 330 0 28 199 0 1 0 7 623
Building 500 289 2712 504 39 3116 410 237 0 100 7407
Public
facilities 600 0 0 0 0 0 0 0 0 0 0
Recreation 700 73 10629 1715 499 1423 251 2390 0 11 16991
Salt
industries 800 0 0 0 0 0 0 0 0 0 0
Others 900 1038 25764 323 247 484 0 1530 0 2820 32206
1995total 21273 301145 7230 2680 16293 1343 12662 0 10178
SW 1980-1995
AREA (ha)
Agriculture Forest Traffic Water
body Building
Public
facilities Recreation
Salt
industries Others
10 20 30 40 50 60 70 80 90 1980total
Agriculture 100 82.22 335.48 4.31 5.25 19.91 1.96 25.32 N.A. 13.77 488.23
Forest 200 42.08 1312.69 15.70 6.12 34.69 1.53 27.74 N.A. 30.28 1470.83
Traffic 300 2.52 26.78 9.99 0.58 16.26 0.87 1.36 N.A. 2.29 60.63
Water body 400 0.37 2.11 0.00 0.18 1.27 0.00 0.01 N.A. 0.04 3.99
Building 500 1.85 17.36 3.23 0.25 19.94 2.62 1.52 N.A. 0.64 47.40
Public facilities 600 N.A. N.A. N.A. N.A. N.A. N.A. N.A. N.A. N.A. N.A.
Recreation 700 0.47 68.03 10.98 3.19 9.11 1.61 15.30 N.A. 0.07 108.74
Salt industries 800 N.A. N.A. N.A. N.A. N.A. N.A. N.A. N.A. N.A. N.A.
Others 900 6.64 164.89 2.07 1.58 3.10 0.00 9.79 N.A. 18.05 206.12
1995total 136.15 1927.33 46.27 17.15 104.28 8.60 81.04 N.A. 65.14 2385.95
Change in 1995 -352.03 457.11 -14.24 13.16 57.02 8.60 -27.71 N.A. -140.98
SW 1980-1995
AREA (%)
Agriculture Forest Traffic Water
body Building
Public
facilities Recreation
Salt
industries Others
10 20 30 40 50 60 70 80 90 1980total
Agriculture 100 16.84 68.71 0.88 1.08 4.08 0.40 5.19 N.A. 2.82 100.00
Forest 200 2.86 89.25 1.07 0.42 2.36 0.10 1.89 N.A. 2.06 100.00
Traffic 300 4.15 44.16 16.48 0.95 26.81 1.44 2.24 N.A. 3.78 100.00
Water body 400 9.31 52.97 0.00 4.49 31.94 0.00 0.16 N.A. 1.12 100.00
Building 500 3.90 36.61 6.80 0.53 42.07 5.54 3.20 N.A. 1.35 100.00
Public facilities 600 N.A. N.A. N.A. N.A. N.A. N.A. N.A. N.A. N.A. N.A.
Recreation 700 0.43 62.56 10.09 2.94 8.38 1.48 14.07 N.A. 0.06 100.00
Salt industries 800 N.A. N.A. N.A. N.A. N.A. N.A. N.A. N.A. N.A. N.A.
Others 900 3.22 80.00 1.00 0.77 1.50 0.00 4.75 N.A. 8.76 100.00
Change in 1995 -14.76 19.13 -0.60 0.55 2.39 0.36 -1.16 N.A. -5.91
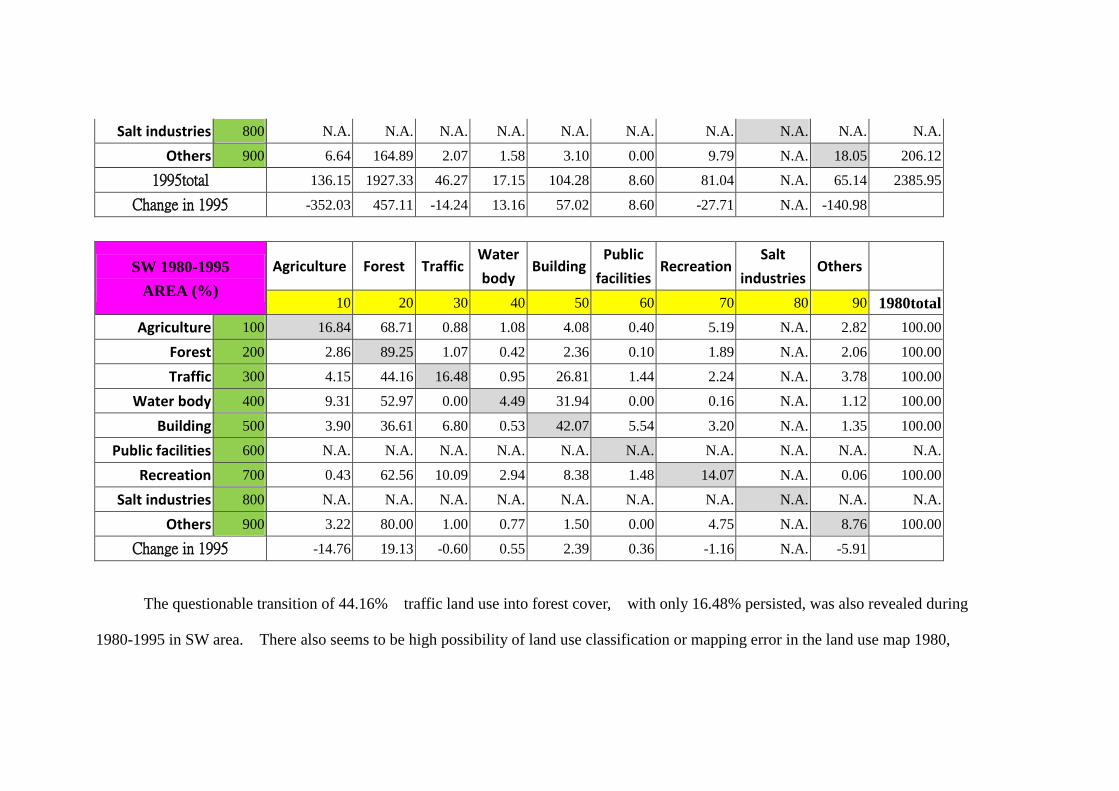
The questionable transition of 44.16% traffic land use into forest cover, with only 16.48% persisted, was also revealed during
1980-1995 in SW area. There also seems to be high possibility of land use classification or mapping error in the land use map 1980,
considering the water body that only 4.49% of it remained water body in 1995, although landscape changes might influence such conversion to
some extent. Considerably high proportion (main distribution of change) of the agriculture (68.71%), building (36.61%), and recreation
(62.56%) were classified as forest in 1995.
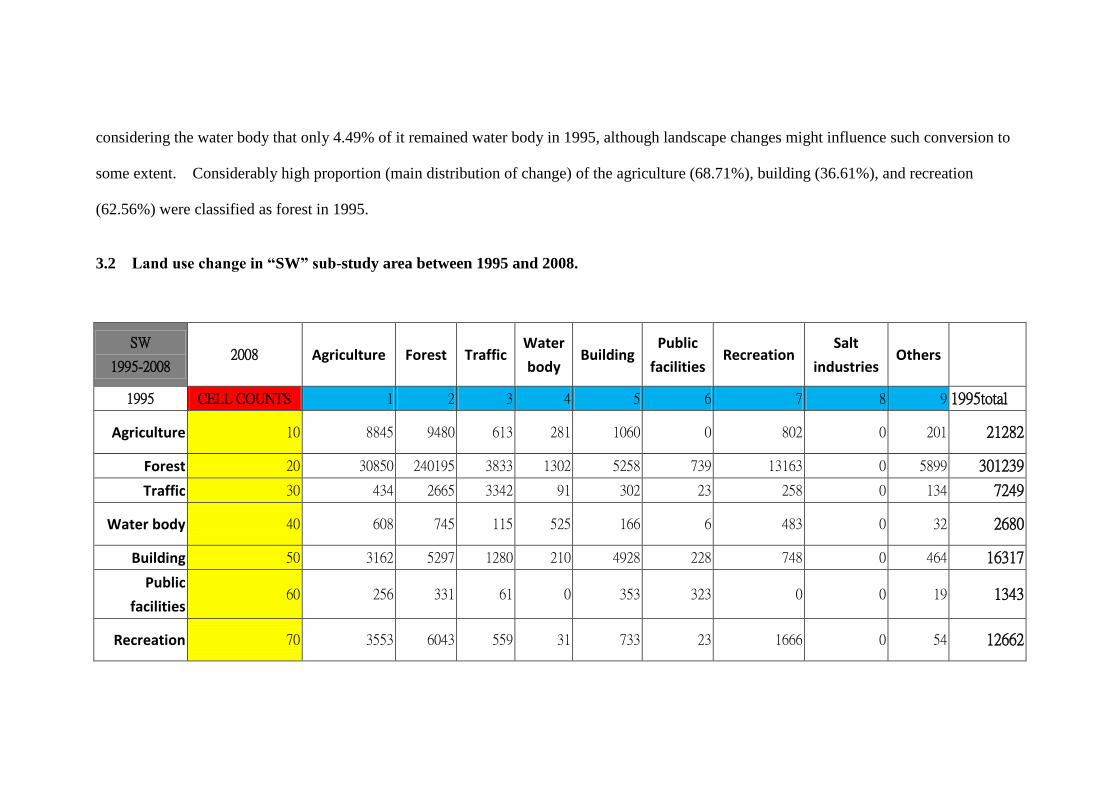
3.2 Land use change in “SW” sub-study area between 1995 and 2008.
SW
1995-2008 2008 Agriculture Forest Traffic
Water
body Building
Public
facilities Recreation
Salt
industries Others
1995 CELL COUNTS 1 2 3 4 5 6 7 8 9 1995total
Agriculture 10 8845 9480 613 281 1060 0 802 0 201 21282
Forest 20 30850 240195 3833 1302 5258 739 13163 0 5899 301239
Traffic 30 434 2665 3342 91 302 23 258 0 134 7249
Water body 40 608 745 115 525 166 6 483 0 32 2680
Building 50 3162 5297 1280 210 4928 228 748 0 464 16317
Public
facilities 60 256 331 61 0 353 323 0 0 19 1343
Recreation 70 3553 6043 559 31 733 23 1666 0 54 12662

Salt
industries 80 0 0 0 0 0 0 0 0 0 0
Others 90 1386 5703 166 119 572 7 884 0 1341 10178
2008total 49094 270459 9969 2559 13372 1349 18004 0 8144
SW 1995-2008
AREA (ha)
Agriculture Forest Traffic Water
body Building
Public
facilities Recreation
Salt
industries Others
1 2 3 4 5 6 7 8 9 1995total
Agriculture 10 56.61 60.67 3.92 1.80 6.78 0.00 5.13 N.A. 1.29 136.20
Forest 20 197.44 1537.25 24.53 8.33 33.65 4.73 84.24 N.A. 37.75 1927.93
Traffic 30 2.78 17.06 21.39 0.58 1.93 0.15 1.65 N.A. 0.86 46.39
Water body 40 3.89 4.77 0.74 3.36 1.06 0.04 3.09 N.A. 0.20 17.15
Building 50 20.24 33.90 8.19 1.34 31.54 1.46 4.79 N.A. 2.97 104.43
Public facilities 60 1.64 2.12 0.39 0.00 2.26 2.07 0.00 N.A. 0.12 8.60
Recreation 70 22.74 38.68 3.58 0.20 4.69 0.15 10.66 N.A. 0.35 81.04
Salt industries 80 N.A. N.A. N.A. N.A. N.A. N.A. N.A. N.A. N.A. N.A.
Others 90 8.87 36.50 1.06 0.76 3.66 0.04 5.66 N.A. 8.58 65.14
2008total 314.20 1730.94 63.80 16.38 85.58 8.63 115.23 N.A. 52.12 2386.88
Change in 2008 178.00 -197.00 17.41 -0.77 -18.85 0.04 34.19 N.A. -13.02
SW 1995-2008
AREA (%)
Agriculture Forest Traffic Water
body Building
Public
facilities Recreation
Salt
industries Others
1 2 3 4 5 6 7 8 9 1995total
Agriculture 10 41.56 44.54 2.88 1.32 4.98 0.00 3.77 N.A. 0.94 100.00
Forest 20 10.24 79.74 1.27 0.43 1.75 0.25 4.37 N.A. 1.96 100.00
Traffic 30 5.99 36.76 46.10 1.26 4.17 0.32 3.56 N.A. 1.85 100.00
Water body 40 22.69 27.80 4.29 19.59 6.19 0.22 18.02 N.A. 1.19 100.00
Building 50 19.38 32.46 7.84 1.29 30.20 1.40 4.58 N.A. 2.84 100.00
Public facilities 60 19.06 24.65 4.54 0.00 26.28 24.05 0.00 N.A. 1.41 100.00
Recreation 70 28.06 47.73 4.41 0.24 5.79 0.18 13.16 N.A. 0.43 100.00
Salt industries 80 N.A. N.A. N.A. N.A. N.A. N.A. N.A. N.A. N.A. N.A.
Others 90 13.62 56.03 1.63 1.17 5.62 0.07 8.69 N.A. 13.18 100.00
Change in 2008 7.46 -8.25 0.73 -0.03 -0.79 0.00 1.43 N.A. -0.55
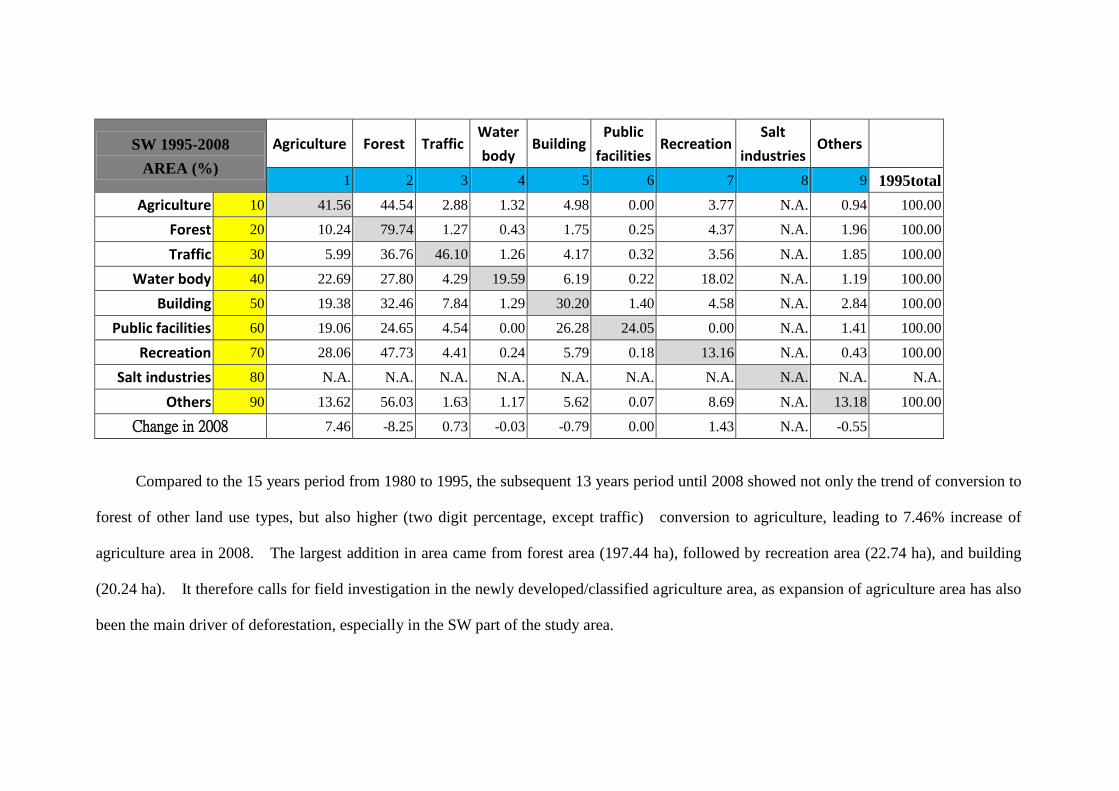
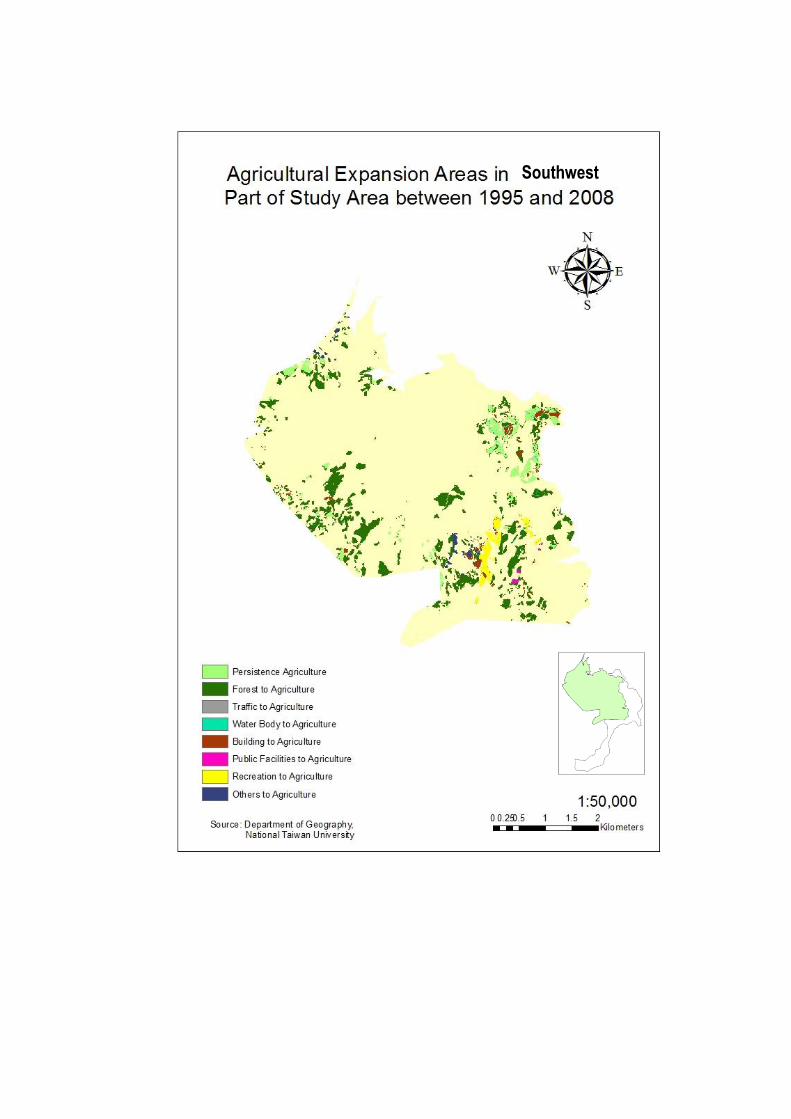
Compared to the 15 years period from 1980 to 1995, the subsequent 13 years period until 2008 showed not only the trend of conversion to
forest of other land use types, but also higher (two digit percentage, except traffic) conversion to agriculture, leading to 7.46% increase of
agriculture area in 2008. The largest addition in area came from forest area (197.44 ha), followed by recreation area (22.74 ha), and building
(20.24 ha). It therefore calls for field investigation in the newly developed/classified agriculture area, as expansion of agriculture area has also
been the main driver of deforestation, especially in the SW part of the study area.
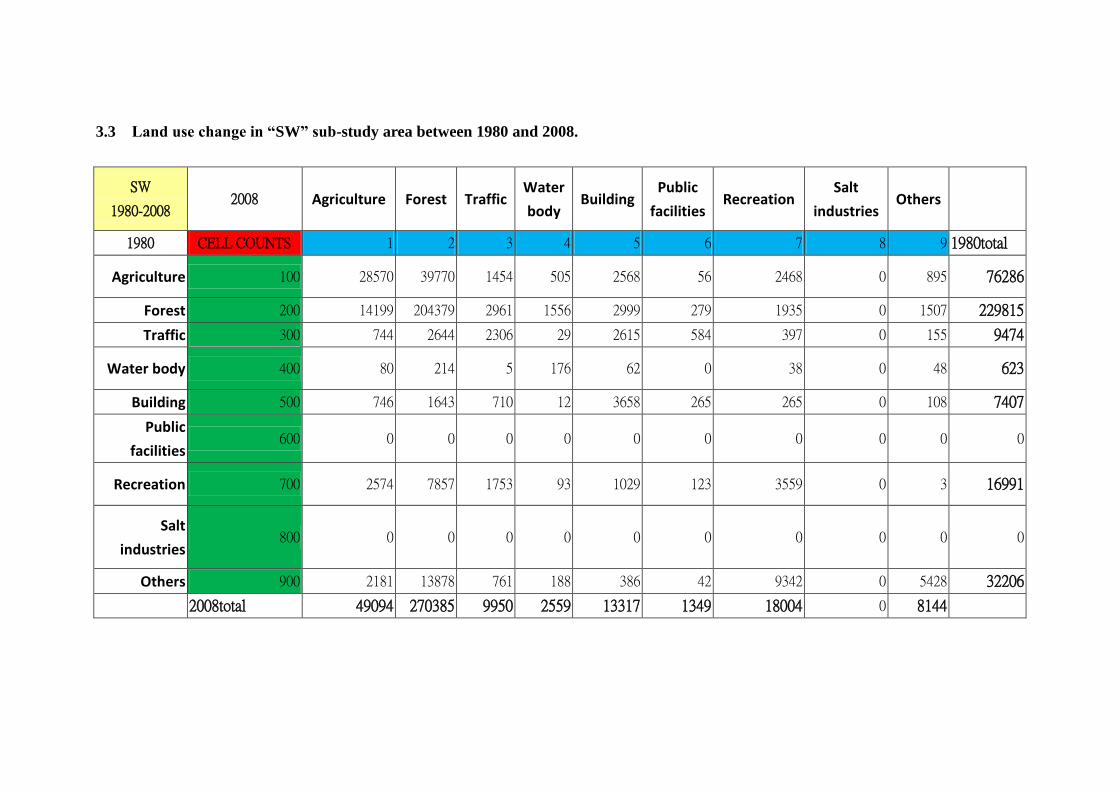
3.3 Land use change in “SW” sub-study area between 1980 and 2008.
SW
1980-2008 2008 Agriculture Forest Traffic
Water
body Building
Public
facilities Recreation
Salt
industries Others
1980 CELL COUNTS 1 2 3 4 5 6 7 8 9 1980total
Agriculture 100 28570 39770 1454 505 2568 56 2468 0 895 76286
Forest 200 14199 204379 2961 1556 2999 279 1935 0 1507 229815
Traffic 300 744 2644 2306 29 2615 584 397 0 155 9474
Water body 400 80 214 5 176 62 0 38 0 48 623
Building 500 746 1643 710 12 3658 265 265 0 108 7407
Public
facilities 600 0 0 0 0 0 0 0 0 0 0
Recreation 700 2574 7857 1753 93 1029 123 3559 0 3 16991
Salt
industries 800 0 0 0 0 0 0 0 0 0 0
Others 900 2181 13878 761 188 386 42 9342 0 5428 32206
2008total 49094 270385 9950 2559 13317 1349 18004 0 8144

SW 1980-2008
AREA (ha)
Agriculture Forest Traffic Water
body Building
Public
facilities Recreation
Salt
industries Others
1 2 3 4 5 6 7 8 9 1980total
Agriculture 100 182.85 254.53 9.31 3.23 16.44 0.36 15.80 N.A. 5.73 488.23
Forest 200 90.87 1308.03 18.95 9.96 19.19 1.79 12.38 N.A. 9.64 1470.82
Traffic 300 4.76 16.92 14.76 0.19 16.74 3.74 2.54 N.A. 0.99 60.63
Water body 400 0.51 1.37 0.03 1.13 0.40 0.00 0.24 N.A. 0.31 3.99
Building 500 4.77 10.52 4.54 0.08 23.41 1.70 1.70 N.A. 0.69 47.40
Public facilities 600 N.A. N.A. N.A. N.A. N.A. N.A. N.A. N.A. N.A. N.A.
Recreation 700 16.47 50.28 11.22 0.60 6.59 0.79 22.78 N.A. 0.02 108.74
Salt industries 800 N.A. N.A. N.A. N.A. N.A. N.A. N.A. N.A. N.A. N.A.
Others 900 13.96 88.82 4.87 1.20 2.47 0.27 59.79 N.A. 34.74 206.12
2008total 315.74 1730.46 63.68 16.38 85.23 8.63 115.23 N.A. 52.12 2385.93
Change in 2008 -174.03 260.11 3.17 12.39 38.18 8.63 6.48 N.A. -154.00
SW 1980-2008
AREA (%)
Agriculture Forest Traffic Water
body Building
Public
facilities Recreation
Salt
industries Others
1 2 3 4 5 6 7 8 9 1980total
Agriculture 100 37.45 52.13 1.91 0.66 3.37 0.07 3.24 N.A. 1.17 100.00
Forest 200 6.18 88.93 1.29 0.68 1.30 0.12 0.84 N.A. 0.66 100.00
Traffic 300 7.85 27.91 24.34 0.31 27.60 6.16 4.19 N.A. 1.64 100.00
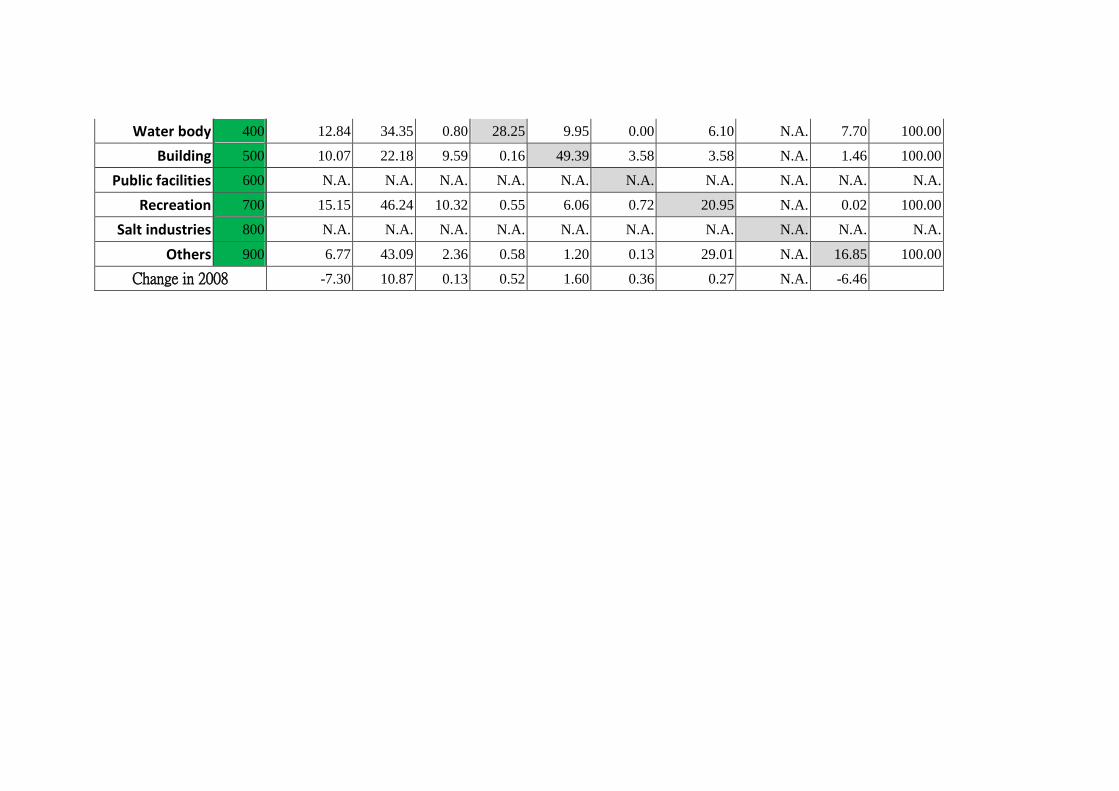
Water body 400 12.84 34.35 0.80 28.25 9.95 0.00 6.10 N.A. 7.70 100.00
Building 500 10.07 22.18 9.59 0.16 49.39 3.58 3.58 N.A. 1.46 100.00
Public facilities 600 N.A. N.A. N.A. N.A. N.A. N.A. N.A. N.A. N.A. N.A.
Recreation 700 15.15 46.24 10.32 0.55 6.06 0.72 20.95 N.A. 0.02 100.00
Salt industries 800 N.A. N.A. N.A. N.A. N.A. N.A. N.A. N.A. N.A. N.A.
Others 900 6.77 43.09 2.36 0.58 1.20 0.13 29.01 N.A. 16.85 100.00
Change in 2008 -7.30 10.87 0.13 0.52 1.60 0.36 0.27 N.A. -6.46

Southwest

Southwest

Southwest

Note: Urbanisation is defined as conversion from non-urban land use to urban
land use (traffic, building, public facilities, and recreation).
Southwest
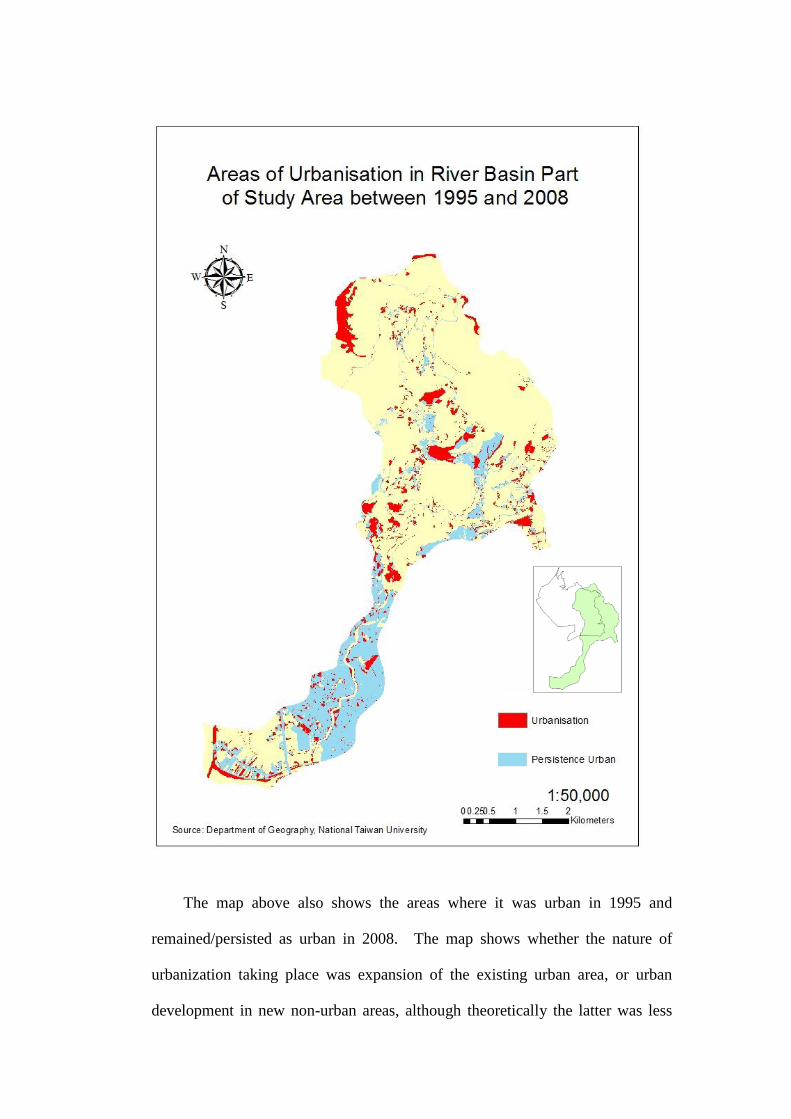
The map above also shows the areas where it was urban in 1995 and
remained/persisted as urban in 2008. The map shows whether the nature of
urbanization taking place was expansion of the existing urban area, or urban
development in new non-urban areas, although theoretically the latter was less

likely.
E. Conclusion and Recommendation
To conclude, this report has presented the land use change data for the ‘whole’,
‘basin’, and ‘SW’ (Southwest) subdivision of the study area, for the three periods i.e.
1980-1995, 1995-2008, and 1980-2008. Distribution of change has also been broken
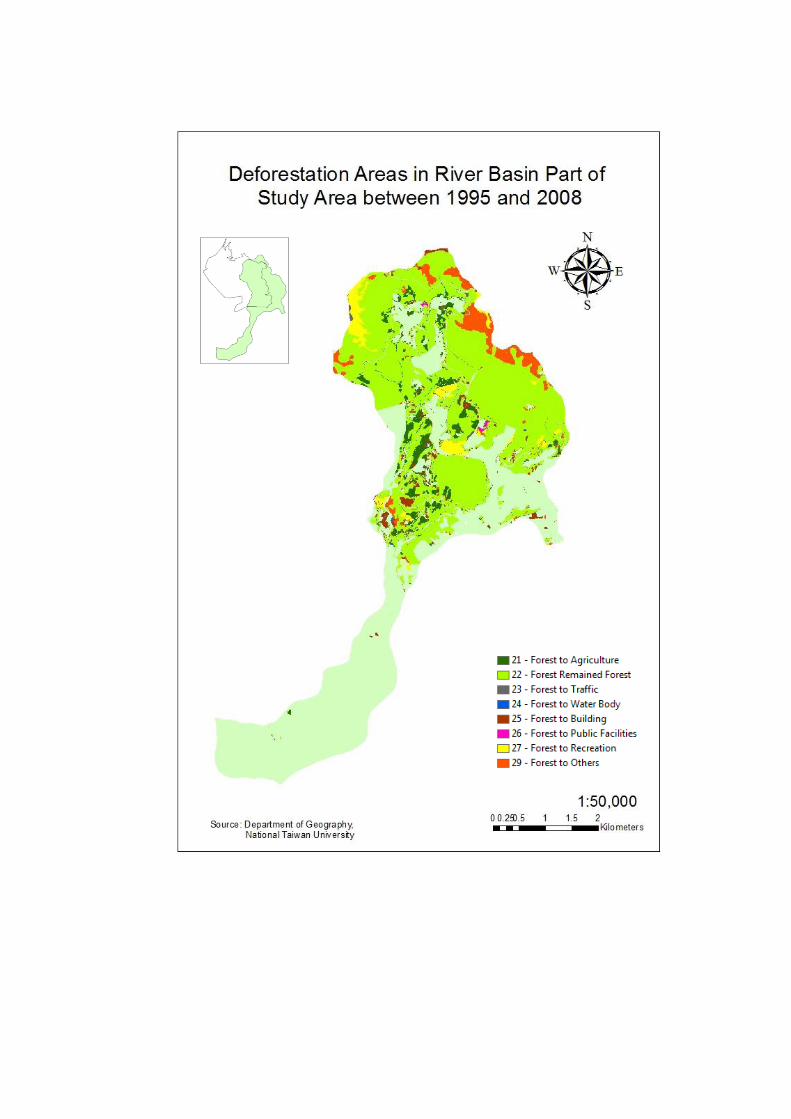
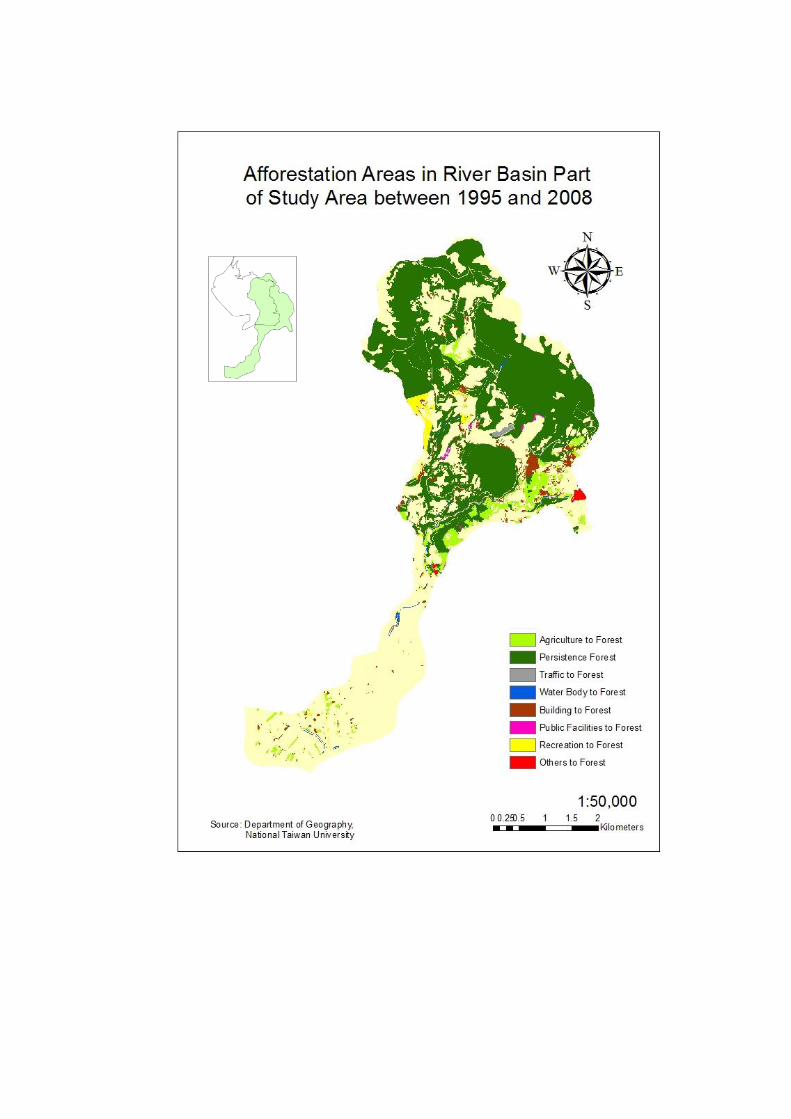
down and an initial assessment and analysis was discussed. Several maps showing
four major themes of land use change i.e. deforestation, agricultural expansion,
afforestation, and urbanization has also been produced for 1995-2008 period, mainly
to visualize the location and pattern of each of the specific changes, hence further land
investigation can be directed to the areas of change shown in the maps.
Land use change analysis can be taken further to land use change modeling based
on Markovian chain, Cellular Automata, the combination CA_Markov, or the
agent-based simulation analysis. These models can be used to predict future land
use based on the past land use, and also by incorporating explanatory variables that
act as the driver of the land use change such as the dynamic road development.
Prediction models can also incorporate planning intervention (constraints and
incentives) such as areas designated as preserved forest which are restricted for urban
development. The author of this report is currently learning the Idrisi Selva software
that provides such modeling capabilities.


