Embed Size (px)
Citation preview
Nuclear Materials and Energy 12 (2017) 559–563
Contents lists available at ScienceDirect
Nuclear Materials and Energy
journal homepage: www.elsevier.com/locate/nme
Assessment of erosion, deposition and fuel retention in the JET-ILW
divertor from ion beam analysis data
N. Catarino
a , b , ∗, N.P. Barradas a , c , V. Corregidor a , b , A. Widdowson
a , d , A. Baron-Wiechec
a , d , J.P. Coad
a , d , K. Heinola
a , e , M. Rubel a , f , E. Alves a , b , JET Contributors 1
a EUROfusion Consortium, JET, Culham Science Centre, Abingdon OX14 3DB, UK b IPFN, Instituto Superior Técnico, Universidade de Lisboa, Lisboa 1049-001, Portugal c C 2 TN, Instituto Superior Técnico, Universidade de Lisboa, E.N. 10, Sacavém 2686-953, Portugal d Culham Centre for Fusion Energy, Culham Science Centre, Abingdon OX14 3DB, UK e University of Helsinki, P.O. Box 64, Helsinki 00560, Finland f Royal Institute of Technology, Association EURATOM-VR, Stockholm SE-100 44, Sweden
a r t i c l e i n f o
Article history:
Received 14 July 2016
Revised 5 October 2016
Accepted 22 October 2016
Available online 18 November 2016
keywords:
JET
ITER-like wall
Plasma facing components
Erosion
Deposition
Ion beam analysis
a b s t r a c t
Post-mortem analyses of individual components provide relevant information on plasma-surface interac-
tions like tungsten erosion, beryllium deposition and plasma fuel retention with divertor tiles via implan-
tation or co-deposition. Ion Beam techniques are ideal tools for such purposes and have been extensively
used for post-mortem analyses of selected tiles from JET following each campaign.
In this contribution results from tiles removed from the JET ITER-Like Wall (JET-ILW) divertor follow-
ing the 2013–2014 campaign are presented. The results summarize erosion, deposition and fuel retention
along the poloidal cross section of the divertor surface and provide data for comparison with the first
JET-ILW campaign, showing a similar pattern of material migration with the exception of Tile 6 where
the strike point time on the tile was ∼ 4 times longer in 2013–2014 than in 2011–2012, which is likely to
account for more material migration to this region. The W deposition on top of the Mo marker coating
of Tile 4 shows that the enrichment takes place at the strike point location.
© 2016 The Authors. Published by Elsevier Ltd.
This is an open access article under the CC BY-NC-ND license.
( http://creativecommons.org/licenses/by-nc-nd/4.0/ )
1
t
d
i
s
v
t
t
m
p
p
B
d
u
E
t
fl
t
p
T
t
w
c
i
w
g
d
h
2
. Introduction
The future of fusion reactors will depend on the behaviour of
he materials used in Plasma Facing Components (PFCs) which will
etermine their lifetime and also influence retention of hydrogen
sotopes in the vessel. Among other processes, erosion of PFCs and
ubsequent re-deposition are critical for the operation of fusion de-
ices and must be properly understood. The erosion and migra-
ion in the divertor is a complex system and determines the life-
ime of PFCs in fusion devices. Erosion in the main chamber is the
ain source of impurities in the plasma, it occurs by sputtering of
lasma ions with energies up to several keV and subsequent im-
act of eroded particles. The eroded material, mainly Be from the
e-coated tiles, enters the plasma, is ionised and transported by
∗ Corresponding address: IFPN/LATR, Instituto Superior Técnico (IST), Universi-
ade de Lisboa, Estrada Nacional N ° 10, km 139,7, Bobadela 2695-066, Portugal.
E-mail addresses: [email protected] , [email protected].
lisboa.pt (N. Catarino). 1 See the Appendix of F. Romanelli et al., Proceedings of the 25th IAEA Fusion
nergy Conference 2014, Saint Petersburg, Russia
t
p
m
p
n
p
ttp://dx.doi.org/10.1016/j.nme.2016.10.027
352-1791/© 2016 The Authors. Published by Elsevier Ltd. This is an open access article u
he SOL-flows towards the divertor during the X-point phase. This
ow induces deposition of Be in the top part of the inner diver-
or. The process of re-erosion/deposition keeps going until it is de-
osited onto remote areas and no longer interacts with the plasma.
he number of cycles of re-erosion/deposition decreases with the
hreshold energy of the element, this means that in remotes areas
e expect more C than Be, and only a small amount of W [1] . The
o-deposition of fuel particles with erosion products leads to an
ncrease in the tritium inventory.
During the 2013–2014 JET-ILW campaign several marker tiles
ere installed in the main chamber and divertor to assess the
lobal picture of erosion and re-deposition processes occurring
uring machine operation [2–4] . The divertor is the region where
hese processes are expected to occur at extreme conditions and
ost mortem analysis offers the possibility to reveal some of the
ajor effects.
Fuel inventory, material erosion and melting have a major im-
act on the performance of the divertor. A large number of diag-
ostic tools have been used to study these phenomena. This study
resents the results from Ion Beam Analysis (IBA) techniques such
nder the CC BY-NC-ND license. ( http://creativecommons.org/licenses/by-nc-nd/4.0/ )
560 N. Catarino et al. / Nuclear Materials and Energy 12 (2017) 559–563
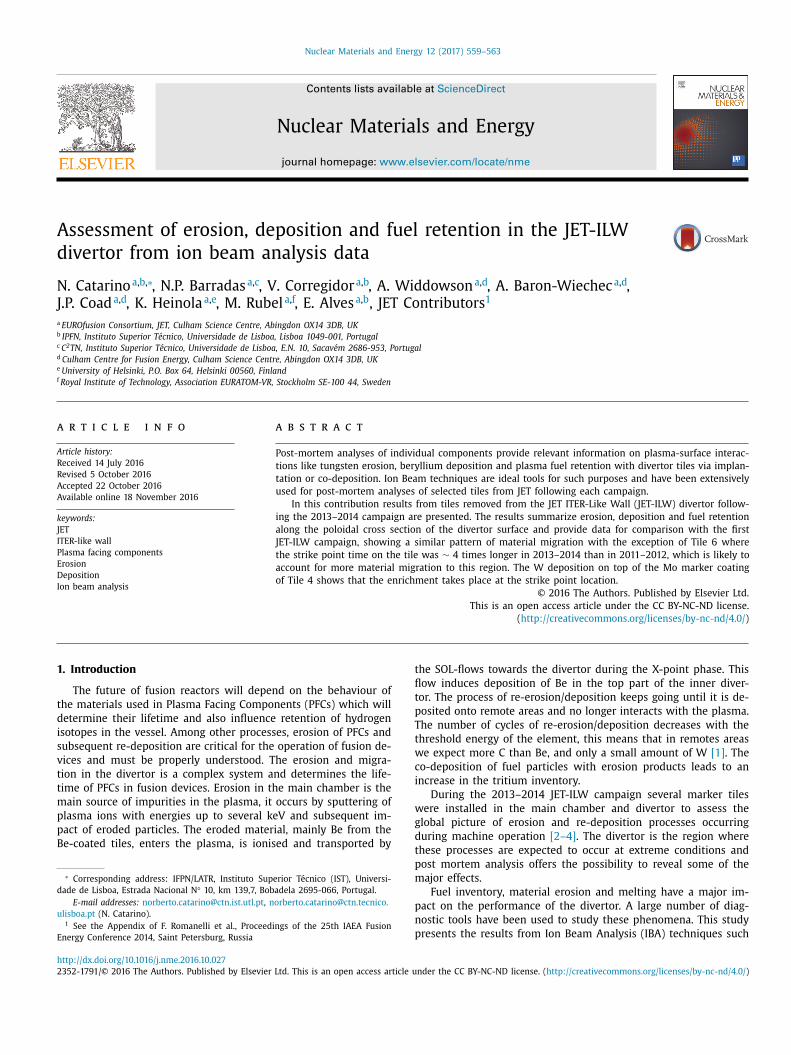
Fig. 1. JET divertor during the JET-ILW campaign 2013–2014. The s-coordinate (in mm) starts at the upper left corner of Tile 0 and follows the tile surfaces. In blue, the
tiles studied in this paper; the Tile 1 is between s-coordinates 162 mm and 415 mm, Tile 4 between s-coordinates 713 mm and 934 mm and Tile 6 between s-coordinates
1363 mm and 1552 mm.
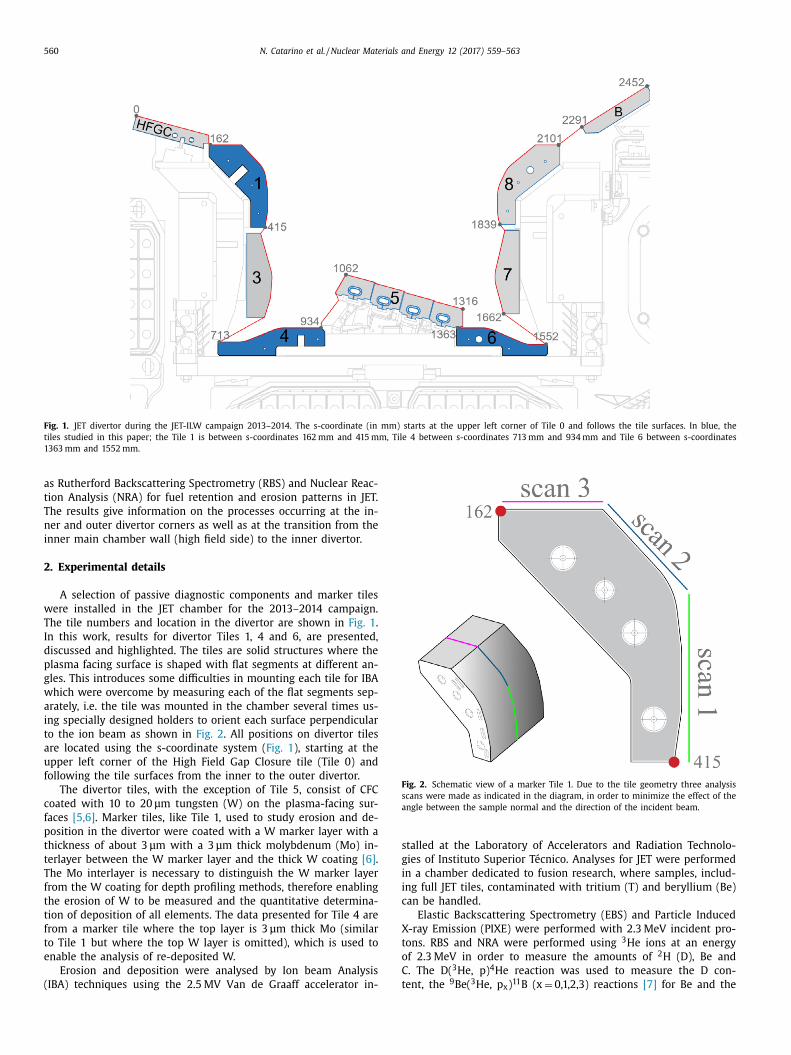
Fig. 2. Schematic view of a marker Tile 1. Due to the tile geometry three analysis
scans were made as indicated in the diagram, in order to minimize the effect of the
angle between the sample normal and the direction of the incident beam.
s
g
i
i
c
X
t
o
C
t
as Rutherford Backscattering Spectrometry (RBS) and Nuclear Reac-
tion Analysis (NRA) for fuel retention and erosion patterns in JET.
The results give information on the processes occurring at the in-
ner and outer divertor corners as well as at the transition from the
inner main chamber wall (high field side) to the inner divertor.
2. Experimental details
A selection of passive diagnostic components and marker tiles
were installed in the JET chamber for the 2013–2014 campaign.
The tile numbers and location in the divertor are shown in Fig. 1 .
In this work, results for divertor Tiles 1, 4 and 6, are presented,
discussed and highlighted. The tiles are solid structures where the
plasma facing surface is shaped with flat segments at different an-
gles. This introduces some difficulties in mounting each tile for IBA
which were overcome by measuring each of the flat segments sep-
arately, i.e. the tile was mounted in the chamber several times us-
ing specially designed holders to orient each surface perpendicular
to the ion beam as shown in Fig. 2 . All positions on divertor tiles
are located using the s-coordinate system ( Fig. 1 ), starting at the
upper left corner of the High Field Gap Closure tile (Tile 0) and
following the tile surfaces from the inner to the outer divertor.
The divertor tiles, with the exception of Tile 5, consist of CFC
coated with 10 to 20 μm tungsten (W) on the plasma-facing sur-
faces [5,6] . Marker tiles, like Tile 1, used to study erosion and de-
position in the divertor were coated with a W marker layer with a
thickness of about 3 μm with a 3 μm thick molybdenum (Mo) in-
terlayer between the W marker layer and the thick W coating [6] .
The Mo interlayer is necessary to distinguish the W marker layer
from the W coating for depth profiling methods, therefore enabling
the erosion of W to be measured and the quantitative determina-
tion of deposition of all elements. The data presented for Tile 4 are
from a marker tile where the top layer is 3 μm thick Mo (similar
to Tile 1 but where the top W layer is omitted), which is used to
enable the analysis of re-deposited W.
Erosion and deposition were analysed by Ion beam Analysis
(IBA) techniques using the 2.5 MV Van de Graaff accelerator in-
talled at the Laboratory of Accelerators and Radiation Technolo-
ies of Instituto Superior Técnico. Analyses for JET were performed
n a chamber dedicated to fusion research, where samples, includ-
ng full JET tiles, contaminated with tritium (T) and beryllium (Be)
an be handled.
Elastic Backscattering Spectrometry (EBS) and Particle Induced
-ray Emission (PIXE) were performed with 2.3 MeV incident pro-
ons. RBS and NRA were performed using 3 He ions at an energy
f 2.3 MeV in order to measure the amounts of 2 H (D), Be and
. The D( 3 He, p) 4 He reaction was used to measure the D con-
ent, the 9 Be( 3 He, p x ) 11 B (x = 0,1,2,3) reactions [7] for Be and the
N. Catarino et al. / Nuclear Materials and Energy 12 (2017) 559–563 561
1
p
R
c
t
(
a
T
t
d
l
l
p
1
t
t
a
a
p
e
h
q
s
u
y
L
3
t
3
f
J
s
o
f
b
e
p
s
a
s
t
p
g
i
n
i
l
t
a
t
t
c
p
p
p
p
3
s
g
3
E
[
r
t
i
t
o
I
s
l
n
t
F
m
t
s
s
f
f
(
(
i
f
4
(
s
g
d
r
e
h
h
b
T
o
d
[
t
3
n
4
2
[
t
2
w
o
N
d
p
s
i
o
d
2 C( 3 He, p 0 ) 14 N reaction for 12 C. For thin deposits, the NRA data
rovide more sensitive and accurate results for Be and C than the
BS data, which are used for thick deposits. At 2.3 MeV the NRA
ross-section for carbon is very low, and in the case of thick films
he signal from C ( 12 C( 3 He, p 0 ) 14 N) overlaps with the Be signal
9 Be( 3 He, p 3 ) 11 B), limiting its detection.
The sample manipulator in the experimental chamber is fully
utomated and enables analysis over 150 mm along the surface.
his allows efficient measurement of whole JET tiles. The RBS par-
icle detector is located at a scattering angle of 150 ° The NRA
etector is placed at a 135 ° scattering angle and has an active
ayer with 1 mm thickness. A 140 μm thick Al stopping foil was se-
ected to allow the detection of D and Be protons from the 2 H( 3 He,
0 ) 4 He and
9 Be( 3 He, p x ) 11 B reactions [7] whilst stopping the
4 MeV α particles from the 9 Be( 3 He, α0 ) 8 Be reaction. Straggling in
he foil does not affect the measurements since it is the signal in-
egral that carries the information on the cross section. The X-rays
re detected by PIXE by means of a “Sirius 30” detector located at
scattering angle of 150 ° with a Mylar filter 350 μm thick.
The tiles were scanned using EBS, RBS, NRA and PIXE, along the
oloidal direction as indicated in Fig. 2 for Tile 1: spectra are taken
very 5 mm using a 1 mm beam spot size along the tile surface to
ave a complete picture of the composition.
The experimental data were analysed using the NDF code [8] to
uantify all the impurities present in the tiles. The sample compo-
ition is determined in a self-consistent way with PIXE data sim-
lated by means of LibCPIXE code [9] . The PIXE data were anal-
sed with GUPIX code [10] and the results used as input with NDF-
ibCPIXE.
. Results
The results are presented and discussed below for each of the
iles individually.
.1. Upper inner divertor (Tile 1)
On the W surface Be deposits more than 10 μm thick were
ound at the top of Tile 1 in the region s = 162–296. In the first
ET-ILW campaign this thick deposit was shown to be a layered
tructure, with varying Be and W concentrations probably due to
perations history [11] . The non-uniform deposition and the sur-
ace roughness complicates the interpretation of layered structures
y IBA, but the overall amount of deposited material is measured,
.g. the total areal densities of the chemical species. It should be
ointed out that thick films tend to cause proton energy disper-
ion, not proton particle loss, and some dispersion can be toler-
ted; the 2.3 MeV incident protons have insufficient energy to re-
olve the thickness of the Be deposit without error. The EBS data
ogether with PIXE and NRA give the concentration of the elements
resent in the layer. Depth profiles at each analysis point are inte-
rated to give the concentration along the surface of Be, D, C and O
n the first 5 × 10 19 at/cm
2 of ( ∼6 μm using the bulk densities and
ormalizing each density by the concentration of the correspond-
ng element); over this integration depth the beam doesn’t suffer
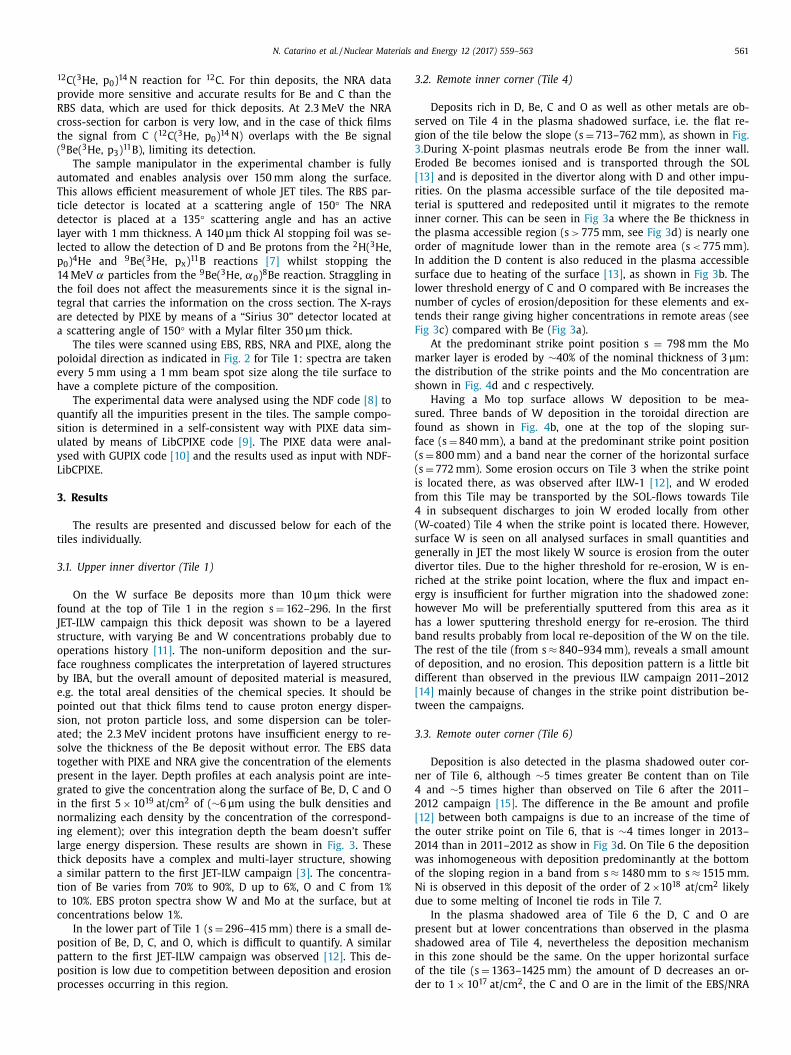
arge energy dispersion. These results are shown in Fig. 3 . These
hick deposits have a complex and multi-layer structure, showing
similar pattern to the first JET-ILW campaign [3] . The concentra-
ion of Be varies from 70% to 90%, D up to 6%, O and C from 1%
o 10%. EBS proton spectra show W and Mo at the surface, but at
oncentrations below 1%.
In the lower part of Tile 1 (s = 296–415 mm) there is a small de-
osition of Be, D, C, and O, which is difficult to quantify. A similar
attern to the first JET-ILW campaign was observed [12] . This de-
osition is low due to competition between deposition and erosion
rocesses occurring in this region.
.2. Remote inner corner (Tile 4)
Deposits rich in D, Be, C and O as well as other metals are ob-
erved on Tile 4 in the plasma shadowed surface, i.e. the flat re-
ion of the tile below the slope (s = 713–762 mm), as shown in Fig.
. During X-point plasmas neutrals erode Be from the inner wall.
roded Be becomes ionised and is transported through the SOL
13] and is deposited in the divertor along with D and other impu-
ities. On the plasma accessible surface of the tile deposited ma-
erial is sputtered and redeposited until it migrates to the remote
nner corner. This can be seen in Fig 3 a where the Be thickness in
he plasma accessible region (s > 775 mm, see Fig 3 d) is nearly one
rder of magnitude lower than in the remote area (s < 775 mm).
n addition the D content is also reduced in the plasma accessible
urface due to heating of the surface [13] , as shown in Fig 3 b. The
ower threshold energy of C and O compared with Be increases the
umber of cycles of erosion/deposition for these elements and ex-
ends their range giving higher concentrations in remote areas (see
ig 3 c) compared with Be ( Fig 3 a).
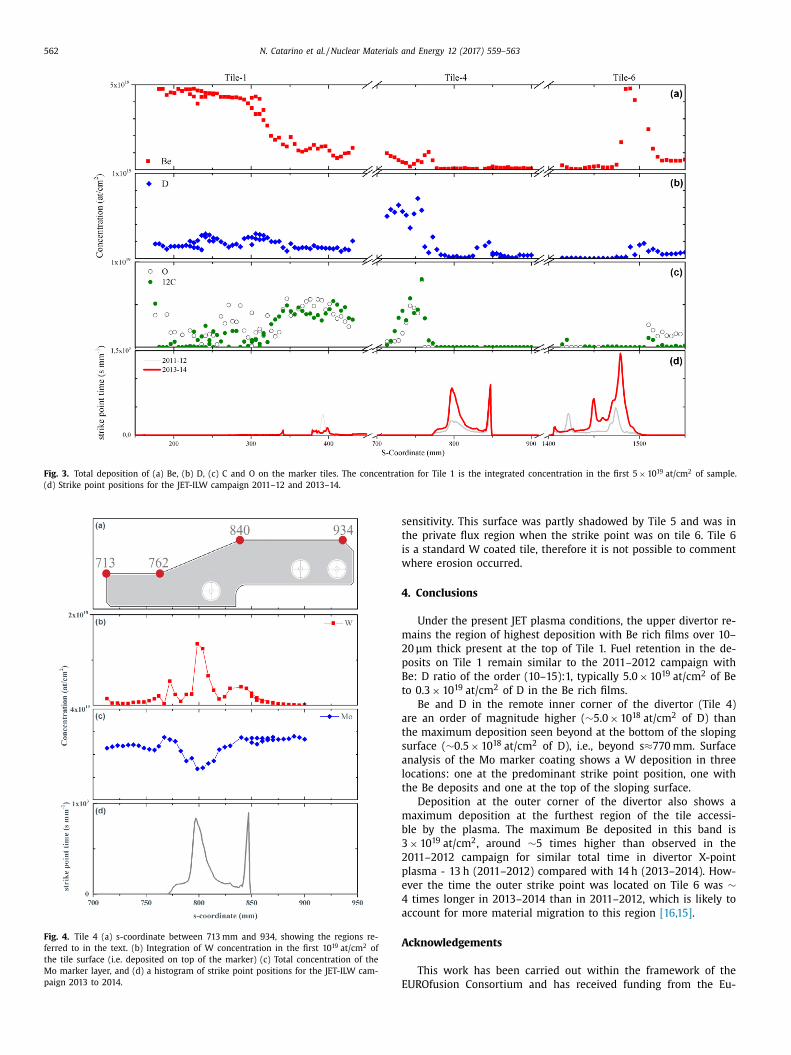
At the predominant strike point position s = 798 mm the Mo
arker layer is eroded by ∼40% of the nominal thickness of 3 μm:
he distribution of the strike points and the Mo concentration are
hown in Fig. 4 d and c respectively.
Having a Mo top surface allows W deposition to be mea-
ured. Three bands of W deposition in the toroidal direction are
ound as shown in Fig. 4 b, one at the top of the sloping sur-
ace (s = 840 mm), a band at the predominant strike point position
s = 800 mm) and a band near the corner of the horizontal surface
s = 772 mm). Some erosion occurs on Tile 3 when the strike point
s located there, as was observed after ILW-1 [12] , and W eroded
rom this Tile may be transported by the SOL-flows towards Tile
in subsequent discharges to join W eroded locally from other
W-coated) Tile 4 when the strike point is located there. However,
urface W is seen on all analysed surfaces in small quantities and
enerally in JET the most likely W source is erosion from the outer
ivertor tiles. Due to the higher threshold for re-erosion, W is en-
iched at the strike point location, where the flux and impact en-
rgy is insufficient for further migration into the shadowed zone:
owever Mo will be preferentially sputtered from this area as it
as a lower sputtering threshold energy for re-erosion. The third
and results probably from local re-deposition of the W on the tile.
he rest of the tile (from s ≈ 840–934 mm), reveals a small amount
f deposition, and no erosion. This deposition pattern is a little bit
ifferent than observed in the previous ILW campaign 2011–2012
14] mainly because of changes in the strike point distribution be-
ween the campaigns.
.3. Remote outer corner (Tile 6)
Deposition is also detected in the plasma shadowed outer cor-
er of Tile 6, although ∼5 times greater Be content than on Tile
and ∼5 times higher than observed on Tile 6 after the 2011–
012 campaign [15] . The difference in the Be amount and profile
12] between both campaigns is due to an increase of the time of
he outer strike point on Tile 6, that is ∼4 times longer in 2013–
014 than in 2011–2012 as show in Fig 3 d. On Tile 6 the deposition
as inhomogeneous with deposition predominantly at the bottom
f the sloping region in a band from s ≈ 1480 mm to s ≈ 1515 mm.
i is observed in this deposit of the order of 2 ×10 18 at/cm
2 likely
ue to some melting of Inconel tie rods in Tile 7.
In the plasma shadowed area of Tile 6 the D, C and O are
resent but at lower concentrations than observed in the plasma
hadowed area of Tile 4, nevertheless the deposition mechanism
n this zone should be the same. On the upper horizontal surface
f the tile (s = 1363–1425 mm) the amount of D decreases an or-
er to 1 × 10 17 at/cm
2 , the C and O are in the limit of the EBS/NRA
562 N. Catarino et al. / Nuclear Materials and Energy 12 (2017) 559–563
Fig. 3. Total deposition of (a) Be, (b) D, (c) C and O on the marker tiles. The concentration for Tile 1 is the integrated concentration in the first 5 × 10 19 at/cm
2 of sample.
(d) Strike point positions for the JET-ILW campaign 2011–12 and 2013–14.
Fig. 4. Tile 4 (a) s-coordinate between 713 mm and 934, showing the regions re-
ferred to in the text. (b) Integration of W concentration in the first 10 19 at/cm
2 of
the tile surface (i.e. deposited on top of the marker) (c) Total concentration of the
Mo marker layer, and (d) a histogram of strike point positions for the JET-ILW cam-
paign 2013 to 2014.
s
t
i
w
4
m
2
p
B
t
a
t
s
a
l
t
m
b
3
2
p
e
4
a
A
E
ensitivity. This surface was partly shadowed by Tile 5 and was in
he private flux region when the strike point was on tile 6. Tile 6
s a standard W coated tile, therefore it is not possible to comment
here erosion occurred.
. Conclusions
Under the present JET plasma conditions, the upper divertor re-
ains the region of highest deposition with Be rich films over 10–
0 μm thick present at the top of Tile 1. Fuel retention in the de-
osits on Tile 1 remain similar to the 2011–2012 campaign with
e: D ratio of the order (10–15):1, typically 5.0 × 10 19 at/cm
2 of Be
o 0.3 × 10 19 at/cm
2 of D in the Be rich films.
Be and D in the remote inner corner of the divertor (Tile 4)
re an order of magnitude higher ( ∼5.0 × 10 18 at/cm
2 of D) than
he maximum deposition seen beyond at the bottom of the sloping
urface ( ∼0.5 × 10 18 at/cm
2 of D), i.e., beyond s ≈770 mm. Surface
nalysis of the Mo marker coating shows a W deposition in three
ocations: one at the predominant strike point position, one with
he Be deposits and one at the top of the sloping surface.
Deposition at the outer corner of the divertor also shows a
aximum deposition at the furthest region of the tile accessi-
le by the plasma. The maximum Be deposited in this band is
× 10 19 at/cm
2 , around ∼5 times higher than observed in the
011–2012 campaign for similar total time in divertor X-point
lasma - 13 h (2011–2012) compared with 14 h (2013–2014). How-
ver the time the outer strike point was located on Tile 6 was ∼ times longer in 2013–2014 than in 2011–2012, which is likely to
ccount for more material migration to this region [16,15] .
cknowledgements
This work has been carried out within the framework of the
UROfusion Consortium and has received funding from the Eu-
N. Catarino et al. / Nuclear Materials and Energy 12 (2017) 559–563 563
r
a
d
w
C
P
R
[
[
[
[
[
[
atom research and training programme 2014–2018 under grant
greement No 633053 . The views and opinions expressed herein
o not necessarily reflect those of the European Commission. This
ork was also part-funded by Portuguese FCT - Fundação para a
iência e a Tecnologia , under grant PD/BD/52411/2013 (PD-F AP-
LAuSE) and through project Pest-OE/SADG/LA0010/2013.
eference
[1] S. Brezinsek , J. Nucl. Mater. 463 (2015) 11–21 . [2] K. Heinola , A. Widdowson , J. Likonen , E. Alves , A. Baron-Wiechec , N.P. Bar-
radas , S. Brezinsek , N. Catarino , J.P. Coad , S. Koivuranta , S. Krat , G.F. Matthews ,
M. Mayer , P. Petersson , J.-E. Contributors , Phys. Scr. T167 (2016) 14075 . [3] A . Baron-Wiechec , A . Widdowson , E. Alves , C.F. Ayres , N.P. Barradas , S. Brezin-
sek , J.P. Coad , N. Catarino , K. Heinola , J. Likonen , G.F. Matthews , M. Mayer ,P. Petersson , M. Rubel , W. van Renterghem , I. Uytdenhouwen , J. Nucl. Mater.
463 (2015) 157–161 . [4] A. Widdowson , E. Alves , C.F. Ayres , A. Baron-Wiechec , S. Brezinsek , N. Catarino ,
J.P. Coad , K. Heinola , J. Likonen , G.F. Matthews , M. Mayer , M. Rubel , Phys. Scr.T159 (2014) 14010 .
[5] M. Rubel , J.P. Coad , A. Widdowson , G.F. Matthews , H.G. Esser , T. Hirai , J. Liko-
nen , J. Linke , C.P. Lungu , M. Mayer , L. Pedrick , C. Ruset , J. Nucl. Mater 438(2013) S1204–S1207 .
[6] C. Ruset , E. Grigore , I. Munteanu , H. Maier , H. Greuner , C. Hopf , V. Phylipps ,G.F. Matthews , Fusion Eng. Des. 84 (2009) 1662–1665 .
[7] N.P. Barradas , N. Catarino , R. Mateus , S. Magalhães , E. Alves , Z. Siketi ́c ,I.B. Radovi ́c , Nucl. Instruments Methods Phys. Res. Sect. B Beam Interact. Mater.
Atoms 346 (2015) 21–25 . [8] N.P. Barradas , C. Jeynes , Nucl. Instruments Methods Phys. Res. Sect. B Beam
Interact. Mater. Atoms 266 (2008) 1875–1879 . [9] C. Pascual-Izarra , N.P. Barradas , M.A. Reis , Nucl. Instruments Methods Phys. Res.
Sect. B Beam Interact. Mater. Atoms 249 (2006) 820–822 . 10] J.A. Maxwell , W.J. Teesdale , J.L. Campbell , Nucl. Instruments Methods Phys. Res.
Sect. B Beam Interact. Mater. Atoms 95 (1995) 407–421 .
[11] H. Bergsåker , I. Bykov , Y. Zhou , P. Petersson , G. Possnert , J. Likonen , J. Petters-son , S. Koivuranta , A. Widdowson , Phys. Scr. T167 (2016) 14061 .
12] M. Mayer , S. Krat , W. Van Renterghem , A. Baron-Wiechec , S. Brezinsek ,I. Bykov , J.P. Coad , Y. Gasparyan , K. Heinola , J. Likonen , A. Pisarev , C. Ruset ,
G. de Saint-Aubin , A. Widdowson , Phys. Scr. T167 (2016) 14051 . 13] K. Sugiyama , C. Porosnicu , W. Jacob , I. Jepu , C.P. Lungu , Nucl. Mater. Energy 6
(2016) 1–9 .
14] K. Heinola , A. Widdowson , J. Likonen , E. Alves , A. Baron-Wiechec , N.P. Barradas ,S. Brezinsek , N. Catarino , J.P. Coad , S. Koivuranta , G.F. Matthews , M. Mayer ,
P. Petersson , J. Nucl. Mater. 463 (2015) 961–965 . 15] P. Petersson , M. Rubel , H.G. Esser , J. Likonen , S. Koivuranta , A. Widdowson , J.
Nucl. Mater. 463 (2015) 814–817 . 16] A. Widdowson, E. Alves, A. Baron-Wiechec, N.P. Barradas, N. Catarino, J.P. Coad,
V. Corregidor, A. Garcia-Carrasco, K. Heinola, S. Koivuranta, S. Krat, A. Lahtinen,
J. Likonen, M. Mayer, P. Petersson, S. van Boxel, Nucl. Mater. Energy (n.d.) TheseProceedings (2016).