Embed Size (px)
Citation preview
Nuclear winter revisited with a modern climate model and current
nuclear arsenals: Still catastrophic consequences
Alan Robock,1 Luke Oman,1,2 and Georgiy L. Stenchikov1
Received 8 November 2006; revised 2 April 2007; accepted 27 April 2007; published 6 July 2007.
[1] Twenty years ago, the results of climate model simulations of the response to smokeand dust from a massive nuclear exchange between the superpowers could be summarizedas ‘‘nuclear winter,’’ with rapid temperature, precipitation, and insolation drops at thesurface that would threaten global agriculture for at least a year. The global nuclear arsenalhas fallen by a factor of three since then, but there has been an expansion of the number ofnuclear weapons states, with additional states trying to develop nuclear arsenals. We use amodern climate model to reexamine the climate response to a range of nuclear wars,producing 50 and 150 Tg of smoke, using moderate and large portions of the currentglobal arsenal, and find that there would be significant climatic responses to all thescenarios. This is the first time that an atmosphere-ocean general circulation model hasbeen used for such a simulation and the first time that 10-year simulations have beenconducted. The response to the 150 Tg scenario can still be characterized as ‘‘nuclearwinter,’’ but both produce global catastrophic consequences. The changes are morelong-lasting than previously thought, however, because the new model, NationalAeronautics and Space Administration Goddard Institute for Space Studies ModelE, isable to represent the atmosphere up to 80 km, and simulates plume rise to the middle andupper stratosphere, producing a long aerosol lifetime. The indirect effects of nuclearweapons would have devastating consequences for the planet, and continued nucleararsenal reductions will be needed before the threat of nuclear winter is removedfrom the Earth.
Citation: Robock, A., L. Oman, and G. L. Stenchikov (2007), Nuclear winter revisited with a modern climate model and current
nuclear arsenals: Still catastrophic consequences, J. Geophys. Res., 112, D13107, doi:10.1029/2006JD008235.
1. Introduction
[2] As first suggested by Crutzen and Birks [1982],climate model simulations by Turco et al. [1983] andAleksandrov and Stenchikov [1983] showed that a full-scalenuclear war would produce surface temperature, precipita-tion, and insolation reductions so large that the climaticconsequences were described as ‘‘nuclear winter.’’ Soonafter the world was confronted with the prospect of potentialindirect effects of nuclear war much larger than the directeffects, and starvation of billions of people from thecollapse of world agriculture, the arms race and cold warended. Since then, the global nuclear arsenal has beenreduced by a factor of three.[3] Prompted by the recent work of Toon et al. [2007] and
Robock et al. [2007], who showed that a regional nuclearconflict using 100 Hiroshima-size (15 kt) nuclear weapons,only 0.03% of the explosive power of the current globalarsenal, would produce climate change unprecedented in
human history, we revisit the nuclear winter issue with amodern climate model. We ask the question of whether thecurrent nuclear arsenal could still produce a nuclear winter.[4] All previous simulations of the climatic response to
the smoke generated from a nuclear war were limited bycomputer power and the available climate models. Asshown in Table 1, each simulation addressed certain aspectsof the climate model response with simple climate modelsor with short simulations of low-resolution atmosphericgeneral circulation models (GCMs), but now for the firsttime we use a coupled atmosphere-ocean GCM run contin-uously for multiple 10-year simulations and with a modeltop at the mesopause.[5] Some critics of previous nuclear winter results
suggested that once uncertainties were addressed, theseverity of the results would decrease. Because of theuse of the term ‘‘nuclear autumn’’ by Thompson andSchneider [1986], even though the authors made clear thatthe climatic consequences would be large, in policy circlesthe theory of nuclear winter is considered by some to havebeen exaggerated and disproved [e.g., Martin, 1988]. Sowe are motivated to include simulations of mechanismsnot previously addressed, to see whether prior resultswould hold up. However, unknowns by definition areunknown, and it turns out that not only do we still get anuclear winter using the previous baseline case, but that
JOURNAL OF GEOPHYSICAL RESEARCH, VOL. 112, D13107, doi:10.1029/2006JD008235, 2007ClickHere
for
FullArticle
1Department of Environmental Sciences, Rutgers University, NewBrunswick, New Jersey, USA.
2Now at Department of Earth and Planetary Sciences, Johns HopkinsUniversity, Baltimore, Maryland, USA.
Copyright 2007 by the American Geophysical Union.0148-0227/07/2006JD008235$09.00
D13107 1 of 14
the climate response is much longer than that of earlierresults, and current nuclear arsenals can still produce anuclear winter.
2. Previous Nuclear Winter Simulations
[6] Before describing our work, we summarize the workdone before (Table 1), and the limitations of each of thesestudies. Pittock et al. [1986], Turco et al. [1990], and Saganand Turco [1990] summarized much of the early work, andwe know of no climate modeling done on this topic inalmost 20 years, other than our other recent work.[7] Crutzen and Birks [1982] first suggested that the
smoke from fires and dust from the surface generated bynuclear explosions from a full-scale nuclear war betweenthe United States and the Soviet Union would be soextensive as to cause global climate change. The firstclimate model simulation of the response, by Aleksandrovand Stenchikov [1983], used a very low resolution (12� �15� lat-lon) atmospheric GCM with only 2 levels in thevertical coupled to a mixed-layer ocean and annual averagesolar radiation, and conducted one 400-day simulation.Forced by the smoke estimated from a scenario using about1/3 of the then-current arsenal, about 150 Tg, they foundlarge surface temperature reductions, to temperatures farbelow freezing, and produced an overturning atmosphericcirculation cell transporting the aerosols globally.[8] Turco et al. [1983] used a single column model with
no surface heat capacity, intended to simulate midcontinentconditions. Looking at a large number of different scenarios,they were able to model the detailed vertical evolution ofclimate response, but were not able to look at dynamicalresponses or the spatial distribution of climate change. Theyalso gave the name ‘‘nuclear winter’’ to this work, capturingthe forcing and response in a two-word phrase.[9] Covey et al. [1984] and Thompson [1985] used the
National Center for Atmospheric Research atmosphericGCM for short runs and looked at the seasonal cycle ofclimate response. Their results validated the earlier GCMresults of Aleksandrov and Stenchikov [1983]. Robock[1984] used an energy-balance model with a mixed-layerocean, and was the first to examine the seasonal cycle andinterannual responses. Using the assumed short atmosphericsmoke lifetime from Turco et al. [1983], he nevertheless
found multiannual cooling prolonged by snow and sea icefeedbacks. This result was later validated with GCMsimulations using a mixed-layer ocean [Schneider andThompson, 1988; Ghan, 1991]. Malone et al. [1986]showed that lofting of aerosols in the summer due to solarheating would prolong their lifetime, because in thestratosphere they are removed from precipitation scaveng-ing, but used a model with a low top of the atmosphere(32 km) and were only able to run it for 40 days.[10] Ghan et al. [1988] used a simple two-layer atmo-
spheric GCM to investigate the short-term (1 month)response to many different scenarios of different smokeproperties and different model parameterizations. Pittock etal. [1989] investigated short-term hydrological effects forsmall smoke amounts with a specified optical depth of 0.2,but based this on previous results which underestimated thesmoke lifetimes.[11] Turco et al. [1990] showed that the original Turco et
al. [1983] results were robust, and described how subse-quent work filled in the details of the emissions of smoke,smoke properties, and climate response. Our experimentextends the time and sophistication of climate model capa-bilities, and shows an extended timescale of climate re-sponse not possible with previous models. However, thebasic conclusion that a large-scale nuclear conflict wouldhave devastating climatic consequences is not only sup-ported, but strengthened.
3. Climate Model
[12] We conducted climate model simulations with astate-of-the-art general circulation model, ModelE fromthe National Aeronautics and Space Administration God-dard Institute for Space Studies [Schmidt et al., 2006],which includes a module to calculate the transport andremoval of aerosol particles [Koch et al., 2006]. Theatmospheric model is connected to a full ocean generalcirculation model with calculated sea ice, thus allowing theocean to respond quickly at the surface and on yearlytimescales in the deeper ocean. We run the atmosphericportion of the model at 4� � 5� latitude-longitude resolu-tion, with 23 vertical layers extending to a model top of80 km. The coupled oceanic general circulation model
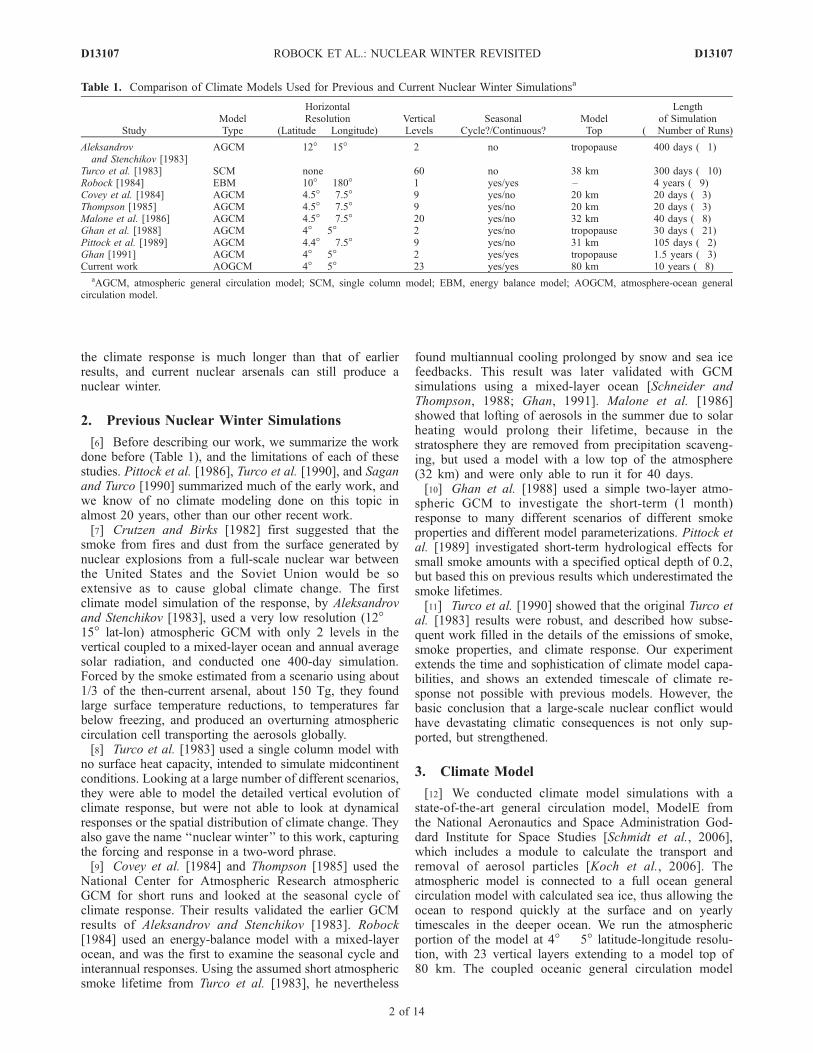
Table 1. Comparison of Climate Models Used for Previous and Current Nuclear Winter Simulationsa
StudyModelType
HorizontalResolution
(Latitude � Longitude)VerticalLevels
SeasonalCycle?/Continuous?
ModelTop
Lengthof Simulation
(� Number of Runs)
Aleksandrovand Stenchikov [1983]
AGCM 12� � 15� 2 no tropopause 400 days (�1)
Turco et al. [1983] SCM none 60 no 38 km 300 days (�10)Robock [1984] EBM 10� � 180� 1 yes/yes – 4 years (�9)Covey et al. [1984] AGCM 4.5� � 7.5� 9 yes/no 20 km 20 days (�3)Thompson [1985] AGCM 4.5� � 7.5� 9 yes/no 20 km 20 days (�3)Malone et al. [1986] AGCM 4.5� � 7.5� 20 yes/no 32 km 40 days (�8)Ghan et al. [1988] AGCM 4� � 5� 2 yes/no tropopause 30 days (�21)Pittock et al. [1989] AGCM 4.4� � 7.5� 9 yes/no 31 km 105 days (�2)Ghan [1991] AGCM 4� � 5� 2 yes/yes tropopause 1.5 years (�3)Current work AOGCM 4� � 5� 23 yes/yes 80 km 10 years (�8)
aAGCM, atmospheric general circulation model; SCM, single column model; EBM, energy balance model; AOGCM, atmosphere-ocean generalcirculation model.
D13107 ROBOCK ET AL.: NUCLEAR WINTER REVISITED
2 of 14
D13107
[Russell et al., 1995] has 13 layers and also a 4� � 5�latitude-longitude resolution.[13] This climate model has been tested extensively in
global warming experiments [Hansen et al., 2005; Schmidtet al., 2006] and to examine the effects of volcanic eruptionson climate. The climate model (with a mixed-layer ocean)does an excellent job of modeling the climatic response tothe 1783 Laki [Oman et al., 2006b] and the 1912 Katmai[Oman et al., 2005] volcanic eruptions. We have also usedthis model to simulate the transport and removal of sulfateaerosols from tropical and high-latitude volcanic eruptions[Oman et al., 2006a], and have shown that it does a goodjob of simulating the lifetime and distribution of thevolcanic aerosols. In the stratosphere, these aerosols havean e-folding residence time of 12 months in the model, inexcellent agreement with observations.[14] The aerosol module [Koch et al., 2006] accounts for
black carbon particles. We assigned an effective radius of0.1 mm to the soot particles, a standard value based onobservations. At visible wavelengths, we assign the follow-ing optical properties to the black carbon particles: massextinction coefficient of 5.5 m2/g, single scattering albedoof 0.64, and mass absorption coefficient of 2.0 m2/g. Theseare typical of a mixture of black soot, smoke, and dust thatwould be injected into the atmosphere using the baselinescenario of Turco et al. [1983].[15] While Warren and Wiscombe [1985] and Ledley and
Thompson [1986] suggested that soot falling on sea icewould increase the albedo and negate some of the coolingfrom a massive atmospheric aerosol loading, Vogelmann etal. [1988] used the Robock [1984] energy-balance climatemodel and showed that this effect would only be importantwith enough solar insolation to make snow and ice albedoimportant. By the time the atmosphere was clear enough,Vogelmann et al. showed that clean snow would have fallenon the dirty snow, making the effect small. Nevertheless, weincluded this feedback in the runs presented here.[16] We conducted two 10-year runs, one with 150 Tg of
smoke and one with 50 Tg of smoke, injected into the uppertroposphere (300–150 mbar) over a one-week period start-ing on 15 May spread over all the grid boxes over the 48United States and over Russia. While Turco et al. [1983]used 225 Tg of smoke for their baseline case and Covey etal. [1984] used 200 Tg of smoke, we decided to use twoscenarios that would be possible today. Turco et al. [1990]
give a range of 20–290 Tg of smoke injection over theNorthern Hemisphere, and our 150 Tg case is just in themiddle of this range. We conducted a 30-year control runwith no smoke aerosols and these two 10-year simulationswith smoke, starting from arbitrary initial conditions. Withsuch a large forcing, chaotic weather variations wouldproduce very small changes compared to the large response,so we do not produce an ensemble of runs. This wasverified with a much smaller forcing of 5 Tg of aerosolsin our earlier work [Robock et al., 2007].[17] The 5 Tg case [Robock et al., 2007] differed from the
current 50 Tg and 150 Tg cases in several ways in additionto the amount of smoke. In the 5 Tg case, all the aerosolswere put into the atmosphere during a 1-day period into onemodel grid box at 30�N, 70�E. While also put into the 300–150 mbar layer, they were put into higher model layers forthe 5 Tg case, as this layer is at a higher elevation in lowerlatitudes. In addition, the optical properties of the blackcarbon aerosols were set to those of pure smoke, as thatexperiment was designed to study the effects of smoke fromcity targets. The mass extinction coefficient was 9.0 m2/gand the single scattering albedo was 0.31, so the massabsorption coefficient was 6.21 m2/g. Thus per unit mass,the aerosols in the 5 Tg case would be expected to absorbmore solar radiation, producing more lofting.[18] We do not conduct detailed new studies of the smoke
and dust emissions from nuclear attacks here. Rather, wechose emissions based on previous studies so as to make ourresults comparable to them. Toon et al. [2007] point out thatcities around the world have grown in the past 20 years, sothat we would expect smoke emissions to be larger thanbefore for the same targets. We encourage new analyses ofthe exact amount of smoke that would result, but it isbeyond the scope of this paper. Roughly 150 Tg would beemitted by the use of the entire current global nucleararsenal, with 5000 Mt explosive power, about 95% ofwhich is in the arsenals of the United States and Russia(Table 2), and 50 Tg would be emitted by the use of 1/3 ofthe current nuclear arsenal.
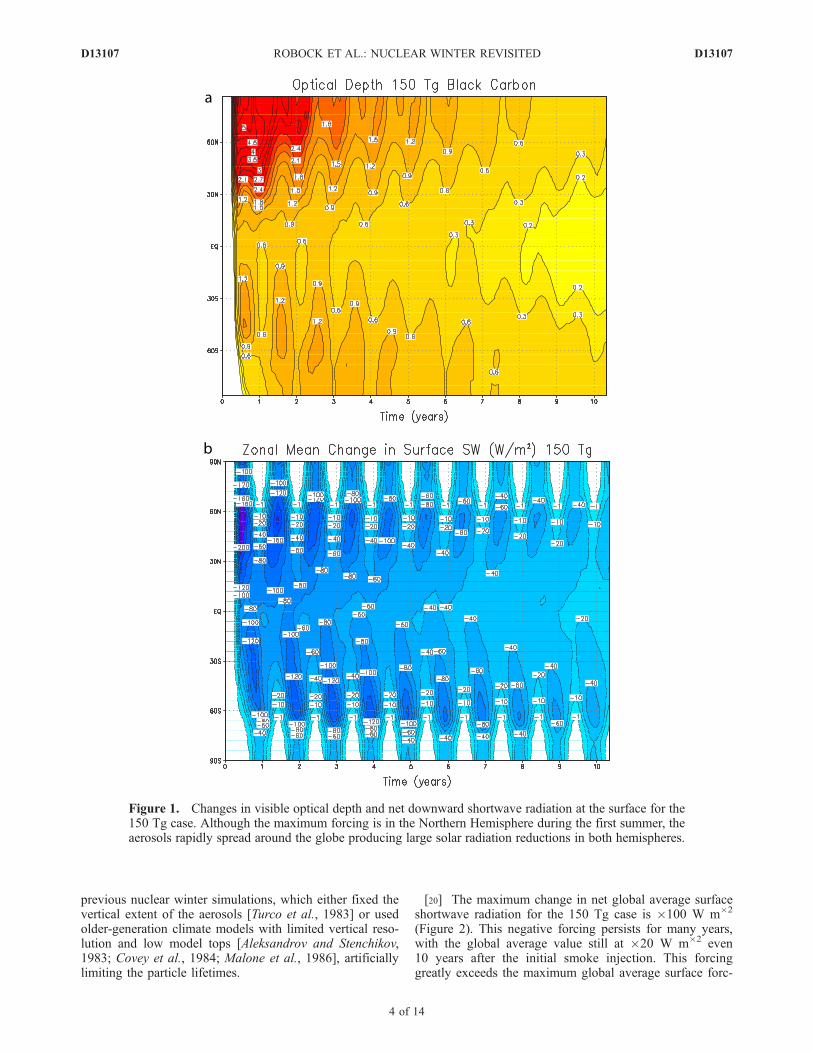
4. Results for the 150 Tg Case
[19] As found by Robock et al. [2007] for a 5 Tg case, theblack carbon particles in the aerosol layer for the 150 Tgcase are heated by absorption of shortwave radiation andlofted into the upper stratosphere. The aerosols quicklyspread globally and produce a long-lasting climate forcing(Figure 1). They end up much higher than is typical ofweakly absorbing volcanic sulfate aerosols, which typicallyare just above the tropopause [Stenchikov et al., 1998]. As aresult, the soot aerosols have a very long residence time andcontinue to affect surface climate for more than a decade.The mass e-folding time for the smoke is 4.6 years, ascompared to 1 year for typical volcanic eruptions [Oman etal., 2006a] and 1 week for tropospheric aerosols. After4.6 years, the e-folding time is reduced, but is still longerthan that of volcanic aerosols. In addition to the lofting ofthe smoke by solar absorption, another reason for thisdifference is that volcanic sulfate aerosols are larger, withan effective radius of 0.5 mm, and thus they have a highersettling velocity than the smaller smoke aerosols. This longsmoke aerosol lifetime is different from results found in
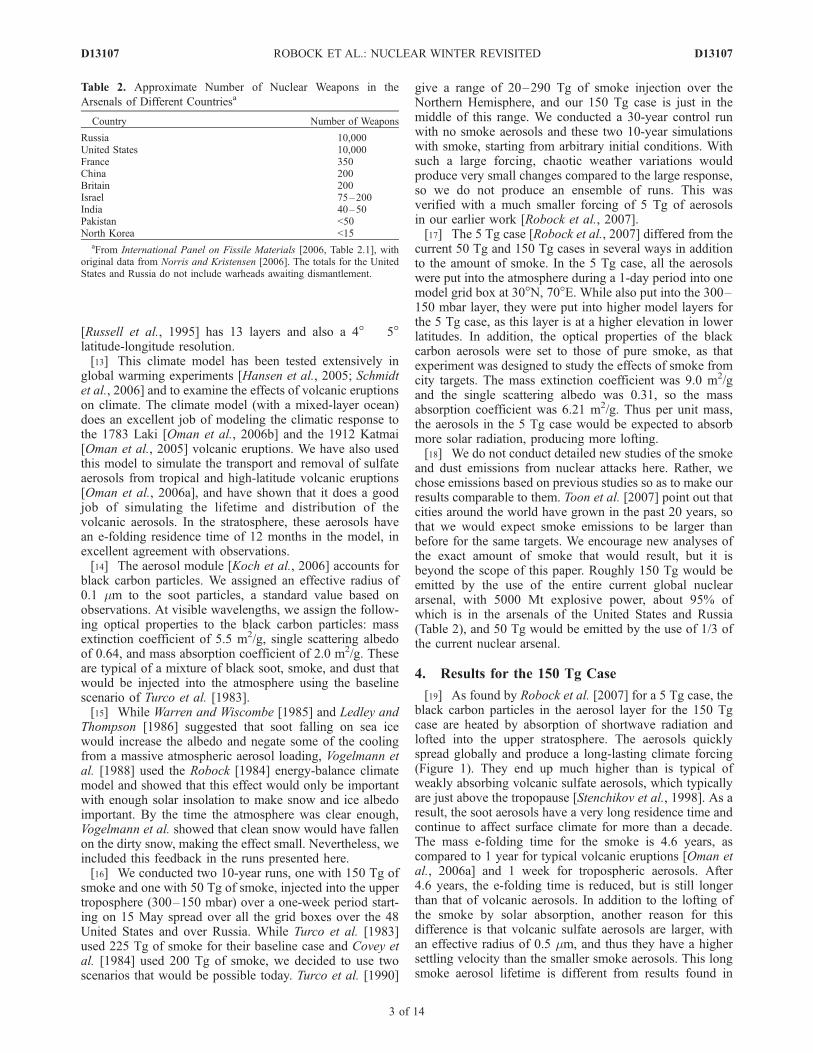
Table 2. Approximate Number of Nuclear Weapons in the
Arsenals of Different Countriesa
Country Number of Weapons
Russia 10,000United States 10,000France 350China 200Britain 200Israel 75–200India 40–50Pakistan <50North Korea <15
aFrom International Panel on Fissile Materials [2006, Table 2.1], withoriginal data from Norris and Kristensen [2006]. The totals for the UnitedStates and Russia do not include warheads awaiting dismantlement.
D13107 ROBOCK ET AL.: NUCLEAR WINTER REVISITED
3 of 14
D13107
previous nuclear winter simulations, which either fixed thevertical extent of the aerosols [Turco et al., 1983] or usedolder-generation climate models with limited vertical reso-lution and low model tops [Aleksandrov and Stenchikov,1983; Covey et al., 1984; Malone et al., 1986], artificiallylimiting the particle lifetimes.
[20] The maximum change in net global average surfaceshortwave radiation for the 150 Tg case is �100 W m�2
(Figure 2). This negative forcing persists for many years,with the global average value still at �20 W m�2 even10 years after the initial smoke injection. This forcinggreatly exceeds the maximum global average surface forc-
Figure 1. Changes in visible optical depth and net downward shortwave radiation at the surface for the150 Tg case. Although the maximum forcing is in the Northern Hemisphere during the first summer, theaerosols rapidly spread around the globe producing large solar radiation reductions in both hemispheres.
D13107 ROBOCK ET AL.: NUCLEAR WINTER REVISITED
4 of 14
D13107
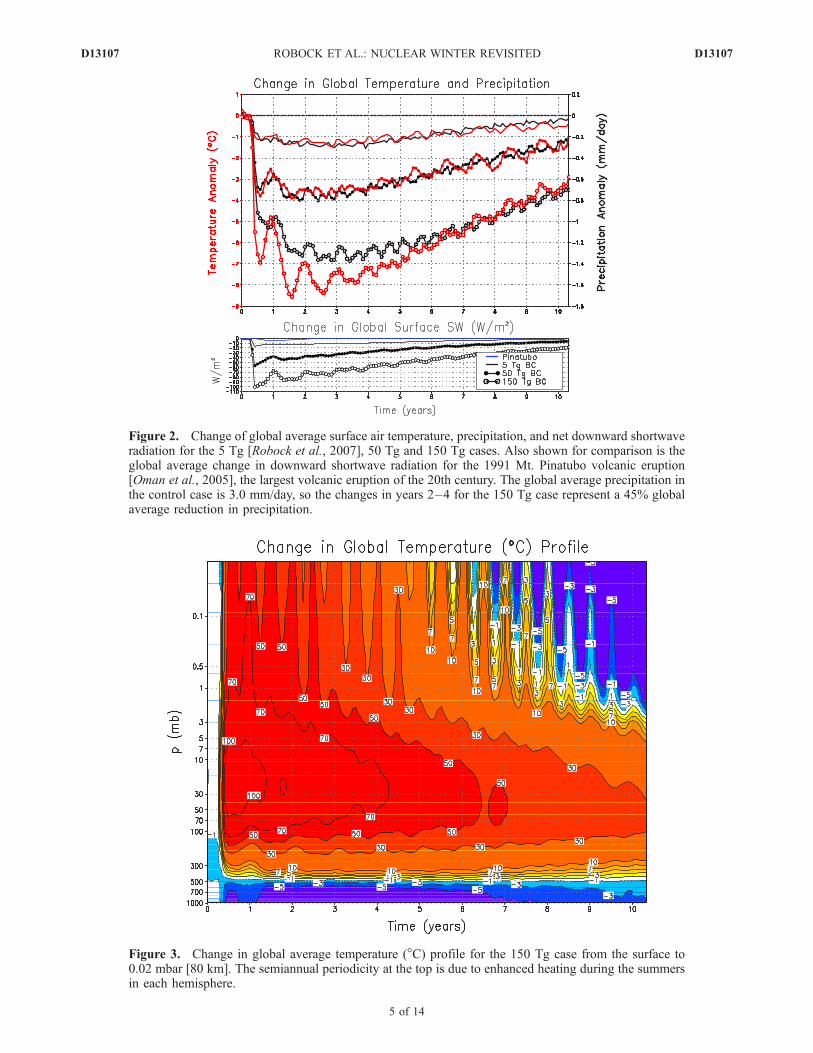
Figure 2. Change of global average surface air temperature, precipitation, and net downward shortwaveradiation for the 5 Tg [Robock et al., 2007], 50 Tg and 150 Tg cases. Also shown for comparison is theglobal average change in downward shortwave radiation for the 1991 Mt. Pinatubo volcanic eruption[Oman et al., 2005], the largest volcanic eruption of the 20th century. The global average precipitation inthe control case is 3.0 mm/day, so the changes in years 2–4 for the 150 Tg case represent a 45% globalaverage reduction in precipitation.
Figure 3. Change in global average temperature (�C) profile for the 150 Tg case from the surface to0.02 mbar [80 km]. The semiannual periodicity at the top is due to enhanced heating during the summersin each hemisphere.
D13107 ROBOCK ET AL.: NUCLEAR WINTER REVISITED
5 of 14
D13107
ing of �4 W m�2 for the 1991 Mt. Pinatubo volcaniceruption [Kirchner et al., 1999; Oman et al., 2005], thelargest of the 20th century, also shown in Figure 2. Thevolcanic forcing disappeared with an e-folding time of only1 year, and during the first year averaged �3.5 W m�2
(Figure 2).[21] The effects of the smoke cloud on surface tempera-
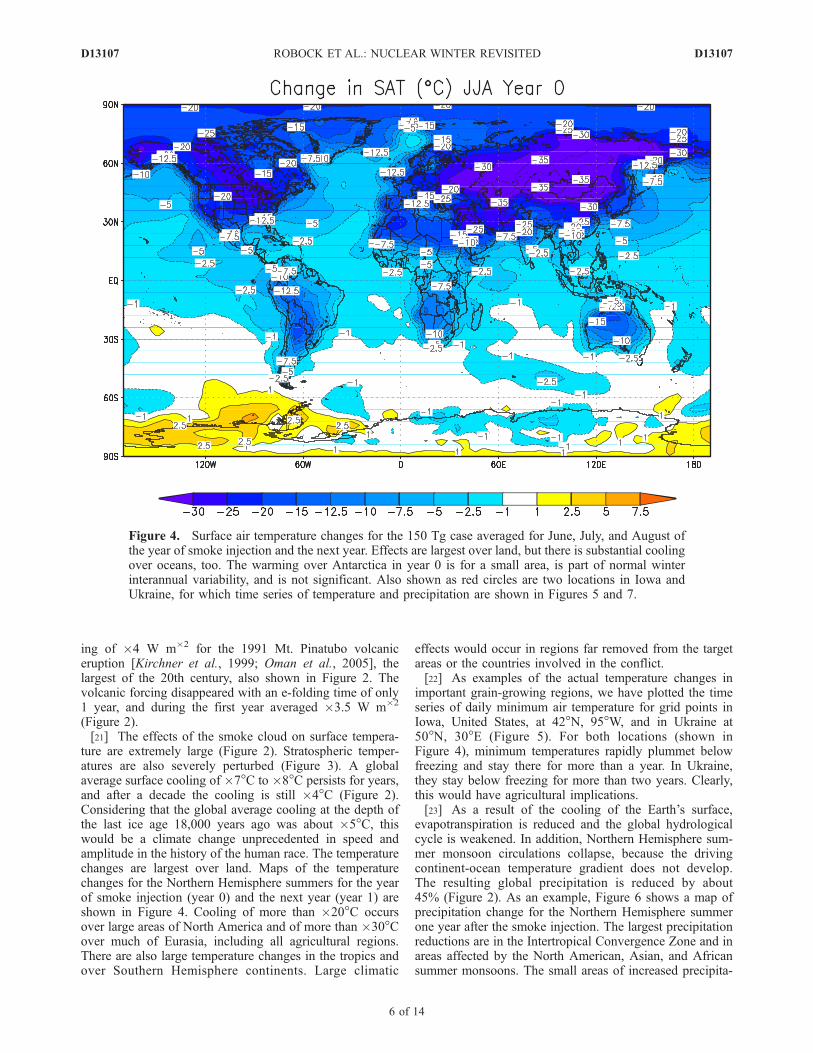
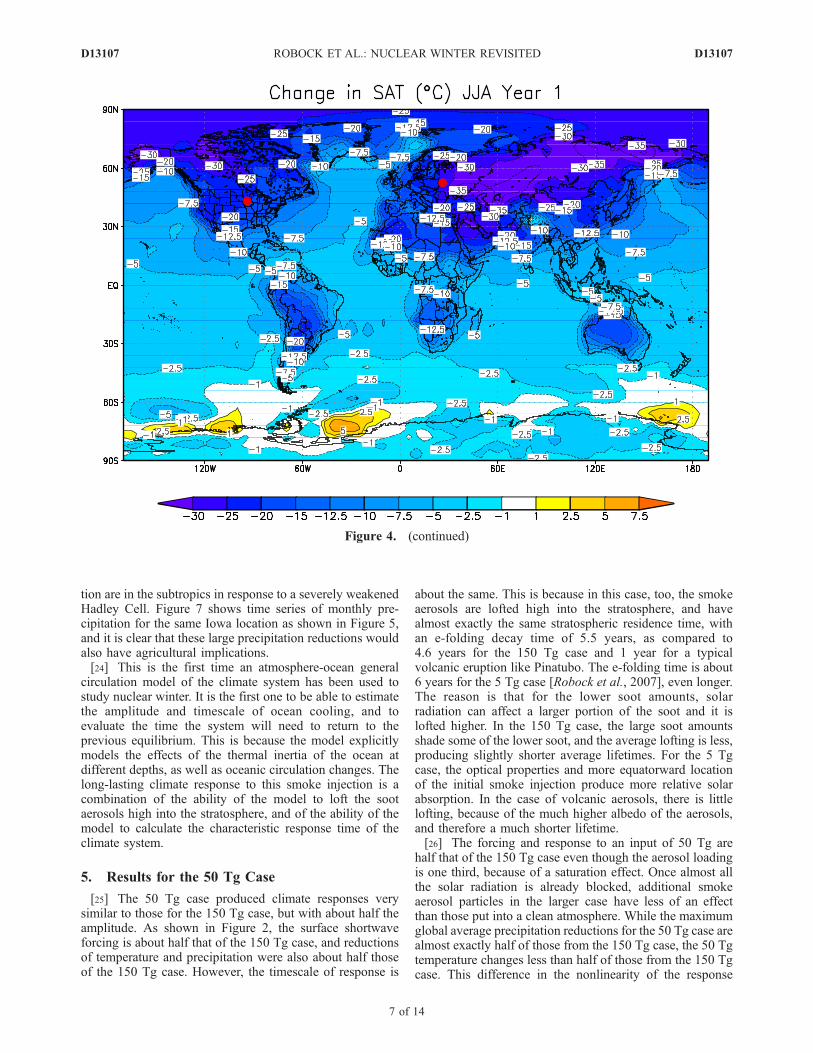
ture are extremely large (Figure 2). Stratospheric temper-atures are also severely perturbed (Figure 3). A globalaverage surface cooling of �7�C to �8�C persists for years,and after a decade the cooling is still �4�C (Figure 2).Considering that the global average cooling at the depth ofthe last ice age 18,000 years ago was about �5�C, thiswould be a climate change unprecedented in speed andamplitude in the history of the human race. The temperaturechanges are largest over land. Maps of the temperaturechanges for the Northern Hemisphere summers for the yearof smoke injection (year 0) and the next year (year 1) areshown in Figure 4. Cooling of more than �20�C occursover large areas of North America and of more than �30�Cover much of Eurasia, including all agricultural regions.There are also large temperature changes in the tropics andover Southern Hemisphere continents. Large climatic
effects would occur in regions far removed from the targetareas or the countries involved in the conflict.[22] As examples of the actual temperature changes in
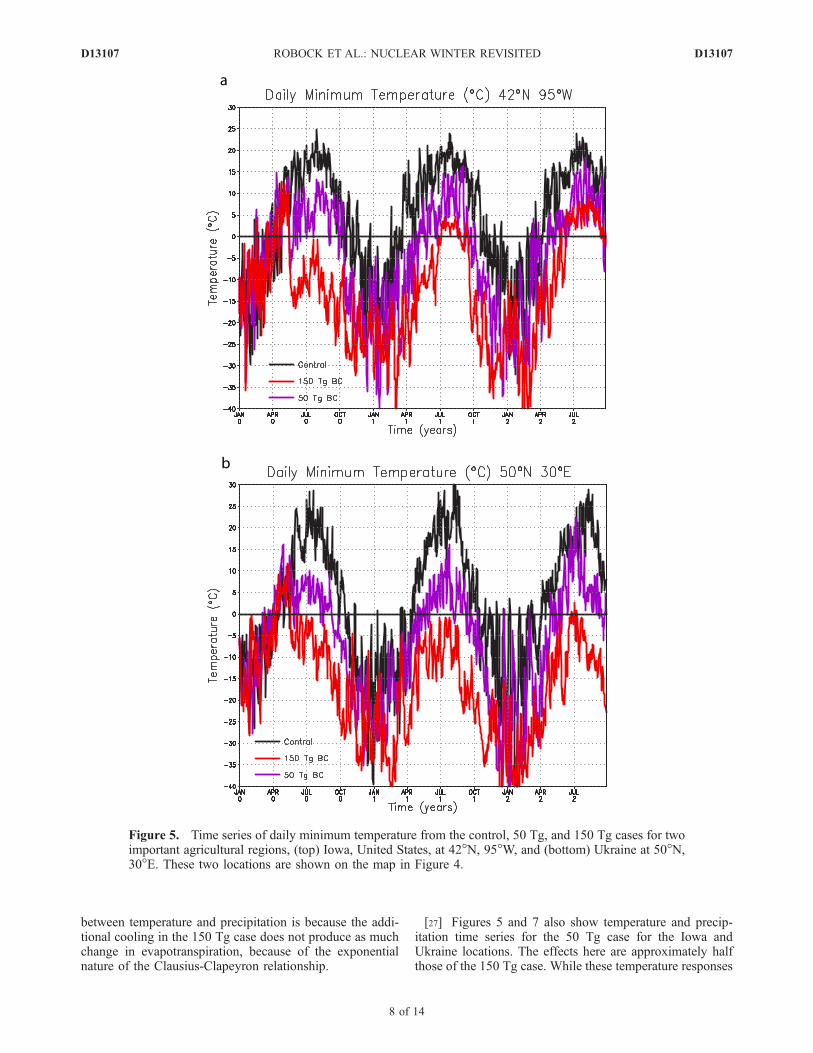
important grain-growing regions, we have plotted the timeseries of daily minimum air temperature for grid points inIowa, United States, at 42�N, 95�W, and in Ukraine at50�N, 30�E (Figure 5). For both locations (shown inFigure 4), minimum temperatures rapidly plummet belowfreezing and stay there for more than a year. In Ukraine,they stay below freezing for more than two years. Clearly,this would have agricultural implications.[23] As a result of the cooling of the Earth’s surface,
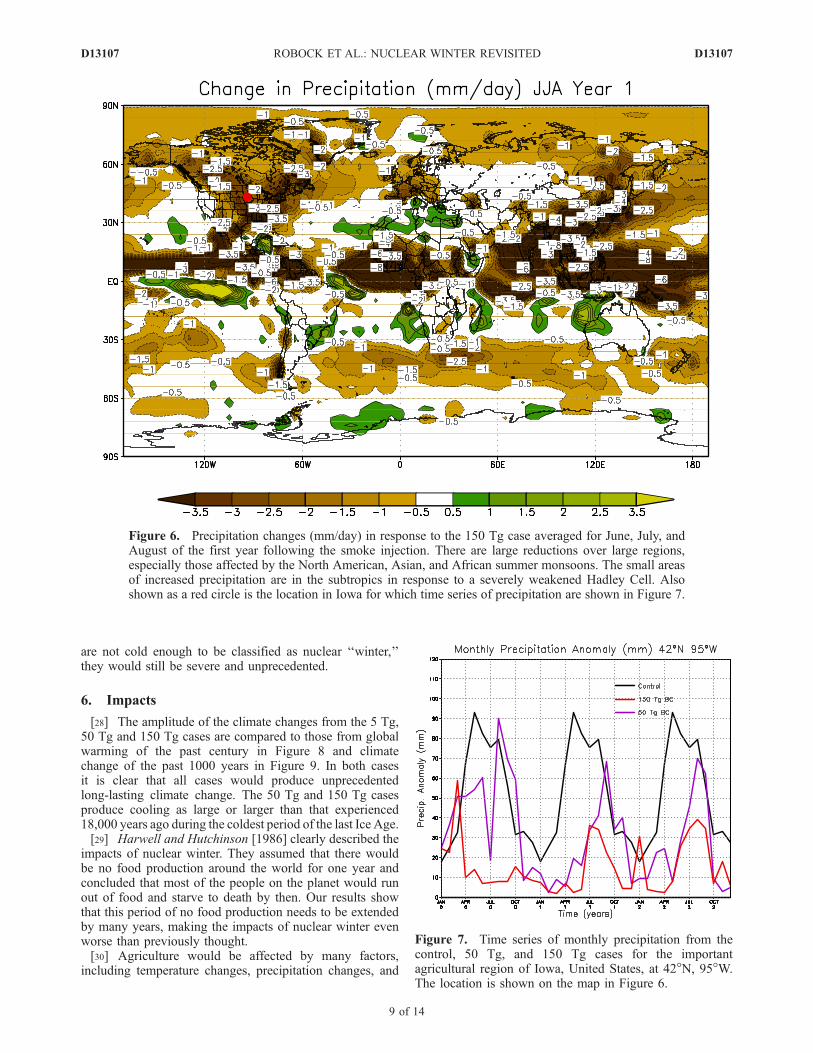
evapotranspiration is reduced and the global hydrologicalcycle is weakened. In addition, Northern Hemisphere sum-mer monsoon circulations collapse, because the drivingcontinent-ocean temperature gradient does not develop.The resulting global precipitation is reduced by about45% (Figure 2). As an example, Figure 6 shows a map ofprecipitation change for the Northern Hemisphere summerone year after the smoke injection. The largest precipitationreductions are in the Intertropical Convergence Zone and inareas affected by the North American, Asian, and Africansummer monsoons. The small areas of increased precipita-
Figure 4. Surface air temperature changes for the 150 Tg case averaged for June, July, and August ofthe year of smoke injection and the next year. Effects are largest over land, but there is substantial coolingover oceans, too. The warming over Antarctica in year 0 is for a small area, is part of normal winterinterannual variability, and is not significant. Also shown as red circles are two locations in Iowa andUkraine, for which time series of temperature and precipitation are shown in Figures 5 and 7.
D13107 ROBOCK ET AL.: NUCLEAR WINTER REVISITED
6 of 14
D13107
tion are in the subtropics in response to a severely weakenedHadley Cell. Figure 7 shows time series of monthly pre-cipitation for the same Iowa location as shown in Figure 5,and it is clear that these large precipitation reductions wouldalso have agricultural implications.[24] This is the first time an atmosphere-ocean general
circulation model of the climate system has been used tostudy nuclear winter. It is the first one to be able to estimatethe amplitude and timescale of ocean cooling, and toevaluate the time the system will need to return to theprevious equilibrium. This is because the model explicitlymodels the effects of the thermal inertia of the ocean atdifferent depths, as well as oceanic circulation changes. Thelong-lasting climate response to this smoke injection is acombination of the ability of the model to loft the sootaerosols high into the stratosphere, and of the ability of themodel to calculate the characteristic response time of theclimate system.
5. Results for the 50 Tg Case
[25] The 50 Tg case produced climate responses verysimilar to those for the 150 Tg case, but with about half theamplitude. As shown in Figure 2, the surface shortwaveforcing is about half that of the 150 Tg case, and reductionsof temperature and precipitation were also about half thoseof the 150 Tg case. However, the timescale of response is
about the same. This is because in this case, too, the smokeaerosols are lofted high into the stratosphere, and havealmost exactly the same stratospheric residence time, withan e-folding decay time of 5.5 years, as compared to4.6 years for the 150 Tg case and 1 year for a typicalvolcanic eruption like Pinatubo. The e-folding time is about6 years for the 5 Tg case [Robock et al., 2007], even longer.The reason is that for the lower soot amounts, solarradiation can affect a larger portion of the soot and it islofted higher. In the 150 Tg case, the large soot amountsshade some of the lower soot, and the average lofting is less,producing slightly shorter average lifetimes. For the 5 Tgcase, the optical properties and more equatorward locationof the initial smoke injection produce more relative solarabsorption. In the case of volcanic aerosols, there is littlelofting, because of the much higher albedo of the aerosols,and therefore a much shorter lifetime.[26] The forcing and response to an input of 50 Tg are
half that of the 150 Tg case even though the aerosol loadingis one third, because of a saturation effect. Once almost allthe solar radiation is already blocked, additional smokeaerosol particles in the larger case have less of an effectthan those put into a clean atmosphere. While the maximumglobal average precipitation reductions for the 50 Tg case arealmost exactly half of those from the 150 Tg case, the 50 Tgtemperature changes less than half of those from the 150 Tgcase. This difference in the nonlinearity of the response
Figure 4. (continued)
D13107 ROBOCK ET AL.: NUCLEAR WINTER REVISITED
7 of 14
D13107
between temperature and precipitation is because the addi-tional cooling in the 150 Tg case does not produce as muchchange in evapotranspiration, because of the exponentialnature of the Clausius-Clapeyron relationship.
[27] Figures 5 and 7 also show temperature and precip-itation time series for the 50 Tg case for the Iowa andUkraine locations. The effects here are approximately halfthose of the 150 Tg case. While these temperature responses
Figure 5. Time series of daily minimum temperature from the control, 50 Tg, and 150 Tg cases for twoimportant agricultural regions, (top) Iowa, United States, at 42�N, 95�W, and (bottom) Ukraine at 50�N,30�E. These two locations are shown on the map in Figure 4.
D13107 ROBOCK ET AL.: NUCLEAR WINTER REVISITED
8 of 14
D13107
are not cold enough to be classified as nuclear ‘‘winter,’’they would still be severe and unprecedented.
6. Impacts
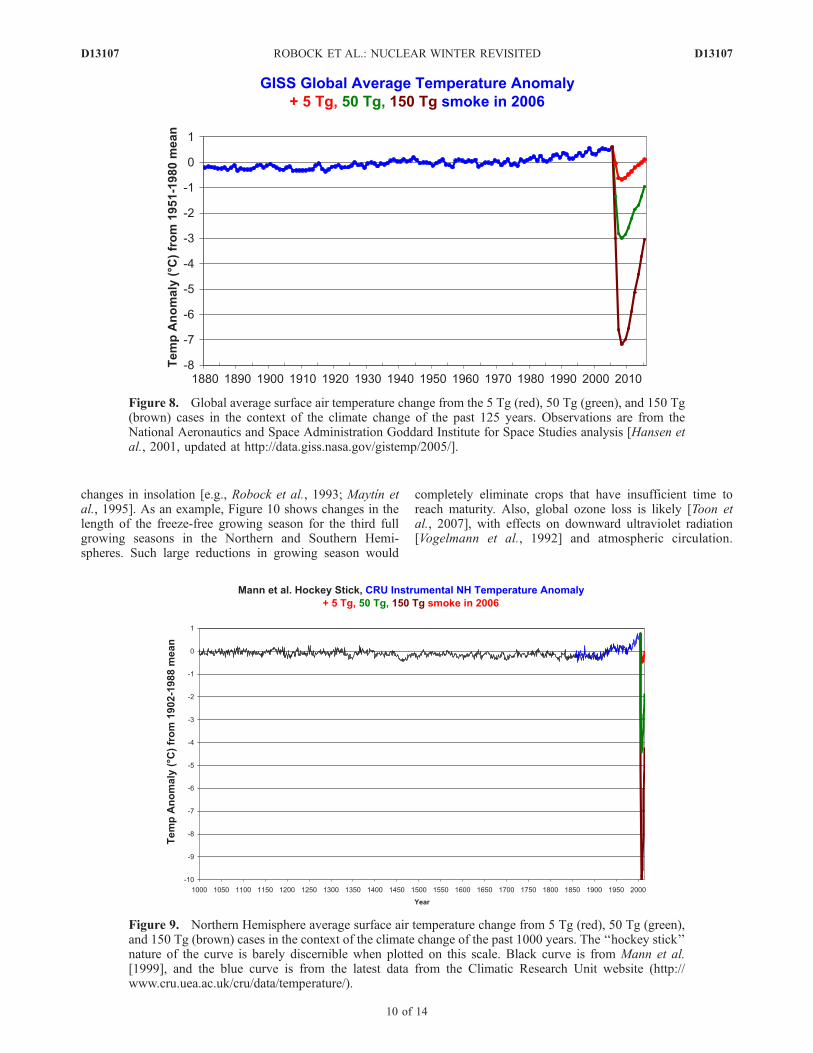
[28] The amplitude of the climate changes from the 5 Tg,50 Tg and 150 Tg cases are compared to those from globalwarming of the past century in Figure 8 and climatechange of the past 1000 years in Figure 9. In both casesit is clear that all cases would produce unprecedentedlong-lasting climate change. The 50 Tg and 150 Tg casesproduce cooling as large or larger than that experienced18,000 years ago during the coldest period of the last Ice Age.[29] Harwell and Hutchinson [1986] clearly described the
impacts of nuclear winter. They assumed that there wouldbe no food production around the world for one year andconcluded that most of the people on the planet would runout of food and starve to death by then. Our results showthat this period of no food production needs to be extendedby many years, making the impacts of nuclear winter evenworse than previously thought.[30] Agriculture would be affected by many factors,
including temperature changes, precipitation changes, and
Figure 6. Precipitation changes (mm/day) in response to the 150 Tg case averaged for June, July, andAugust of the first year following the smoke injection. There are large reductions over large regions,especially those affected by the North American, Asian, and African summer monsoons. The small areasof increased precipitation are in the subtropics in response to a severely weakened Hadley Cell. Alsoshown as a red circle is the location in Iowa for which time series of precipitation are shown in Figure 7.
Figure 7. Time series of monthly precipitation from thecontrol, 50 Tg, and 150 Tg cases for the importantagricultural region of Iowa, United States, at 42�N, 95�W.The location is shown on the map in Figure 6.
D13107 ROBOCK ET AL.: NUCLEAR WINTER REVISITED
9 of 14
D13107
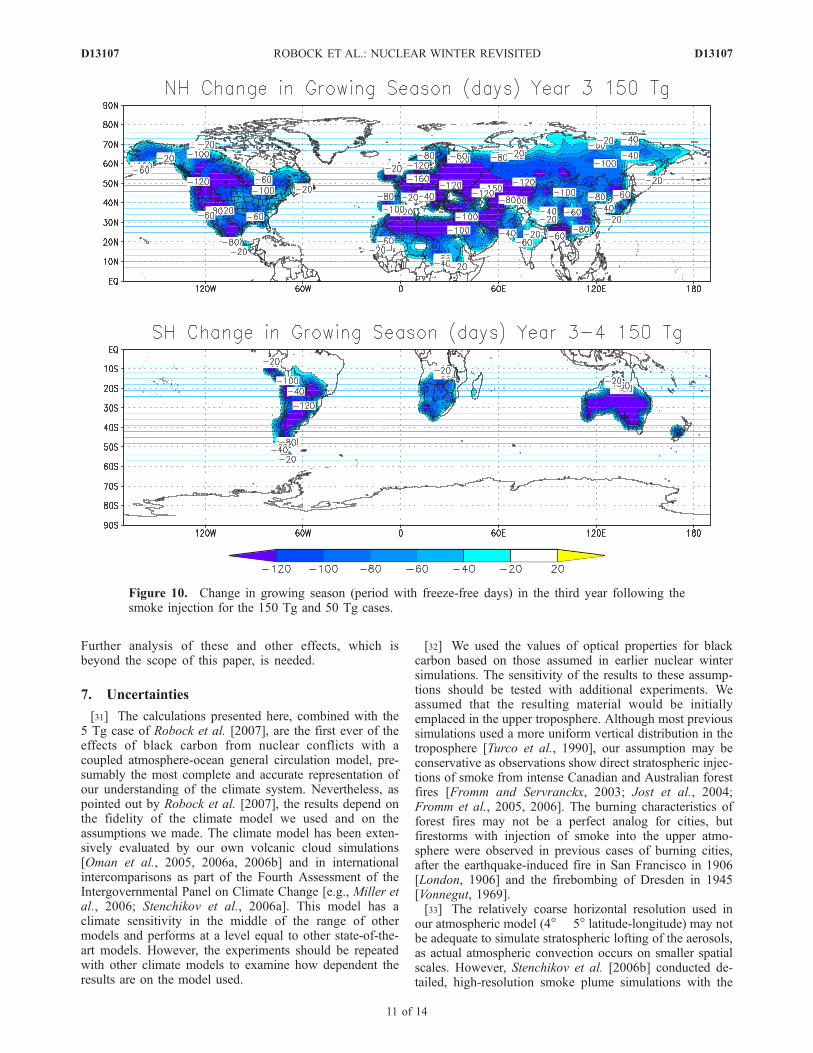
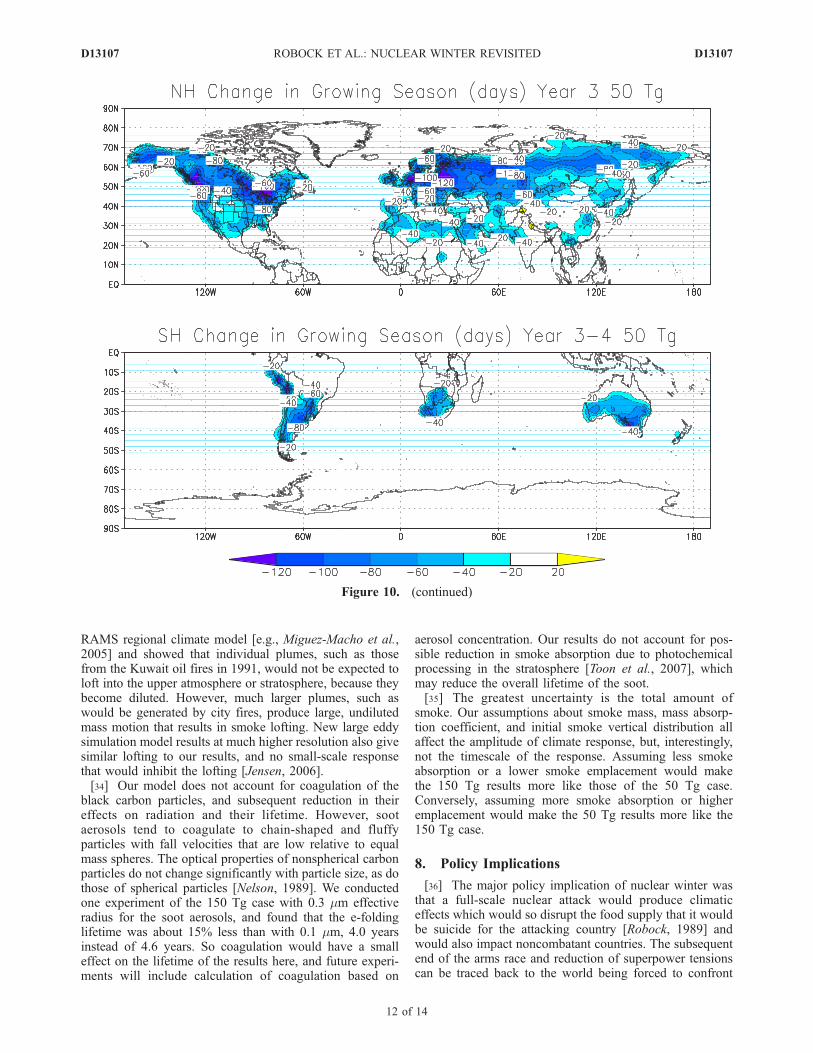
changes in insolation [e.g., Robock et al., 1993; Maytın etal., 1995]. As an example, Figure 10 shows changes in thelength of the freeze-free growing season for the third fullgrowing seasons in the Northern and Southern Hemi-spheres. Such large reductions in growing season would
completely eliminate crops that have insufficient time toreach maturity. Also, global ozone loss is likely [Toon etal., 2007], with effects on downward ultraviolet radiation[Vogelmann et al., 1992] and atmospheric circulation.
Figure 8. Global average surface air temperature change from the 5 Tg (red), 50 Tg (green), and 150 Tg(brown) cases in the context of the climate change of the past 125 years. Observations are from theNational Aeronautics and Space Administration Goddard Institute for Space Studies analysis [Hansen etal., 2001, updated at http://data.giss.nasa.gov/gistemp/2005/].
Figure 9. Northern Hemisphere average surface air temperature change from 5 Tg (red), 50 Tg (green),and 150 Tg (brown) cases in the context of the climate change of the past 1000 years. The ‘‘hockey stick’’nature of the curve is barely discernible when plotted on this scale. Black curve is from Mann et al.[1999], and the blue curve is from the latest data from the Climatic Research Unit website (http://www.cru.uea.ac.uk/cru/data/temperature/).
D13107 ROBOCK ET AL.: NUCLEAR WINTER REVISITED
10 of 14
D13107
Further analysis of these and other effects, which isbeyond the scope of this paper, is needed.
7. Uncertainties
[31] The calculations presented here, combined with the5 Tg case of Robock et al. [2007], are the first ever of theeffects of black carbon from nuclear conflicts with acoupled atmosphere-ocean general circulation model, pre-sumably the most complete and accurate representation ofour understanding of the climate system. Nevertheless, aspointed out by Robock et al. [2007], the results depend onthe fidelity of the climate model we used and on theassumptions we made. The climate model has been exten-sively evaluated by our own volcanic cloud simulations[Oman et al., 2005, 2006a, 2006b] and in internationalintercomparisons as part of the Fourth Assessment of theIntergovernmental Panel on Climate Change [e.g., Miller etal., 2006; Stenchikov et al., 2006a]. This model has aclimate sensitivity in the middle of the range of othermodels and performs at a level equal to other state-of-the-art models. However, the experiments should be repeatedwith other climate models to examine how dependent theresults are on the model used.
[32] We used the values of optical properties for blackcarbon based on those assumed in earlier nuclear wintersimulations. The sensitivity of the results to these assump-tions should be tested with additional experiments. Weassumed that the resulting material would be initiallyemplaced in the upper troposphere. Although most previoussimulations used a more uniform vertical distribution in thetroposphere [Turco et al., 1990], our assumption may beconservative as observations show direct stratospheric injec-tions of smoke from intense Canadian and Australian forestfires [Fromm and Servranckx, 2003; Jost et al., 2004;Fromm et al., 2005, 2006]. The burning characteristics offorest fires may not be a perfect analog for cities, butfirestorms with injection of smoke into the upper atmo-sphere were observed in previous cases of burning cities,after the earthquake-induced fire in San Francisco in 1906[London, 1906] and the firebombing of Dresden in 1945[Vonnegut, 1969].[33] The relatively coarse horizontal resolution used in
our atmospheric model (4� � 5� latitude-longitude) may notbe adequate to simulate stratospheric lofting of the aerosols,as actual atmospheric convection occurs on smaller spatialscales. However, Stenchikov et al. [2006b] conducted de-tailed, high-resolution smoke plume simulations with the
Figure 10. Change in growing season (period with freeze-free days) in the third year following thesmoke injection for the 150 Tg and 50 Tg cases.
D13107 ROBOCK ET AL.: NUCLEAR WINTER REVISITED
11 of 14
D13107
RAMS regional climate model [e.g., Miguez-Macho et al.,2005] and showed that individual plumes, such as thosefrom the Kuwait oil fires in 1991, would not be expected toloft into the upper atmosphere or stratosphere, because theybecome diluted. However, much larger plumes, such aswould be generated by city fires, produce large, undilutedmass motion that results in smoke lofting. New large eddysimulation model results at much higher resolution also givesimilar lofting to our results, and no small-scale responsethat would inhibit the lofting [Jensen, 2006].[34] Our model does not account for coagulation of the
black carbon particles, and subsequent reduction in theireffects on radiation and their lifetime. However, sootaerosols tend to coagulate to chain-shaped and fluffyparticles with fall velocities that are low relative to equalmass spheres. The optical properties of nonspherical carbonparticles do not change significantly with particle size, as dothose of spherical particles [Nelson, 1989]. We conductedone experiment of the 150 Tg case with 0.3 mm effectiveradius for the soot aerosols, and found that the e-foldinglifetime was about 15% less than with 0.1 mm, 4.0 yearsinstead of 4.6 years. So coagulation would have a smalleffect on the lifetime of the results here, and future experi-ments will include calculation of coagulation based on
aerosol concentration. Our results do not account for pos-sible reduction in smoke absorption due to photochemicalprocessing in the stratosphere [Toon et al., 2007], whichmay reduce the overall lifetime of the soot.[35] The greatest uncertainty is the total amount of
smoke. Our assumptions about smoke mass, mass absorp-tion coefficient, and initial smoke vertical distribution allaffect the amplitude of climate response, but, interestingly,not the timescale of the response. Assuming less smokeabsorption or a lower smoke emplacement would makethe 150 Tg results more like those of the 50 Tg case.Conversely, assuming more smoke absorption or higheremplacement would make the 50 Tg results more like the150 Tg case.
8. Policy Implications
[36] The major policy implication of nuclear winter wasthat a full-scale nuclear attack would produce climaticeffects which would so disrupt the food supply that it wouldbe suicide for the attacking country [Robock, 1989] andwould also impact noncombatant countries. The subsequentend of the arms race and reduction of superpower tensionscan be traced back to the world being forced to confront
Figure 10. (continued)
D13107 ROBOCK ET AL.: NUCLEAR WINTER REVISITED
12 of 14
D13107
both the direct and indirect consequences of the use ofnuclear weapons by the public policy debate in response tonuclear winter theory, but the relative impact of nuclearwinter theory as compared to other factors has not beenstudied, as far as we know. However, the arms race endedseveral years before the Soviet Union collapsed. Whilesignificant reductions of American and Russian nucleararsenals followed, our results show that each country stillretains enough weapons to produce a large, long-lasting,unprecedented global climate change.[37] ‘‘Star Wars’’ (Strategic Defense Initiative, now the
Missile Defense Agency) is not the answer, since it stilldoes not work after 20 years of trying. Even if it workedaccording to specifications, it would let in too manyweapons, such as on cruise missiles. Indirect effects ofnuclear winter are greater that direct effects. There would bemany innocent victims in noncombatant nations.[38] The United States and Russia are signatories to the
Strategic Offensive Reductions Treaty, which commits bothto a reduction to 1700–2200 deployed nuclear weapons bythe end of 2012. This continuing reduction of nuclearweapons by both parties is to be commended, but onlynuclear disarmament will completely remove the possibilityof a nuclear environmental catastrophe. In the meantime, itis instructive to ask why Britain, France, and China havechosen nuclear arsenals of only a couple hundred nuclearweapons (Table 2). The threat of how many nuclearweapons dropping on your major cities would be necessaryto deter an attack on another nuclear power? More than one?An immediate reduction of the Russian and Americannuclear arsenals to the same size as those of Britain, France,and China would set an example for the world, maintain thenuclear deterrence of each, and dramatically lower thechances of nuclear winter.[39] The results in this paper need to be tested with other
climate models, and the detailed consequences on agricul-ture, water supply, global trade, communications, travel, airpollution, and many more potential human impacts needfurther study. Each of these potential hazards deservescareful scientific analysis by governments around the world.
[40] Acknowledgments. This work is supported by U.S. NationalScience Foundation grants ATM-0313592 and ATM-0351280.
ReferencesAleksandrov, V. V., and G. L. Stenchikov (1983), On the modeling of theclimatic consequences of the nuclear war, Proc. Appl. Math, 21 pp.,Comput. Cent., Russ. Acad. of Sci., Moscow.
Covey, C., S. Thompson, and S. H. Schneider (1984), Global atmosphericeffects of massive smoke injections from a nuclear war: Results fromgeneral circulation model simulations, Nature, 308, 21–25.
Crutzen, P. J., and J. W. Birks (1982), The atmosphere after a nuclear war:Twilight at noon, Ambio, 11, 114–125.
Fromm, M. D., and R. Servranckx (2003), Transport of forest fire smokeabove the tropopause by supercell convection, Geophys. Res. Lett.,30(10), 1542, doi:10.1029/2002GL016820.
Fromm,M., R. Bevilacqua, R. Servranckx, J. Rosen, J. P. Thayer, J. Herman,and D. Larko (2005), Pyro-cumulonimbus injection of smoke to the strato-sphere: Observations and impact of a super blowup in northwestern Canadaon 3–4 August 1998, J. Geophys. Res., 110, D08205, doi:10.1029/2004JD005350.
Fromm, M., A. Tupper, D. Rosenfeld, R. Servranckx, and R. McRae(2006), Violent pyro-convective storm devastates Australia’s capitaland pollutes the stratosphere, Geophys. Res. Lett., 33, L05815,doi:10.1029/2005GL025161.
Ghan, S. J. (1991), Chronic climatic effects of nuclear war, Atmos. Environ.,Part A, 25, 2615–2625.
Ghan, S. J., M. C. MacCracken, and J. J. Walton (1988), Climatic responseto large atmospheric smoke injections: Sensitivity studies with a tropo-spheric general circulation model, J. Geophys. Res., 93, 8315–8337.
Hansen, J. E., R. Ruedy, M. Sato, M. Imhoff, W. Lawrence, D. Easterling,T. Peterson, and T. Karl (2001), A closer look at United States and globalsurface temperature change, J. Geophys. Res., 106, 23,947–23,963.
Hansen, J., et al. (2005), Efficacy of climate forcings, J. Geophys. Res., 110,D18104, doi:10.1029/2005JD005776.
Harwell, M. A., and T. C. Hutchinson (Eds.) (1986), Environmental Con-sequences of Nuclear War, SCOPE 28, vol. II, Ecological and Agricul-tural Effects, John Wiley, New York.
International Panel on Fissile Materials (2006), Global Fissile MaterialReport 2006, 99 pp., Program on Sci. and Global Security, PrincetonUniv., Princeton, N.J.
Jensen, E. J. (2006), Lofting of smoke plumes generated by regional nuclearconflicts, Eos Trans. AGU, 87(52), Fall Meet. Suppl., Abstract U14A-06.
Jost, H. J., et al. (2004), In-situ observations of mid-latitude forest fireplumes deep in the stratosphere, Geophys. Res. Lett., 31, L11101,doi:10.1029/2003GL019253.
Kirchner, I., G. L. Stenchikov, H.-F. Graf, A. Robock, and J. C. Antuna(1999), Climate model simulation of winter warming and summer cool-ing following the 1991 Mount Pinatubo volcanic eruption, J. Geophys.Res., 104, 19,039–19,055.
Koch, D., G. A. Schmidt, and C. V. Field (2006), Sulfur, sea salt, andradionuclide aerosols in GISS ModelE, J. Geophys. Res., 111, D06206,doi:10.1029/2004JD005550.
Ledley, T. S., and S. L. Thompson (1986), Potential effect of nuclear warsmokefall on sea ice, Clim. Change, 8, 155–171.
London, J. (1906), The story of an eyewitness, Collier’s, the NationalWeekly, 5 May.
Malone, R. C., L. H. Auer, G. A. Glatzmaier, M. C. Wood, and O. B. Toon(1986), Nuclear winter: Three-dimensional simulations including inter-active transport, scavenging, and solar heating of smoke, J. Geophys.Res., 91, 1039–1054.
Mann, M. E., R. S. Bradley, and M. K. Hughes (1999), Northern Hemi-sphere temperatures during the past millennium: Inferences, uncertainties,and limitations, Geophys. Res. Lett., 26, 759–762.
Martin, B. (1988), Nuclear winter: science and politics, Sci. Public Policy,15(5), 321–334.
Maytın, C. E., M. Acevedo, R. Jaimez, R. Andressen, M. A. Harwell,A. Robock, and A. Azocar (1995), Potential effects of global climaticchange on the phenology and yield of maize in Venezuela, Clim. Change,29, 189–211.
Miguez-Macho, G., G. L. Stenchikov, and A. Robock (2005), Regionalclimate simulations over North America: Interaction of local processeswith improved large-scale flow, J. Clim., 18, 1227–1246.
Miller, R. L., G. A. Schmidt, and D. Shindell (2006), Forced annularvariations in the 20th century IPCC AR4 models, J. Geophys. Res.,111, D18101, doi:10.1029/2005JD006323.
Nelson, J. (1989), Fractality of sooty smoke: Implications for the severity ofnuclear winter, Nature, 339, 611–613.
Norris, R. S., and H. M. Kristensen (2006), Global nuclear stockpiles,1945–2006, Bull At. Sci., 62(4), 64–66.
Oman, L., A. Robock, G. Stenchikov, G. A. Schmidt, and R. Ruedy (2005),Climatic response to high latitude volcanic eruptions, J. Geophys. Res.,110, D13103, doi:10.1029/2004JD005487.
Oman, L., A. Robock, G. L. Stenchikov, T. Thordarson, D. Koch, D. T.Shindell, and C. Gao (2006a), Modeling the distribution of the volcanicaerosol cloud from the 1783–1784 Laki eruption, J. Geophys. Res., 111,D12209, doi:10.1029/2005JD006899.
Oman, L., A. Robock, G. L. Stenchikov, and T. Thordarson (2006b), High-latitude eruptions cast shadow over the African monsoon and the flow ofthe Nile, Geophys. Res. Lett., 33, L18711, doi:10.1029/2006GL027665.
Pittock, A. B., T. P. Ackerman, P. J. Crutzen, M. C. MacCracken, C. S.Shapiro, and R. P. Turco (Eds.) (1986), Environmental Consequences ofNuclear War, SCOPE 28, vol. I, Physical and Atmospheric Effects, JohnWiley, New York.
Pittock, A. B., K. Walsh, and J. S. Frederiksen (1989), General circulationmodel simulation of mild nuclear winter effects, Clim. Dyn., 3, 191–206.
Robock, A. (1984), Snow and ice feedbacks prolong effects of nuclearwinter, Nature, 310, 667–670.
Robock, A. (1989), Policy implications of nuclear winter and ideas forsolutions, Ambio, 18, 360–366.
Robock, A., et al. (1993), Use of general circulation model output in thecreation of climate change scenarios for impact analysis, Clim. Change,23, 293–335.
Robock, A., L. Oman, G. L. Stenchikov, O. B. Toon, C. Bardeen, and R. P.Turco (2007), Climatic consequences of regional nuclear conflicts, Atmos.Chem. Phys., 7, 2003–2012.
D13107 ROBOCK ET AL.: NUCLEAR WINTER REVISITED
13 of 14
D13107
Russell, G. L., J. R. Miller, and D. Rind (1995), A coupled atmosphere-ocean model for transient climate change, Atmos. Ocean, 33, 683–730.
Sagan, C., and R. Turco (1990), A Path Where No Man Thought—NuclearWinter and the End of the Arms Race, 499 pp., Random House, NewYork.
Schmidt, G. A., et al. (2006), Present-day atmospheric simulations usingGISS ModelE: Comparison to in situ, satellite, and reanalysis data,J. Clim., 19, 153–192.
Schneider, S. H., and S. L. Thompson (1988), Simulating the climaticeffects of nuclear war, Nature, 333, 221–227.
Stenchikov, G. L., et al. (1998), Radiative forcing from the 1991 MountPinatubo volcanic eruption, J. Geophys. Res., 103, 13,837–13,857.
Stenchikov, G., K. Hamilton, R. J. Stouffer, A. Robock, V. Ramaswamy,B. Santer, and H.-F. Graf (2006a), Climate impacts of volcanic erup-tions in the IPCC AR4 climate models, J. Geophys. Res., 111, D07107,doi:10.1029/2005JD006286.
Stenchikov, G., M. Fromm, and A. Robock (2006b), Regional simulationsof stratospheric lofting of smoke plumes, Eos Trans. AGU, 87(52), FallMeet. Suppl., Abstract U14A-05.
Thompson, S. L. (1985), Global interactive transport simulations of nuclearwar smoke, Nature, 317, 35–39.
Thompson, S. L., and S. H. Schneider (1986), Nuclear winter reappraised,Foreign Affairs, 64, 981–1005.
Toon, O. B., R. P. Turco, A. Robock, C. Bardeen, L. Oman, and G. L.Stenchikov (2007), Atmospheric effects and societal consequences of
regional scale nuclear conflicts and acts of individual nuclear terrorism,Atmos. Chem. Phys., 7, 1973–2002.
Turco, R. P., O. B. Toon, T. P. Ackerman, J. B. Pollack, and C. Sagan(1983), Nuclear winter: Global consequences of multiple nuclear explo-sions, Science, 222, 1283–1292.
Turco, R. P., O. B. Toon, T. P. Ackerman, J. B. Pollack, and C. Sagan(1990), Climate and smoke: An appraisal of nuclear winter, Science, 247,166–176.
Vogelmann, A. M., A. Robock, and R. G. Ellingson (1988), Effects of dirtysnow in nuclear winter simulations, J. Geophys. Res., 93, 5319–5332.
Vogelmann, A. M., T. P. Ackerman, and R. P. Turco (1992), Enhancementsin biologically effective ultraviolet radiation following volcanic erup-tions, Nature, 359, 47–49, doi:10.1038/359047a0.
Vonnegut, K. (1969), Slaughterhouse Five, 186 pp., Delacorte, New York.Warren, S. G., and W. J. Wiscombe (1985), Dirty snow after nuclear war,Nature, 313, 467–470.
�����������������������A. Robock and G. L. Stenchikov, Department of Environmental Sciences,
Rutgers University, 14 College Farm Road, New Brunswick, NJ 08901,USA. ([email protected])L. Oman, Department of Earth and Planetary Sciences, Johns Hopkins
University, Baltimore, MD 21218, USA.
D13107 ROBOCK ET AL.: NUCLEAR WINTER REVISITED
14 of 14
D13107