Embed Size (px)
Citation preview
Numerical and functional responses in generalist
predators: hen harriers and peregrines on Scottish
grouse moors
STEPHEN M. REDPATH* and SIMON J. THIRGOOD{*Institute of Terrestrial Ecology, Hill of Brathens, Banchory, Kincardineshire, Scotland AB31 4BY; and
{The Game Conservancy, Crubenmore Lodge, Newtonmore, Invernessshire, Scotland PH20 1BE, UK
Summary
1. The functional and numerical responses of two generalist raptors (hen harrier
and peregrine) were studied on one moor for 6 years and on ®ve other moors for
5 years.
2. Neither species showed numerical responses to grouse abundance. Harrier densi-
ties were highest in areas and years where their small prey (meadow pipits and
small mammals) were most abundant. Peregrine densities were highest on southern
study moors, probably in association with high abundance of racing pigeons.
3. For harriers preying on grouse chicks, the available data ®tted a sigmoidal or
type III functional response. Peregrines showed a type II response to adult grouse
densities around eyries.
4. The proportion of grouse chicks taken by harriers was estimated to have been
highest at densities of 67 chicks km±2 (equivalent to a mean of about 12 broods
km±2). The proportion of adult grouse taken by peregrines appeared to be inversely
density dependent, such that an increasing proportion of grouse was taken at
grouse densities below 20 km±2.
5. In the absence of persecution, the impact of harriers on grouse populations is
most likely to be greatest on moors where alternative prey and thus harriers are
abundant. The question of whether harriers may dampen grouse population cycles
at low grouse density is discussed.
Key-words: Circus cyaneus, functional and numerical responses, generalist preda-
tors, Lagopus lagopus scoticus, predation.
Journal of Animal Ecology (1999) 68, 879±892
Introduction
The impact of predation on prey populations
depends largely on whether and how predators
respond to changes in prey density. Predators can
respond either functionally, by changing individual
predation rates, or numerically, by changing their
density (Solomon 1949; Holling 1959). According to
their responses, di�erent predators have been classi-
®ed as specialists or generalists (Andersson &
Erlinge 1977). Specialists respond numerically either
by immigrating (nomadic specialists) or by higher
breeding success and survival (resident specialists),
whereas generalists respond functionally as well as
numerically (Andersson & Erlinge 1977).
Theoretical models suggest that generalist preda-
tors can have a large impact on prey populations in
certain situations (Murdoch & Oaten 1975;
Andersson & Erlinge 1977; Hanski, Hansson &
Henttonen 1991). This generalist predator hypoth-
esis (GPH) states that high densities of generalist
predators are maintained by a wide range of prey
species and that the predators switch between these
as the relative densities of the prey species change.
This density-dependent predation has a stabilizing
in¯uence on prey numbers, and the GPH has been
suggested to explain variation in vole population
dynamics between Scandinavia and Canada (Erlinge
et al. 1983, 1988; Erlinge 1987; Hansson 1987;
Hanski et al. 1991; Reid, Krebs & Kenney 1997).
In Britain, red grouse (Lagopus lagopus scoticus)
typically show cyclic changes in abundance
(Williams 1985; Hudson 1992). Several generalist
predators prey on red grouse, but their impact is
usually small (Jenkins, Watson & Miller 1964; Moss
& Watson 1985; Hudson 1986). However, game-
keepers usually reduce predator numbers vigorously
Journal of Animal
Ecology 1999,
68, 879±892
# 1999 British
Ecological Society
(Newton 1979; Hudson 1992; Etheridge, Summers &
Green 1997). Several grouse-moor owners recently
allowed their main grouse-killing raptors [hen har-
riers (Circus cyaneus) and peregrine falcons (Falco
peregrinus)] to breed freely and increase to more nat-
ural densities. This has enabled us to study the
impact of these raptors on grouse numbers.
In this paper we examine the numerical and func-
tional responses of harriers and peregrines in the
breeding season. According to the GPH, harriers
and peregrines will stabilize red grouse populations
if they exhibit a density-dependent functional
response to grouse and no numerical response to
changes in grouse density. More speci®cally, we ask:
(i) do harriers and peregrines respond numerically
and functionally to changes in grouse density? and
(ii) does the proportion of the grouse population
killed by these raptors vary with grouse density?
ECOLOGY OF RED GROUSE, HARRIERS AND
PEREGRINES
Red grouse are monogamous, territorial birds which
live in heather (Calluna vulgaris)-dominated moor-
lands of Britain and Ireland. Two main hypotheses
have been proposed to explain their population
cycles: one proposes that cycles result from changes
in grouse breeding success caused by the parasite
Trichostrongylus tenuis (e.g. Hudson, Dobson &
Newborn 1985; Hudson & Dobson 1990; Dobson &
Hudson 1992); the other is that cycles are caused by
changes in recruitment because of variation in
grouse social structure and associated territorial
behaviour (e.g. Moss & Watson 1985; Mountford
et al. 1990; Moss, Watson & Parr 1996). Predation
has been rejected as a possible cause of red grouse
cycles (Hudson 1992; Moss et al. 1996).
Female harriers hunt over grouse moors through-
out the year, although males generally winter else-
where (Watson 1977; Marquiss 1980). They make
their nests in heather and pairs can nest in close
proximity. Harriers are sometimes polygynous, with
one male mating with up to several females.
Peregrines are monogamous, territorial and tend to
stay on territory throughout the winter, although
they may leave during periods of bad weather
(Mearns 1982). Nests tend to be on cli� ledges,
fairly evenly spaced over suitable habitat. Both har-
riers and peregrines take a wide variety of prey,
although during the breeding season meadow pipits
(Anthus pratensis) tend to dominate the diet of har-
riers (Watson 1977), and racing/feral pigeons
(Columbia livia) that of peregrines (Ratcli�e 1993).
Study areas
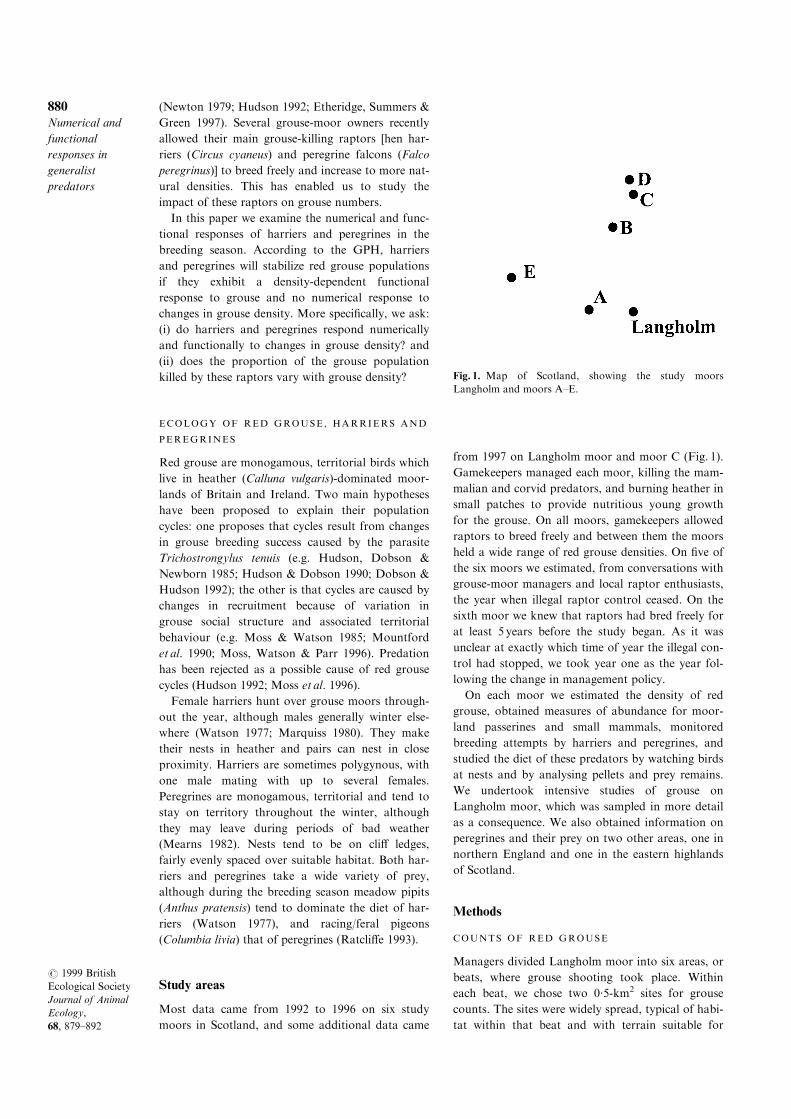
Most data came from 1992 to 1996 on six study
moors in Scotland, and some additional data came
from 1997 on Langholm moor and moor C (Fig. 1).
Gamekeepers managed each moor, killing the mam-
malian and corvid predators, and burning heather in
small patches to provide nutritious young growth
for the grouse. On all moors, gamekeepers allowed
raptors to breed freely and between them the moors
held a wide range of red grouse densities. On ®ve of
the six moors we estimated, from conversations with
grouse-moor managers and local raptor enthusiasts,
the year when illegal raptor control ceased. On the
sixth moor we knew that raptors had bred freely for
at least 5 years before the study began. As it was
unclear at exactly which time of year the illegal con-
trol had stopped, we took year one as the year fol-
lowing the change in management policy.
On each moor we estimated the density of red
grouse, obtained measures of abundance for moor-
land passerines and small mammals, monitored
breeding attempts by harriers and peregrines, and
studied the diet of these predators by watching birds
at nests and by analysing pellets and prey remains.
We undertook intensive studies of grouse on
Langholm moor, which was sampled in more detail
as a consequence. We also obtained information on
peregrines and their prey on two other areas, one in
northern England and one in the eastern highlands
of Scotland.
Methods
COUNTS OF RED GROUSE
Managers divided Langholm moor into six areas, or
beats, where grouse shooting took place. Within
each beat, we chose two 0´5-km2 sites for grouse
counts. The sites were widely spread, typical of habi-
tat within that beat and with terrain suitable for
Fig. 1. Map of Scotland, showing the study moors
Langholm and moors A±E.
880Numerical and
functional
responses in
generalist
predators
# 1999 British
Ecological Society
Journal of Animal
Ecology,
68, 879±892
counting grouse. On each of the other ®ve study
moors, we chose two 1-km2 areas, and on each of
the further two areas used for estimating peregrine
numbers and diet we counted grouse on four 1-km2
areas.
Grouse were counted during the ®rst half of April
and the second half of July using standard counts
with pointing dogs (Jenkins, Watson & Miller 1963).
This involved the observer walking parallel transects
at 170m intervals with the dog quartering approxi-
mately 85m on either side of each transect, pointing
all grouse encountered. The same combination of
dog and observer was used throughout the study.
We estimated grouse brood size and chick abun-
dance during the ®rst week of June on each area
where we were studying harrier diet. The observer
walked a minimum of 12 1-km transects on each
area. Upon encountering a brood, the dog was
worked for 5min in an attempt to ®nd all chicks.
Chick density was the mean brood size in June mul-
tiplied by the density of hens in July. Radio-tracking
had earlier indicated very low rates of adult mortal-
ity during these months (Redpath & Thirgood
1997).
COUNTS OF MEADOW PIPITS
Meadow pipits were counted on line transects
(Bibby, Burgess & Hill 1992) in three 1-km2 squares
selected at random from each of the six Langholm
beats, and six 1-km2 selected from each of the other
®ve study moors. Two parallel transects, 500m
apart, were walked through each square between
06.00 h and 09.00 h during June each year. This was
carried out in the mornings, because previous work
had shown that passerine estimates were in¯uenced
by diurnal variation in detection rates (Thirgood,
Leckie & Redpath 1995). The same observer under-
took all counts in good visibility, light or moderate
winds and no precipitation. He recorded the number
of individuals (by species) within 200m either side
of the transect.
ABUNDANCE OF SMALL MAMMALS
Estimates of small mammal abundance were
obtained by snap-trapping in April. We chose two
trapping sites in representative habitat in each of the
beats at Langholm, and four in each of the other
®ve study moors, again representative of each moor.
In each site, 50 unbaited snap traps were set over
two nights, giving 100 `trap nights' per site. Traps
were checked each morning to record the numbers
of ®eld voles (Microtus agrestis), wood mice
(Apodemus sylvaticus), common shrews (Sorex ara-
neus) and pygmy shrews (Sorex minutus). No other
species of small mammal was caught. Previous work
showed that two nights of snap trapping provided
accurate indices of the abundance of small mammals
(Redpath, Thirgood & Redpath 1995).
NUMBERS OF BREEDING RAPTORS
The number of hen harriers and peregrines attempt-
ing to breed was recorded in early spring by watch-
ing from vantage points for displaying harriers and
by visiting potential peregrine nesting sites for signs
of occupancy. For harriers we also determined
whether males were bigamous by watching how
many females they associated with. Females were
considered either alpha (primary) or beta (second-
ary), depending on which of the two laid her eggs
®rst. No case of males with three or more females
was observed. Harrier densities were expressed as
nkm±2 of grouse moor, as opposed to nearest-neigh-
bour distance, because harriers were not strongly
territorial and occurred in small groups within parts
of the study moors. Peregrines nested at lower den-
sity than harriers (Redpath & Thirgood 1997) and
nests tended to be evenly spaced (Ratcli�e 1993).
For comparison between areas, we therefore used
the spacing pattern of peregrine nests (measured as
the nearest-neighbour distance of eyries used in
1994±96) in a region including the given estate, but
extending beyond that estate's boundaries. As these
peregrine nests were located in a wide area over a
number of estates, some human interference was
suspected in all regions, although its extent was
unknown. For relationships with prey between
areas, we excluded peregrines from moor E and its
surrounds, because this was a coastal area where
birds fed partly on seabirds, and so were not strictly
comparable with the inland peregrines. Each raptor
nest found in spring was monitored through the
breeding season to determine clutch size, and the
number of chicks hatched and ¯edged. Checks were
made regularly in all areas to ensure that no late
breeders or relays were overlooked.
RAPTOR DIET
Harrier diet was recorded from hides during the
nestling period. Each nest was watched for up to
180 h over 6weeks, until the chicks left. We recorded
the start and stop time of each watch, the number
and age of chicks, the time when food was brought
to the nest, the sex of the provider, and the type of
prey. Where possible, prey was identi®ed to species,
but where not, was simply recorded as passerines,
small mammals, nidifugous young (such as grouse
or wader chicks) and lagomorphs (rabbits or hares).
We also collated data from two earlier studies on
harrier predation of red grouse chicks (Picozzi 1978;
Redpath 1991).
At 5weeks, harrier chicks started to leave the nest
and spend time in surrounding vegetation. Some
881S.M. Redpath &
S.J. Thirgood
# 1999 British
Ecological Society
Journal of Animal
Ecology,
68, 879±892
prey was dropped away from the nest during this
period, and so fewer items could be identi®ed to
type. In the ®rst 4weeks, 89% or more of items
could be identi®ed to type, but in weeks ®ve and six,
this ®gure dropped to 71% and 60%, respectively.
For comparisons within and between areas, we
therefore used data from nest watches in the ®rst
4weeks only. When using data from Picozzi (1978),
we included only his data collected during the ®rst
3weeks of the nestling period, so as to be roughly
comparable with our data (Picozzi 1978, table 5).
We studied male and female harriers separately,
because the sexes vary in size and diet, and because
some harriers were polygynous. We also collected
harrier pellets through the breeding season, to com-
pare pellet contents during and after the nest-watch
period.
Peregrine pellets and prey remains were collected
during regular visits to nests. The minimum number
of prey individuals was recorded, based on body
parts. For larger prey items, wings, feet or sterna
were counted to give minimum numbers. For small
prey, each pile of body feathers was counted as a
separate individual. Estimates of prey weight came
from Ratcli�e (1993). Watches from hides at three
nests indicated that adult peregrines consumed an
estimated 188 g day±1 of prey and chicks 222 g day±1,
during the 42-day nestling period (Redpath &
Thirgood 1997), similar to estimates by Weir (1978).
Racing pigeons were available mainly during race
days, when they could be superabundant in pere-
grine territories for short periods. This made them
extremely di�cult to count and consequently ana-
lyses of the availability of peregrine prey necessarily
emphasized grouse. In contrast to harriers, which
nested on the heather moorland, some peregrine
eyries were away from moorland. Therefore, when
comparing diet with grouse availability, we esti-
mated the proportion of heather-dominated moor-
land within a 2-km radius of each. This distance was
approximately half the overall nearest-neighbour
distance. The area of heather-dominated moorland
was estimated by marking such habitat onto maps
in the ®eld. Eyries with dovecotes nearby were
excluded from the analyses to prevent the potential
confounding e�ect of increased pigeon abundance.
Prey remains were collected from some eyries in
more than one year. To minimize the problem of
interdependence between data points, we used
annual mean values for these eyries.
Results
NUMERICAL RESPONSE: HARRIERS
Before considering the numerical response of rap-
tors, we had to know whether their numbers chan-
ged after raptor protection began. During the
previous period of suspected illegal control, harrier
numbers were low and birds generally failed in their
attempts to breed (Redpath & Thirgood 1997). At
Langholm, two nests failed for unknown reasons in
1992, although human interference was suspected.
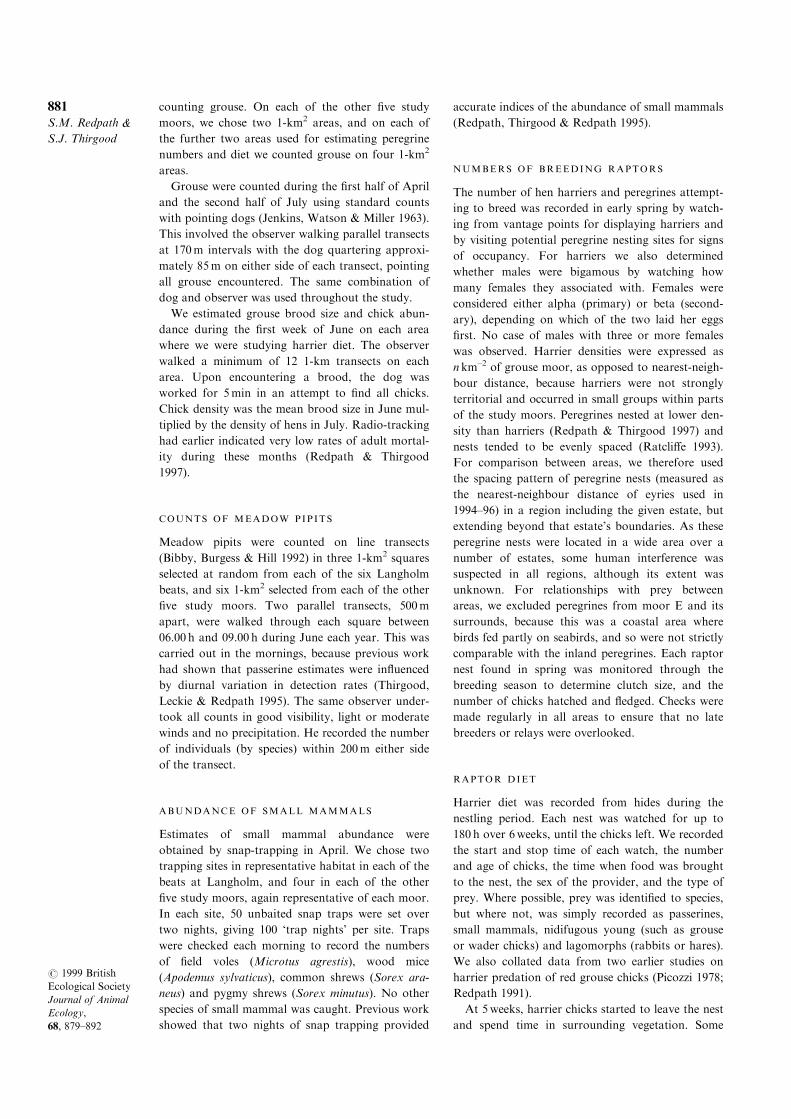
For four of the moors we had data on harrier num-
bers for each year following the start of protection.
There, the mean densities of females increased year-
on-year for 4 years (Fig. 2). In testing for changes in
prey availability in relation to nesting densities of
harriers, we therefore used only data from year four
onwards. As meadow pipits, red grouse and small
mammals formed 83% of identi®ed prey items at
the nests (see below), we restricted analyses to these
three prey types.
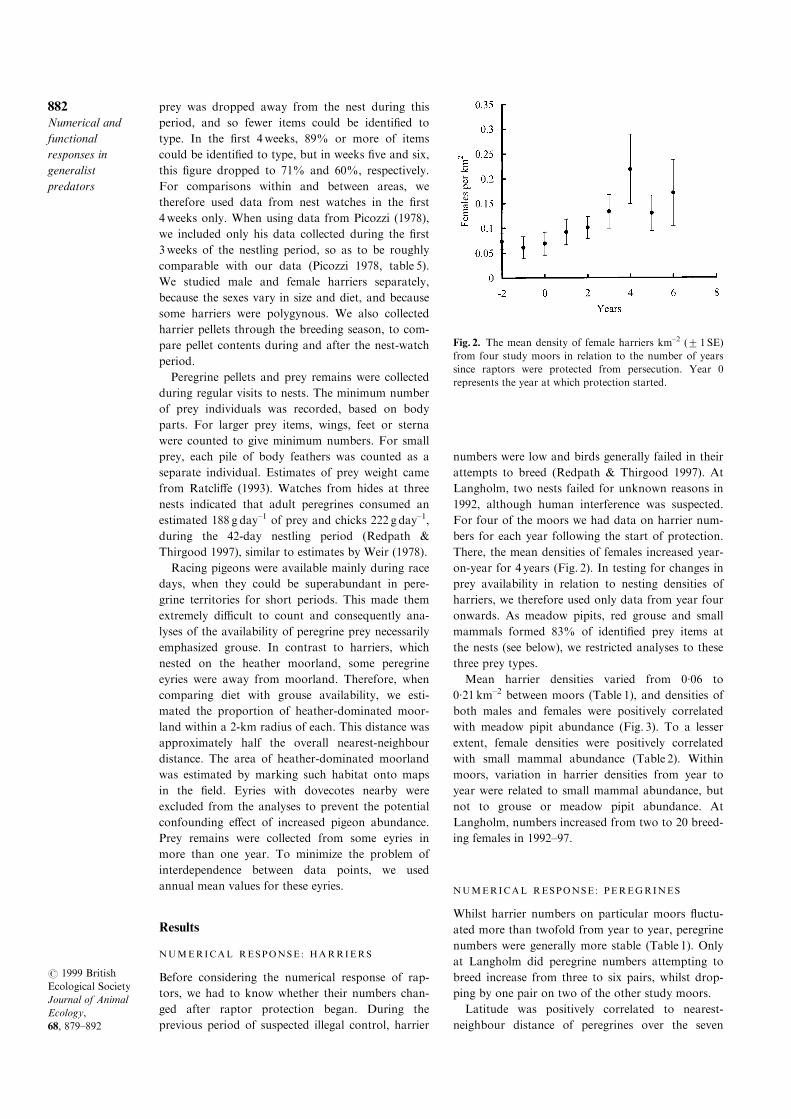
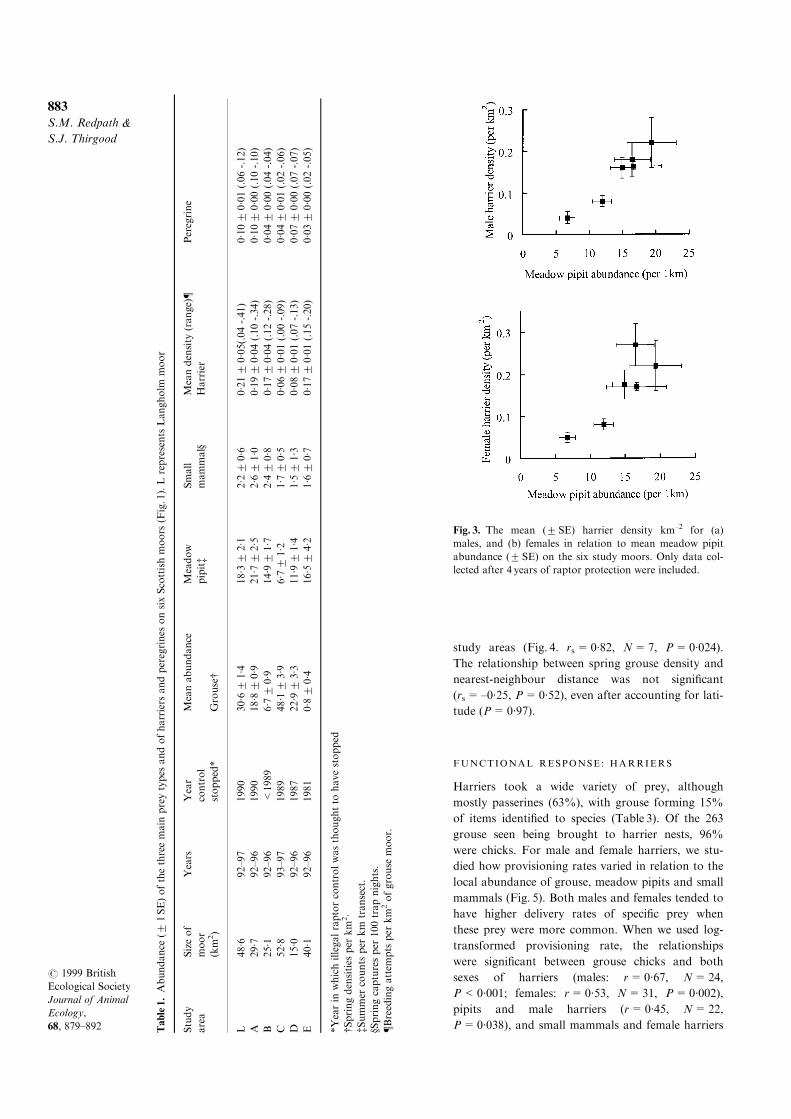
Mean harrier densities varied from 0´06 to
0´21 km±2 between moors (Table 1), and densities of
both males and females were positively correlated
with meadow pipit abundance (Fig. 3). To a lesser
extent, female densities were positively correlated
with small mammal abundance (Table 2). Within
moors, variation in harrier densities from year to
year were related to small mammal abundance, but
not to grouse or meadow pipit abundance. At
Langholm, numbers increased from two to 20 breed-
ing females in 1992±97.
NUMERICAL RESPONSE: PEREGRINES
Whilst harrier numbers on particular moors ¯uctu-
ated more than twofold from year to year, peregrine
numbers were generally more stable (Table 1). Only
at Langholm did peregrine numbers attempting to
breed increase from three to six pairs, whilst drop-
ping by one pair on two of the other study moors.
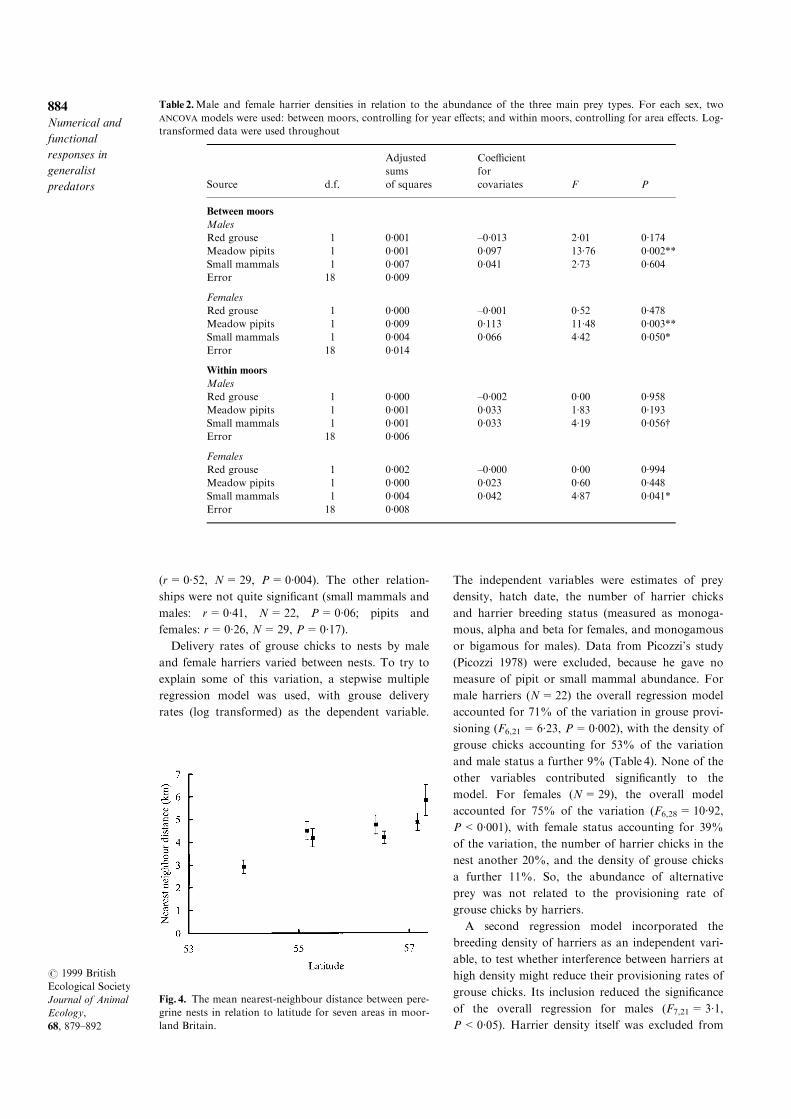
Latitude was positively correlated to nearest-
neighbour distance of peregrines over the seven
Fig. 2. The mean density of female harriers km±2 (2 1 SE)
from four study moors in relation to the number of years
since raptors were protected from persecution. Year 0
represents the year at which protection started.
882Numerical and
functional
responses in
generalist
predators
# 1999 British
Ecological Society
Journal of Animal
Ecology,
68, 879±892
study areas (Fig. 4. rs=0´82, N=7, P=0´024).
The relationship between spring grouse density and
nearest-neighbour distance was not signi®cant
(rs=±0´25, P=0´52), even after accounting for lati-
tude (P=0´97).
FUNCTIONAL RESPONSE: HARRIERS
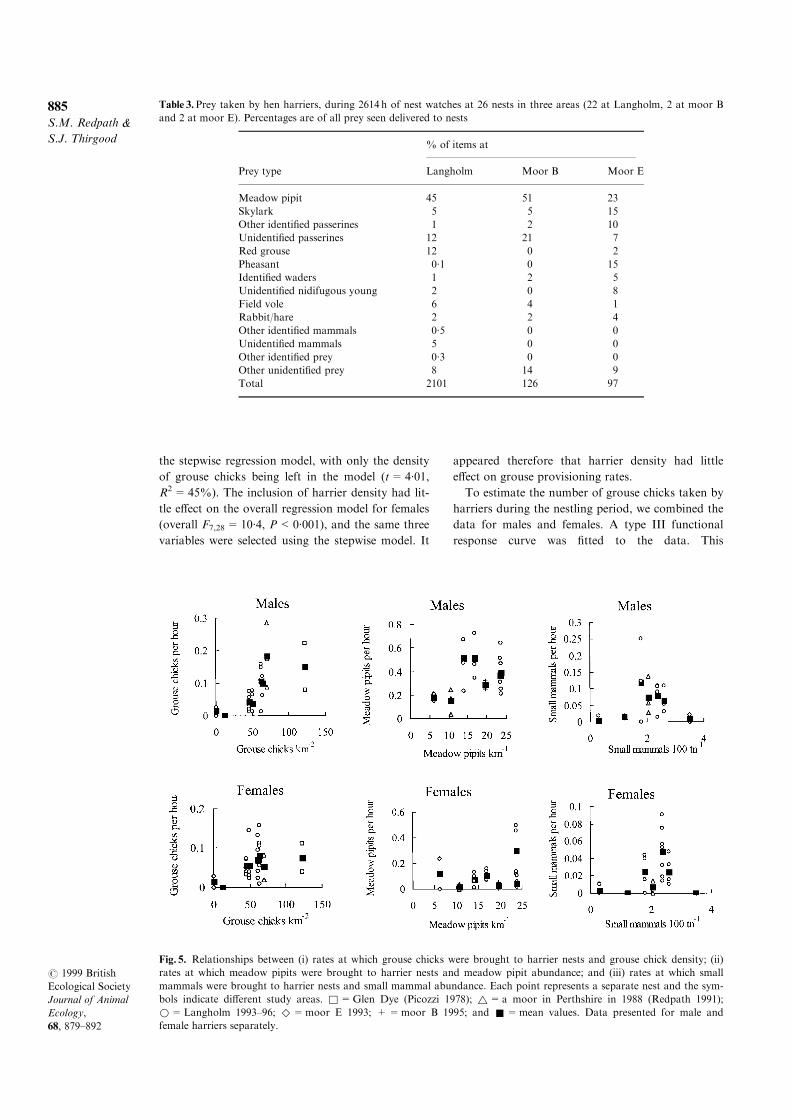
Harriers took a wide variety of prey, although
mostly passerines (63%), with grouse forming 15%
of items identi®ed to species (Table 3). Of the 263
grouse seen being brought to harrier nests, 96%
were chicks. For male and female harriers, we stu-
died how provisioning rates varied in relation to the
local abundance of grouse, meadow pipits and small
mammals (Fig. 5). Both males and females tended to
have higher delivery rates of speci®c prey when
these prey were more common. When we used log-
transformed provisioning rate, the relationships
were signi®cant between grouse chicks and both
sexes of harriers (males: r=0´67, N=24,
P<0´001; females: r=0´53, N=31, P=0´002),
pipits and male harriers (r=0´45, N=22,
P=0´038), and small mammals and female harriersTable1.Abundance
(21SE)ofthethreemain
preytypes
andofharriers
andperegrines
onsixScottishmoors
(Fig.1).Lrepresents
Langholm
moor
Study
area
Sizeof
moor
(km
2)
Years
Year
control
stopped*
Meanabundance
Grouse{
Meadow
pipit{
Small
mammalx
Meandensity
(range){
Harrier
Peregrine
L48´6
92±97
1990
30´6
21´4
18´3
22´1
2´2
20´6
0´21
20´05(.04-.41)
0´10
20´01(.06-.12)
A29´7
92±96
1990
18´8
20´9
21´7
22´5
2´6
21´0
0´19
20´04(.10-.34)
0´10
20´00(.10-.10)
B25´1
92±96
<1989
6´7
20´9
14´9
21´7
2´4
20´8
0´17
20´04(.12-.28)
0´04
20´00(.04-.04)
C52´8
93±97
1989
48´1
23´9
6´7
21´2
1´7
20´5
0´06
20´01(.00-.09)
0´04
20´01(.02-.06)
D15´0
92±96
1987
22´9
23´3
11´9
21´4
1´5
21´3
0´08
20´01(.07-.13)
0´07
20´00(.07-.07)
E40´1
92±96
1981
0´8
20´4
16´5
24´2
1´6
20´7
0´17
20´01(.15-.20)
0´03
20´00(.02-.05)
*Yearin
whichillegalraptorcontrolwasthoughtto
havestopped
{Springdensities
per
km
2´
{Summer
counts
per
km
transect.
xSpringcapturesper
100trapnights.
{Breedingattem
pts
per
km
2ofgrouse
moor.
Fig. 3. The mean (2SE) harrier density km±2 for (a)
males, and (b) females in relation to mean meadow pipit
abundance (2 SE) on the six study moors. Only data col-
lected after 4 years of raptor protection were included.
883S.M. Redpath &
S.J. Thirgood
# 1999 British
Ecological Society
Journal of Animal
Ecology,
68, 879±892
(r=0´52, N=29, P=0´004). The other relation-
ships were not quite signi®cant (small mammals and
males: r=0´41, N=22, P=0´06; pipits and
females: r=0´26, N=29, P=0´17).
Delivery rates of grouse chicks to nests by male
and female harriers varied between nests. To try to
explain some of this variation, a stepwise multiple
regression model was used, with grouse delivery
rates (log transformed) as the dependent variable.
The independent variables were estimates of prey
density, hatch date, the number of harrier chicks
and harrier breeding status (measured as monoga-
mous, alpha and beta for females, and monogamous
or bigamous for males). Data from Picozzi's study
(Picozzi 1978) were excluded, because he gave no
measure of pipit or small mammal abundance. For
male harriers (N=22) the overall regression model
accounted for 71% of the variation in grouse provi-
sioning (F6,21=6´23, P=0´002), with the density of
grouse chicks accounting for 53% of the variation
and male status a further 9% (Table 4). None of the
other variables contributed signi®cantly to the
model. For females (N=29), the overall model
accounted for 75% of the variation (F6,28=10´92,
P<0´001), with female status accounting for 39%
of the variation, the number of harrier chicks in the
nest another 20%, and the density of grouse chicks
a further 11%. So, the abundance of alternative
prey was not related to the provisioning rate of
grouse chicks by harriers.
A second regression model incorporated the
breeding density of harriers as an independent vari-
able, to test whether interference between harriers at
high density might reduce their provisioning rates of
grouse chicks. Its inclusion reduced the signi®cance
of the overall regression for males (F7,21=3´1,
P<0´05). Harrier density itself was excluded from
Table 2.Male and female harrier densities in relation to the abundance of the three main prey types. For each sex, two
ANCOVA models were used: between moors, controlling for year e�ects; and within moors, controlling for area e�ects. Log-
transformed data were used throughout
Source d.f.
Adjusted
sums
of squares
Coe�cient
for
covariates F P
Between moors
Males
Red grouse 1 0´001 ±0´013 2´01 0´174
Meadow pipits 1 0´001 0´097 13´76 0´002**
Small mammals 1 0´007 0´041 2´73 0´604
Error 18 0´009
Females
Red grouse 1 0´000 ±0´001 0´52 0´478
Meadow pipits 1 0´009 0´113 11´48 0´003**
Small mammals 1 0´004 0´066 4´42 0´050*
Error 18 0´014
Within moors
Males
Red grouse 1 0´000 ±0´002 0´00 0´958
Meadow pipits 1 0´001 0´033 1´83 0´193
Small mammals 1 0´001 0´033 4´19 0´056{Error 18 0´006
Females
Red grouse 1 0´002 ±0´000 0´00 0´994
Meadow pipits 1 0´000 0´023 0´60 0´448
Small mammals 1 0´004 0´042 4´87 0´041*
Error 18 0´008
Fig. 4. The mean nearest-neighbour distance between pere-
grine nests in relation to latitude for seven areas in moor-
land Britain.
884Numerical and
functional
responses in
generalist
predators
# 1999 British
Ecological Society
Journal of Animal
Ecology,
68, 879±892
the stepwise regression model, with only the density
of grouse chicks being left in the model (t=4´01,
R2=45%). The inclusion of harrier density had lit-
tle e�ect on the overall regression model for females
(overall F7,28=10´4, P<0´001), and the same three
variables were selected using the stepwise model. It
appeared therefore that harrier density had little
e�ect on grouse provisioning rates.
To estimate the number of grouse chicks taken by
harriers during the nestling period, we combined the
data for males and females. A type III functional
response curve was ®tted to the data. This
Table 3.Prey taken by hen harriers, during 2614 h of nest watches at 26 nests in three areas (22 at Langholm, 2 at moor B
and 2 at moor E). Percentages are of all prey seen delivered to nests
% of items at
Prey type Langholm Moor B Moor E
Meadow pipit 45 51 23
Skylark 5 5 15
Other identi®ed passerines 1 2 10
Unidenti®ed passerines 12 21 7
Red grouse 12 0 2
Pheasant 0´1 0 15
Identi®ed waders 1 2 5
Unidenti®ed nidifugous young 2 0 8
Field vole 6 4 1
Rabbit/hare 2 2 4
Other identi®ed mammals 0´5 0 0
Unidenti®ed mammals 5 0 0
Other identi®ed prey 0´3 0 0
Other unidenti®ed prey 8 14 9
Total 2101 126 97
Fig. 5. Relationships between (i) rates at which grouse chicks were brought to harrier nests and grouse chick density; (ii)
rates at which meadow pipits were brought to harrier nests and meadow pipit abundance; and (iii) rates at which small
mammals were brought to harrier nests and small mammal abundance. Each point represents a separate nest and the sym-
bols indicate di�erent study areas. &=Glen Dye (Picozzi 1978); ~=a moor in Perthshire in 1988 (Redpath 1991);
*=Langholm 1993±96; ^=moor E 1993; +=moor B 1995; and &=mean values. Data presented for male and
female harriers separately.
885S.M. Redpath &
S.J. Thirgood
# 1999 British
Ecological Society
Journal of Animal
Ecology,
68, 879±892
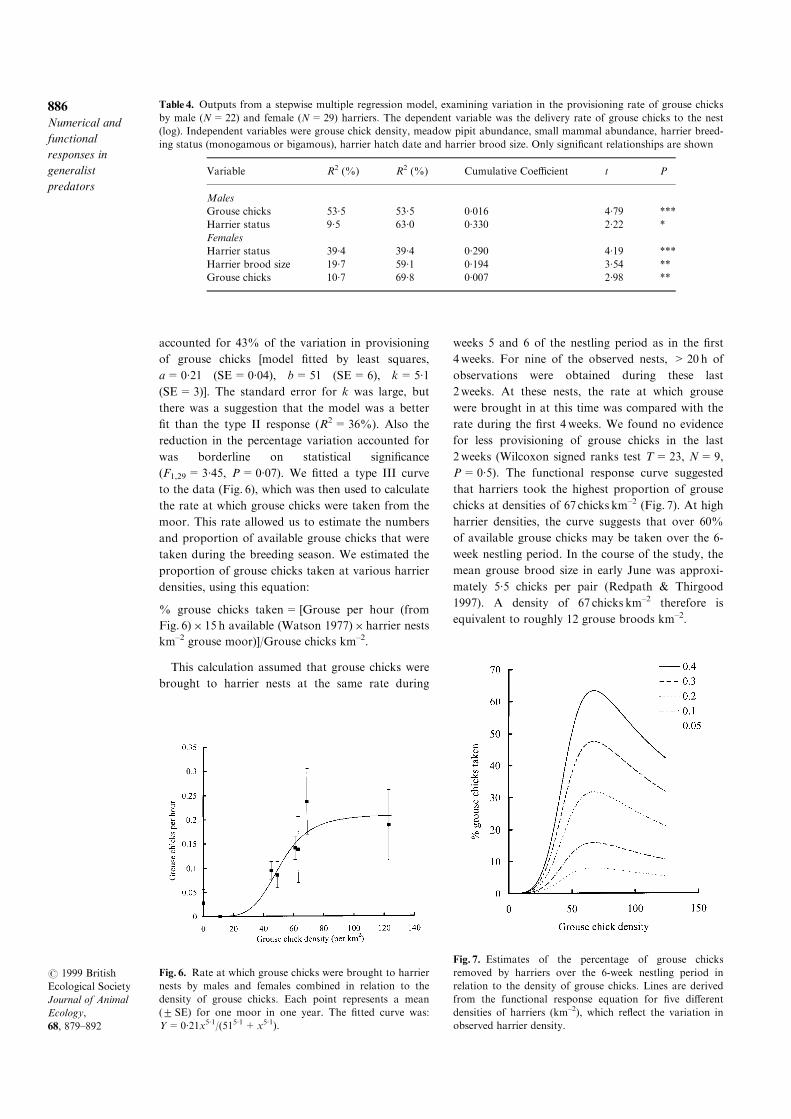
accounted for 43% of the variation in provisioning
of grouse chicks [model ®tted by least squares,
a=0´21 (SE=0´04), b=51 (SE=6), k=5´1
(SE=3)]. The standard error for k was large, but
there was a suggestion that the model was a better
®t than the type II response (R2=36%). Also the
reduction in the percentage variation accounted for
was borderline on statistical signi®cance
(F1,29=3´45, P=0´07). We ®tted a type III curve
to the data (Fig. 6), which was then used to calculate
the rate at which grouse chicks were taken from the
moor. This rate allowed us to estimate the numbers
and proportion of available grouse chicks that were
taken during the breeding season. We estimated the
proportion of grouse chicks taken at various harrier
densities, using this equation:
% grouse chicks taken= [Grouse per hour (from
Fig. 6)� 15 h available (Watson 1977)� harrier nests
km±2 grouse moor)]/Grouse chicks km±2.
This calculation assumed that grouse chicks were
brought to harrier nests at the same rate during
weeks 5 and 6 of the nestling period as in the ®rst
4weeks. For nine of the observed nests, >20 h of
observations were obtained during these last
2weeks. At these nests, the rate at which grouse
were brought in at this time was compared with the
rate during the ®rst 4weeks. We found no evidence
for less provisioning of grouse chicks in the last
2weeks (Wilcoxon signed ranks test T=23, N=9,
P=0´5). The functional response curve suggested
that harriers took the highest proportion of grouse
chicks at densities of 67 chicks km±2 (Fig. 7). At high
harrier densities, the curve suggests that over 60%
of available grouse chicks may be taken over the 6-
week nestling period. In the course of the study, the
mean grouse brood size in early June was approxi-
mately 5´5 chicks per pair (Redpath & Thirgood
1997). A density of 67 chicks km±2 therefore is
equivalent to roughly 12 grouse broods km±2.
Table 4. Outputs from a stepwise multiple regression model, examining variation in the provisioning rate of grouse chicks
by male (N=22) and female (N=29) harriers. The dependent variable was the delivery rate of grouse chicks to the nest
(log). Independent variables were grouse chick density, meadow pipit abundance, small mammal abundance, harrier breed-
ing status (monogamous or bigamous), harrier hatch date and harrier brood size. Only signi®cant relationships are shown
Variable R2 (%) R2 (%) Cumulative Coe�cient t P
Males
Grouse chicks 53´5 53´5 0´016 4´79 ***
Harrier status 9´5 63´0 0´330 2´22 *
Females
Harrier status 39´4 39´4 0´290 4´19 ***
Harrier brood size 19´7 59´1 0´194 3´54 **
Grouse chicks 10´7 69´8 0´007 2´98 **
Fig. 6. Rate at which grouse chicks were brought to harrier
nests by males and females combined in relation to the
density of grouse chicks. Each point represents a mean
(2 SE) for one moor in one year. The ®tted curve was:
Y=0´21x5´1/(515´1+x5´1).
Fig. 7. Estimates of the percentage of grouse chicks
removed by harriers over the 6-week nestling period in
relation to the density of grouse chicks. Lines are derived
from the functional response equation for ®ve di�erent
densities of harriers (km±2), which re¯ect the variation in
observed harrier density.
886Numerical and
functional
responses in
generalist
predators
# 1999 British
Ecological Society
Journal of Animal
Ecology,
68, 879±892
Predation of grouse chicks continues beyond the
nestling stage. We had earlier shown that chick dis-
persal occurred at 60 days (median, range 58±
64 days) after hatching, i.e. 18 days after the nest
watches stopped (Redpath & Thirgood 1997). In the
breeding seasons of 1993±96, we excluded samples
of <10 pellets, and compared the percentage of pel-
lets containing grouse in weeks 1±4 (N=7 nests,
mean=24´9%), weeks 5±6 (N=9 nests,
mean=23´9%) and weeks 7 dispersal (N=7 nests,
mean=28´8%). When the e�ect of year was
removed, the collection period had no signi®cant
e�ect on the proportion of pellets that contained
grouse (F1,18=0´75, P=0´4). These data suggest
that the percentage of grouse in the diet of harriers
stayed broadly the same from hatch to dispersal.
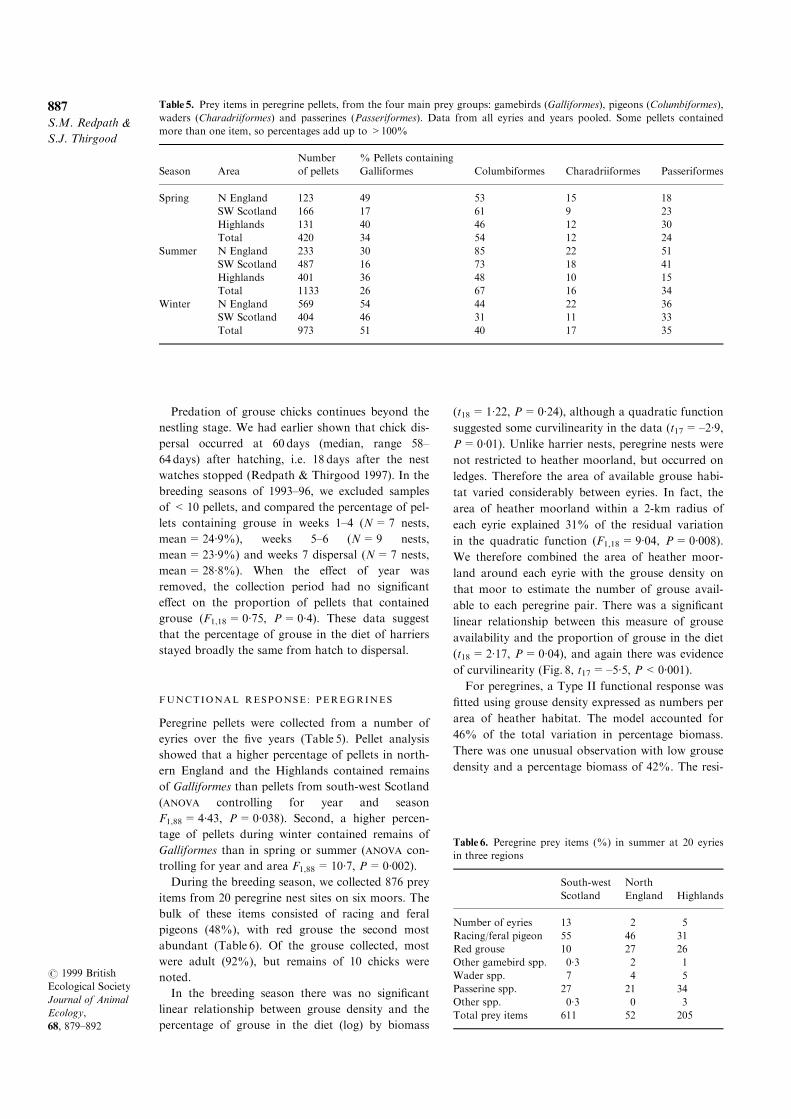
FUNCTIONAL RESPONSE : PEREGRINES
Peregrine pellets were collected from a number of
eyries over the ®ve years (Table 5). Pellet analysis
showed that a higher percentage of pellets in north-
ern England and the Highlands contained remains
of Galliformes than pellets from south-west Scotland
(ANOVA controlling for year and season
F1,88=4´43, P=0´038). Second, a higher percen-
tage of pellets during winter contained remains of
Galliformes than in spring or summer (ANOVA con-
trolling for year and area F1,88=10´7, P=0´002).
During the breeding season, we collected 876 prey
items from 20 peregrine nest sites on six moors. The
bulk of these items consisted of racing and feral
pigeons (48%), with red grouse the second most
abundant (Table 6). Of the grouse collected, most
were adult (92%), but remains of 10 chicks were
noted.
In the breeding season there was no signi®cant
linear relationship between grouse density and the
percentage of grouse in the diet (log) by biomass
(t18=1´22, P=0´24), although a quadratic function
suggested some curvilinearity in the data (t17=±2´9,
P=0´01). Unlike harrier nests, peregrine nests were
not restricted to heather moorland, but occurred on
ledges. Therefore the area of available grouse habi-
tat varied considerably between eyries. In fact, the
area of heather moorland within a 2-km radius of
each eyrie explained 31% of the residual variation
in the quadratic function (F1,18=9´04, P=0´008).
We therefore combined the area of heather moor-
land around each eyrie with the grouse density on
that moor to estimate the number of grouse avail-
able to each peregrine pair. There was a signi®cant
linear relationship between this measure of grouse
availability and the proportion of grouse in the diet
(t18=2´17, P=0´04), and again there was evidence
of curvilinearity (Fig. 8, t17=±5´5, P<0´001).
For peregrines, a Type II functional response was
®tted using grouse density expressed as numbers per
area of heather habitat. The model accounted for
46% of the total variation in percentage biomass.
There was one unusual observation with low grouse
density and a percentage biomass of 42%. The resi-
Table 5. Prey items in peregrine pellets, from the four main prey groups: gamebirds (Galliformes), pigeons (Columbiformes),
waders (Charadriiformes) and passerines (Passeriformes). Data from all eyries and years pooled. Some pellets contained
more than one item, so percentages add up to >100%
Season Area
Number
of pellets
% Pellets containing
Galliformes Columbiformes Charadriiformes Passeriformes
Spring N England 123 49 53 15 18
SW Scotland 166 17 61 9 23
Highlands 131 40 46 12 30
Total 420 34 54 12 24
Summer N England 233 30 85 22 51
SW Scotland 487 16 73 18 41
Highlands 401 36 48 10 15
Total 1133 26 67 16 34
Winter N England 569 54 44 22 36
SW Scotland 404 46 31 11 33
Total 973 51 40 17 35
Table 6. Peregrine prey items (%) in summer at 20 eyries
in three regions
South-west
Scotland
North
England Highlands
Number of eyries 13 2 5
Racing/feral pigeon 55 46 31
Red grouse 10 27 26
Other gamebird spp. 0´3 2 1
Wader spp. 7 4 5
Passerine spp. 27 21 34
Other spp. 0´3 0 3
Total prey items 611 52 205
887S.M. Redpath &
S.J. Thirgood
# 1999 British
Ecological Society
Journal of Animal
Ecology,
68, 879±892
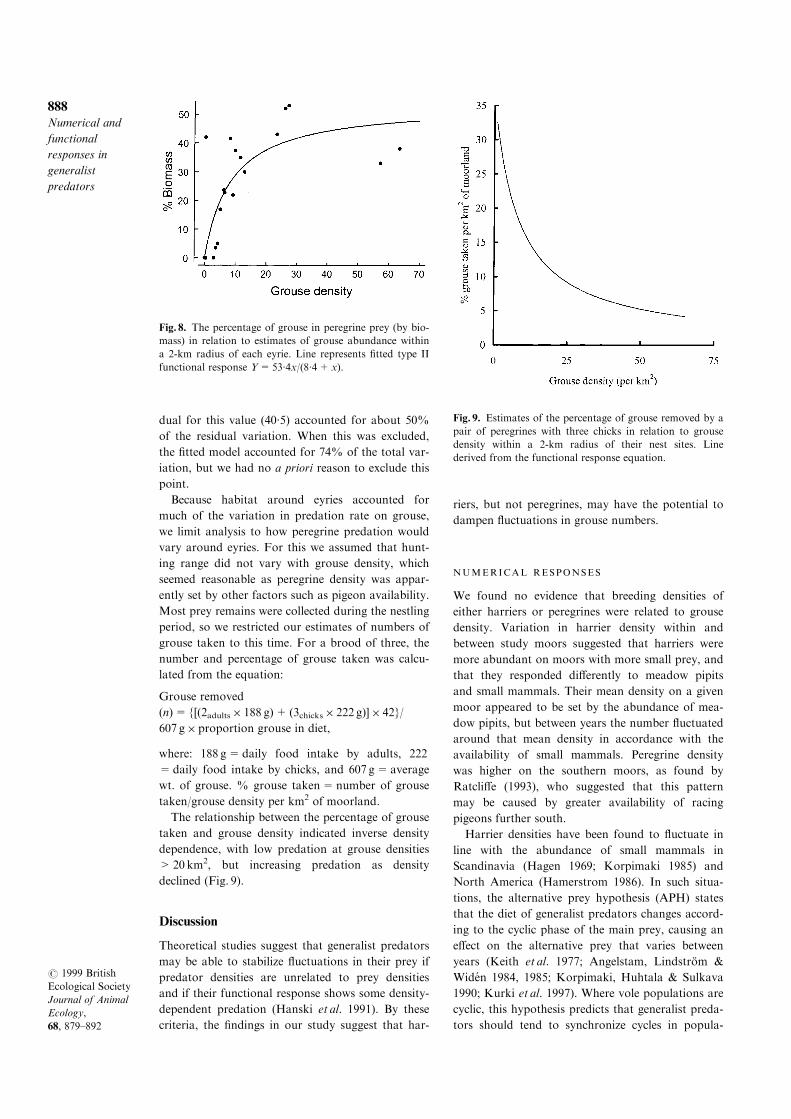
dual for this value (40´5) accounted for about 50%
of the residual variation. When this was excluded,
the ®tted model accounted for 74% of the total var-
iation, but we had no a priori reason to exclude this
point.
Because habitat around eyries accounted for
much of the variation in predation rate on grouse,
we limit analysis to how peregrine predation would
vary around eyries. For this we assumed that hunt-
ing range did not vary with grouse density, which
seemed reasonable as peregrine density was appar-
ently set by other factors such as pigeon availability.
Most prey remains were collected during the nestling
period, so we restricted our estimates of numbers of
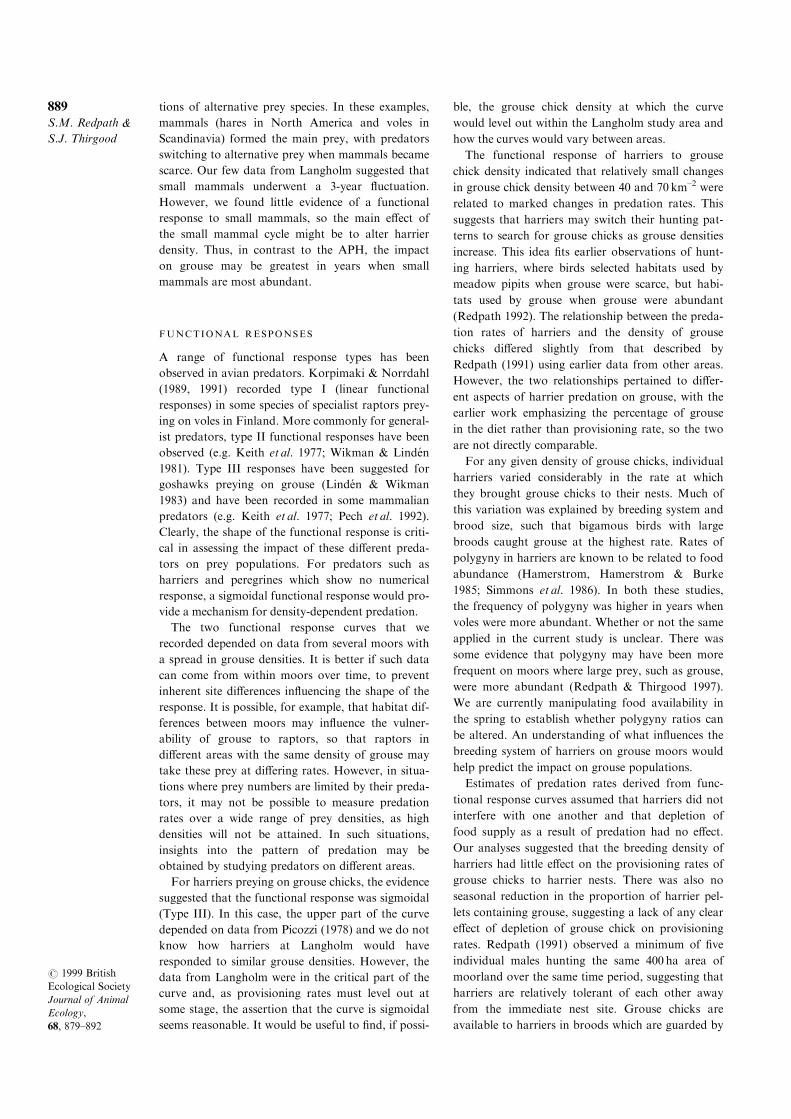
grouse taken to this time. For a brood of three, the
number and percentage of grouse taken was calcu-
lated from the equation:
Grouse removed
(n)={[(2adults� 188 g)+ (3chicks� 222 g)]� 42}/
607 g� proportion grouse in diet,
where: 188 g=daily food intake by adults, 222
=daily food intake by chicks, and 607 g=average
wt. of grouse. % grouse taken=number of grouse
taken/grouse density per km2 of moorland.
The relationship between the percentage of grouse
taken and grouse density indicated inverse density
dependence, with low predation at grouse densities
>20 km2, but increasing predation as density
declined (Fig. 9).
Discussion
Theoretical studies suggest that generalist predators
may be able to stabilize ¯uctuations in their prey if
predator densities are unrelated to prey densities
and if their functional response shows some density-
dependent predation (Hanski et al. 1991). By these
criteria, the ®ndings in our study suggest that har-
riers, but not peregrines, may have the potential to
dampen ¯uctuations in grouse numbers.
NUMERICAL RESPONSES
We found no evidence that breeding densities of
either harriers or peregrines were related to grouse
density. Variation in harrier density within and
between study moors suggested that harriers were
more abundant on moors with more small prey, and
that they responded di�erently to meadow pipits
and small mammals. Their mean density on a given
moor appeared to be set by the abundance of mea-
dow pipits, but between years the number ¯uctuated
around that mean density in accordance with the
availability of small mammals. Peregrine density
was higher on the southern moors, as found by
Ratcli�e (1993), who suggested that this pattern
may be caused by greater availability of racing
pigeons further south.
Harrier densities have been found to ¯uctuate in
line with the abundance of small mammals in
Scandinavia (Hagen 1969; Korpimaki 1985) and
North America (Hamerstrom 1986). In such situa-
tions, the alternative prey hypothesis (APH) states
that the diet of generalist predators changes accord-
ing to the cyclic phase of the main prey, causing an
e�ect on the alternative prey that varies between
years (Keith et al. 1977; Angelstam, LindstroÈ m &
Wide n 1984, 1985; Korpimaki, Huhtala & Sulkava
1990; Kurki et al. 1997). Where vole populations are
cyclic, this hypothesis predicts that generalist preda-
tors should tend to synchronize cycles in popula-
Fig. 8. The percentage of grouse in peregrine prey (by bio-
mass) in relation to estimates of grouse abundance within
a 2-km radius of each eyrie. Line represents ®tted type II
functional response Y=53´4x/(8´4+x).
Fig. 9. Estimates of the percentage of grouse removed by a
pair of peregrines with three chicks in relation to grouse
density within a 2-km radius of their nest sites. Line
derived from the functional response equation.
888Numerical and
functional
responses in
generalist
predators
# 1999 British
Ecological Society
Journal of Animal
Ecology,
68, 879±892
tions of alternative prey species. In these examples,
mammals (hares in North America and voles in
Scandinavia) formed the main prey, with predators
switching to alternative prey when mammals became
scarce. Our few data from Langholm suggested that
small mammals underwent a 3-year ¯uctuation.
However, we found little evidence of a functional
response to small mammals, so the main e�ect of
the small mammal cycle might be to alter harrier
density. Thus, in contrast to the APH, the impact
on grouse may be greatest in years when small
mammals are most abundant.
FUNCTIONAL RESPONSES
A range of functional response types has been
observed in avian predators. Korpimaki & Norrdahl
(1989, 1991) recorded type I (linear functional
responses) in some species of specialist raptors prey-
ing on voles in Finland. More commonly for general-
ist predators, type II functional responses have been
observed (e.g. Keith et al. 1977; Wikman & Linde n
1981). Type III responses have been suggested for
goshawks preying on grouse (Linde n & Wikman
1983) and have been recorded in some mammalian
predators (e.g. Keith et al. 1977; Pech et al. 1992).
Clearly, the shape of the functional response is criti-
cal in assessing the impact of these di�erent preda-
tors on prey populations. For predators such as
harriers and peregrines which show no numerical
response, a sigmoidal functional response would pro-
vide a mechanism for density-dependent predation.
The two functional response curves that we
recorded depended on data from several moors with
a spread in grouse densities. It is better if such data
can come from within moors over time, to prevent
inherent site di�erences in¯uencing the shape of the
response. It is possible, for example, that habitat dif-
ferences between moors may in¯uence the vulner-
ability of grouse to raptors, so that raptors in
di�erent areas with the same density of grouse may
take these prey at di�ering rates. However, in situa-
tions where prey numbers are limited by their preda-
tors, it may not be possible to measure predation
rates over a wide range of prey densities, as high
densities will not be attained. In such situations,
insights into the pattern of predation may be
obtained by studying predators on di�erent areas.
For harriers preying on grouse chicks, the evidence
suggested that the functional response was sigmoidal
(Type III). In this case, the upper part of the curve
depended on data from Picozzi (1978) and we do not
know how harriers at Langholm would have
responded to similar grouse densities. However, the
data from Langholm were in the critical part of the
curve and, as provisioning rates must level out at
some stage, the assertion that the curve is sigmoidal
seems reasonable. It would be useful to ®nd, if possi-
ble, the grouse chick density at which the curve
would level out within the Langholm study area and
how the curves would vary between areas.
The functional response of harriers to grouse
chick density indicated that relatively small changes
in grouse chick density between 40 and 70 km±2 were
related to marked changes in predation rates. This
suggests that harriers may switch their hunting pat-
terns to search for grouse chicks as grouse densities
increase. This idea ®ts earlier observations of hunt-
ing harriers, where birds selected habitats used by
meadow pipits when grouse were scarce, but habi-
tats used by grouse when grouse were abundant
(Redpath 1992). The relationship between the preda-
tion rates of harriers and the density of grouse
chicks di�ered slightly from that described by
Redpath (1991) using earlier data from other areas.
However, the two relationships pertained to di�er-
ent aspects of harrier predation on grouse, with the
earlier work emphasizing the percentage of grouse
in the diet rather than provisioning rate, so the two
are not directly comparable.
For any given density of grouse chicks, individual
harriers varied considerably in the rate at which
they brought grouse chicks to their nests. Much of
this variation was explained by breeding system and
brood size, such that bigamous birds with large
broods caught grouse at the highest rate. Rates of
polygyny in harriers are known to be related to food
abundance (Hamerstrom, Hamerstrom & Burke
1985; Simmons et al. 1986). In both these studies,
the frequency of polygyny was higher in years when
voles were more abundant. Whether or not the same
applied in the current study is unclear. There was
some evidence that polygyny may have been more
frequent on moors where large prey, such as grouse,
were more abundant (Redpath & Thirgood 1997).
We are currently manipulating food availability in
the spring to establish whether polygyny ratios can
be altered. An understanding of what in¯uences the
breeding system of harriers on grouse moors would
help predict the impact on grouse populations.
Estimates of predation rates derived from func-
tional response curves assumed that harriers did not
interfere with one another and that depletion of
food supply as a result of predation had no e�ect.
Our analyses suggested that the breeding density of
harriers had little e�ect on the provisioning rates of
grouse chicks to harrier nests. There was also no
seasonal reduction in the proportion of harrier pel-
lets containing grouse, suggesting a lack of any clear
e�ect of depletion of grouse chick on provisioning
rates. Redpath (1991) observed a minimum of ®ve
individual males hunting the same 400 ha area of
moorland over the same time period, suggesting that
harriers are relatively tolerant of each other away
from the immediate nest site. Grouse chicks are
available to harriers in broods which are guarded by
889S.M. Redpath &
S.J. Thirgood
# 1999 British
Ecological Society
Journal of Animal
Ecology,
68, 879±892
the adult grouse, and the e�ects of possible deple-
tion might be lessened if harriers used adult grouse
as a cue to the availability of grouse chick.
Although we found no e�ects of depletion when 30±
40% of the grouse chicks were taken, it is likely that
the e�ects may be more apparent towards the maxi-
mum potential predation rates of 60±70% of grouse
chicks being taken.
Why should harriers respond numerically to small
prey, but functionally to grouse? The answer pre-
sumably lies in the seasonal availability of grouse
chicks. Male harriers start displaying to females in
early spring, and females appear to choose males
principally on their provisioning performance
(Simmons 1988). Thus the availability of food to
males is likely to be critical in setting harrier density
on a given moor. Males kill adult grouse very rarely
(one observation in 9 years of study of harriers on
grouse moors) and they provision females with
small prey during courtship and incubation.
However, grouse chicks are readily caught by male
harriers and when they emerge they presumably
represent more pro®table prey items for the male to
feed to his female and brood.
In contrast to harriers, prey remains at peregrine
eyries indicated that in terms of biomass, the pro-
portion of grouse as prey levelled o� at 20±40% at
grouse densities >20km±2. The data for high
grouse densities came from moors other than
Langholm. However, as for the harriers' functional
response, the peregrine data from Langholm were
again in the critical part of the relationship. The fact
that the curve which passes through the Langholm
data must inevitably level out suggests that our
assertion of the curve being asymptotic is reasonable
for peregrines. So, predation by peregrines appeared
to be inversely density-dependent, such that the pro-
portion of available grouse taken was highest at
densities <20 km±2. This implies that peregrine pre-
dation may have a destabilizing e�ect on grouse
numbers. This calculation assumes that food con-
sumption was constant between territories, whereas
consumption may vary according to food availabil-
ity. Such e�ects have not been investigated, and
may alter the slope of the functional response curve.
Further data on the rate of grouse predation by per-
egrines at di�erent prey densities are required to test
this assumption.
IMPACT OF RAPTORS ON RED GROUSE
In addition to the numerical and functional
responses, the potential for harriers to limit grouse
populations at low density is further increased by
three other factors. First, harriers in Britain selec-
tively nest in heather (Redpath et al. 1998), which is
also the main food plant of grouse. Reasons for this
nest choice are unclear, but one inevitable result is
that the encounter rate between the two species
must rise. Second, male harriers, unlike most other
British raptors, are not strongly territorial and can
breed at high density (Newton 1979). Third, harriers
are unusual in that they are frequently polygynous
(Newton 1979), so that high densities of males can
attract even higher densities of females. Hence, the
ratio of harriers to grouse can be high compared
with other territorial, monogamous predators such
as peregrines, which are not restricted to the same
habitat as grouse.
We studied predation during the nestling period
of breeding harriers and peregrines, when food
requirements were highest and when the most accu-
rate data could be obtained. Even over such a short
period, we estimated that predation on grouse
chicks could be over 60% at maximum-recorded
harrier densities. This excluded predation before the
nestling period and that between ¯edging and dis-
persal, when the same number of adult raptors was
present. Breeding birds returned to Langholm in
late February/early March, when we had little infor-
mation on harrier prey. However, Picozzi (1978)
suggested that females may take many adult grouse
before egg-laying commences and our radio-tracking
data showed that mortality because of raptors was
high at this time of year (Redpath & Thirgood
1997). Data from pellets indicated that the fre-
quency of grouse in the harrier diet did not vary sig-
ni®cantly from hatching to ¯edging, so estimated
predation on grouse chicks represents minimum
values. Some female harriers remain on the moor
throughout the year, although males leave as pipit
numbers fall (Watson 1977; Redpath 1989) and
females eat larger prey than males (Marquiss 1980).
Territorial peregrines were present on the moor
throughout the year. The proportion of their pellets
containing grouse in winter and spring, when alter-
native prey species were relatively scarce, exceeded
that in summer (Redpath & Thirgood 1997). It
appears, therefore, that although we studied preda-
tion during a relatively short period, predation rates
are also likely to be high at other times of year.
The impact of predation on grouse numbers
depends, to a certain extent, on whether or not there
is selection for certain individuals. Hudson, Dobson
& Newborn (1992) found that foxes sometimes took
heavily parasitized individuals and Watson (1985)
that predators killed nonterritorial grouse. Our data
from Langholm showed low parasite burdens and
few nonterritorial birds (Redpath & Thirgood 1997).
To summarize, the evidence indicated that there
was density dependence in harrier predation on
grouse chicks but not in peregrine predation on
adult grouse. The breeding densities of these gener-
alist predators were related to the abundance of
alternative prey, so their impact on grouse numbers
varied between moors. On moors with abundant
890Numerical and
functional
responses in
generalist
predators
# 1999 British
Ecological Society
Journal of Animal
Ecology,
68, 879±892
small prey and no raptor persecution, such as
Langholm, breeding densities of harriers were likely
to be high. If these grouse populations were to fall
to densities <12pairs km±2, during cyclic troughs,
our data suggest that harrier predation might hold
them there during the breeding season. This pattern
is reminiscent of the suggested impact of generalist
predators on voles at southern latitudes. In other
words, where alternative prey are abundant, preda-
tors are also abundant and vole populations do not
cycle (Angelstam et al. 1984, 1985; Andre n et al.
1985; Hanski et al. 1991). Our data suggested that
predation by peregrines hunting in the absence of
other predators would not limit grouse numbers.
However, peregrine predation in addition to harrier
predation is likely to reduce the ability of low-den-
sity grouse populations to increase.
Acknowledgements
We thank the landowners, especially Buccleuch
Estates for allowing the work. We are especially
grateful to I. Newton for help and support, and to
M. Avery, I. Bainbridge, C. Galbraith, R. Green, P.
Hudson, I. Newton, G.R. Potts, P. Robertson and
D. Thompson for useful comments, P. Rothery for
statistical support and M. Harris, S. Albon,
A.Watson and two anonymous referees for com-
ments on earlier drafts. Many assistants, students
and raptor observers helped with ®eld data, particu-
larly B. Anderson, G. Buchanen, S. Campbell, D.
Calder, C. Cronin, E. Donnelly, B. Etheridge, C.
Hill, F. Leckie, P. Lindley, M. Madders, J.
Martinez, R. May, B. Mitchell, D. Parish, A. Smith
and A. Tharme. R. Clarke kindly did most of the
pellet analysis. The study was funded by Buccleuch
Estates, Peter Buckley of Westerhall Estates, Game
Conservancy Trust and Scottish Research Trust,
Institute of Terrestrial Ecology, Joint Nature
Conservation Committee, Royal Society for the
Protection of Birds and Scottish Natural Heritage.
References
Andersson, M. & Erlinge, S. (1977) In¯uence of predation
on rodent populations. Oikos, 29, 591±597.
Andre n, H., Angelstam, P., Lindstrom, E. & Wide n, P.
(1985) Di�erences in predation pressure in relation to
habitat fragmentation: an experiment. Oikosi B, 296,
245±248.
Angelstam, P., LindstroÈ m, E. & Wide n, P. (1984) Role of
predation in short-term ¯uctuations of some birds and
mammals in Fennoscandia. Oecologia (Berlin), 62,
199±208.
Angelstam, P., LindstroÈ m, E. & Wide n, P. (1985)
Synchronous short-term population ¯uctuations of
some birds and mammals in FennoscandiaÐoccur-
rence and distribution. Holarctic Ecology, 8, 285±298.
Bibby, C.J., Burgess, N.D. & Hill, D.A. (1992) Bird Census
Techniques. Academic Press, London.
Dobson, A.P. & Hudson, P.J. (1992) Regulation and stabi-
lity of a free-living host±parasite system:
Trichostrongylus tenuis in red grouse. II. Population
models. Journal of Animal Ecology, 61, 487±498.
Erlinge, S. (1987) Predation and noncyclicity in a microtine
population in southern Sweden. Oikos, 50, 347±352.
Erlinge, S., GoÈ ransson, G., Hansson, L., HoÈ gstedt, G.,
Liberg, O., Nilsson, I.N., Von Nilsson, T., Schantz, T.
& Sylve n, M. (1983) Predation as a regulating factor
on small rodent populations in southern Sweden.
Oikos, 40, 36±52.
Erlinge, S., GoÈ ransson, G.H., HoÈ gstedt, G., Jansson, G.,
Liberg, O., Loman, J., Von Nilsson, I.N., Schantz, T.
& Sylve n, M. (1988) More thoughts on vertebrate pre-
dator regulation of prey. American Naturalist, 132,
148±154.
Etheridge, B., Summers, R.W. & Green, R. (1997) The
e�ects of human persecution on the population
dynamics of hen harriers Circus cyaneus nesting in
Scotland. Journal of Applied Ecology, 34, 1081±1106.
Hagen, Y. (1969) Norwegian studies on the reproduction
of birds of prey and owls in relation to micro-rodent
population ¯uctuations. Fauna, 22, 73±126.
Hamerstrom, F. (1986) Harrier, Hawk of the Marsh: the
Hawk that is Ruled by a Mouse. Smithsonian Institute
Press, Washington, D.C.
Hamerstrom, F., Hamerstrom, F.N. & Burke, C.J. (1985)
E�ect of voles on mating systems in a central
Wisconsin population of harriers. Wilson Bulletin, 97,
332±346.
Hanski, I., Hansson, L. & Henttonen, H. (1991) Specialist
predators, generalist predators and the microtine vole
cycle. Journal of Animal Ecology, 60, 353±367.
Hansson, L. (1987) An interpretation of rodent dynamics
as due to trophic interactions. Oikos, 50, 308±319.
Holling, C.S. (1959) Some characteristics of simple types of
predation and parasitism. Canadian Entomologist, 91,
385±398.
Hudson, P.J. (1986) Red Grouse: the Biology and
Management of a Wild Gamebird. The Game
Conservancy Trust, Fordingbridge, Hampshire.
Hudson, P.J. (1992) Grouse in Space and TimeÐthe
Population Biology of a Managed Gamebird. The Game
Conservancy Trust, Fordingbridge, Hampshire.
Hudson, P.J. & Dobson, A.P. (1990) Red grouse popula-
tion cycles and the population dynamics of the caecal
nematode Trichostrongylus tenuis. Red Grouse
Population Processes (eds A. N. Lance & J.
H. Lawton), pp. 5±20. Royal Society for the
Protection of Birds, Sandy, Bedfordshire.
Hudson, P.J., Dobson, A.P. & Newborn, D. (1985) Cyclic
and non-cyclic populations of red grouse: a role for
parasites? Ecology and Genetics of Host±Parasite
Interactions (eds D. Rollinson & R. M. Anderson.),
pp. 77±89. Academic Press (for the Linnean Society),
London.
Hudson, P.J., Dobson, A.P. & Newborn, D. (1992) Do
parasites make prey vulnerable to predation? Red
grouse and parasites. Journal of Animal Ecology, 61,
681±692.
Jenkins, D., Watson, A. & Miller, G.R. (1963) Population
studies on red grouse, Lagopus lagopus scoticus (Lath.)
in north-east Scotland. Journal of Animal Ecology, 32,
317±376.
Jenkins, D., Watson, A. & Miller, G.R. (1964) Predation
and red grouse. Journal of Applied Ecology, 1, 183±
195.
Keith, L.B., Todd, A.W., Brand, C.J., Adamcik, R.S. &
Rusch, D.H. (1977) An analysis of predation during a
891S.M. Redpath &
S.J. Thirgood
# 1999 British
Ecological Society
Journal of Animal
Ecology,
68, 879±892
cyclic ¯uctuation of snowshoe hares. XIII International
Congress of Game Biologists, pp. 151±175. Atlanta.
Korpimaki, E. (1985) Rapid tracking of microtine popula-
tions by their avian predators: possible evidence for
stabilising predation. Oikos, 45, 281±284.
Korpimaki, E. & Norrdahl, K. (1989) Predation of
Tengmalm's Owls: numerical responses, functional
responses and dampening impact on population ¯uc-
tuations of microtines. Oikos, 54, 154±164.
Korpimaki, E. & Norrdahl, K. (1991) Numerical and func-
tional responses of kestrels, short-eared owls and long-
eared owls to vole densities. Ecology, 72, 814±826.
Korpimaki, E., Huhtala, K. & Sulkava, S. (1990) Does the
year-to-year variation in the diet of Eagle and Ural
Owls support the alternative prey hypothesis. Oikos,
58, 47±54.
Kurki, S., Helle, P., Linde n, H. & Nikula, A. (1997)
Breeding success of black grouse and capercaillie in
relation to mammalian predator densities on two spa-
tial scales. Oikos, 79, 301±310.
Linde n, H. & Wikman, M. (1983) Goshawk predation on
tetraonids: availability of prey and diet of the predator
in the breeding season. Journal of Animal Ecology, 52,
953±968.
Marquiss, M. (1980) Habitat and diet of male and female
Hen Harriers in Scotland in winter. British Birds, 73,
555±560.
Mearns, R. (1982) Winter occupation of breeding terri-
tories and winter diet of peregrines in south Scotland.
Ornis Scandinavica, 13, 79±83.
Moss, R. & Watson, A. (1985) Adaptive value of spacing
behaviour in population cycles of red grouse and other
animals. Behavioural Ecology. Ecological Consequences
of Adaptive Behaviour (eds R. M. Sibley & R.
H. Smith), pp. 275±294. Blackwell Scienti®c
Publications, Oxford.
Moss, R., Watson, A. & Parr, R. (1996) Experimental pre-
vention of a population cycle in red grouse. Ecology,
77, 1512±1530.
Mountford, M.D., Watson, A., Moss, R., Parr, R. &
Rothery, P. (1990) Land inheritance and population
cycles of red grouse. Red Grouse Population Processes
(eds A. N. Lance & J. H. Lawton), pp. 78±83. Royal
Society for the Protection of Birds, Sandy,
Bedfordshire.
Murdoch, W.W. & Oaten, A. (1975) Predation and popu-
lation stability. Advances in Ecological Research, 9, 1±
131.
Newton, I. (1979) The Population Ecology of Raptors.
Poyser Press, Berkhamsted.
Pech, R.P., Sinclair, A.R.E., Newsome, A.E. & Catling,
P.C. (1992) Limits to predator regulation of rabbits in
Australia: evidence from predator-removal experi-
ments. Oecologia, 89, 102±112.
Picozzi, N. (1978) Dispersion, breeding and prey of the hen
harrier (Circus cyaneus) in Glen Dye, Kincardineshire.
Ibis, 120, 489±509.
Ratcli�e, D.A. (1993) The Peregrine Falcon. T & AD
Poyser, Calton.
Redpath, S.M. (1989) The e�ect of hen harriers and other
predators on red grouse populations in Scotland. PhD
Thesis, Leeds University.
Redpath, S.M. (1991) The impact of hen harriers on red
grouse breeding success. Journal of Applied Ecology,
28, 659±671.
Redpath, S.M. (1992) Behavioural interactions between
hen harriers and their moorland prey. Ornis
Scandinavica, 23, 73±80.
Redpath, S.M. & Thirgood, S.J. (1997) Birds of Prey and
Red Grouse. HM Stationery O�ce, London
Redpath, C.J., Thirgood, S.J. & Redpath, S.M. (1995)
Evaluation of methods to estimate ®eld vole Microtus
agrestris abundance in upland habitats. Journal of
Zoology, 237, 49±57.
Redpath, S., Madders, M., Donnelly, E., Anderson, B.,
Thirgood, S.J., Martin, A. & McLeod, D. (1998) Nest
site selection by hen harriers in Scotland. Bird Study,
45, 51±61.
Reid, D., Krebs, C.J. & Kenney, A.J. (1997) Patterns of
predation on noncyclic lemmings. Ecological
Monographs, 67, 89±108.
Simmons, R.E. (1988) Food and the deceptive acquisition
of mates by polygynous male harriers. Behavioral
Ecology and Sociobiology, 23, 83±92.
Simmons, R.E., Barnard, P., MacWhirter, B. & Hanson,
G.L. (1986) The in¯uence of microtines on polygyny,
productivity, age, and provisioning of breeding
Northern Harriers: a 5-year study. Canadian Journal of
Zoology, 64, 2447±2456.
Solomon, M.E. (1949) The natural control of animal popu-
lations. Journal of Animal Ecology, 18, 1±35.
Thirgood, S.J., Leckie, F.M. & Redpath, S.M. (1995)
Diurnal and seasonal variation in line transect counts
of moorland passerines. Bird Study, 42, 257±259.
Watson, D. (1977) The Hen Harrier. Poyser Press,
Berkhamsted.
Watson, A. (1985) Social class, socially-induced loss,
recruitment and breeding of red grouse. Oecologia, 67,
493±498.
Weir, D. (1978) Wild peregrines and grouse. The Falconer,
7, 98±102.
Wikman, M. & Linde n, H. (1981) The in¯uence of food
supply on goshawk population size. Understanding the
Goshawk (eds R. E. Kenward & I. M. Lindsay), pp.
105±113. The International Association for Falconry
and Conservation of Birds of Prey, Oxford.
Williams, J. (1985) Statistical analysis of ¯uctuations in red
grouse bag data. Oecologia (Berlin), 65, 269±272.
Received 6 February 1998; revision received 2 December
1998
892Numerical and
functional
responses in
generalist
predators
# 1999 British
Ecological Society
Journal of Animal
Ecology,
68, 879±892